Embed Size (px)
Citation preview

81 Mosher Street Baltimore, MD 21217 Phone 410.728.2900 Fax 410.383.3270 Date: November 8, 2013 To: Mr. Greg Hwang, P.E., Capital Projects Manager
Montgomery County Department of Transportation (MCDOT) From: Jeff Parker, P.E., PTOE, RK&K B. J. Song, P.E., PTOE, RK&K Reference: Goldsboro Road Bicycle/Pedestrian Improvements Phase I Facility Planning Subject: Goldsboro Road (MD 614) and MacArthur Boulevard Intersection Improvement Feasibility Study DRAFT Introduction Montgomery County Department of Transportation (MCDOT) requested RK&K to conduct a study of the intersection of Goldsboro Road (MD 614) and MacArthur Boulevard, located north of the Town of Glen Echo. The purpose of the study is to evaluate alternative intersection configurations that will improve bicycle, pedestrian and vehicular operations and safety. The study is being performed as part of the Phase I Facility Planning Study for Goldsboro Road between MacArthur Boulevard and River Road (MD 190) which is evaluating the addition of sidewalks and bicycle lanes to enhance pedestrian and bicycle operations along the corridor. As part of the corridor study, RK&K evaluated pedestrian and bicycle crossings at the existing intersection. This traffic study includes capacity analyses for alternative intersection configuration options at Goldsboro Road and MacArthur Boulevard based on 2013 and 2035 traffic volumes.
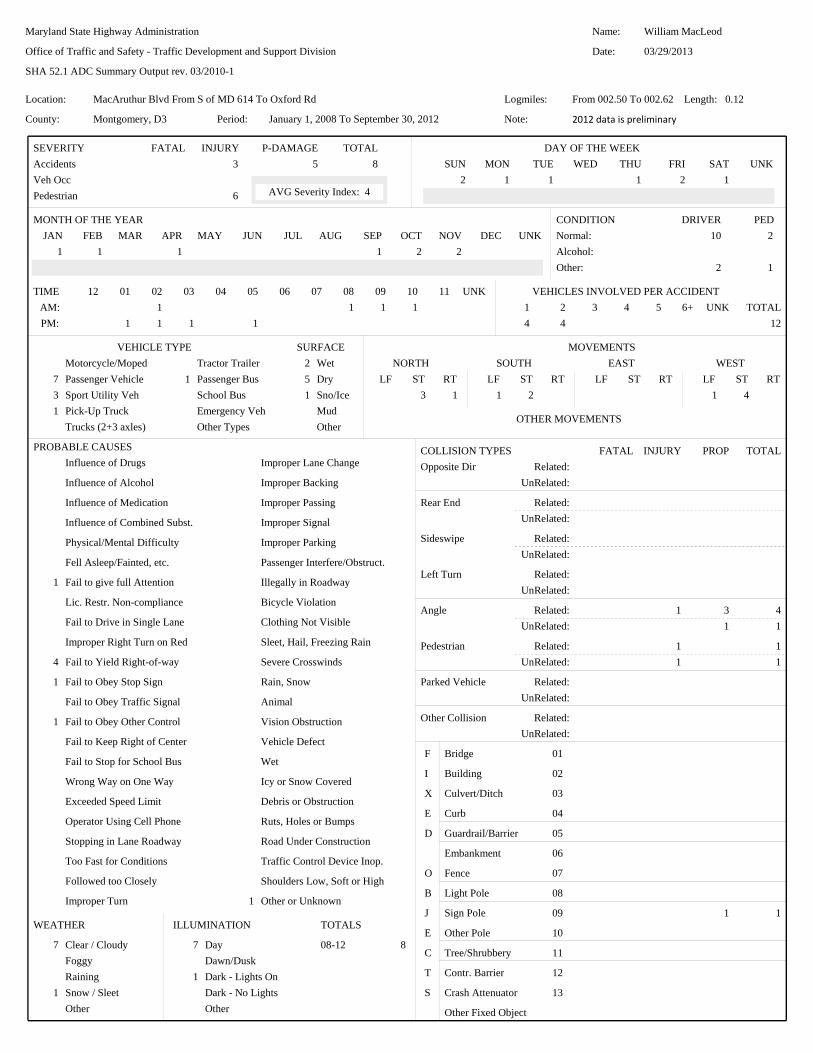
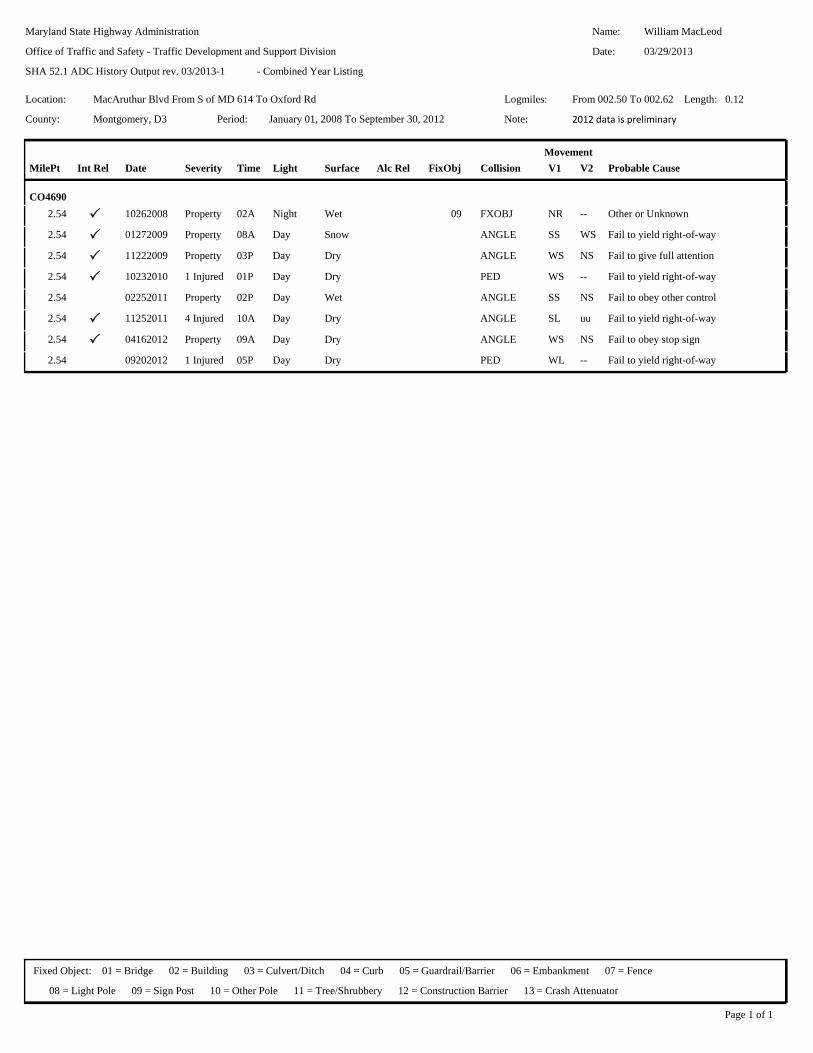
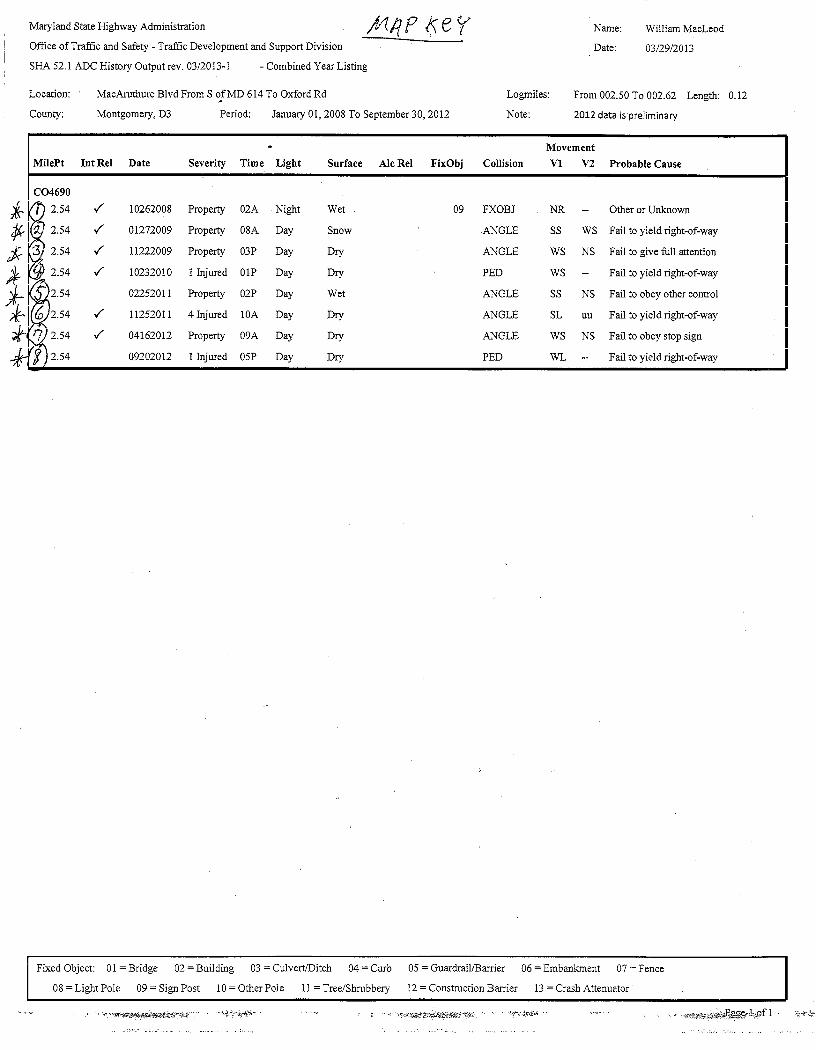
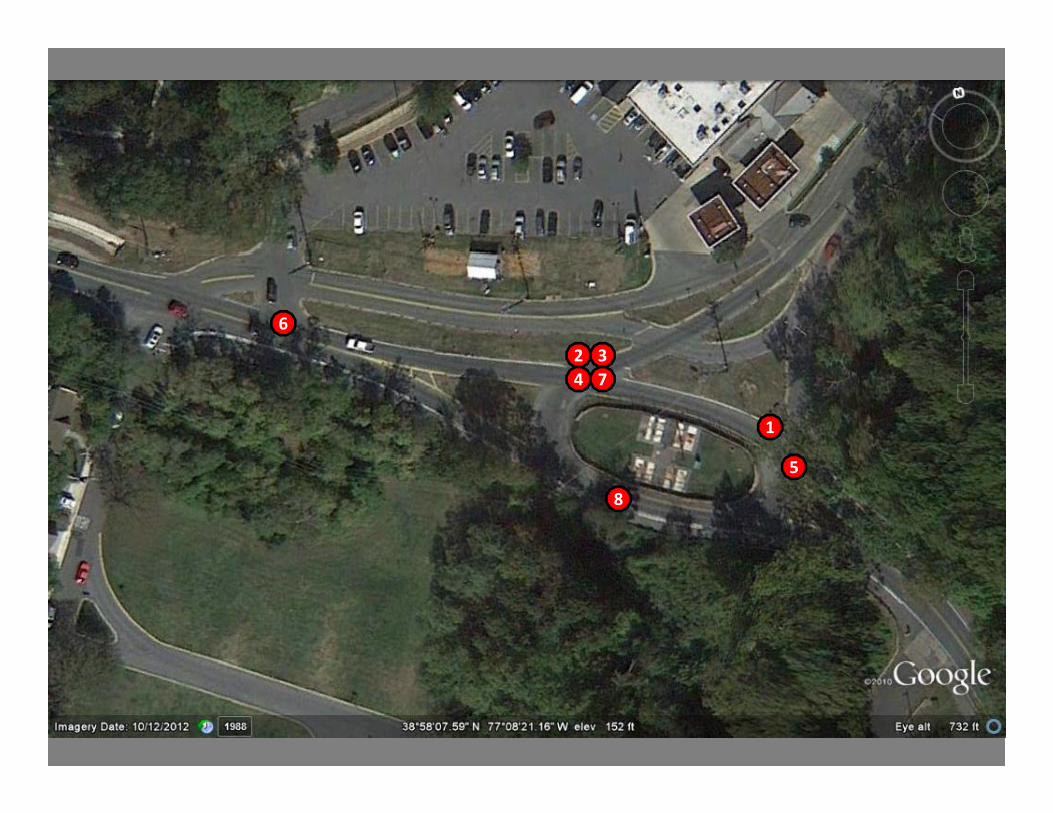
Recent Crash History The recent crash history at the Goldsboro Road/MacArthur Boulevard intersection was evaluated using data provided by the Maryland State Highway Administration. This data showed that, between January 1, 2008 through September 30, 2012, there were eight (8) crashes reported along the 630-foot long segment of MacArthur Boulevard extending from Oxford Road to just south of the traffic circle (including the traffic circle). Seven of these crashes occurred at the actual circle, while one took place at the shopping center access closer to Oxford Road. Of the seven crashes at the circle, two involved a vehicle colliding with a bicyclist. The crash near Oxford Road involved a vehicle striking multiple bicyclists. SHA officially classifies bicycle crashes as pedestrian crashes; however, additional detail provided by SHA indicated “pedestrian” crashes along this portion of MacArthur Boulevard each involved bicyclists, not pedestrians. Due to these bicycle crashes, the pedestrian crash rate (crashes per 100-million vehicle-miles traveled) along this segment of MacArthur Boulevard is significantly higher than the statewide average pedestrian crash rate for similar roadways. The crash data summary from SHA is attached following this memo.
Goldsboro Road and MacArthur Boulevard November 8, 2013 Intersection Improvement Feasibility Study DRAFT
2 | P a g e
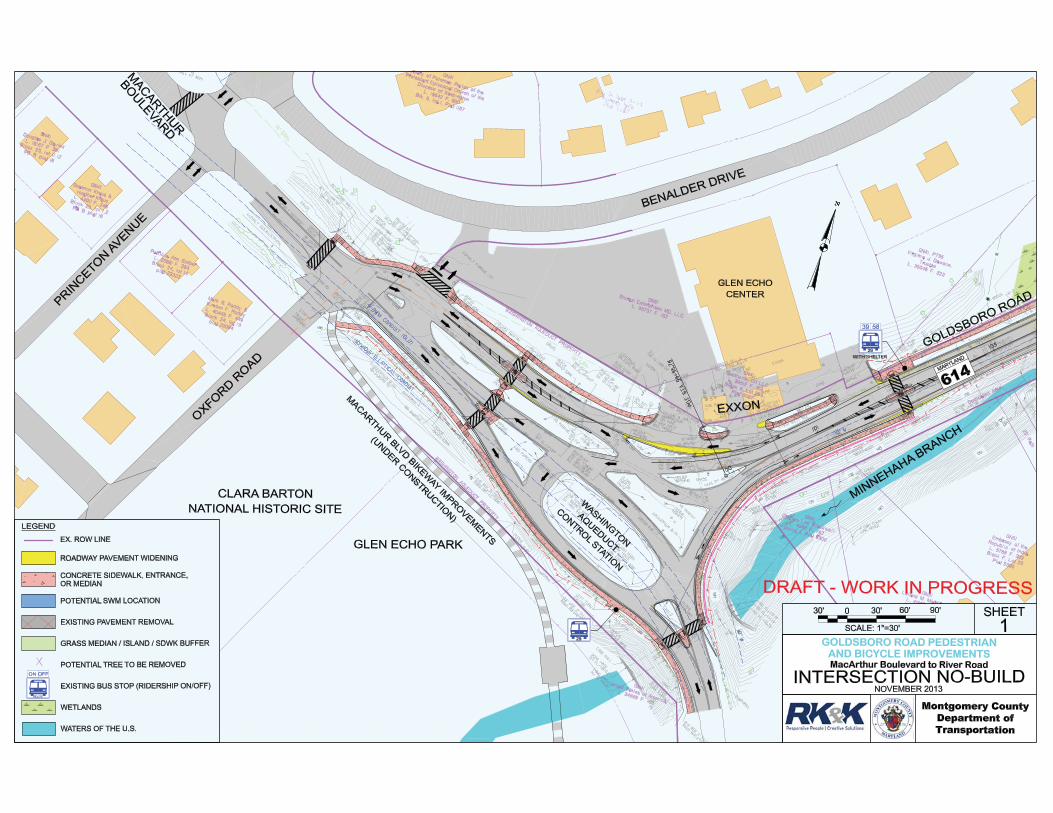
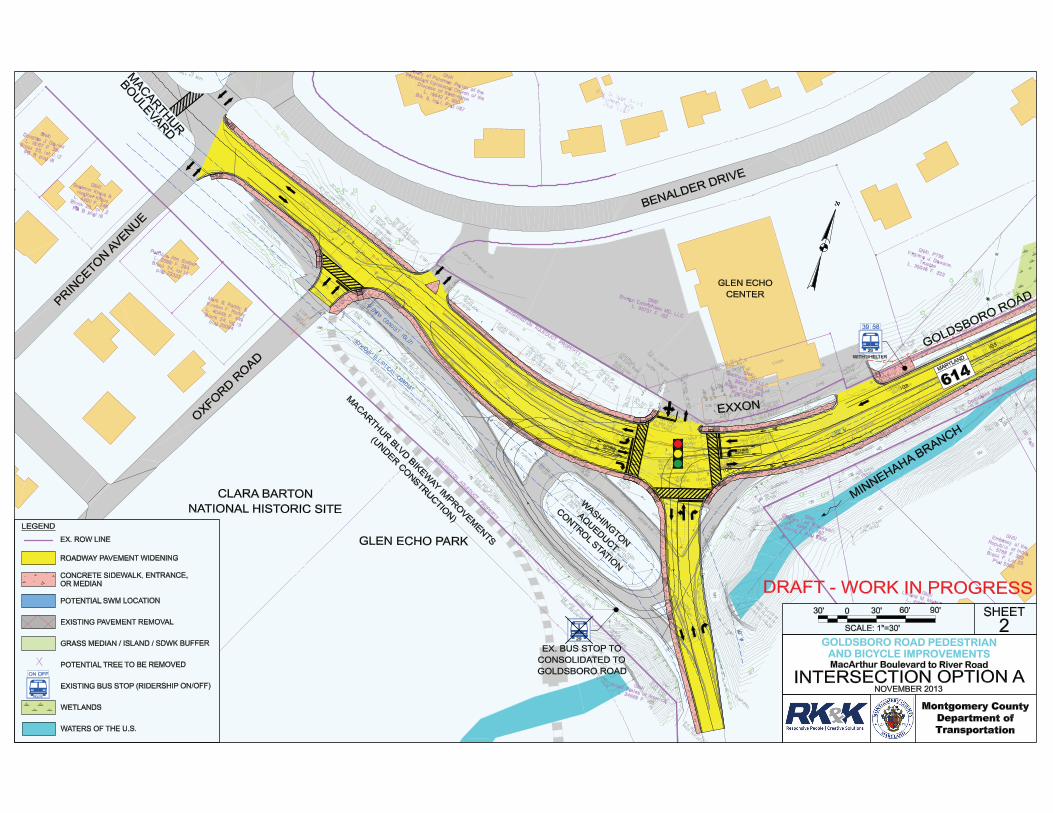
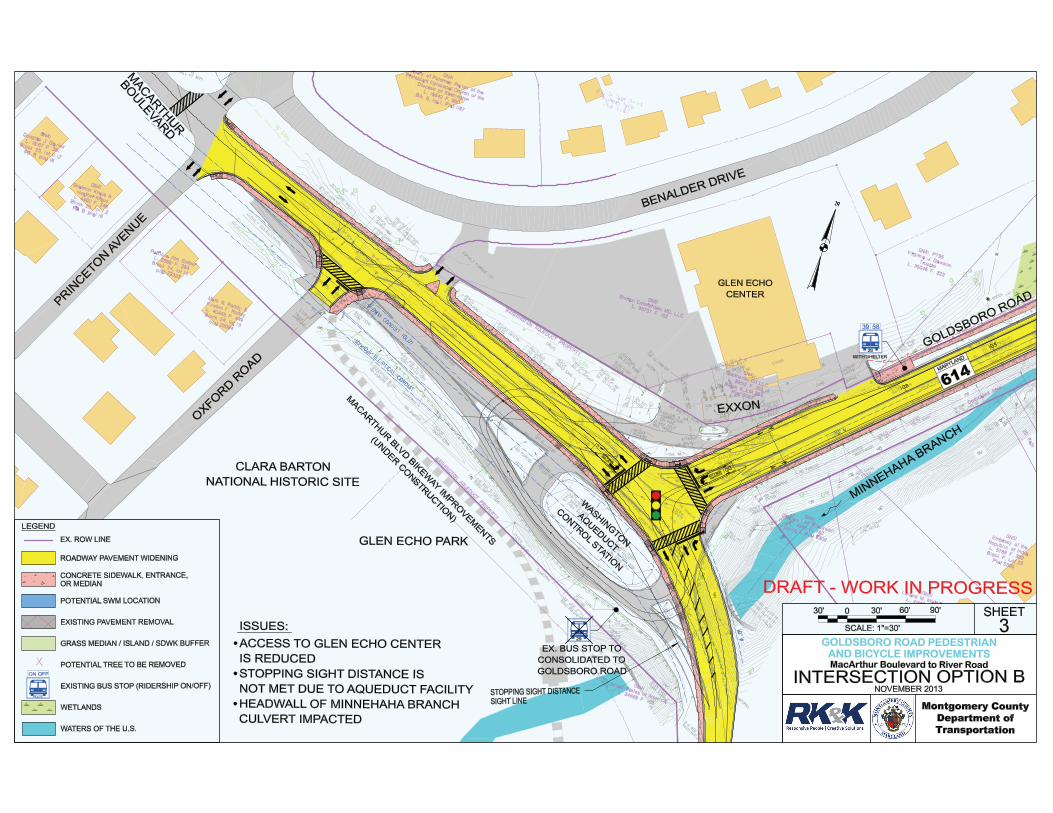
Intersection Alignment Concepts RK&K developed four options for the Goldsboro Road/MacArthur Blvd intersection:
• No-Build Option – Maintains the existing traffic circle and adds sidewalks and pedestrian crossings • Option A – Four-legged intersection • Option B – Traditional T-intersection • Option C – Three-legged Roundabout
Diagrams of each of these intersection options are attached following this memo. The operational analyses for each option are described in the next section.
Capacity Analysis The following is a list of the four intersection configuration options and the types of traffic control that was assumed for the operational analysis of each option:
• Existing/No-Build Option: STOP control on the westbound Goldsboro Road approach; traffic inside the circle must YIELD to traffic entering from northbound and southbound MacArthur Boulevard, which is uncontrolled
• Option A: Two-way STOP Control (TWSC), All-way STOP Control (AWSC), and Signalized • Option B: Signalized • Option C: Modern Roundabout (i.e., entering traffic must YIELD to all circulating traffic)
The software package SYNCHRO / SimTraffic (version 8) was used to perform capacity analyses for the No-Build option and Options A and B. The methodology specified in the Year 2010 edition of the Highway Capacity Manual (HCM) was applied using Synchro to calculate delay and level of service (LOS) for Options A and B. The software SIDRA (version 6) was used to perform capacity analyses for Option C (Roundabout).
The Year 2013 volume served as the base volume and the Year 2035 volume was projected by applying a 7% total growth factor to the Year 2013 volume. This growth factor was calculated using the Metropolitan Washington Council of Governments (COG) regional travel demand model. Each intersection improvement option was analyzed using both the Year 2013 volume and the Year 2035 volume. For the purpose of this study, LOS D is considered to be the worst-acceptable level of service for any specific movement or approach, or for the overall intersection.
Existing/No-Build Option
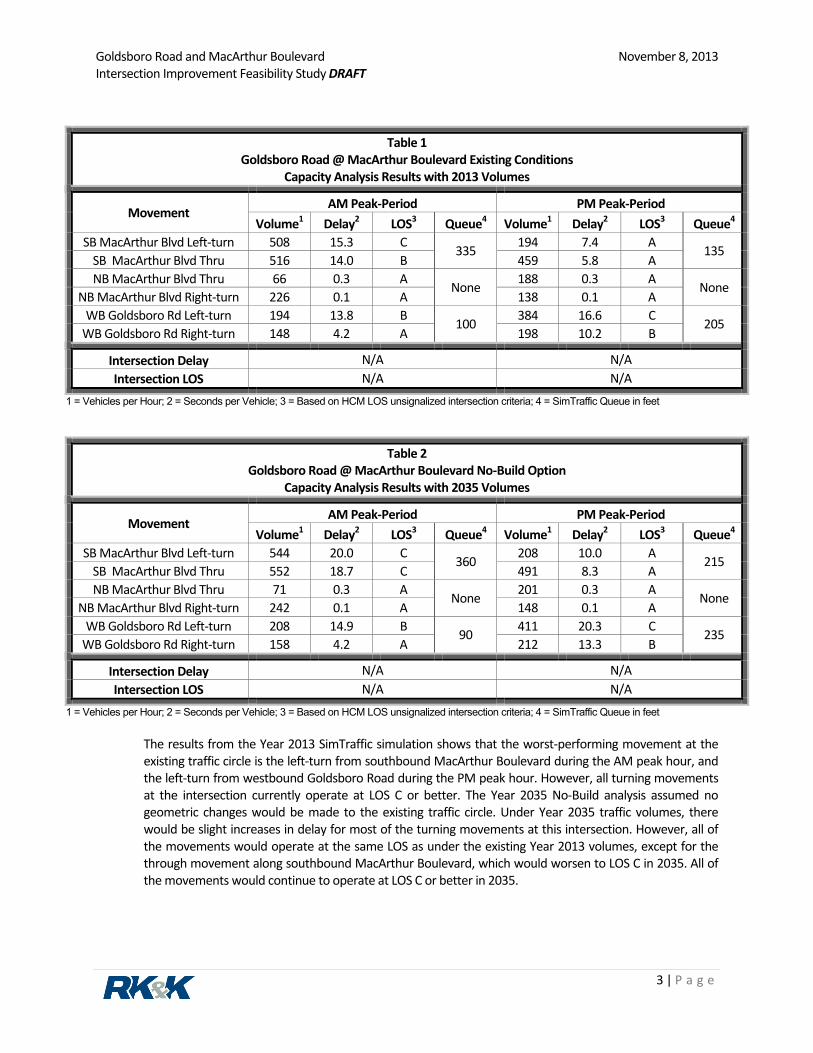
For the existing conditions and the No-Build option, traffic approaching the traffic circle along westbound Goldsboro Road must STOP prior to entering the circle. Traffic in the circle must YIELD to traffic entering from northbound and southbound MacArthur Boulevard. Traffic entering the circle from northbound or southbound MacArthur Boulevard is uncontrolled and is not required to stop or yield to any other traffic movement at this intersection. Due to the unconventional configuration and traffic control scheme at this circle, traffic operations were evaluated for 2013 (Existing) and 2035 (No-Build) using SimTraffic. Table 1 shows the SimTraffic results using Year 2013 volumes, and Table 2 shows the SimTraffic results using Year 2035 volumes.
Goldsboro Road and MacArthur Boulevard November 8, 2013 Intersection Improvement Feasibility Study DRAFT
3 | P a g e
Table 1 Goldsboro Road @ MacArthur Boulevard Existing Conditions
Capacity Analysis Results with 2013 Volumes
Movement AM Peak-Period PM Peak-Period
Volume1 Delay2 LOS3 Queue4 Volume1 Delay2 LOS3 Queue4
SB MacArthur Blvd Left-turn 508 15.3 C 335 194 7.4 A 135 SB MacArthur Blvd Thru 516 14.0 B 459 5.8 A NB MacArthur Blvd Thru 66 0.3 A None 188 0.3 A None
NB MacArthur Blvd Right-turn 226 0.1 A 138 0.1 A WB Goldsboro Rd Left-turn 194 13.8 B 100 384 16.6 C 205
WB Goldsboro Rd Right-turn 148 4.2 A 198 10.2 B
Intersection Delay N/A N/A Intersection LOS N/A N/A
1 = Vehicles per Hour; 2 = Seconds per Vehicle; 3 = Based on HCM LOS unsignalized intersection criteria; 4 = SimTraffic Queue in feet
Table 2 Goldsboro Road @ MacArthur Boulevard No-Build Option
Capacity Analysis Results with 2035 Volumes
Movement AM Peak-Period PM Peak-Period
Volume1 Delay2 LOS3 Queue4 Volume1 Delay2 LOS3 Queue4
SB MacArthur Blvd Left-turn 544 20.0 C 360 208 10.0 A 215 SB MacArthur Blvd Thru 552 18.7 C 491 8.3 A NB MacArthur Blvd Thru 71 0.3 A None 201 0.3 A None
NB MacArthur Blvd Right-turn 242 0.1 A 148 0.1 A WB Goldsboro Rd Left-turn 208 14.9 B 90 411 20.3 C 235
WB Goldsboro Rd Right-turn 158 4.2 A 212 13.3 B
Intersection Delay N/A N/A Intersection LOS N/A N/A
1 = Vehicles per Hour; 2 = Seconds per Vehicle; 3 = Based on HCM LOS unsignalized intersection criteria; 4 = SimTraffic Queue in feet The results from the Year 2013 SimTraffic simulation shows that the worst-performing movement at the existing traffic circle is the left-turn from southbound MacArthur Boulevard during the AM peak hour, and the left-turn from westbound Goldsboro Road during the PM peak hour. However, all turning movements at the intersection currently operate at LOS C or better. The Year 2035 No-Build analysis assumed no geometric changes would be made to the existing traffic circle. Under Year 2035 traffic volumes, there would be slight increases in delay for most of the turning movements at this intersection. However, all of the movements would operate at the same LOS as under the existing Year 2013 volumes, except for the through movement along southbound MacArthur Boulevard, which would worsen to LOS C in 2035. All of the movements would continue to operate at LOS C or better in 2035.
Goldsboro Road and MacArthur Boulevard November 8, 2013 Intersection Improvement Feasibility Study DRAFT
4 | P a g e
Option A with Two-Way STOP control
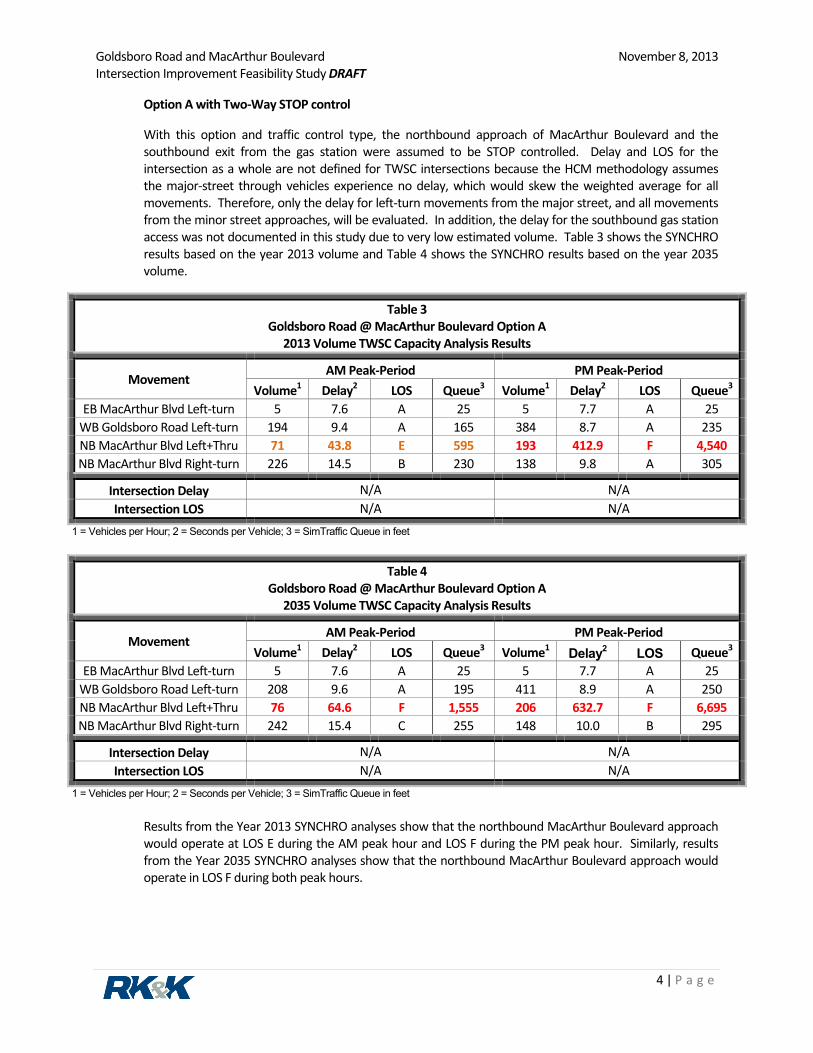
With this option and traffic control type, the northbound approach of MacArthur Boulevard and the southbound exit from the gas station were assumed to be STOP controlled. Delay and LOS for the intersection as a whole are not defined for TWSC intersections because the HCM methodology assumes the major-street through vehicles experience no delay, which would skew the weighted average for all movements. Therefore, only the delay for left-turn movements from the major street, and all movements from the minor street approaches, will be evaluated. In addition, the delay for the southbound gas station access was not documented in this study due to very low estimated volume. Table 3 shows the SYNCHRO results based on the year 2013 volume and Table 4 shows the SYNCHRO results based on the year 2035 volume.
Table 3 Goldsboro Road @ MacArthur Boulevard Option A
2013 Volume TWSC Capacity Analysis Results
Movement AM Peak-Period PM Peak-Period
Volume1 Delay2 LOS Queue3 Volume1 Delay2 LOS Queue3
EB MacArthur Blvd Left-turn 5 7.6 A 25 5 7.7 A 25 WB Goldsboro Road Left-turn 194 9.4 A 165 384 8.7 A 235 NB MacArthur Blvd Left+Thru 71 43.8 E 595 193 412.9 F 4,540 NB MacArthur Blvd Right-turn 226 14.5 B 230 138 9.8 A 305
Intersection Delay N/A N/A Intersection LOS N/A N/A
1 = Vehicles per Hour; 2 = Seconds per Vehicle; 3 = SimTraffic Queue in feet
Table 4 Goldsboro Road @ MacArthur Boulevard Option A
2035 Volume TWSC Capacity Analysis Results
Movement AM Peak-Period PM Peak-Period
Volume1 Delay2 LOS Queue3 Volume1 Delay2 LOS Queue3
EB MacArthur Blvd Left-turn 5 7.6 A 25 5 7.7 A 25 WB Goldsboro Road Left-turn 208 9.6 A 195 411 8.9 A 250 NB MacArthur Blvd Left+Thru 76 64.6 F 1,555 206 632.7 F 6,695 NB MacArthur Blvd Right-turn 242 15.4 C 255 148 10.0 B 295
Intersection Delay N/A N/A Intersection LOS N/A N/A
1 = Vehicles per Hour; 2 = Seconds per Vehicle; 3 = SimTraffic Queue in feet
Results from the Year 2013 SYNCHRO analyses show that the northbound MacArthur Boulevard approach would operate at LOS E during the AM peak hour and LOS F during the PM peak hour. Similarly, results from the Year 2035 SYNCHRO analyses show that the northbound MacArthur Boulevard approach would operate in LOS F during both peak hours.
Goldsboro Road and MacArthur Boulevard November 8, 2013 Intersection Improvement Feasibility Study DRAFT
5 | P a g e
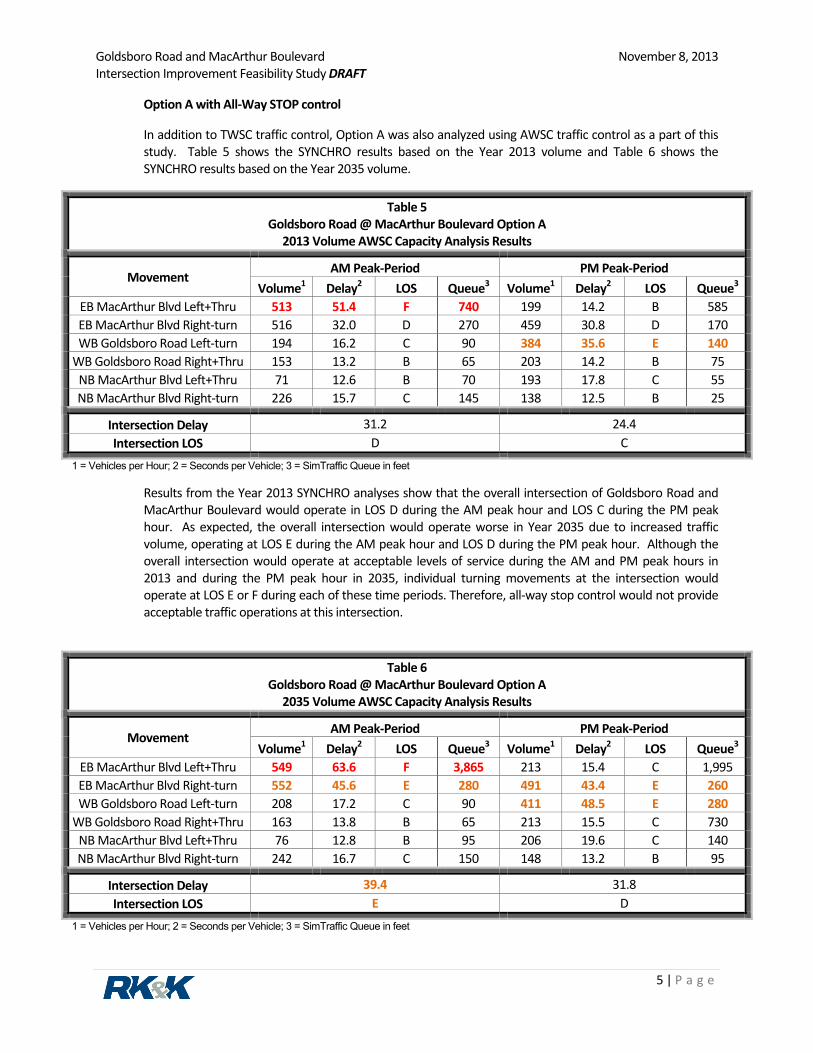
Option A with All-Way STOP control
In addition to TWSC traffic control, Option A was also analyzed using AWSC traffic control as a part of this study. Table 5 shows the SYNCHRO results based on the Year 2013 volume and Table 6 shows the SYNCHRO results based on the Year 2035 volume.
Table 5 Goldsboro Road @ MacArthur Boulevard Option A
2013 Volume AWSC Capacity Analysis Results
Movement AM Peak-Period PM Peak-Period
Volume1 Delay2 LOS Queue3 Volume1 Delay2 LOS Queue3
EB MacArthur Blvd Left+Thru 513 51.4 F 740 199 14.2 B 585 EB MacArthur Blvd Right-turn 516 32.0 D 270 459 30.8 D 170 WB Goldsboro Road Left-turn 194 16.2 C 90 384 35.6 E 140
WB Goldsboro Road Right+Thru 153 13.2 B 65 203 14.2 B 75 NB MacArthur Blvd Left+Thru 71 12.6 B 70 193 17.8 C 55 NB MacArthur Blvd Right-turn 226 15.7 C 145 138 12.5 B 25
Intersection Delay 31.2 24.4 Intersection LOS D C
1 = Vehicles per Hour; 2 = Seconds per Vehicle; 3 = SimTraffic Queue in feet
Results from the Year 2013 SYNCHRO analyses show that the overall intersection of Goldsboro Road and MacArthur Boulevard would operate in LOS D during the AM peak hour and LOS C during the PM peak hour. As expected, the overall intersection would operate worse in Year 2035 due to increased traffic volume, operating at LOS E during the AM peak hour and LOS D during the PM peak hour. Although the overall intersection would operate at acceptable levels of service during the AM and PM peak hours in 2013 and during the PM peak hour in 2035, individual turning movements at the intersection would operate at LOS E or F during each of these time periods. Therefore, all-way stop control would not provide acceptable traffic operations at this intersection.
Table 6 Goldsboro Road @ MacArthur Boulevard Option A
2035 Volume AWSC Capacity Analysis Results
Movement AM Peak-Period PM Peak-Period
Volume1 Delay2 LOS Queue3 Volume1 Delay2 LOS Queue3
EB MacArthur Blvd Left+Thru 549 63.6 F 3,865 213 15.4 C 1,995 EB MacArthur Blvd Right-turn 552 45.6 E 280 491 43.4 E 260 WB Goldsboro Road Left-turn 208 17.2 C 90 411 48.5 E 280
WB Goldsboro Road Right+Thru 163 13.8 B 65 213 15.5 C 730 NB MacArthur Blvd Left+Thru 76 12.8 B 95 206 19.6 C 140 NB MacArthur Blvd Right-turn 242 16.7 C 150 148 13.2 B 95
Intersection Delay 39.4 31.8 Intersection LOS E D
1 = Vehicles per Hour; 2 = Seconds per Vehicle; 3 = SimTraffic Queue in feet

Goldsboro Road and MacArthur Boulevard November 8, 2013 Intersection Improvement Feasibility Study DRAFT
6 | P a g e
Option A with Traffic Signal Control
An MUTCD traffic signal warrant analysis was completed using the Year 2013 volumes, and the results indicated that a traffic signal is currently warranted at the intersection of Goldsboro Road and MacArthur Boulevard. Accordingly, capacity analysis assuming a three-phase signal was evaluated at the intersection for Option A. Table 7 shows the capacity results based on the Year 2013 volume and Table 8 shows the capacity results based on the Year 2035 volume.
Table 7 Goldsboro Road @ MacArthur Boulevard Option A
2013 Volume Traffic Signal Capacity Analysis Results
Movement AM Peak-Period PM Peak-Period
Volume1 Delay2 LOS Queue3 Volume1 Delay2 LOS Queue3
EB MacArthur Blvd Left+Thru 513 14.3 B 260 199 14.5 B 115 EB MacArthur Blvd Right-turn 516 18.2 B 220 459 23.6 C 165 WB Goldsboro Road Left-turn 194 11.1 B 120 384 23.9 C 230
WB Goldsboro Road Right+Thru 153 4.7 A 55 203 8.1 A 235 NB MacArthur Blvd Left+Thru 71 22.8 C 90 193 36.9 D 180 NB MacArthur Blvd Right-turn 226 32.6 C 145 138 21.4 C 110
Intersection Delay 17.1 22.0 Intersection LOS B C
1 = Vehicles per Hour; 2 = Seconds per Vehicle; 3 = SimTraffic Queue in feet
Table 8 Goldsboro Road @ MacArthur Boulevard Option A
2035 Volume Traffic Signal Capacity Analysis Results
Movement AM Peak-Period PM Peak-Period
Volume1 Delay2 LOS Queue3 Volume1 Delay2 LOS Queue3
EB MacArthur Blvd Left+Thru 549 16.0 B 335 213 14.7 B 145 EB MacArthur Blvd Right-turn 552 21.7 C 245 491 25.6 C 195 WB Goldsboro Road Left-turn 208 13.9 B 155 411 32.5 C 240
WB Goldsboro Road Right+Thru 163 5.0 A 75 213 8.2 A 290 NB MacArthur Blvd Left+Thru 76 22.6 C 105 206 40.7 D 195 NB MacArthur Blvd Right-turn 242 32.7 C 160 148 21.6 C 120
Intersection Delay 19.1 25.2 Intersection LOS B C
1 = Vehicles per Hour; 2 = Seconds per Vehicle; 3 = SimTraffic Queue in feet
Results from the Year 2013 and 2035 SYNCHRO analyses show that Option A would operate at LOS B during the AM peak hour and LOS C during the PM peak hour with traffic signal control. Furthermore, the individual turning movements at the intersection would all operate at LOS D or better in 2013 and 2035, which is considered to be acceptable.
Goldsboro Road and MacArthur Boulevard November 8, 2013 Intersection Improvement Feasibility Study DRAFT
7 | P a g e
Option B with Traffic Signal Control
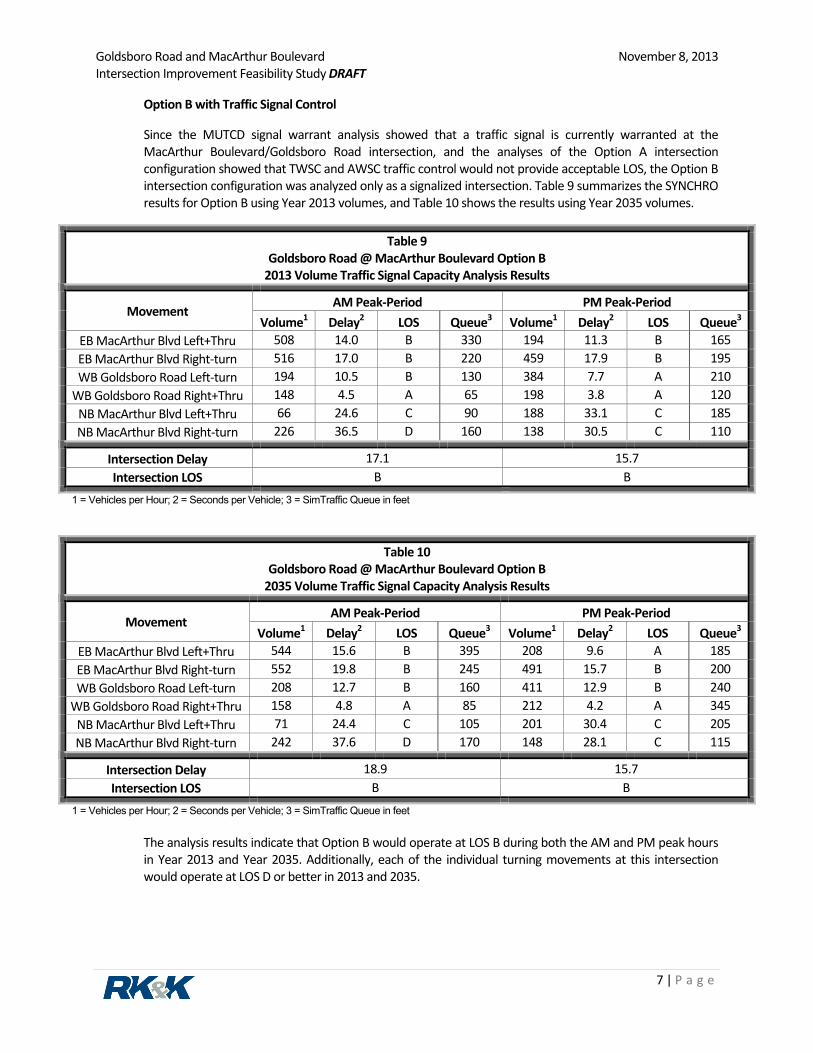
Since the MUTCD signal warrant analysis showed that a traffic signal is currently warranted at the MacArthur Boulevard/Goldsboro Road intersection, and the analyses of the Option A intersection configuration showed that TWSC and AWSC traffic control would not provide acceptable LOS, the Option B intersection configuration was analyzed only as a signalized intersection. Table 9 summarizes the SYNCHRO results for Option B using Year 2013 volumes, and Table 10 shows the results using Year 2035 volumes.
Table 9 Goldsboro Road @ MacArthur Boulevard Option B
2013 Volume Traffic Signal Capacity Analysis Results
Movement AM Peak-Period PM Peak-Period
Volume1 Delay2 LOS Queue3 Volume1 Delay2 LOS Queue3
EB MacArthur Blvd Left+Thru 508 14.0 B 330 194 11.3 B 165 EB MacArthur Blvd Right-turn 516 17.0 B 220 459 17.9 B 195 WB Goldsboro Road Left-turn 194 10.5 B 130 384 7.7 A 210
WB Goldsboro Road Right+Thru 148 4.5 A 65 198 3.8 A 120 NB MacArthur Blvd Left+Thru 66 24.6 C 90 188 33.1 C 185 NB MacArthur Blvd Right-turn 226 36.5 D 160 138 30.5 C 110
Intersection Delay 17.1 15.7 Intersection LOS B B
1 = Vehicles per Hour; 2 = Seconds per Vehicle; 3 = SimTraffic Queue in feet
Table 10 Goldsboro Road @ MacArthur Boulevard Option B
2035 Volume Traffic Signal Capacity Analysis Results
Movement AM Peak-Period PM Peak-Period
Volume1 Delay2 LOS Queue3 Volume1 Delay2 LOS Queue3
EB MacArthur Blvd Left+Thru 544 15.6 B 395 208 9.6 A 185 EB MacArthur Blvd Right-turn 552 19.8 B 245 491 15.7 B 200 WB Goldsboro Road Left-turn 208 12.7 B 160 411 12.9 B 240
WB Goldsboro Road Right+Thru 158 4.8 A 85 212 4.2 A 345 NB MacArthur Blvd Left+Thru 71 24.4 C 105 201 30.4 C 205 NB MacArthur Blvd Right-turn 242 37.6 D 170 148 28.1 C 115
Intersection Delay 18.9 15.7 Intersection LOS B B
1 = Vehicles per Hour; 2 = Seconds per Vehicle; 3 = SimTraffic Queue in feet The analysis results indicate that Option B would operate at LOS B during both the AM and PM peak hours in Year 2013 and Year 2035. Additionally, each of the individual turning movements at this intersection would operate at LOS D or better in 2013 and 2035.

Goldsboro Road and MacArthur Boulevard November 8, 2013 Intersection Improvement Feasibility Study DRAFT
8 | P a g e
Option C
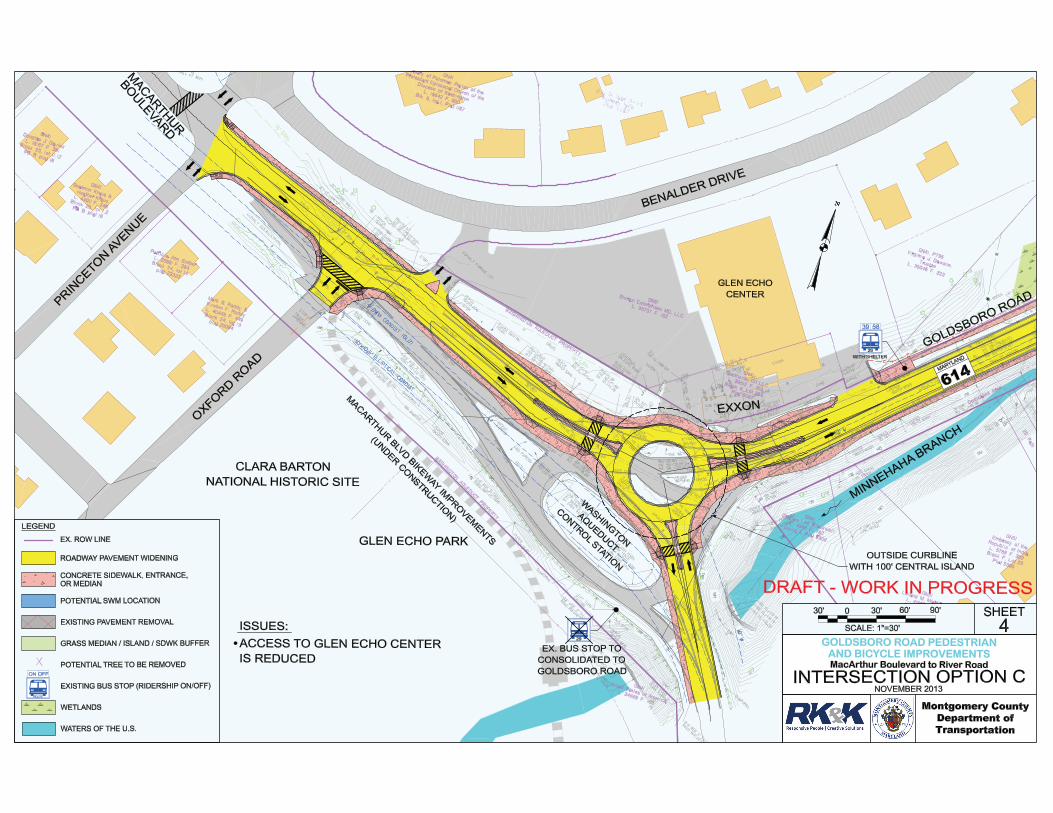
Option C consists of a single-lane roundabout at the intersection of Goldsboro Road and MacArthur Boulevard, with a 68-foot central island diameter, 16-foot circulating lane width, and 90-foot entry radius and 30-degree entry angle. For this option, the entrances to the gas station would be relocated further east and west of the intersection, resulting in a three-legged intersection. Table 11 shows the SIDRA capacity results based on the Year 2013 volume and Table 12 shows the results based on the Year 2035 volume for the single-lane roundabout.
Table 11 Goldsboro Road @ MacArthur Boulevard Option C
2013 Volume SIDRA Single-Lane Roundabout Capacity Results
AM Peak-Hour PM Peak-Hour Movement Volume1 Delay2 LOS Queue3 Volume1 Delay2 LOS Queue3
EB MacArthur Blvd Through 516 74.3 E 1,555
194 17.8 B 260
EB MacArthur Blvd Right-turn 508 74.3 459 17.8 WB Goldsboro Road Left-turn 194 6.2 A 65 198 13.9 B 175 WB Goldsboro Road Through 148 6.2 384 13.9 NB MacArthur Blvd Left-turn 66 15.6 B 115 188 8.8 A 75
NB MacArthur Blvd Right-turn 226 15.6 138 8.8
Intersection Delay 49.9 14.5 Intersection LOS D B
1 = Vehicles per Hour; 2 = Seconds per Vehicle; 3 = SIDRA Queue in feet
Table 12 Goldsboro Road @ MacArthur Boulevard Option C
2035 Volume SIDRA Single-Lane Roundabout Capacity Results
AM Peak-Hour PM Peak-Hour Movement Volume1 Delay2 LOS Queue3 Volume1 Delay2 LOS Queue3
EB MacArthur Blvd Through 544 110.2 F 2,215 208 22.5 C 355 EB MacArthur Blvd Right-turn 552 110.2 491 22.5 WB Goldsboro Road Left-turn 208 6.5 A 70 212 16.3 B 225 WB Goldsboro Road Through 158 6.5 411 16.3 NB MacArthur Blvd Left-turn 71 16.4 B 125 201 9.6 A 85
NB MacArthur Blvd Right-turn 237 16.4 148 9.6
Intersection Delay 72.3 17.5 Intersection LOS F B
1 = Vehicles per Hour; 2 = Seconds per Vehicle; 3 = SIDRA Queue in feet Results from the Year 2013 volume SIDRA analyses of the single-lane roundabout indicated that the overall roundabout would operate at LOS D and LOS B during the AM and the PM peak hours, respectively. However, the eastbound MacArthur Boulevard approach would operate at LOS E during the AM peak hour in 2013. In addition, Results from the Year 2035 volume SIDRA analyses indicated that the overall roundabout would operate at LOS F and LOS B during the AM and the PM peak hours, respectively.
Goldsboro Road and MacArthur Boulevard November 8, 2013 Intersection Improvement Feasibility Study DRAFT
9 | P a g e
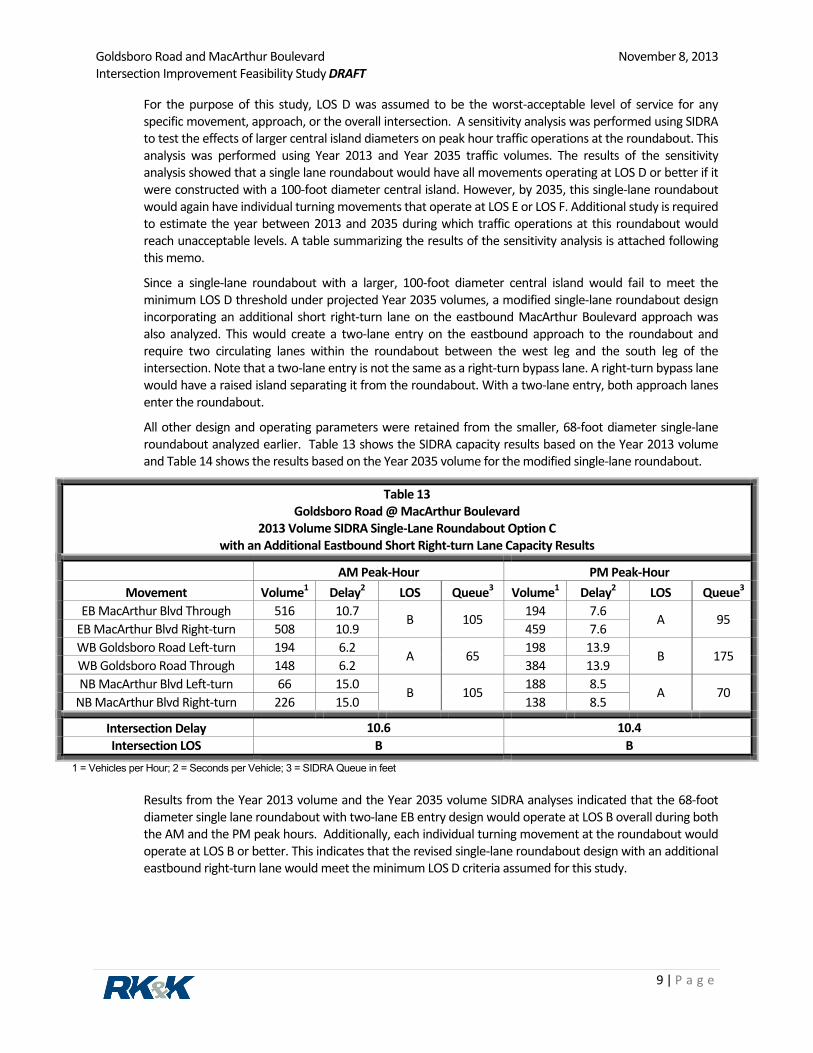
For the purpose of this study, LOS D was assumed to be the worst-acceptable level of service for any specific movement, approach, or the overall intersection. A sensitivity analysis was performed using SIDRA to test the effects of larger central island diameters on peak hour traffic operations at the roundabout. This analysis was performed using Year 2013 and Year 2035 traffic volumes. The results of the sensitivity analysis showed that a single lane roundabout would have all movements operating at LOS D or better if it were constructed with a 100-foot diameter central island. However, by 2035, this single-lane roundabout would again have individual turning movements that operate at LOS E or LOS F. Additional study is required to estimate the year between 2013 and 2035 during which traffic operations at this roundabout would reach unacceptable levels. A table summarizing the results of the sensitivity analysis is attached following this memo.
Since a single-lane roundabout with a larger, 100-foot diameter central island would fail to meet the minimum LOS D threshold under projected Year 2035 volumes, a modified single-lane roundabout design incorporating an additional short right-turn lane on the eastbound MacArthur Boulevard approach was also analyzed. This would create a two-lane entry on the eastbound approach to the roundabout and require two circulating lanes within the roundabout between the west leg and the south leg of the intersection. Note that a two-lane entry is not the same as a right-turn bypass lane. A right-turn bypass lane would have a raised island separating it from the roundabout. With a two-lane entry, both approach lanes enter the roundabout.
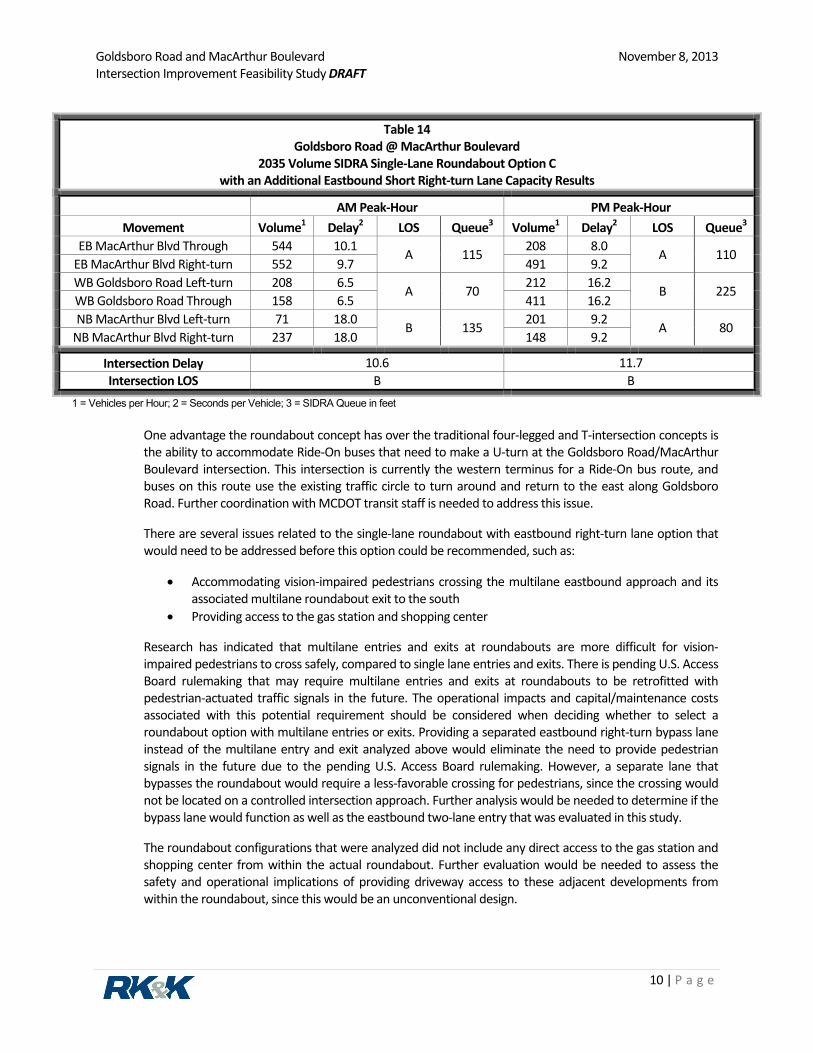
All other design and operating parameters were retained from the smaller, 68-foot diameter single-lane roundabout analyzed earlier. Table 13 shows the SIDRA capacity results based on the Year 2013 volume and Table 14 shows the results based on the Year 2035 volume for the modified single-lane roundabout.
Table 13 Goldsboro Road @ MacArthur Boulevard
2013 Volume SIDRA Single-Lane Roundabout Option C with an Additional Eastbound Short Right-turn Lane Capacity Results
AM Peak-Hour PM Peak-Hour Movement Volume1 Delay2 LOS Queue3 Volume1 Delay2 LOS Queue3
EB MacArthur Blvd Through 516 10.7 B 105 194 7.6 A 95 EB MacArthur Blvd Right-turn 508 10.9 459 7.6 WB Goldsboro Road Left-turn 194 6.2 A 65 198 13.9 B 175 WB Goldsboro Road Through 148 6.2 384 13.9 NB MacArthur Blvd Left-turn 66 15.0 B 105 188 8.5 A 70
NB MacArthur Blvd Right-turn 226 15.0 138 8.5
Intersection Delay 10.6 10.4 Intersection LOS B B
1 = Vehicles per Hour; 2 = Seconds per Vehicle; 3 = SIDRA Queue in feet
Results from the Year 2013 volume and the Year 2035 volume SIDRA analyses indicated that the 68-foot diameter single lane roundabout with two-lane EB entry design would operate at LOS B overall during both the AM and the PM peak hours. Additionally, each individual turning movement at the roundabout would operate at LOS B or better. This indicates that the revised single-lane roundabout design with an additional eastbound right-turn lane would meet the minimum LOS D criteria assumed for this study.
Goldsboro Road and MacArthur Boulevard November 8, 2013 Intersection Improvement Feasibility Study DRAFT
10 | P a g e
Table 14 Goldsboro Road @ MacArthur Boulevard
2035 Volume SIDRA Single-Lane Roundabout Option C with an Additional Eastbound Short Right-turn Lane Capacity Results
AM Peak-Hour PM Peak-Hour Movement Volume1 Delay2 LOS Queue3 Volume1 Delay2 LOS Queue3
EB MacArthur Blvd Through 544 10.1 A 115 208 8.0 A 110 EB MacArthur Blvd Right-turn 552 9.7 491 9.2 WB Goldsboro Road Left-turn 208 6.5 A 70 212 16.2 B 225 WB Goldsboro Road Through 158 6.5 411 16.2 NB MacArthur Blvd Left-turn 71 18.0 B 135 201 9.2 A 80
NB MacArthur Blvd Right-turn 237 18.0 148 9.2
Intersection Delay 10.6 11.7 Intersection LOS B B
1 = Vehicles per Hour; 2 = Seconds per Vehicle; 3 = SIDRA Queue in feet One advantage the roundabout concept has over the traditional four-legged and T-intersection concepts is the ability to accommodate Ride-On buses that need to make a U-turn at the Goldsboro Road/MacArthur Boulevard intersection. This intersection is currently the western terminus for a Ride-On bus route, and buses on this route use the existing traffic circle to turn around and return to the east along Goldsboro Road. Further coordination with MCDOT transit staff is needed to address this issue.
There are several issues related to the single-lane roundabout with eastbound right-turn lane option that would need to be addressed before this option could be recommended, such as:
• Accommodating vision-impaired pedestrians crossing the multilane eastbound approach and its associated multilane roundabout exit to the south
• Providing access to the gas station and shopping center
Research has indicated that multilane entries and exits at roundabouts are more difficult for vision-impaired pedestrians to cross safely, compared to single lane entries and exits. There is pending U.S. Access Board rulemaking that may require multilane entries and exits at roundabouts to be retrofitted with pedestrian-actuated traffic signals in the future. The operational impacts and capital/maintenance costs associated with this potential requirement should be considered when deciding whether to select a roundabout option with multilane entries or exits. Providing a separated eastbound right-turn bypass lane instead of the multilane entry and exit analyzed above would eliminate the need to provide pedestrian signals in the future due to the pending U.S. Access Board rulemaking. However, a separate lane that bypasses the roundabout would require a less-favorable crossing for pedestrians, since the crossing would not be located on a controlled intersection approach. Further analysis would be needed to determine if the bypass lane would function as well as the eastbound two-lane entry that was evaluated in this study.
The roundabout configurations that were analyzed did not include any direct access to the gas station and shopping center from within the actual roundabout. Further evaluation would be needed to assess the safety and operational implications of providing driveway access to these adjacent developments from within the roundabout, since this would be an unconventional design.
Goldsboro Road and MacArthur Boulevard November 8, 2013 Intersection Improvement Feasibility Study DRAFT
11 | P a g e
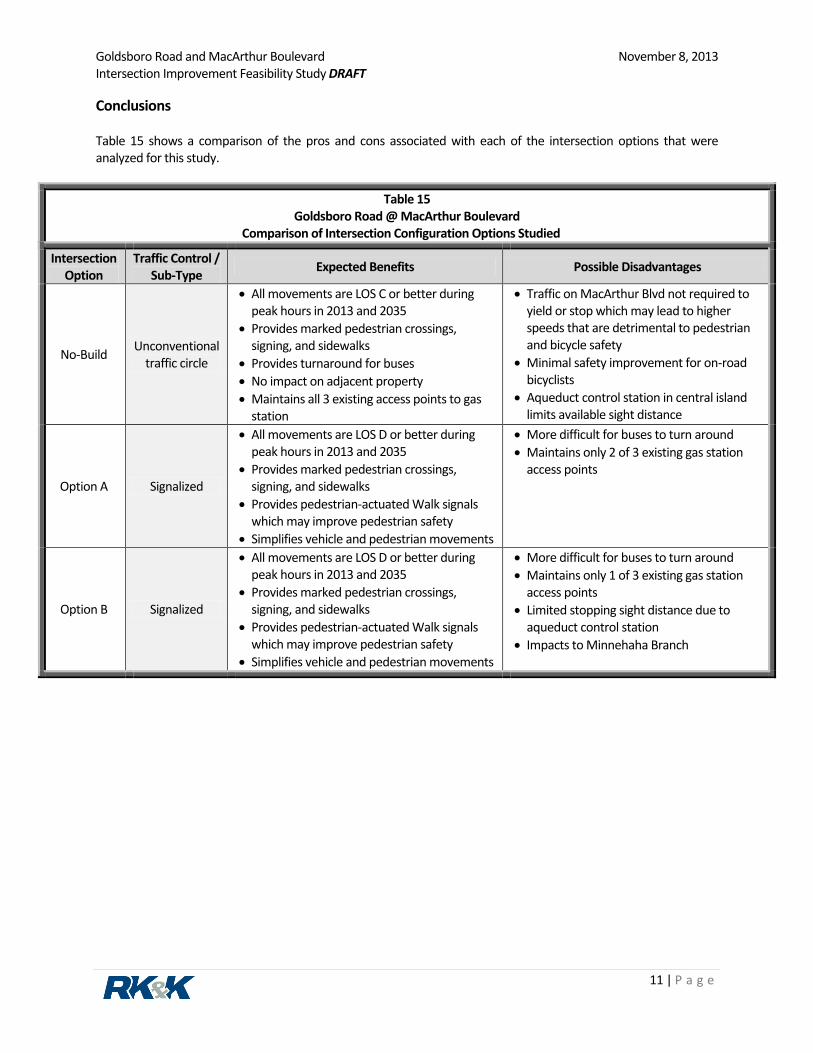
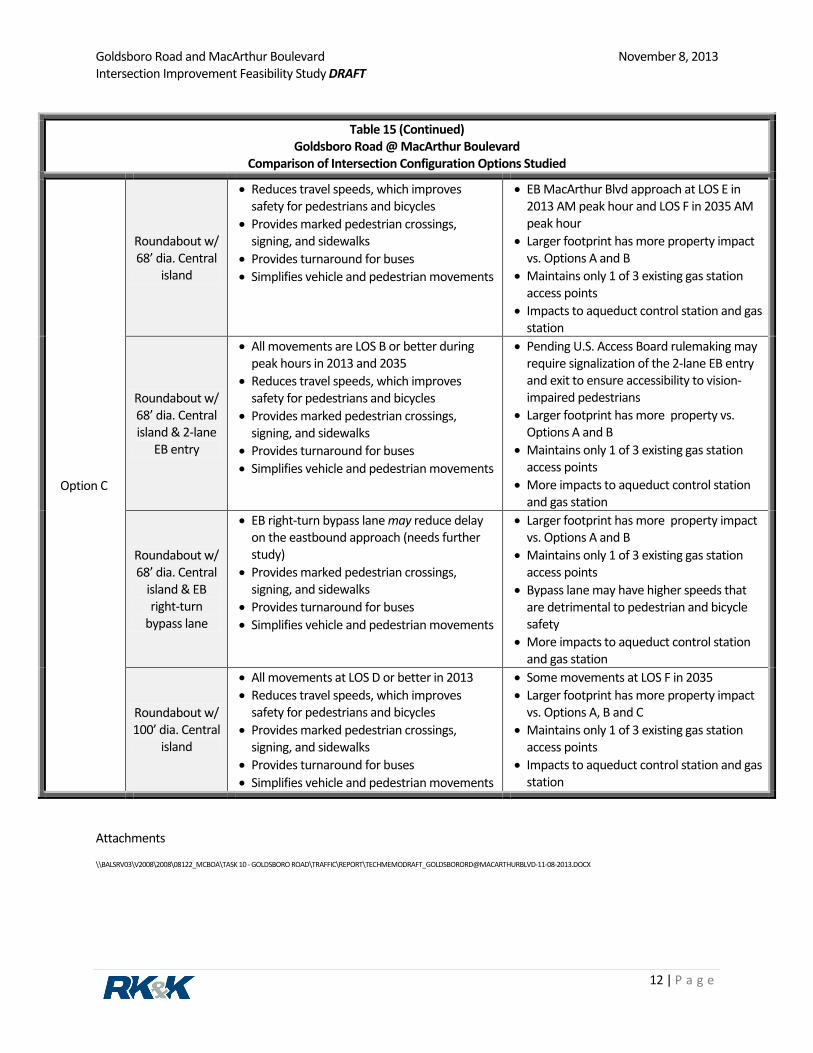
Conclusions Table 15 shows a comparison of the pros and cons associated with each of the intersection options that were analyzed for this study.
Table 15 Goldsboro Road @ MacArthur Boulevard
Comparison of Intersection Configuration Options Studied
Intersection Option
Traffic Control / Sub-Type Expected Benefits Possible Disadvantages
No-Build Unconventional traffic circle
• All movements are LOS C or better during peak hours in 2013 and 2035
• Provides marked pedestrian crossings, signing, and sidewalks
• Provides turnaround for buses • No impact on adjacent property • Maintains all 3 existing access points to gas
station
• Traffic on MacArthur Blvd not required to yield or stop which may lead to higher speeds that are detrimental to pedestrian and bicycle safety
• Minimal safety improvement for on-road bicyclists
• Aqueduct control station in central island limits available sight distance
Option A Signalized
• All movements are LOS D or better during peak hours in 2013 and 2035
• Provides marked pedestrian crossings, signing, and sidewalks
• Provides pedestrian-actuated Walk signals which may improve pedestrian safety
• Simplifies vehicle and pedestrian movements
• More difficult for buses to turn around • Maintains only 2 of 3 existing gas station
access points
Option B Signalized
• All movements are LOS D or better during peak hours in 2013 and 2035
• Provides marked pedestrian crossings, signing, and sidewalks
• Provides pedestrian-actuated Walk signals which may improve pedestrian safety
• Simplifies vehicle and pedestrian movements
• More difficult for buses to turn around • Maintains only 1 of 3 existing gas station
access points • Limited stopping sight distance due to
aqueduct control station • Impacts to Minnehaha Branch
Goldsboro Road and MacArthur Boulevard November 8, 2013 Intersection Improvement Feasibility Study DRAFT
12 | P a g e
Table 15 (Continued) Goldsboro Road @ MacArthur Boulevard
Comparison of Intersection Configuration Options Studied
Option C
Roundabout w/ 68’ dia. Central
island
• Reduces travel speeds, which improves safety for pedestrians and bicycles
• Provides marked pedestrian crossings, signing, and sidewalks
• Provides turnaround for buses • Simplifies vehicle and pedestrian movements
• EB MacArthur Blvd approach at LOS E in 2013 AM peak hour and LOS F in 2035 AM peak hour
• Larger footprint has more property impact vs. Options A and B
• Maintains only 1 of 3 existing gas station access points
• Impacts to aqueduct control station and gas station
Roundabout w/ 68’ dia. Central island & 2-lane
EB entry
• All movements are LOS B or better during peak hours in 2013 and 2035
• Reduces travel speeds, which improves safety for pedestrians and bicycles
• Provides marked pedestrian crossings, signing, and sidewalks
• Provides turnaround for buses • Simplifies vehicle and pedestrian movements
• Pending U.S. Access Board rulemaking may require signalization of the 2-lane EB entry and exit to ensure accessibility to vision-impaired pedestrians
• Larger footprint has more property vs. Options A and B
• Maintains only 1 of 3 existing gas station access points
• More impacts to aqueduct control station and gas station
Roundabout w/ 68’ dia. Central
island & EB right-turn
bypass lane
• EB right-turn bypass lane may reduce delay on the eastbound approach (needs further study)
• Provides marked pedestrian crossings, signing, and sidewalks
• Provides turnaround for buses • Simplifies vehicle and pedestrian movements
• Larger footprint has more property impact vs. Options A and B
• Maintains only 1 of 3 existing gas station access points
• Bypass lane may have higher speeds that are detrimental to pedestrian and bicycle safety
• More impacts to aqueduct control station and gas station
Roundabout w/ 100’ dia. Central
island
• All movements at LOS D or better in 2013 • Reduces travel speeds, which improves
safety for pedestrians and bicycles • Provides marked pedestrian crossings,
signing, and sidewalks • Provides turnaround for buses • Simplifies vehicle and pedestrian movements
• Some movements at LOS F in 2035 • Larger footprint has more property impact
vs. Options A, B and C • Maintains only 1 of 3 existing gas station
access points • Impacts to aqueduct control station and gas
station
Attachments
\\BALSRV03\V2008\2008\08122_MCBOA\TASK 10 - GOLDSBORO ROAD\TRAFFIC\REPORT\[email protected]
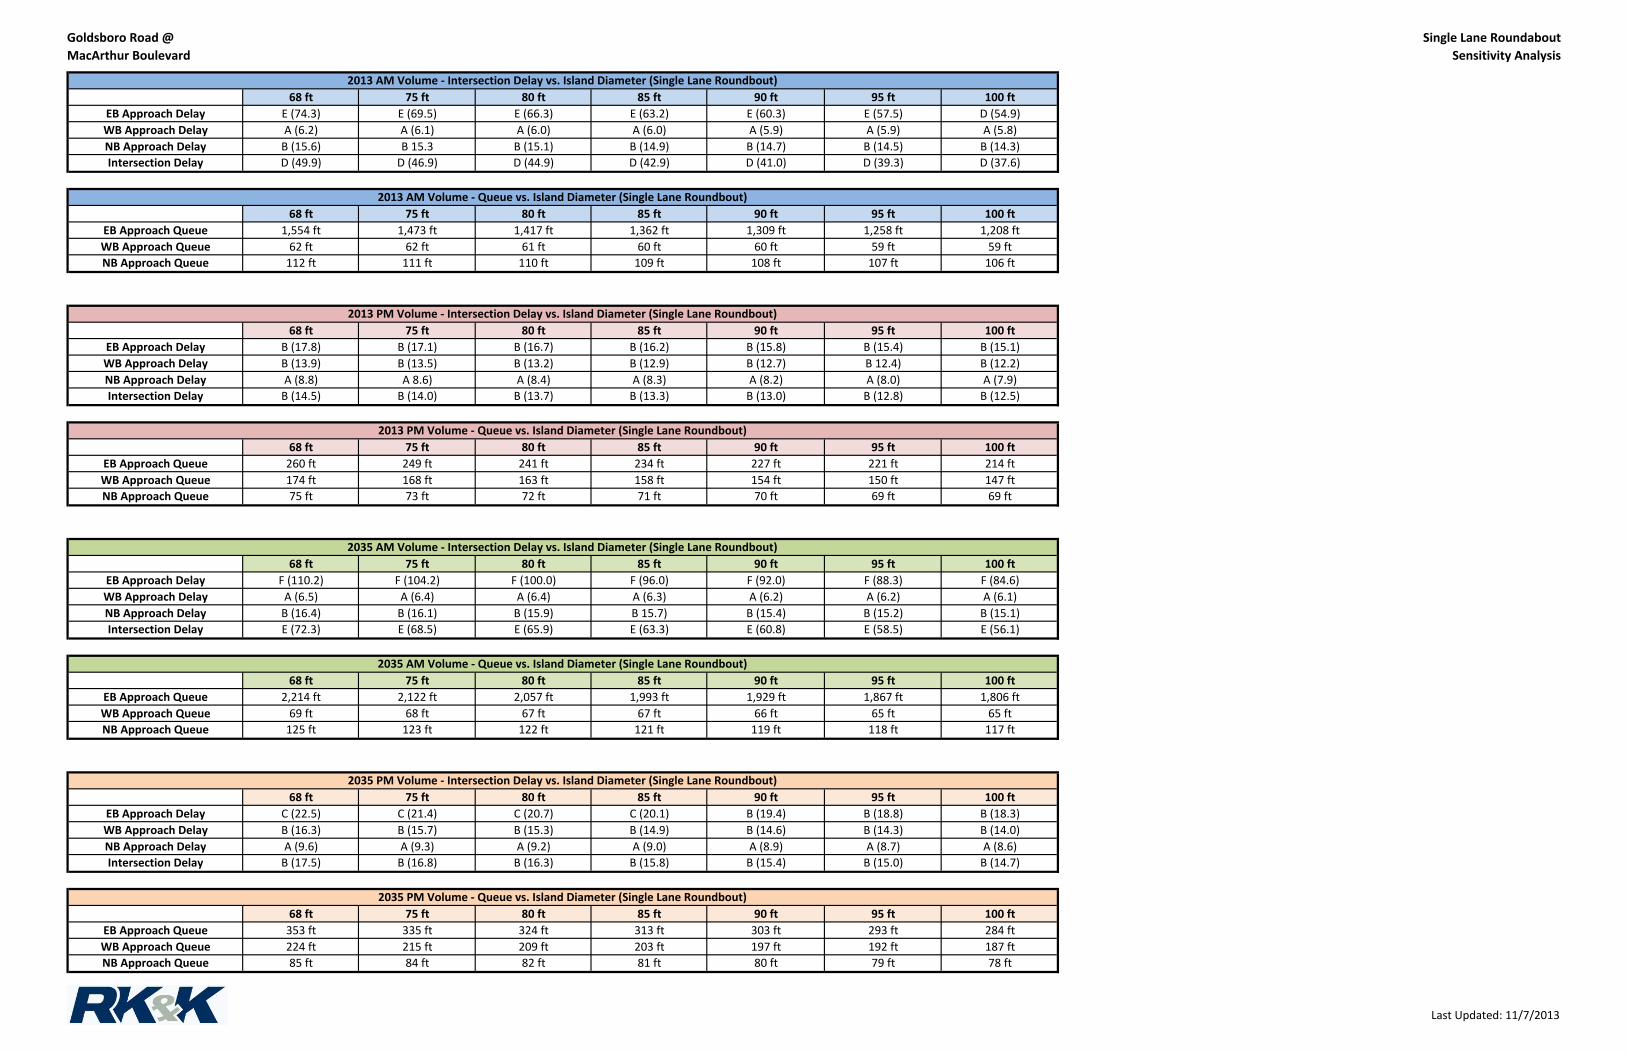
Goldsboro Road @MacArthur Boulevard
Single Lane RoundaboutSensitivity Analysis
68 ft 75 ft 80 ft 85 ft 90 ft 95 ft 100 ftEB Approach Delay E (74.3) E (69.5) E (66.3) E (63.2) E (60.3) E (57.5) D (54.9)WB Approach Delay A (6.2) A (6.1) A (6.0) A (6.0) A (5.9) A (5.9) A (5.8)NB Approach Delay B (15.6) B 15.3 B (15.1) B (14.9) B (14.7) B (14.5) B (14.3)Intersection Delay D (49.9) D (46.9) D (44.9) D (42.9) D (41.0) D (39.3) D (37.6)
68 ft 75 ft 80 ft 85 ft 90 ft 95 ft 100 ftEB Approach Queue 1,554 ft 1,473 ft 1,417 ft 1,362 ft 1,309 ft 1,258 ft 1,208 ftWB Approach Queue 62 ft 62 ft 61 ft 60 ft 60 ft 59 ft 59 ftNB Approach Queue 112 ft 111 ft 110 ft 109 ft 108 ft 107 ft 106 ft
68 ft 75 ft 80 ft 85 ft 90 ft 95 ft 100 ftEB Approach Delay B (17.8) B (17.1) B (16.7) B (16.2) B (15.8) B (15.4) B (15.1)WB Approach Delay B (13.9) B (13.5) B (13.2) B (12.9) B (12.7) B 12.4) B (12.2)NB Approach Delay A (8.8) A 8.6) A (8.4) A (8.3) A (8.2) A (8.0) A (7.9)Intersection Delay B (14.5) B (14.0) B (13.7) B (13.3) B (13.0) B (12.8) B (12.5)
68 ft 75 ft 80 ft 85 ft 90 ft 95 ft 100 ftEB Approach Queue 260 ft 249 ft 241 ft 234 ft 227 ft 221 ft 214 ftWB Approach Queue 174 ft 168 ft 163 ft 158 ft 154 ft 150 ft 147 ftNB Approach Queue 75 ft 73 ft 72 ft 71 ft 70 ft 69 ft 69 ft
68 ft 75 ft 80 ft 85 ft 90 ft 95 ft 100 ftEB Approach Delay F (110.2) F (104.2) F (100.0) F (96.0) F (92.0) F (88.3) F (84.6)WB Approach Delay A (6.5) A (6.4) A (6.4) A (6.3) A (6.2) A (6.2) A (6.1)NB Approach Delay B (16.4) B (16.1) B (15.9) B 15.7) B (15.4) B (15.2) B (15.1)Intersection Delay E (72.3) E (68.5) E (65.9) E (63.3) E (60.8) E (58.5) E (56.1)
68 ft 75 ft 80 ft 85 ft 90 ft 95 ft 100 ftEB Approach Queue 2,214 ft 2,122 ft 2,057 ft 1,993 ft 1,929 ft 1,867 ft 1,806 ftWB Approach Queue 69 ft 68 ft 67 ft 67 ft 66 ft 65 ft 65 ftNB Approach Queue 125 ft 123 ft 122 ft 121 ft 119 ft 118 ft 117 ft
68 ft 75 ft 80 ft 85 ft 90 ft 95 ft 100 ftEB Approach Delay C (22.5) C (21.4) C (20.7) C (20.1) B (19.4) B (18.8) B (18.3)WB Approach Delay B (16.3) B (15.7) B (15.3) B (14.9) B (14.6) B (14.3) B (14.0)NB Approach Delay A (9.6) A (9.3) A (9.2) A (9.0) A (8.9) A (8.7) A (8.6)Intersection Delay B (17.5) B (16.8) B (16.3) B (15.8) B (15.4) B (15.0) B (14.7)
68 ft 75 ft 80 ft 85 ft 90 ft 95 ft 100 ftEB Approach Queue 353 ft 335 ft 324 ft 313 ft 303 ft 293 ft 284 ftWB Approach Queue 224 ft 215 ft 209 ft 203 ft 197 ft 192 ft 187 ftNB Approach Queue 85 ft 84 ft 82 ft 81 ft 80 ft 79 ft 78 ft
2035 PM Volume ‐ Intersection Delay vs. Island Diameter (Single Lane Roundbout)
2035 PM Volume ‐ Queue vs. Island Diameter (Single Lane Roundbout)
2013 AM Volume ‐ Intersection Delay vs. Island Diameter (Single Lane Roundbout)
2013 AM Volume ‐ Queue vs. Island Diameter (Single Lane Roundbout)
2013 PM Volume ‐ Intersection Delay vs. Island Diameter (Single Lane Roundbout)
2013 PM Volume ‐ Queue vs. Island Diameter (Single Lane Roundbout)
2035 AM Volume ‐ Intersection Delay vs. Island Diameter (Single Lane Roundbout)
2035 AM Volume ‐ Queue vs. Island Diameter (Single Lane Roundbout)
Last Updated: 11/7/2013

Maryland State Highway Administration
Office of Traffic and Safety - Traffic Development and Support Division
Name: William MacLeod
Date: 10/11/2013
Location:
County: Period:
Logmiles:
Note:
MacArthur Blvd from S of MD 614 To Oxford Rd
Montgomery, D3 January 01, 2008 To September 30, 2012
From 002.50 To 002.62 Length: 0.12
SHA 52.1 ADC Study Worksheet Output rev. 12/2012-3
8U-100% * Significantly Higher than StatewideType Controls:
YEAR >>
Fatal
No. Killed
Injury
No. Injured
Prop. Damage
Total Crashes
Opposite Dir.
Rear End
Sideswipe
Left Turn
Angle
Pedestrian
Parked Veh.
Fixed Object
Other
U-Turn
Backing
Animal
Railroad
Fire / Expl.
Overturn
Truck Related
Night Time
Wet Surface
Alcohol
Intersection
Total Vehicles
Total Trucks
Truck %
Comments:
2008 2009 2010 2011 2012 Total Study StateWd
0
0
0
0
1
1
0
0
0
0
2
2
0
0
1
1
0
1
0
0
0
0
0
0
0
0
0
0
0
0
0
0
2
0
0
1
0
1
0
0
0
0
0 0 0
0 0 0
0 0 0
0 0 0
0 0 0
0 0 0
0 0 0
0 0 0
1 0 0
1 0 0
0 0 0
1 2 1
1 4 1
0 0 0
0.0 0.0 0.0
0
0
0
0
1
4
1
1
1
2
1
2
0
0
0
0
0
0
0
0
2
0
1
1
0
0
0
0
0
0
0
0
0
0
0
0
0
0
0
0
0 0
0 0
0
1
0
0
0
1
0
1
3
0
0.0
3
0
0.0
0
0
0.0 1.4
3
6
116.3 68.9
5
8
193.8 *
310.2 *
97.8
168.0
0
0
0.0
0.0
8.8
53.8
0
0
0.0
0.0
10.5
13.0
5
2
193.8 *
77.5 *
32.8
3.3
0
1
0.0
38.8
2.5
29.5
0
0
0.0 2.8
0
0
0
0
0
0 0.0 10.4
1 13 % 31 %
2 25 % 21 %
0 0 % 8 %
6
12
0
0.0
RATE
WAADT
VMT millions
184.7 369.3 184.1
12325 12365 12400
0.5 0.5 0.5
367.2
12435
0.5
489.4
12475
0.4 2.6
Severity Index 1 2 4 8 5 Avg 4
Maryland State Highway Administration
Office of Traffic and Safety - Traffic Development and Support Division
SHA 52.1 ADC Summary Output rev. 03/2010-1
Name: William MacLeod
Date: 03/29/2013
Location:
County: Period:
Logmiles:
Note:
MacAruthur Blvd From S of MD 614 To Oxford Rd
Montgomery, D3 January 1, 2008 To September 30, 2012
From 002.50 To 002.62 Length: 0.12
2012 data is preliminary
SEVERITY FATAL INJURY P-DAMAGE TOTALAccidentsVeh OccPedestrian
DAY OF THE WEEKSUN MON TUE WED THU FRI SAT UNK
MONTH OF THE YEARJAN FEB MAR APR MAY JUN JUL AUG SEP OCT NOV DEC UNK
CONDITIONNormal:Alcohol:Other:
DRIVER PED
TIMEAM:PM:
12 01 02 03 04 05 06 07 08 09 10 11 UNK VEHICLES INVOLVED PER ACCIDENT1 2 3 4 5 6+ UNK TOTAL
VEHICLE TYPEMotorcycle/MopedPassenger Vehicle
Pick-Up TruckTrucks (2+3 axles) Other Types
Tractor TrailerPassenger BusSchool BusEmergency Veh
SURFACEWetDrySno/IceMudOther
MOVEMENTSNORTH SOUTH EAST WEST
LF ST RT LF ST RT LF ST RT LF ST RT
OTHER MOVEMENTS
PROBABLE CAUSESInfluence of Drugs
Improper Parking
Influence of Alcohol
Influence of Medication
Influence of Combined Subst.
Physical/Mental Difficulty
Fell Asleep/Fainted, etc.
Fail to give full Attention
Lic. Restr. Non-compliance
Fail to Yield Right-of-way
Fail to Obey Stop Sign
Fail to Obey Traffic Signal
Fail to Obey Other Control
Fail to Keep Right of Center
Fail to Stop for School Bus
Wrong Way on One Way
Exceeded Speed Limit
Too Fast for Conditions
Followed too Closely
Improper Turn
Improper Lane Change
Improper Backing
Improper Passing
Improper Signal
Passenger Interfere/Obstruct.
Illegally in Roadway
Bicycle Violation
Clothing Not VisibleFail to Drive in Single Lane
Sleet, Hail, Freezing RainImproper Right Turn on Red
Severe Crosswinds
Rain, Snow
Animal
Vision Obstruction
Vehicle Defect
Wet
Icy or Snow Covered
Debris or Obstruction
Ruts, Holes or Bumps
Road Under Construction
Traffic Control Device Inop.
Shoulders Low, Soft or High
Other or Unknown
WEATHER
Clear / CloudyFoggyRainingSnow / SleetOther
COLLISION TYPES FATAL INJURY PROP TOTALOpposite Dir Related:
UnRelated:
Rear End Related:UnRelated:
Sideswipe Related:UnRelated:
Left Turn Related:UnRelated:
Angle Related:UnRelated:
Pedestrian Related:UnRelated:
Parked Vehicle Related:UnRelated:
Other Collision Related:UnRelated:
Bridge
Building
Culvert/Ditch
Curb
Guardrail/Barrier
Embankment
Fence
Light Pole
Sign Pole
Other Pole
Tree/Shrubbery
Contr. Barrier
Crash Attenuator
Other Fixed Object
ILLUMINATION
DayDawn/DuskDark - Lights OnDark - No LightsOther
TOTALS
08-12
01
02
03
04
05
06
07
08
09
10
11
12
13
F
I
X
E
D
O
B
J
E
C
T
S
3 5 8
62 1 1 1 2 1
1 1 1 1 2 2
1 1 1 11 1 1 1
10
2
2
1
4 4 12
Sport Utility Veh731
1251 3 1 1 2 1 4
Operator Using Cell Phone
Stopping in Lane Roadway
1
4
1
1
1
1 3 4
1 1
1 1
1 1
1 1
7
1
7
1
8
AVG Severity Index: 4
Maryland State Highway Administration
Office of Traffic and Safety - Traffic Development and Support Division
SHA 52.1 ADC History Output rev. 03/2013-1
Name: William MacLeod
Date: 03/29/2013
Location:
County: Period:
Logmiles:
Note:
MacAruthur Blvd From S of MD 614 To Oxford Rd
Montgomery, D3 January 01, 2008 To September 30, 2012
From 002.50 To 002.62 Length: 0.12
- Combined Year Listing
2012 data is preliminary
MilePt Int Rel Date Severity Time Light Surface Alc Rel FixObj Collision V1 V2 Probable CauseMovement
CO46902.54 10262008 Property 02A Night Wet 09 FXOBJ NR -- Other or Unknown
2.54 01272009 Property 08A Day Snow ANGLE SS WS Fail to yield right-of-way
2.54 11222009 Property 03P Day Dry ANGLE WS NS Fail to give full attention
2.54 10232010 1 Injured 01P Day Dry PED WS -- Fail to yield right-of-way
2.54 02252011 Property 02P Day Wet ANGLE SS NS Fail to obey other control
2.54 11252011 4 Injured 10A Day Dry ANGLE SL uu Fail to yield right-of-way
2.54 04162012 Property 09A Day Dry ANGLE WS NS Fail to obey stop sign
2.54 09202012 1 Injured 05P Day Dry PED WL -- Fail to yield right-of-way
Page 1 of 1
Fixed Object: 01 = Bridge 02 = Building 03 = Culvert/Ditch 04 = Curb 05 = Guardrail/Barrier 06 = Embankment 07 = Fence
08 = Light Pole 09 = Sign Post 10 = Other Pole 11 = Tree/Shrubbery 12 = Construction Barrier 13 = Crash Attenuator
2 3
6
1
2 34 7
5
8