Embed Size (px)
Citation preview

Interrelationships Between Welding Parameters ofHot-Gas Welded Polypropylene
B. Marczis, T. CziganyDepartment of Polymer Engineering, Budapest University of Technology and Economics, Budapest,Muegyetem rkp. 3., Hungary
In case of hot-gas welding, the parameters of weldinginfluence the strength of the welded joint. A weldingportal was designed and built to make the welding pa-rameters of manual hot-gas welding controllable andindependent of human factors. Large series of experi-ments were performed with the automatic welding sta-tion to explore the effect of welding parameters (weldingtemperature, flow rate, welding speed, and weldingforce). The strength of the welded joints was determinedin a standard tensile test carried out according to ISO527–3. Using two-way analysis of variance it was con-cluded that all four parameters influence the strength ofthe welded joint significantly, and the strength of thewelded joint exhibits a complex dependence on all fourparameters. Based on a thermodynamic approach thewelding energy was determined. The measured tensilestrength values were plotted against the welding energyand the welding force and it was found that the resultscan be approximated by a quadratic surface functionwell. POLYM. ENG. SCI., 46:1173–1181, 2006. © 2006 Society ofPlastics Engineers
INTRODUCTION
Joints in plastic structures can be classified according tothe physical principles of joining: one may distinguishamong joints held together by force, shape, or material. Thelatter category—owing to the rapid development of weldingtechnologies—is used more frequently in several industrialapplications. Welding technology is not only important inproduction and repair, but also in recycling, which hasenvironmental impacts. This impact stems from the reducedwaste formation owing to the longer service life of theproduct. Key questions of material based joints are, ofcourse, whether the products manufactured or repaired withthe help of this technology retain the original properties of
the raw materials and how it is possible to optimize thequality of the welded joint [1, 2]. When using welding toconstruct joints, the main objective is to produce the stron-gest possible, cohesion-based joint. In case of plastics weld-ing, taking the molecular structure of polymers into account,the notion “welded joint” is limited to joints producedbetween thermoplastic polymers under thermal and pressureloading—with or without a welding material. The necessarypreconditions of welding reveal that a rheologically ade-quate state is necessary to achieve a good quality joint[1, 3].
Polymer welding methods can be divided into the fol-lowing subgroups according to the way of heat application:external, internal or mechanical, and electromagnetic heat-ing methods. The most important external heating technol-ogy is hot plate welding [4–10]. Ultrasonic [11, 12] andvibration [13–16] welding, the most important ones in theindustry, belong to the internal or mechanical heating meth-ods. Induction [17, 18] and laser [19–21] welding fall intothe category of radiation/electromagnetic technologies,which set new targets in the plastics welding technology.
Hot-gas welding is one of the external heating methods,as it uses hot gas to increase the surface temperature of thematerials to be welded up to the softening point. The mostfrequently used gas led to the welded spot through anelectric heater followed by a nozzle is air but the applicationof nitrogen and carbon dioxide is also mentioned in thetechnical literature [1, 22]. Hot-gas welding is widely ap-plied for fastening in small series production, e.g. for fittingplastic basins, chemical containers etc., and it is also wide-spread when fixing damaged car bumpers and other plasticelements. This method has already been used for fixing theacrylic cockpits of planes in World War II. Turner andAtkinson [23] welded polycarbonate/polyester, poly(buty-lene terephthalate), and EPDM (ethylene propylene dienemonomer) sheets of 3 mm thickness. They prepared one-and two-sided welded joints, which were compared in static(tensile) tests and with dynamic methods (falling weight andimpact test of bumpers fastened onto cars). Based on theirmeasurements, the joint strength of one-sided V-seams inthe polycarbonate/polyester systems was 59% of the origi-
Correspondence to: T. Czigany; e-mail: [email protected] grant sponsor: Hungarian Scientific Research Fund; contract grantnumber: OTKA T037864; contract grant sponsor: Hungarian Ministry ofEducation; contract grant number: TeT ARG-4/02.DOI 10.1002/pen.20570Published online in Wiley InterScience (www.interscience.wiley.com).© 2006 Society of Plastics Engineers
POLYMER ENGINEERING AND SCIENCE—2006

nal material strength, and for two-sided seams this valueturned out to be 63%. For poly(butylene terephthalate) therespective calculated values were 76 and 97% and forEPDM 78 and 67%. Our aim in this study is to investigatethe effect of welding parameters on the welding strength incase of this least studied welding technology, to explore andanalyze their interrelations with respect to the welded jointstrength.
EXPERIMENTAL
Automation of the Hot-Gas Welding Process
Based on the data found in the literature [23], the qualityof the welded seam prepared by hot-gas welding is definedby three parameters (welding temperature, the force thatsqueezes the welding material into the seam groove, and theflow rate of hot gas). Based on our preliminary experiments,it seemed necessary to introduce a fourth parameter, weld-ing speed, as it influences the quality of the welded seamsignificantly. In industrial practice hot-gas welding is usu-ally performed manually; therefore, two of the four param-eters—welding speed and welding force—depend on theperson carrying out the welding operation, on his/her expe-rience, hence welded joints can be compared only if humanfactors can be excluded completely.
The welding parameters of manual hot-gas welding be-came controllable through the automation of the weldingprocess, i.e., the human factor was eliminated. The constanttemperature of the air flow was ensured since an electron-ically controlled Leister Diode Pid welding machineequipped with a rapid welding attachment type 106.986 wasused, and the actual flow rate was measured with aYokogawa rotameter. The welding machine was mountedonto a welding portal. The exact welding speed was con-trolled by a variable frequency drive: Danfoss VLT-2800,and the constant welding force was ensured with freelymoving weights (Fig. 1).
Materials and Specimen Preparation
Welding experiments were performed on 3-mm-thick,extruded polypropylene block copolymer sheets manufac-tured by PEMU Rt. (Hungary) from TIPPLEN CS2–8000(MFI � 0.4 g/10 min, � � 28 MPa, � � 10%, E � 1265MPa, product of TVK, Hungary). DSC examinations re-vealed that the melting point of the crystalline phase of theaforementioned PP block copolymer is between 165 and170°C. The welding rod was made of the same raw material,also by PEMU Rt. The 3-mm-thick sheets were available inthe form of 1500 � 2000 mm2 blocks (length/width), fromwhich 75 � 600 mm2 sheets were cut and the profile with45° slope—necessary for welding—was prepared along thelength of the specimen. After cutting the sheet and beforewelding, the welding surfaces as well as the welding mate-rial were cleaned with acetone to remove grease. Then theseam was prepared by the automated welding machine afterthe opposing two pieces were put next to each other. No rootgap was applied during welding. The welding material wasavailable in a 5-mm-thick and 3-mm-high triangular profile.
Test Method
The basis of the tensile test was standard ISO 527–3 [24].Test specimens of the 2nd (parallelepiped) type were pre-pared from the middle of each welded joint. First, thespecimens were sawed out of the welded sheets roughly,and then the exact size, 10 � 150 mm2, was finished withmilling. The tensile test was performed on a universal testmachine type Zwick Z050 at room temperature, at 10 mm/min test speed.
RESULTS AND DISCUSSION
Experimental Setup
The range of welding parameters was determined inpre-experiments. The adequate welding temperature waschosen during manual welding. Our preliminary examina-tions revealed that no connection can be achieved betweenthe welding rod and the specimens below 210°C. On theother hand, above the air temperature of 250°C the weldingmaterial gets so hot that the rapid welding pad breaks thesoftened material and hence a part of it burns into thewelding machine. As a consequence, the range of weldingtemperature was chosen to be between 220 and 240°C. Thewelding force was selected according to the DVS, whichprovides data on the welding force, i.e., the extent of press-ing the welding material into the seam groove, only formaterials of circular cross section. In case of PP, this valueis between 10 and 16 N using the rapid welding pad and arod of 3 mm diameter. This range was extended to 10–20 Nbecause of the triangular profile.
The four welding parameters presented can be dividedinto two groups based on the fact whether their valuesdepend on the person who performs the welding operation
FIG. 1. Structure of the automated hot-gas welding station.
1174 POLYMER ENGINEERING AND SCIENCE—2006 DOI 10.1002/pen

or not. Independent parameters (as they are controllable)were divided into five levels. The range of human-depen-dent variables (as they depend on the welder’s experience)was divided into three, well distinguishable levels (low,medium, and high) (Table 1)
A complete picture about the interrelations among thewelding parameters can only be obtained (within the studiedinterval) if the experiments are performed with all possiblewelding parameter values. It means that the total number ofall parameter combinations is 5 � 5 � 3 � 3 � 225. Havingfinished the complete experimental Series 7, test specimenswere taken from each welded joint and their tensile strengthwas measured according to ISO 527–3.
Examination of the Welding Parameters with Analysis ofVariance
Based on Table 1, the impacts of the two controllablewelding parameters (welding temperature and flow rate) andthat of the two welder-dependent parameters (welding speedand welding force) on the strength of the welded joint aswell as the interactions between the two parameter pairs arestudied using the method of analysis of variance (ANOVA)[25, 26]. Performing two-way ANOVA, it can be decidedhow the two welding parameters affect the strength of thewelded joint, whether their effects are significant or not,whether there is any interaction between the factors, andwhether this interaction is significant. In two-way ANOVAthe general average-model is modified into an effect-model,wherein the effects of factors A and B and their interactions(AB) are taken into account.
yijk � � � �i � �j � ��ij � �ijk
�i � 1,. . .,r; j � 1,. . .,q; k � 1,. . .,p). (1)
In the effect-model, �i is the effect of factor A at the i-thlevel (as compared to the expected value �), �j is the effectof factor B at the j-th level, ��ij is their interaction, and �ijk
is the error. The deviation from the theoretical �ij expectedvalue is �ijk (the error) if the following assumptions aremade:
1. The expected value of �ijk is zero, i.e., the experimentalvalues yijk scatter around the expected value �ij.
2. The variance of �ijk values (�e2) is constant, i.e., it is
uniform for each ij group.
3. The �ijk errors are independent from each other withinone group, and the errors of groups are also indepen-dent from each other.
4. They exhibit normal distribution.
The sum of squares is defined as follows [26]:
S0 � SA � SB � SAB � SR (2)
where S0 is the total square sum; SA, SB are the effects offactors A and B, respectively; and SAB is the interaction.These square sums can be compared with the residualsquare sum with the F-probe. If the factors have no impactand no interaction, the F test statistics exhibits F-distribu-tion, and if they do, it will present a higher value. Squaresums, squared standard deviations, and the calculated teststatistics are summarized in the so-called scattering analysistable (Table 2).
Definition of the averages shown in the formulae is thefollowing:
yij. �¥k�1
p yijk
p(3)
yi.. �¥j�1
q yij.
q(4)
y .j. �¥k�1
r yij.
r(5)
y . . . �¥i�1
r yi..
r�
¥j�1q y .j.
q
� �i�1
r �j�1
q
yj..rq � �i�1
r �j�1
q �k�1
p
yijkrqp. (6)
Accordingly, two-way ANOVA was performed simulta-neously for welding temperature, flow rate, welding speed,and welding force. The welding parameters correspondentto factors A and B, according to the general notation, areshown in Table 3.
When performing the analysis, all levels of factors A andB (r, q) were combined, i.e., the tests were performed at rqlevels, with a uniform number of repetitions (p), hence it
TABLE 1. Welding parameters and their values in hot-gas welding experiments.
Welding parameters
Set values of the parameters
1 2 3 4 5
Independent, controllable parameters Welding temperature, T (°C) 220 225 230 235 240Flow rate, V (l/min) 40 50 60 70 80
Parameters dependent on the welder Welding speed, S (mm/min) 50 75 100Welding force, F (N) 10 15 20
DOI 10.1002/pen POLYMER ENGINEERING AND SCIENCE—2006 1175
was a balanced plan. Analyses were performed on themedium values of the welding parameters not includedoriginally in the analyses. Strength data obtained from thetensile tests are shown in Tables 4 and 5.
Preconditions for using ANOVA imply that there is nodifference between the expected values of the data setsbehind these groups. The validity of this assumption waschecked by the Cochran-test [27]. The Cochran test statis-tics is defined as follows:
G �
maxi si
2
s12 � . . . � si
2 (7)
where s2 is the corrected empirical squared standard devi-ation defined as
s2 �1
n�1 �i�1
n
�xi � x�2. (8)
If the test statistics does not exceed the critical G valuethat belongs to significance level � � 0.05, the zero hy-pothesis can be accepted at a significance level of � � 0.05[27].
Welding temperature and flow rate both had five levels,and so altogether 5 � 5 � 25 groups had to be compared.Empirical squared standard deviations are shown in Tables6 and 7.
The test statistics values calculated in Eq. 7 and thecritical G value that belongs to significance level � � 0.05are shown in Table 8.
The critical G values that belong to significance level �� 0.05 are not exceeded by the calculated G values, and so
at this level the zero hypothesis can be accepted for bothanalyses. A further precondition of using ANOVA is thatthe error (deviation from the average) follows normal dis-tribution. This has been checked by graphical methods. Thecoordinate system of the cumulated relative frequency his-togram was transformed (linearized) to check the deviationsfrom the theoretical straight line on a Gauss-paper plot.
The cumulated relative frequency (ordinate) is plottedagainst the residuals (abscissa), and the straight line showsthe values that belong to the theoretical normalized normaldistribution (u-distribution). Residuals in this case mean thedeviation of the individual measured data from the averageof the given data group.
The data points fluctuate around the theoretical straightline randomly; therefore, this precondition of usingANOVA can also be accepted, as the deviations follow anormal distribution.
It should also be checked whether there is any tendencyof the residuals as a function of the sequence of the mea-surements, i.e., whether �ijk errors are independent fromeach other or not. To check this assumption, the residualswere plotted against the serial number of the measurementin a coordinate system.
It can be observed that neither the first analysis nor thesecond one exhibits any order or tendency. As the zerohypotheses all proved to be acceptable, the ANOVA anal-ysis can be performed.
Averages of the rows and of the columns are taken fromTables 4 and 5 and from Eqs. 3–6, and they are summarizedin Tables 9 and 10.
The analysis of variance of the welding temperature/flowrate and of the welding speed/welding force pairs wasperformed using the equations described in the ANOVAtable (the results can be found in Tables 11 and 12).
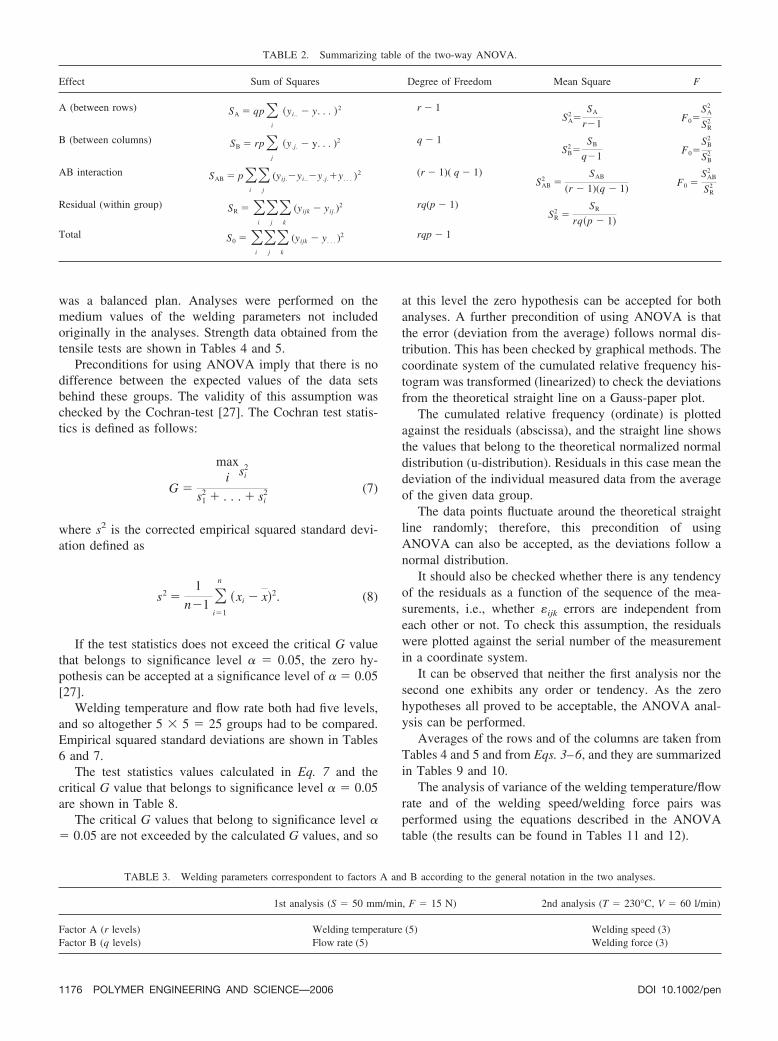
TABLE 2. Summarizing table of the two-way ANOVA.
Effect Sum of Squares Degree of Freedom Mean Square F
A (between rows) SA � qp�i
�yi.. � y. . . �2 r � 1SA
2 �SA
r�1F0�
SA2
SR2
B (between columns) SB � rp�j
�y .j. � y. . . )2 q � 1SB
2�SB
q�1F0�
SB2
SB2
AB interaction SAB � p�i
�j
(yij.�yi..�y .j.�y . . . )2 (r � 1)( q � 1)
SAB2 �
SAB
(r � 1)(q � 1)F0 �
SAB2
SR2
Residual (within group) SR � �i
�j
�k
(yijk � yij.)2 rq(p � 1)
SR2 �
SR
rq�p � 1)Total S0 � �
i
�j
�k
(yijk � y . . . )2 rqp � 1
TABLE 3. Welding parameters correspondent to factors A and B according to the general notation in the two analyses.
1st analysis (S � 50 mm/min, F � 15 N) 2nd analysis (T � 230°C, V � 60 l/min)
Factor A (r levels) Welding temperature (5) Welding speed (3)Factor B (q levels) Flow rate (5) Welding force (3)
1176 POLYMER ENGINEERING AND SCIENCE—2006 DOI 10.1002/pen

Based on the results of the first analysis, it can beconcluded that both the welding temperature and the flowrate have significant effect, since the critical value thatbelongs to F(4.150) at a significance level of � � 0.05 is2.46. This value is exceeded in both test statistics. Thecomparison of the F-values revealed that the flow rate has6.2 times stronger impact than the welding temperature. Theone-sided F-test value (14.814) leads to a conclusion thatthe interaction of the two factors is significant, as the criticalvalue that belongs to F(16.150) at a significance level of �� 0.05 is 1.75.
The second analysis reveals again that the individualeffects of both parameters on the strength of the weldedjoint are significant, as the critical value F(2.54) � 3.18 isfar exceeded in both test statistics. From the analysis of theF values it can be concluded that the welding speed hasstronger impact on the welded joint strength than the weld-
ing force. The joint effect of welding force and weldingspeed is also significant.
Thermodynamic Description of the Hot-Gas WeldingProcess
The effects of welding parameters and their interrelationsare complex and the quality of the welded seam is influ-enced by all of them; therefore, it is necessary to determinetheir interrelations. From the physical perspective, it isnecessary to pump in some kind of energy to bring both thewelded pieces and the welding material into a proper rheo-logical state. In case of hot-gas welding, this energy isbrought to the surface in a flowing gaseous medium. Havingdetermined the energy content pumped into the system it is
TABLE 6. Empirical squared standard deviation of tensile strengthsof welded joints in MPa units.a
B [V(1/min)]
A [T (°C)]
220 225 230 235 240
40 0.551 0.309 1.494 0.281 1.27750 0.136 0.364 0.340 0.856 0.70660 0.090 0.051 0.579 1.131 0.70570 0.480 0.257 0.644 0.882 1.08380 0.195 0.633 0.565 0.748 0.538
aAt a welding speed of S � 75 mm/min and a welding force ofF � 15 N.
TABLE 4. Summary of the average strength of welded joints in MPaunits.a
B [V (1/min)]
A [T (°C)]
220 225 230 235 240
40 10.90 12.32 12.16 15.71 14.9311.09 12.21 14.56 15.38 14.9412.06 12.16 12.12 15.55 12.9011.85 12.24 15.22 15.22 13.9510.24 13.55 13.83 15.35 12.9612.34 12.01 13.62 15.34 15.0311.70 11.87 12.45 14.09 15.88
50 12.69 14.38 15.01 16.72 16.7412.34 13.70 15.47 17.45 15.8612.54 14.97 16.27 17.95 17.0712.73 13.69 14.42 17.74 16.2412.62 13.67 15.05 15.66 18.3113.48 13.12 15.66 16.05 17.3212.97 13.66 15.44 17.86 16.15
60 15.44 16.63 19.06 17.06 17.6615.81 16.69 16.84 18.97 18.4615.68 17.04 17.53 17.86 16.8015.70 17.15 18.66 16.20 18.0414.91 17.13 18.18 18.97 17.3015.65 16.84 18.41 17.11 17.5815.52 16.66 17.63 18.47 19.37
70 17.21 17.89 17.76 18.37 17.1617.04 17.58 18.14 17.48 18.3616.09 18.46 19.29 16.62 15.6715.47 16.95 18.02 19.17 16.5517.48 18.07 17.55 16.90 18.2216.59 18.29 19.06 17.82 16.6616.76 18.10 19.56 16.76 18.25
80 18.93 20.28 19.80 18.66 17.7617.90 19.43 20.64 18.37 17.1018.90 18.46 18.58 17.29 16.7519.10 20.00 20.29 16.58 18.0119.11 19.87 18.84 17.08 16.8718.88 18.31 19.15 18.78 16.6219.20 20.04 19.52 18.22 15.82
aAt a welding speed of S � 75 mm/min and a welding force of F � 15N.
TABLE 5. Summary of the average strength of welded joints in MPaunits.a
B [F (N)]
A [S (mm/min)]
50 75 100
10 17.6 19.8 17.818.5 20.4 18.817.8 20.8 18.918.3 20.5 16.818.2 20.0 17.317.7 18.9 17.017.8 20.8 19.1
15 14.6 19.1 15.416.3 16.8 14.615.0 17.5 15.516.2 18.7 14.915.6 18.2 16.014.8 18.4 16.413.7 17.6 16.4
20 11.0 14.9 11.611.1 15.7 13.010.9 16.5 12.211.0 17.1 13.610.3 15.3 13.68.7 16.3 12.59.8 15.4 11.8
aAt a welding temperature of T � 230°C and a flow rate of V � 60l/min.
DOI 10.1002/pen POLYMER ENGINEERING AND SCIENCE—2006 1177
possible to plot the strength of the welded joint against thiscomplex parameter. The direct measurement of the con-sumed electric energy was not possible, since the inbuiltLeister Diode PID has temperature controller electronics,hence the current input is changed several times within 1 secas a function of the leaving gas temperature (depending onwhether it is below or above the setpoint). The continuousregistration of the current was not possible.
The welding parameters can be divided into two groups,depending on whether they affect the energy flow onto aunit surface or not. Welding temperature and the flow rate ofthe gas are in the first group. They—the thermodynamicpoint of view—determine the transferred energy per unittime. Welding speed also belongs to this group, as thetransferred energy per unit welding length can be deter-mined using this parameter. The other group involves thefourth welding parameter, welding force, which (from thethermodynamic aspect) does not influence welding, but itcan also be regarded as a parameter of the technology.
The energy that flows onto a unit surface of the weldedmaterial can be determined if one describes the air flowingthrough the welding machine both from the thermodynamicand the gas dynamic aspects. Flowing air was considered tobe an ideal gas. The thermodynamic system can be dividedinto three parts. Between the first and second parts the gasflows in a constant cross-section and it contacts only theheating element of the welding machine. The flowing gas iswarmed by the filament heated by the electrical current.This heated gas flows through the third, narrowing cross-section (through the nozzle of the welding head). The firstlaw of thermodynamics for an open system between cross-sections 1 and 2 is [28]:
h1 �1
21
2 � q � h2 �1
22
2 (9)
where h1 and h2 denote the enthalpy of the gas, 1 and 2
are the velocities of the flowing gas, and q is the energybrought in. The enthalpies can be calculated as shown inEqs. 10 and 11:
h1 � cpT1 (10)
h2 � cpT2 (11)
where cp is the specific heat of the gas, T1 and T2 are thetemperatures of the flowing gas.
Substituting the values into Eq. 9 and expressing q, thefollowing Eq. 12 is obtained:
q � cp(T2 � T1) �2
2
2�
12
2. (12)
As the kinetic term in the equation is much smaller than theenthalpy term, the former can be neglected in the calcula-tions [28–30]. Thus if Eq. 12 is modified and q is related tothe unit volume that flows through in unit time, the heat flux(�) can be written as Eq. 13:
� � Cp(T2 � T1)m (13)
where m is the mass flow rate Eq. 14:
m � qv (14)
where qv is the volume flow rate of gas and is its density.Heat flux describes the energy that flows through in a
time unit, which can be related to a single path length if thewelding speed (S (m/s)) is taken into account:
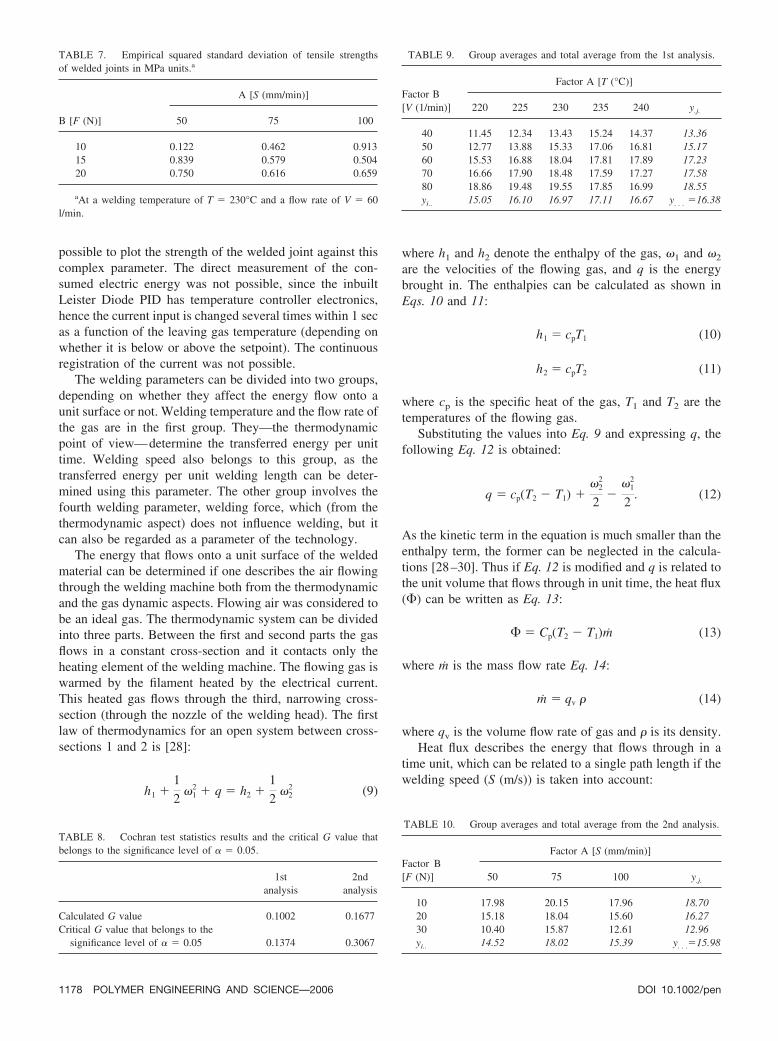
TABLE 8. Cochran test statistics results and the critical G value thatbelongs to the significance level of � � 0.05.
1stanalysis
2ndanalysis
Calculated G value 0.1002 0.1677Critical G value that belongs to the
significance level of � � 0.05 0.1374 0.3067
TABLE 10. Group averages and total average from the 2nd analysis.
Factor B[F (N)]
Factor A [S (mm/min)]
50 75 100 y.j.
10 17.98 20.15 17.96 18.7020 15.18 18.04 15.60 16.2730 10.40 15.87 12.61 12.96yi.. 14.52 18.02 15.39 y. . .�15.98
TABLE 7. Empirical squared standard deviation of tensile strengthsof welded joints in MPa units.a
B [F (N)]
A [S (mm/min)]
50 75 100
10 0.122 0.462 0.91315 0.839 0.579 0.50420 0.750 0.616 0.659
aAt a welding temperature of T � 230°C and a flow rate of V � 60l/min.
TABLE 9. Group averages and total average from the 1st analysis.
Factor B[V (1/min)]
Factor A [T (°C)]
220 225 230 235 240 y.j.
40 11.45 12.34 13.43 15.24 14.37 13.3650 12.77 13.88 15.33 17.06 16.81 15.1760 15.53 16.88 18.04 17.81 17.89 17.2370 16.66 17.90 18.48 17.59 17.27 17.5880 18.86 19.48 19.55 17.85 16.99 18.55yi.. 15.05 16.10 16.97 17.11 16.67 y. . . �16.38
1178 POLYMER ENGINEERING AND SCIENCE—2006 DOI 10.1002/pen
K ��
S. (15)
The dimension of K based on Eq. 15 in SI units is � J
m� . It
has to be transformed to � J
mm� and so the detailed equation
can be written as
K �
cp(T2 � T1) qv
p1
RT1
1000S. (16)
The pressure of the flowing gas was measured with apressure reducer (FESTO LR-M1-G1/8–04G) equippedwith a manometer. The calculations were performed usingthe results of the pressure measurement and the weldingenergy values were determined for each parameter combi-nation [31].
Analysis of Welded Joint Strength as a Function of theWelding Energy
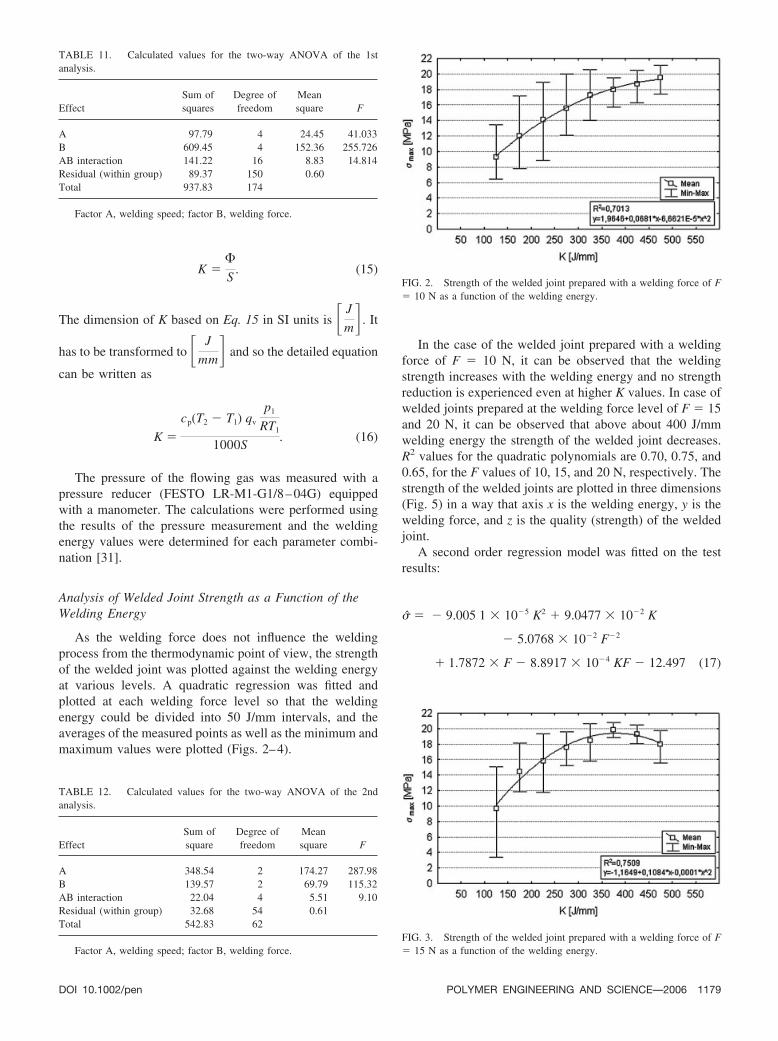
As the welding force does not influence the weldingprocess from the thermodynamic point of view, the strengthof the welded joint was plotted against the welding energyat various levels. A quadratic regression was fitted andplotted at each welding force level so that the weldingenergy could be divided into 50 J/mm intervals, and theaverages of the measured points as well as the minimum andmaximum values were plotted (Figs. 2–4).
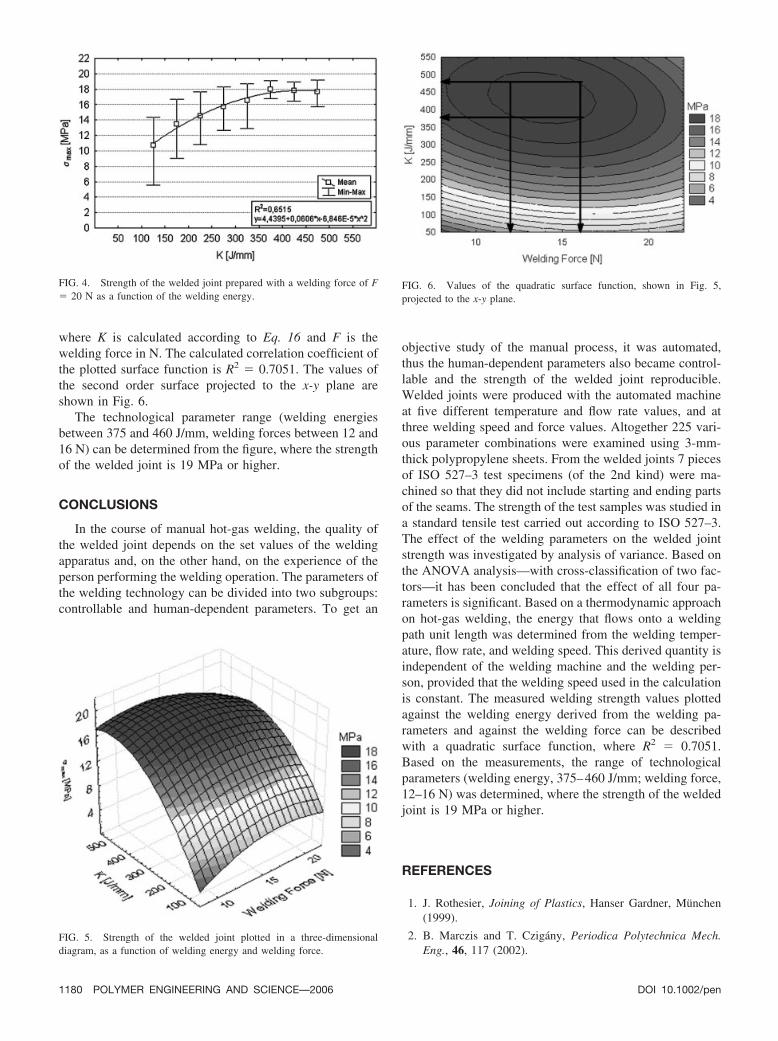
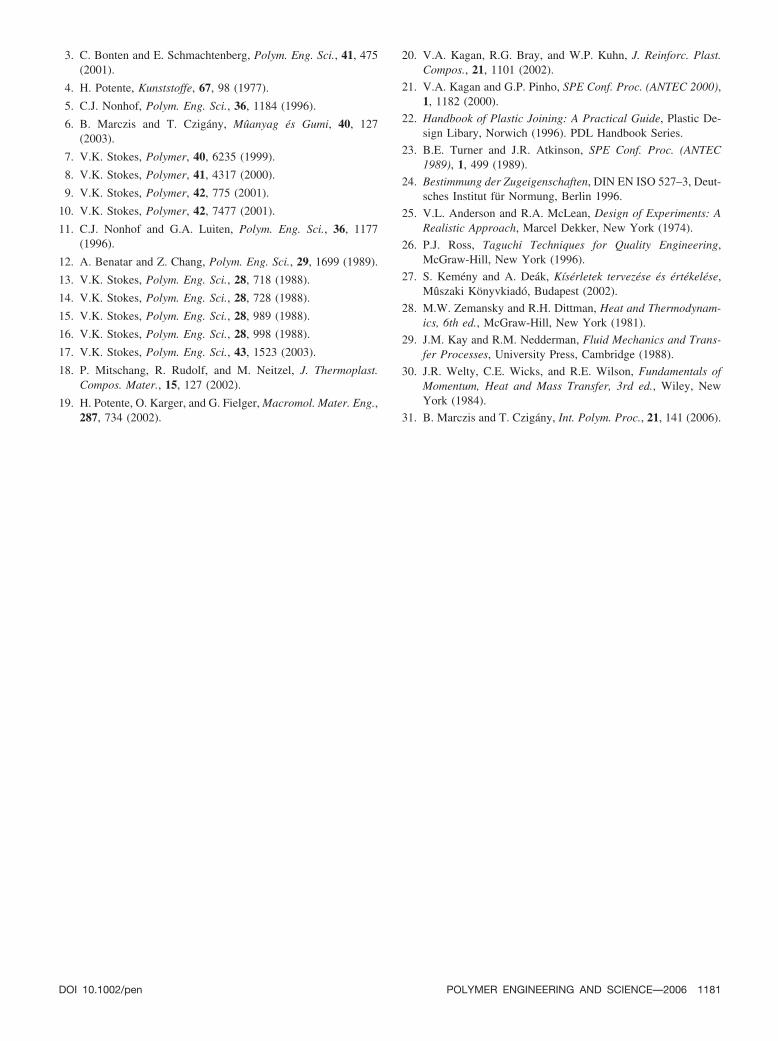
In the case of the welded joint prepared with a weldingforce of F � 10 N, it can be observed that the weldingstrength increases with the welding energy and no strengthreduction is experienced even at higher K values. In case ofwelded joints prepared at the welding force level of F � 15and 20 N, it can be observed that above about 400 J/mmwelding energy the strength of the welded joint decreases.R2 values for the quadratic polynomials are 0.70, 0.75, and0.65, for the F values of 10, 15, and 20 N, respectively. Thestrength of the welded joints are plotted in three dimensions(Fig. 5) in a way that axis x is the welding energy, y is thewelding force, and z is the quality (strength) of the weldedjoint.
A second order regression model was fitted on the testresults:
� � � 9.005 1 � 10�5 K2 � 9.0477 � 10�2 K
� 5.0768 � 10�2 F�2
� 1.7872 � F � 8.8917 � 10�4 KF � 12.497 (17)
FIG. 3. Strength of the welded joint prepared with a welding force of F� 15 N as a function of the welding energy.
TABLE 11. Calculated values for the two-way ANOVA of the 1stanalysis.
EffectSum ofsquares
Degree offreedom
Meansquare F
A 97.79 4 24.45 41.033B 609.45 4 152.36 255.726AB interaction 141.22 16 8.83 14.814Residual (within group) 89.37 150 0.60Total 937.83 174
Factor A, welding speed; factor B, welding force.
TABLE 12. Calculated values for the two-way ANOVA of the 2ndanalysis.
EffectSum ofsquare
Degree offreedom
Meansquare F
A 348.54 2 174.27 287.98B 139.57 2 69.79 115.32AB interaction 22.04 4 5.51 9.10Residual (within group) 32.68 54 0.61Total 542.83 62
Factor A, welding speed; factor B, welding force.
FIG. 2. Strength of the welded joint prepared with a welding force of F� 10 N as a function of the welding energy.
DOI 10.1002/pen POLYMER ENGINEERING AND SCIENCE—2006 1179
where K is calculated according to Eq. 16 and F is thewelding force in N. The calculated correlation coefficient ofthe plotted surface function is R2 � 0.7051. The values ofthe second order surface projected to the x-y plane areshown in Fig. 6.
The technological parameter range (welding energiesbetween 375 and 460 J/mm, welding forces between 12 and16 N) can be determined from the figure, where the strengthof the welded joint is 19 MPa or higher.
CONCLUSIONS
In the course of manual hot-gas welding, the quality ofthe welded joint depends on the set values of the weldingapparatus and, on the other hand, on the experience of theperson performing the welding operation. The parameters ofthe welding technology can be divided into two subgroups:controllable and human-dependent parameters. To get an
objective study of the manual process, it was automated,thus the human-dependent parameters also became control-lable and the strength of the welded joint reproducible.Welded joints were produced with the automated machineat five different temperature and flow rate values, and atthree welding speed and force values. Altogether 225 vari-ous parameter combinations were examined using 3-mm-thick polypropylene sheets. From the welded joints 7 piecesof ISO 527–3 test specimens (of the 2nd kind) were ma-chined so that they did not include starting and ending partsof the seams. The strength of the test samples was studied ina standard tensile test carried out according to ISO 527–3.The effect of the welding parameters on the welded jointstrength was investigated by analysis of variance. Based onthe ANOVA analysis—with cross-classification of two fac-tors—it has been concluded that the effect of all four pa-rameters is significant. Based on a thermodynamic approachon hot-gas welding, the energy that flows onto a weldingpath unit length was determined from the welding temper-ature, flow rate, and welding speed. This derived quantity isindependent of the welding machine and the welding per-son, provided that the welding speed used in the calculationis constant. The measured welding strength values plottedagainst the welding energy derived from the welding pa-rameters and against the welding force can be describedwith a quadratic surface function, where R2 � 0.7051.Based on the measurements, the range of technologicalparameters (welding energy, 375–460 J/mm; welding force,12–16 N) was determined, where the strength of the weldedjoint is 19 MPa or higher.
REFERENCES
1. J. Rothesier, Joining of Plastics, Hanser Gardner, Munchen(1999).
2. B. Marczis and T. Czigany, Periodica Polytechnica Mech.Eng., 46, 117 (2002).
FIG. 4. Strength of the welded joint prepared with a welding force of F� 20 N as a function of the welding energy.
FIG. 5. Strength of the welded joint plotted in a three-dimensionaldiagram, as a function of welding energy and welding force.
FIG. 6. Values of the quadratic surface function, shown in Fig. 5,projected to the x-y plane.
1180 POLYMER ENGINEERING AND SCIENCE—2006 DOI 10.1002/pen
3. C. Bonten and E. Schmachtenberg, Polym. Eng. Sci., 41, 475(2001).
4. H. Potente, Kunststoffe, 67, 98 (1977).
5. C.J. Nonhof, Polym. Eng. Sci., 36, 1184 (1996).
6. B. Marczis and T. Czigany, Muanyag es Gumi, 40, 127(2003).
7. V.K. Stokes, Polymer, 40, 6235 (1999).
8. V.K. Stokes, Polymer, 41, 4317 (2000).
9. V.K. Stokes, Polymer, 42, 775 (2001).
10. V.K. Stokes, Polymer, 42, 7477 (2001).
11. C.J. Nonhof and G.A. Luiten, Polym. Eng. Sci., 36, 1177(1996).
12. A. Benatar and Z. Chang, Polym. Eng. Sci., 29, 1699 (1989).
13. V.K. Stokes, Polym. Eng. Sci., 28, 718 (1988).
14. V.K. Stokes, Polym. Eng. Sci., 28, 728 (1988).
15. V.K. Stokes, Polym. Eng. Sci., 28, 989 (1988).
16. V.K. Stokes, Polym. Eng. Sci., 28, 998 (1988).
17. V.K. Stokes, Polym. Eng. Sci., 43, 1523 (2003).
18. P. Mitschang, R. Rudolf, and M. Neitzel, J. Thermoplast.Compos. Mater., 15, 127 (2002).
19. H. Potente, O. Karger, and G. Fielger, Macromol. Mater. Eng.,287, 734 (2002).
20. V.A. Kagan, R.G. Bray, and W.P. Kuhn, J. Reinforc. Plast.Compos., 21, 1101 (2002).
21. V.A. Kagan and G.P. Pinho, SPE Conf. Proc. (ANTEC 2000),1, 1182 (2000).
22. Handbook of Plastic Joining: A Practical Guide, Plastic De-sign Libary, Norwich (1996). PDL Handbook Series.
23. B.E. Turner and J.R. Atkinson, SPE Conf. Proc. (ANTEC1989), 1, 499 (1989).
24. Bestimmung der Zugeigenschaften, DIN EN ISO 527–3, Deut-sches Institut fur Normung, Berlin 1996.
25. V.L. Anderson and R.A. McLean, Design of Experiments: ARealistic Approach, Marcel Dekker, New York (1974).
26. P.J. Ross, Taguchi Techniques for Quality Engineering,McGraw-Hill, New York (1996).
27. S. Kemeny and A. Deak, Kıserletek tervezese es ertekelese,Muszaki Konyvkiado, Budapest (2002).
28. M.W. Zemansky and R.H. Dittman, Heat and Thermodynam-ics, 6th ed., McGraw-Hill, New York (1981).
29. J.M. Kay and R.M. Nedderman, Fluid Mechanics and Trans-fer Processes, University Press, Cambridge (1988).
30. J.R. Welty, C.E. Wicks, and R.E. Wilson, Fundamentals ofMomentum, Heat and Mass Transfer, 3rd ed., Wiley, NewYork (1984).
31. B. Marczis and T. Czigany, Int. Polym. Proc., 21, 141 (2006).
DOI 10.1002/pen POLYMER ENGINEERING AND SCIENCE—2006 1181