Embed Size (px)
Citation preview

CHAPTER 4
INTERPRETING THE PROBATIVE VALUE OF DNA TYPING: POPULATION GENETICS AND STATISTICAL ANALYSIS
Once a DNA match has been declared, the other difficult task of the
scientist is to interpret it.' Like traditional fingerprinting, DNA evidence is not
based on certainty but on some probability analysis.' Occasionally a DNA
fingerprinter would say that there is one chance in 50000 or 500000 that a
randomly selected Hispanic male have the same DNA profile as that found in
both crime scene sample and the sample collected from the accused. In this
connection the scientist must ans~wer two fundamental questions in order to
accept his result. They are (1) what is the probability of the crime scene profile if
it came from the accused? (2) What is the probability of the crime sample profile
if it came from some unknown p e r ~ o n ? ~ Therefore, a scientist who had
performed the DNA typing must establish the uniqueness of a match. A paper
published by D.J. Balding providc?~ a clear understanding of calculating the
probability that the accused is the person who possesses a given DNA p r ~ f i l e . ~
1 In a DNA typing it is easy for the ssientist to exclude a person by saying that there is no match but in the case of declar nga match it is a difficult task for him to establish that the match is a true match. The reliability of a match depends on the reliability'of the assessment made by a scientist in interpreting it^
2 It is the duty of the DNA typing sc~entist not only to say that two samples exhibit the same pattern but also to suggest that the pattern is extremely rare. See, Peter J Neufeld and Neville Colman, "Vlhen Science Takes the Witness Stand". 262 Scientific American 18 (1 990).
3 Normally the reliability of a match probabil~ty always depends on the first question. However, in a forensic testing dus! to the lack of the identity of the actual culprit, it becomes fundamental to answer the second question. See. Richard Lempert, "Some Caveats Concerning DNA as Crin~nal Identification Evidence: With Thanks to the Reverend Bayes", 13 Cardozo L. Rev. 303 (1 991)
See, D.J. Balding. "When can a DNA Prof~le be Regarded as Un~que?", 39 Sc~ence and Just~ce 257- 260 (1999) as quoted in Ian W. Evett. Lindsey A. Foreman. Graham

According to him the uniqueness cd a DNA match depends on the population of
all the other people who can be co-lsidered as possible suspects for the crime at
issue. This hints that all other per:jons in a population must be eliminated from
the probability that any one of the'n may have the same match as the accused
have5 Thus one can come to the conclusion that the smaller the match
probability, the stronger the eviderce in support of the proposition that the crime
sample came from the a c ~ u s e d . ~ Therefore, in order to get reliable DNA
evidence, commentators recommended that a DNA match must be confirmed
only after taking an estimate of "M.3tch Binning ~requenc ies"~ .
Jackson and James A. Lambert, "DNA Profiling: A Discussion of Issues Relating to The Reporting of Very Small Match Probabilities", [2000] Crim L. R. 341 at 350.
5 If the relative frequency of the iricriminating fragment size is large, that means, if many people would have the sarne match, then the said match would have a less probative value. See, David H. Kaye, "DNA Evidence: Probability. Population Genetics and the Courts". i' Harv. J. L. & Tech. 101 (1993).
6 However, some commentators has stated that there is no need to make a probability estimate from the DNA match made by a scientist who had followed a proper laboratory protocol. For example, Andre A. Moenssens in his article published in Jurimetrics journal has commented as follows:
Evidence of DNA match macle by a scientist who followed the proper laboratory protocols is admissible without drawing statistical inferences there from. A witness can simply testify to having performed the necessary steps and having determined that the two samples examined match in all their characteristics. The expert, can further, testify that in her experience she has never encountered two different individuals who exhibited the identical DNA characteristics and for that reason the witness's convic:tion of identity can be stated with a reasonable degree of scientific certain ty.... The next step of extrapolating calculations as to the probability of random matches is not an essential step to DNA identification testimony. But inertia being what it is, and serologists having testified for years to mathematical odds against random matches in traditional blood groupings, the practice was inevitably adopied by the DNA profiling community. See. Andre A. Moenssens. "DNA Evidence and its Critics - How Valid are the Challenges", 31 Jurfmet. J. 87(1990).
7 "Match Binning Frequencies" a-e the estimate made by the DNA scientist after comparing the frequencies of tbe alleles found in the crime sample gene with the random samples collected frori the relevant population. For more details see, Richard C. Lewontin and Daniel L. Hartl. "Population Genetics in Forensic DNA Typing". 254 Science 1745 (1991).

2. Population Genetics in DNA Matching
Determination of DNA matching in accordance with the population genetic
setup is one of the most difficult sages in the DNA interpreting process. In this
stage scientists will use random chance of finding another individual with the
same DNA profile within the populaton of all possible suspects.' Before going to the
process it is important to know what is population genetics. Population genetics
means and contains a group of population defined by the anthropological and
ancestral identity of individua~s.~ Thus for forensic purposes the reference
population is divided into certain major racial or sub groups like Caucasians,
Blacks, Hispanics etc. Some groups were again sub divided considering the
geographical aspects. Thus once the ethnic group of the suspect has been
identified from his physical appearance or by other means. DNA frequencies can
be determined using populat~on databases.
3. Method o f Calculating Random Match Probabilities
In forensic DNA typing if a DNA collected from the crime scene matches
with the sample collected from the suspect, the scientist must prove that the
suspect is the only possible source: of the specimen." The inference is based on
8 See, Richard A. Nakashima. "DNA Evidence in Criminal Trials: A Defence Attorney Primer". Neb. L. Rev. 444 (1995).
9 See. Neil J. Risch and B. Delvin, "On the Probability of Matching DNA Fingerprints". 255 Science 717 (1992); Richard A. Nakashima, DNA Evidence in Criminal Trials. Ibid.
I 0 The probative value of the DNA evidence always depends on the "random match probability" estimate given by the scientist The smaller the match probability, the stronger the evidence in support of the proposition that the crime sample came from the suspect. Therefore, to catch this uniqueness, scientific studies recommends increasing the number of locts to get smaller match probabilities. In England, with the help of a new techn~que known as "SGM plus" they are analyzing more than 10 loci, producing the match probability in the range of 1 in 10 billion to 1 in 100 trillion. See, Ian W. Evett and Lindsey A. Foreman, "DNA Profiling: A Discussion of Issues Relating to the Reporting of vely Small Match F'robabilities". [2000] Grim. L. R. 341at 347.

two assumptions generally accepted in the forensic DNA community. They are
(1) Hardy-Weinberg Equilibrium ancl (2) Linkage-Equilibrium.
4. The Hardy-Weinberg Equilibrium in Forensic DNA Typing
The underlying principle of Hardy-Weinberg equilibrium is that allele and
genotype frequencies do not change from one generation to next. An English
mathematician Godfrey Hardy ancj a German physician Wilhelm Weinberg
discovered the equation." In forensic DNA typing, Hardy-Weinberg law justifies
the assumption of statistical indepeidence implicit in formulas used to calculate
the probability that the DNA patterns of a specimen and of a suspect would
match by chance alone.12 The basics of Hardy-Weinberg law is as follows:
If two heterozygous individuals mates (a gene having 'B' as a dominant
allele and 'b' as the recessive allsle) their offspring will inherit the alleles as
follows: (1) 25% of their offspring's will be homozygous for the dominant alleles
"BB" (2) 50% are heterozygous like their parents "Bb" and (3) 25% are
homozygous for recessive allele " b b and were different from their parents.
Results of random union of the two gametes produced by two individuals.
each heterozygous for a given trait. As a result of meiosis, half the gametes
produced by each parent which carry allele B; the other half allele carry allele b.
Here 0.25 alleles will be BB, 0.25 alleles will be Bb, 0.25 alleles will be Bb and
the balance 0.25 alleles will be bb.
Results of random union of the gametes produced by an entire population
with a gene pool containing 80% B and 20% b may result in 0.64% allele as BB,
11 M. Krawczak and J. Schmidtke, DNA Fingerprinting (2"d ed. Bios Scientific Publishers, 1998). p.65.
12 Technical Comments. "Forensic DNA Tests and Hardy-Weinberg Equilibrium". 252 Science, 1038 (1991)

0.16 allele as Bb, 0.16 allele as Bb and the balance 0.04 alleles as bb. The
respective 0.64%. 0.32% and 0.040/0 were got from the calculation as follows:
64% homozygous for BB i .e 11.8 x 0.8 = 0.64.
32% Bb will be heterozygotes i.e. 0.8 x 0.2 x 0.2 = 0.32.
4% bb will be homozygous i.e. 0.2 x 0.2 = 0.04
Thus 96% of the generation will be homozygous and the balance 4% will
be heterozygous.
Keeping this calculation in mind one has to consider whether the 0.04%
recessive alleles may disappear in future generations. This does not happen
because after each mating the recessive alleles will be duplicated. The
proportion of the allele b will remain as 0.04% after every generation.
Now one can find out the equilibrium by an algebraic analysis of the
problem using the expansion of the: binomial (a + b) '
Here, if 'a' represents the frequency of one gene in the total number of genes
in a population and 'b' represents the frequency of its single allele. So, a + b = 1.
a2 =the fraction of the population homozygous for 'a'.
b2 = the fraction homozygou:j for 'b' and
2ab = the fraction of heterozygotes.
Here, a = 0.8 and b = 0.2 thus (0.8 + 0.2) = (0.8) +2 (0.8) (0.2) +(0.2)~
= 0.64 + 0.32 + 0.04
Here b2 = 0.04. so b = 0 2, the frequency of the b allele in the total
population. Since a + b = 1, a = 0.8 and allele B makes up 80% of the gene pool.

Because B is completely dominant over b, one cannot distinguish the Bb alleles
from the 66 ones by their phenotype. But substituting in the middle term (2ab) of
the expansion gives the percentags of heterozygous alleles. 2ab = (2)(0.8)(0.2)
= 0.32. So, recessive genes do not tend to be lost from a population no matter
how small their representation.
Thus Hardy-Weinberg law z.hows that gene frequencies and genotype
ratios in a randomly breeding population remain constant from generation to
generation". However, Hardy-Weinberg law had certain limitations. Hardy-
Weinberg law can be applied only if following conditions are satisfied: (1) The
population must be large; (2) The mating must be a random mating; (3) No
mutation must be there. The frequency of gene 'B' and its allele 'b' will not be in
Hardy-Weinberg equilibrium if the sene 'B' and its allele change due to mutation.
However, scientists opined that mutation only play a minute role in evolution;
(4) No gene migration. All human beings are made up of genes of the population
in their own locality. If the members of one population mated with the members
of another, the local population of that particular area may develop a distinct
gene pool; (5) No genetic drift. If the population is so small then there is a
chance that certain essential rnemt~ers to constitute a gene pool may eliminated.
If so the frequency of an allele may begin to drift toward higher or lower values.
13 See, Lorne T. Kirby. DNA Fingerprinting- An Introduction (M. Stockton Press. 1990), pp.168-171; M. Krawczak and J. Sschmidtke, DNA Fingerprinting (Bios Scientific Publishers. 1998), pp.65-67: Ian W. Evett and Bruce S. Weir, Interpreting DNA Evidence: Statistical Genetics fo., Forensic Scientists (Sinauer Associates. Inc.. Sunderland. Massachusetts, 1998:; Technical Comments. "Forensic DNA Tests and Hardy-Weinberg Equilibrium". 252 Science 1038 (1991); John J. Wash, "The Population Genetics of Forensic DUA Typing : Could it Have Been Someone Else?". 34 Crim L. Q. 469 (1992).

5. Linkage Equilibrium
Linkage equilibrium is an assumption, which means that all the genotypes
at each locus are randomly assorted within the population. This allows the
calculation of the probability of each independent locus by the product rule. For
example one can multiply the match of five independent loci to get the total
probative value. This will be use f~ l only in multi locus fingerprinting and not in
single locus.
6. How Frequency of Alleles Calculated
The application of populatior~ genetics in forensic DNA fingerprinting is to
determine the frequency with whici a specific allele occurs within a given ethnic
group. If the frequency of the allele in question is. quite common in the concerned
population, the probative value of the evidence will be very low and it gains no
value in forensic purposes. If the likelihood of matches in the defined population
is reduced, that gives DNA identification technology more value in forensic
examination. For example, the Rh-.positive blood types are common; therefore a
scientist will give evidence that its frequency in the relevant population is large.
At the same time the Rh-negative allele was found in the general population in
somewhat uncommon and hence its frequency is very high. However, in the
case of DNA fingerprints, scientists are using the alleles that occur in the
polymorphic section of the genonie, hence the likelihood that the samples will
match is much smaller. Therefore, it is necessary to determine the frequency
with which each individual allele occurs in a particular population. The
determination starts with the fincing of the frequency of the individual bands
(alleles) in the autorad. This is by a method adopted by the United States

Federal Bureau of Investigation called "binning"'4. The FBI in a scientific paper'5
published this method and it has k e n elaborately discussed in a leading United
States decision, United States v. ~et?". The method was summarized as follows:
The FBI in their laboratory has developed a table of frequencies. The
frequencies of the alleles correspc~nding to the DNA sample that is being tested
are then determined by reference to this table. For constructing the reference
table they have developed a method called "fixed bin method". As a first step FBI
has randomly collected the DNA samples of 200 or 300 persons from the
relevant population (normally Caucasian for Americans). Then these collected
DNA's were subjected to DNA fingerprinting using five or six probes, the
laboratory routinely uses or intended to use. Then the loci identified by these
probes were assigned to the predetermined bin. DNA forensic laboratories are
regularly using "size markers"" in the R.F.L.P: typing process. The bins were
established with reference to the size markers that were applied in each test.
With the help of these size markers an allele (band) was determined to have a
particular fragment size and it w o ~ l d be placed in the bin, which included that
size. Thus each random sample c.ollected from the population data base were
tested by the probes and each of the alleles (bands) detected are put in the bin
14 Binning is a method generally usecl for determining the individual band frequencies. l5 Bruce Budowle, John Waye et al , "Fixed Bin Analysis for Statistical Evaluation on
Continuous Distribution of Allele Data from VNTR Loci for use in Forensics". 48 Am. J. Hum. Genet. 841-855 (1991).
j6 134 F.R.D. 162 (N. D. Ohio 1991) 17 The testing laboratories use the size markers during gel electrophoresis. The size
markers are solutions composed of DNA fragments of known, predetermined fragment lengths. During gel electrophoresis they will run adjacent with test DNA's. After the completion of the proces:j they will finally appear in the autorad as an array of bands. The length of the sample DNA can easily trace out with the help of this size markers because the length of the fragments of size markers are known lengths. By comparing the size of the test DNA fragments with the size marker fragments, which is nearest in location to the test DNA fragments, their correct length can be determined. See. U.S. v. Yee, /bid at 172,

corresponding to its base pair siz:e as determined by the size markers on the
gel" In fixed bin method, a bin would consist of all alleles falling in between two
adjacent DNA markers. The frequency of any allele in this bin would be defined
as frequency of all alleles in the bi i . Any allele identified will fall within one of'the
fixed bins and will be assigned a frequency based upon that bin. The FBI was
applying a standard safety me:3sure known as "collapsing" the bins that
contained less than five bands (alleles). The frequency of each bin is determined
by dividing the total number of bands located in a bin by the total number of
bands generated from all the data base samples tested for that probe." If the
frequency for various bands were determined the overall frequency for the DNA
profile is calculated. This calculation is made by probe by probe basis i.e. the
frequency of the bands under a single probe will be calculated at one time. Thus
frequencies of the bands under all the probes will be calculated one by one.''
7. Calculation of the Frequency of Bands in Homozygote and Heterozygote Bands
After the completion of the GNA analysis, the DNA profile at a single profile
may shows two bands or one band. If the DNA profile shows two bands they are
called heterozygote and .f the DNA profile shows only one band it is
homozygote. The frequency cal(:ulation in homozygote and heterozygote is
different. In the case of heterozygote the FBI calculates the frequency by using a
formula taken from the Mendelian genetics2' The formula is 2pq. Here 'p' is the
bin frequency associated with one band and 'q' is the frequency associated with
'' John J. Wash, "The Populat~on Genetics of Forensic DNA Typing: Could it Have Been Someone Else?". 34 C r ~ m 1.. Q. 469 at 473 (1992).
1s See. U.S. v. Yee. 134 F R.D. 161;at 172 (N. D. Ohio 1991). 20 lbld.
2' Ibld.
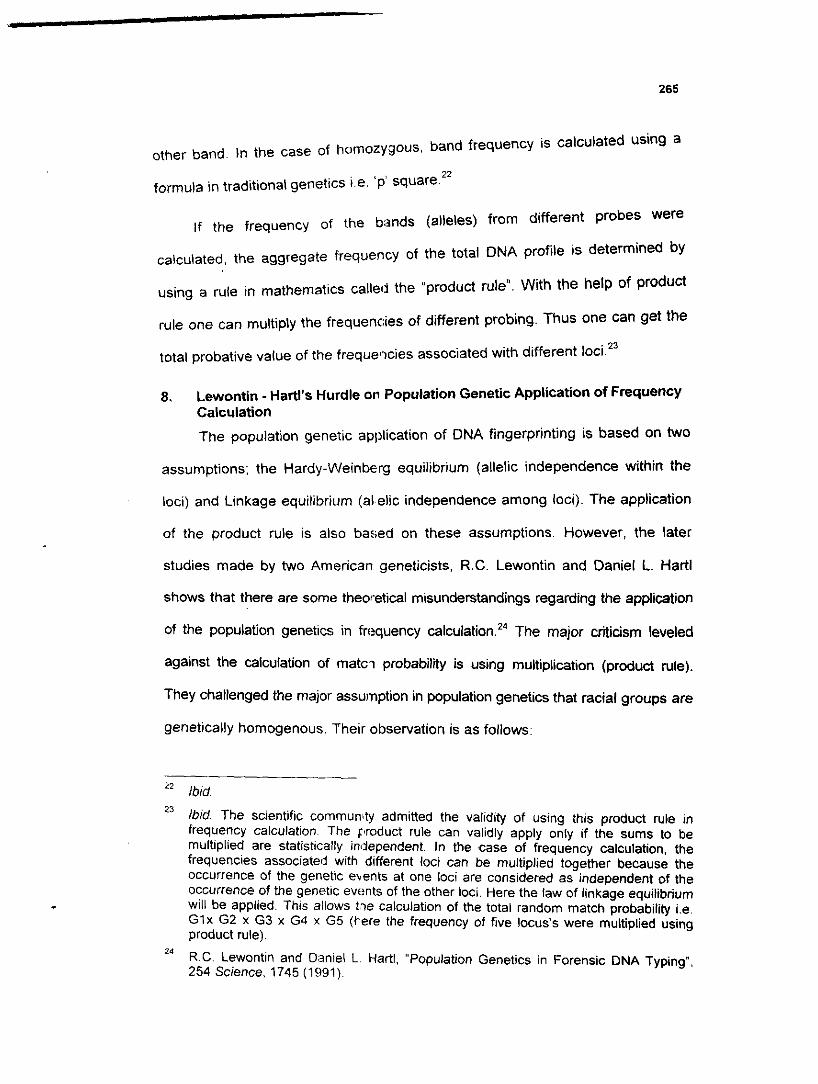
other band. In the case of homozygous, band frequency is calculated using a
formula in traditional genetics i e . 'p' square.22
if the frequency of the bands (alleles) from different probes were
calculated, the aggregate frequency of the total DNA profile is determined by
using a rule in mathematics callell the "product rule". With the help of product
rule one can multiply the frequencies of different probing. Thus one can get the
total probative value of the freque'>cies associated with different
8. Lewontin - Hartl's Hurdle on Population Genetic Application of Frequency Calculation
The population genetic application of DNA fingerprinting is based on two
assumptions; the Hardy-Weinberg equilibrium (allelic independence within the
loci) and Linkage equilibrium (a1 elic independence among loci). The application
of the product rule is also based on these assumptions. However, the later
studies made by two American geneticists, R.C. Lewontin and Daniel L. Hartl
shows that there are some theoretical misunderstandings regarding the application
of the population genetics in frequency cal~ulat ion.~~ The major criticism leveled
against the calculation of m a t c ~ probability is using multiplication (product rule).
They challenged the major assumption in population genetics that racial groups are
genetically homogenous. Their observation is as follows:
22 lbld. 23 lbld The scientific community admitted the validity of using this product rule in
frequency calculation. The f'roduct rule can validly apply only if the sums to be multiplied are statistically independent. In the case of frequency calculation, the frequencies associated with different loci can be multiplied together because the occurrence of the genetic ebents at one loci are considered as independent of the occurrence of the genetic evc?nts of the other loci. Here the law of linkage equilibrium will be applied. This allows tne calculation of the total random match probability i.e. G l x G2 x G3 x G4 x G5 (i-ere the frequency of five locus's were multiplied using product rule).
24 R.C. Lewontin and Daniel L Hartl. "Population Genetics in Forensic DNA Typing", 254 Science, 1745 (1991)

Both these claims are base19 on misinterpretations of population genetics
theory. More importantly, they ignore a considerable body of evidence
indicating genetic substructure within what are called the 'Caucasian",
"black, and "Hispanic' populations. The census populations designated
"Caucas~an", "black", and "H spanic" are actually each made up of multiple
sub populations that are genetically diverse. Consequently, with current
available data, the current method of estimating the probability of a match
by multiplying together the frequencies with which of individual VNTR
pattern occurs in a referen,:e database is unjustified. Furthermore, the
magnitude and direction of the error depends on the particular VNTR locus,
the bands observed, and the reference database. Hence, it cannot be
ascertained whether the estirnates as currently calculated are biased for or
against any particular defendant. On the other hand, although the current
method 1s flawed. ~t is not rretrievable, and not suitable data could be
gathered that would allow acceptable estimates to be made. Perhaps a
better solution would be to abandon the current method altogether and
replace it with one or more of the alternative appro ache^....^^
Thus the study conducted by Lewontin and Hartl shows that there are
varying subgroups in the major ethnic groups like Caucasian, Blacks and
Hispanics. The presence of these: subgroups with varying DNA patterns may
contradicts the assumptions that g ~arantee independence of alleles at a specific
locus and makes doubt on the validity of multiplying "genotype' frequencies
across According to them, these ethnic subgroups within each database
25 lbid. at 1746. Dr. Richard Lewontin had testified these aspects in Yee and in US, v. Jakobetz, 747 F. Supp. 250 (D. Vt., 1990).
26 See, David H. Kaye. "DNA Evidence: Probability, Population Genetics, and the Courts", 7 Ham J. L & Tecli 101 .at 127-128 (1993).

tend to mate endogamously (i.e. within a specific subgroup) with persons of like
religion or ethnicity or who lives within close geographical distance. Such
endogamous mating tends to maintain genetic difference between subgroups.
This may result in the differences in the DNA frequencies of a given DNA
fragment. A DNA fragment, which is common in some subgroups, may not be
included in the major ethnic group like Hispanic or Caucasian. Thus there is no
reference "Caucasian" database that would be meaningful for all these different
subgroups. Moreover, they argue that a VNTR combination that is very rare in
reference database might, for exatnple, be much more common in the suspect's
particular group, thus raises the chances that he will be incorrectly identified as
the criminal. After the evaluation they came to the conclusion that the probability
of the random match of a given VNTR phenotype should not be estimated for
Caucasians, Blacks and Hispanics, with the present method of multiplication and
the databases presently available. Instead they have propounded certain
alternatives. Among them the relevant thing to be considered is to look at the
allele frequencies within each sut)group and then multiply them along with the
common alleles in the racial group.
However, later studies conducted by certain biostatistician's shows that the
fear about population substructure is baseless. Studies conducted by two
biostatistician's. Neil J. Risch and Bernard Delvin on the frequency of matching
alleles for large numbers of pairs of different people in laboratory databases
shows no false matches across four or five loci and rates of matches on subsets

of loci that do not depart markedly from the expected values given independence
of alleles across locii2' Regarding this they observed:
The observed independence of matching among loci, both in the FBI and
Lifecodes data sets, pro\fides no support for claims of linkage
disequilibrium within ethnic groups. Indeed, if linkage disequilibrium among
loci does exist, it has little! effect on the probability of two random
individuals having matching genotypes ... . Although we find the probability
of a matching DNA profile between unrelated individuals to be vanishingly
small, especially at five loci, related individuals, in particular identical twins
and siblings, have a far greater probability of matching genotypes. For
identical twins, the probability is 1.0, while for siblings it is (0.25) or 0.001.
Therefore, in the forensic setting, we conclude that an innocent suspect
has little to fear from DNA evidence, unless he or she has an evil twin.''
In order to settle the conflict on population sub structure between the two
major groups in the scientific community, National Research Council of United
27 See. Neil J. Risch and B. Devlin, "3n The Probability of Matching DNA Fingerprints". 255 Science 717 (1992).
28 Ibid, at 19-20. Similar critic~sm has also glven by other two scientists in population genetics. According to them Lewcntin and Hartl's claim against population genetics was wrong. They pointed out that Lewontin and Hartl's use old and inappropriate blood group data to bolster their contention that allele frequency differences between human groups might affect the calculated probability of match between two samples. Moreover they argued as follows:
Lewontin's work is often cited 3s showing that substantial genetic variation exists within the major racial groups. However, when Lewontin's approach is applied to smaller levels of population structure, the majority of genetic differences are still found to be within villages or oarishes. These results demonstrate the truism of biological diversity of individuals, even in extremely subdivided groups. The reality of human evolution Shows that even though marital preference is nonrandom at every level at which one can define populations, its effect on deviation from HWE of genotfpe frequencies of l~nkage equilibrium is minimal. No new population genetic principles are needed to apply this thesis to forensic DNA typing. See, Ranajit Chakraborty and Kenneth K. Kidd. "The Utility of DNA Typing in Forensic Work, 254 Science, 1735 (1991).

States implemented a new principle known as "cei~ing".'~ The principle provided
in the report of the committee is ;as follows. The rule says that the traditional
multiplication method will give better results even if there is a sub stratum in the
ethnic group. The ceiling method involves two important steps (1) For each allele
at each locus, determine a ceiling frequency that is an upper bound for the allele
frequency that is independent of tkie ethnic background of a subject; and (2) To
calculate a genotype frequency, ~ p p l y the multiplication rule, using the ceiling
frequencies for the allele frequencies. Committee suggested that random
samples of 100 individuals must t)e drawn from each 15-20 populations, each
representing a group relatively ho~nogeneous genetically; the largest frequency
in any of these populations or 5%.30 whichever is larger, should be taken as the
ceiling frequency. For example, if two locus has been studied in two populations,
allele 'A' of the locus 1 in the Indian and English population shows the frequency
of 7% and 10% and allele '6' sho~vs the frequency of 12% and 9%. Allele 'C' of
the locus 2 shows the frequency of 3% and 6% and allele 'D' shows the
frequency of 9% and 13% respectively, the ceiling rule will assign the values as
10% for allele 'A', 12% for allele 'I?'. 6% for allele 'C' and 13 % for allele 'D ' .~ '
The ceiling principle was seriously criticized by the scientists as having no
statistical or genetic f~unda t i on .~~ They argue that the principle was too
29 See. National Research Council Oommittee on DNA technology In Forensic Science, (National Academy Press, Washiiigton DC. 1992).
30 A minimum of 5% is considerad as mandatory for each allele and should be substituted if the frequency estim.att? is small in all groups.
31 For more details see. M. Kranzak and J. Schmidtke, DNA Fingerprinting (Bios Scientific Publishers, 1998), pe l ; News and Comment, "Forensic DNA Goes to Court With 0 . J ". 265 Science 1362 (1994).
32 For criticisms see. Richard Lemilert. "DNA. Science And The Law: Two Cheers for the Ceiling Principle". 34 Jurimet J. 41 (1993); Devlin, Risch and Roeder. "Statistical Evaluation of DNA Fingerprinting: A Critique of The NRC's Report". 259 Science 748 at 749 (1993).

conservative and erroneous. Therefore, the National Research Council in its 2"d
report abolished the ceiling principle and recommended to follow the normal
method of calculating match p r ~ b a t ) i l i t y . ~ ~
The other important limitation while interpreting the match of a DNA test
result is the chance of having simJar match to any of the near relatives of the
suspect. The probability that the forensic sample would match a relative of the
person who left it is considerably greater than the person who is selected
randomly from the general population. An individual will receive half of the genes
from his father and another half from his mother, therefore it is very difficult to
distinguish between siblings 1.e. between brother and brother or sister and sister.
A far simpler and straightforward approach suggested is to obtain profiles from
near relatives to establish uneq~ivocally whether a relative has an identical
9. Statistical Interpretation of DNA Profiles
It is an accepted fact amcng scientists in the scientific community of
forensic DNA Fingerprinting that IINA test results are meaningless unless it is
conveyed to the court in a statist cal form.35 There are matnly two reasons for
this (1) like traditional fingerprinting, the value of the DNA evidence is not certain.
It depends on the probabilistic c;alculation. (2) Because of the involvement of
- 33 See, The Committee of The Natim~nal Research Council. The Evaluation of Forensic
DNA Evidence (National Academy Press, Washington DC., 1996). 34 Roeder K "DNA fingerprinting: A Review of the Controversy". 9 Statistical Sc~ence
222 (1994) as quoted in Barbara Ann Hocking. Hamish McCallum. Alison Smith. and Chris Butler, "DNA, Human Rights and The Criminal Justice System". Austl. J. Hum. R. 9 (1997).
35 According to Walls. "Among foreisic scientists there is a growing recognition that in many cases the results obtainecl yield their maximum information only if statistical methods and calculations of probability are used. See, Walls. "Ten Years of Forensic Science 1964-73. [I9741 Crirn. L. R. 505; see also William C. Thompson. "Are Juries Competent to Evaluate Statistical Evidence". 52 L. & Conternp. Probs. 9 (1989).

population genetics, the probability of a match report could be given only in
numerical terms3%owever, there is a difference of opinion among persons in
this field that whether judges are capable in evaluating the probabilistic statistical
testimony provided by the DNA scientist^.^' The general concern regarding this
is that judges may admit technical evidence at its face value without any
evaluation either because of their ignorance in the subject or due to a special
status given to the technical witnesses or their subject.36
In the previous topic it is clearly dealt with the importance of the application
of the procedures regarding the estimation of the frequency of the DNA match
profile in the population concerned. However, this estimation in itself is not
enough to provide a sufficient basis for the judiciary in determining the guilt or
innocence of an accused. What co i~r t needs from an expert is the likelihood ratio.
which provides the probability of the evidence given guilt and the probability of
the evidence given innocence. Nevertheless, an expert is not expected to state the
guilt or innocence of the accused. ,which is exclusively within the province of the
36 However, in some laboratories tb,ey are using a different method to convey the evidentiary value of DNA test results. For example, in England, the Forensic Science Service (FSS) Laboratory at Birmiqgham uses a set of descriptive terms to explain the strength of matching probabilities. They use certain English terms in an ascending order to convey the strength of evidence: inconclusive, weak support. moderate support, moderately strong support, strong support, very strong support and conclusive.
37 Some commentators expressed doubt on judges' capacity in understanding statistical inference made by the scientists, whereas others made a strong confidence on judges. For more details see. D.E. Bernstein, "Junk Science in The United States and Commonwealth". 21 Yale J. lntl. L. 123 (1996); P.W. Huber. Galileo's Revenge: Junk Snence in The Courtroom (New York, 1991); R.J. Allen and J.S. Miller, "The Common Law Theory of Experts: Deference or Education?". 87 Nw.U L. Rev. 1131 (1993); N.J Vimar and R.A. Schuller, "Juries and Expert Evidence: Social Frame Work Testimony", 52 L. & Contemp. Probs. 133 (1989); William C. Thompson. "Are Juries Competent to Evaluate Statistical Evidence". 52 L. & Contemp. Probs. 9 (1989)
38 See. Michael Freeman and Heler Reece, Science in Court (Dartmouth Publishing Co.. Ltd. 1998).

court of law.39 In the leading English decision, R v. Adamsgo, when the Criminal
Appeal Court was considering the evidentiary value of the statistical evidence given
by a forensic DNA expert, Philips LJ, Jowitt and ~ e e n e JJ., observed:
It was important that a scier~tist, in giving evidence, should not go in to
matters, which are for the jury. He should explain the nature of the DNA
match and give the random occurrence ratio; he may be able to say how
many people with matching characteristics are likely to be founding the
United Kingdom or in a more limited sub group. This will often be the limit
of the evidence which he can properly and usefully give. He should not be
asked his opinion of the likelihood that it was the defendant who left the
crime ~ t a i n . ~ '
Thus in this case court ha: given the maximum extent of a scientific
expert's testimony. Moreover, courl gave a suggestion regarding the role of the
expert in explaining the significance of the DNA evidence in the following words:
Provided that he has the necessary data, and the statistical experience, it
may be appropriate for him then to say how many people with the matching
characteristics are likely to be found in the United Kingdom- or perhaps in a
more limited relevant sub group, such as, for instance, the Caucasian
sexually active males in the Manchester area.42
39 Historically, it has been declared through precedents that an expert, whatever his efficiency in the field he has, is not allowed to express an opinion on the issue which the court had to decide (the so called Ultimate issue rule) see. R v. Anderson and Others, [I9711 3 All ER 1152 and State v. PaliRam. AIR 1979 S.C. 14.
41 Ibid. at 671. In this case the DNA expert gave evidence that he was sure that the accused was the offender.
42 lb~d.

Thus from the above discussion it is submitted that the calculation of a
scientific DNA evidence always csme before a court of law in a probabilistic
manner. The great task of a judicial officer starts here. He is not only concerned
with the evaluation of the scientific evidence on record but also other non-
scientific evidence, which may have an equal or more probative value. Here he
has to combine the evidentiary value of both scientific and non-scientific
evidence in an equal proportion. In this situation an important difficulty, which
has been regularly faced by courts,, are that in almost all criminal trials in which
scientific evidence is adduced, prosecutors may present the evidence favorable
to them. For example, assume that the frequency of a DNA profile is 1 in a
million and that there is a match of the defendants profile and the DNA sample
collected from the forensic sample, the prosecutor may express that there is only
1 in a million chance that the defendant is innocent. This is called as 'The
Prosecutors F a l ~ a c y " . ~ ~ The correct statement prosecutor ought to have given
regarding this is "the chance of obtaining this DNA profile if the DNA in the
43 Thompson and Schumann coined the phrase "The Prosecutors Fallacy". They have also coined another phrase known as the "Defense Attorney's Fallacy". Under this phrase the defense attorney when faced with the frequency of a DNA profile of 1 in a million may say that this implies that in a country, which has a population of 300 million, 300 individuals possess the same DNA profile, all of which could have committed the crime. He may further argue that any one of those 300 individuals could have committed this crime z~nd how court can reliably come to the conclusion that the accused in this case has committed the crime. See, Thompson, WC and Schumann, EL, "Interpretation of Statistical Evidence in Criminal Trials: Prosecutors Fallacy and Defence Attorneys Fallacy", 11 Law and Human Behavioor 167 (1987) as quoted in Bernard Robertson arid G.A. Vignaus, Interpreting Evidence: Evaluating Forensic Science in The Court Room (John Wiley and Sons, 1995), p.91 Bernard Robertson has stated that these fallacies can eliminate through a balanced approach by comparing the probabilities of the evidence given both the prosecution and the defence stories. Thls gives one a likelihood ratio, which tells the value of the evidence and the impact that it :should have on the case as a whole. See also. Balding and Donnelly. ''The Prosec:utors Fallacy and DNA Evidence". [I9941 Crim. L. R. 71 1; Mathews. " Improving the Odds on Justice". New Scientist 12 (1994).
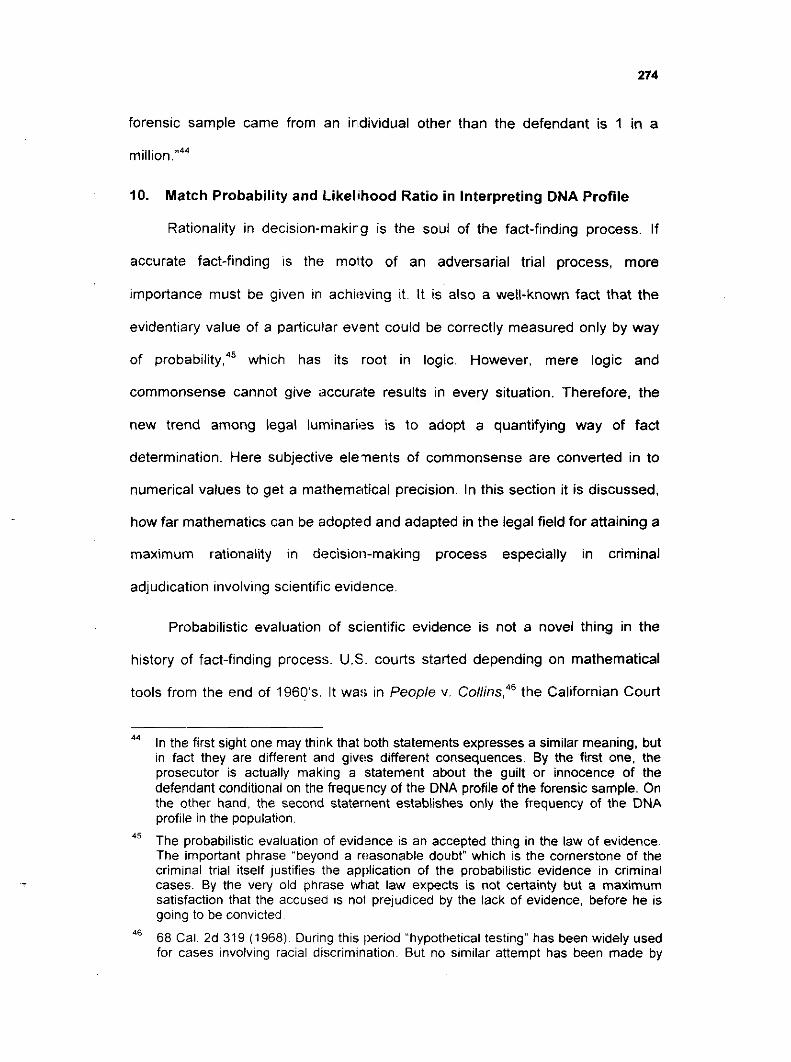
forensic sample came from an ir~dividual other than the defendant is 1 in a
10. Match Probability and Likelihood Ratio i n Interpreting DNA Profi le
Rationality in decision-makirg is the soul of the fact-finding process. If
accurate fact-finding is the motto of an adversarial trial process, more
importance must be given in achieving it. It is also a well-known fact that the
evidentiary value of a particular event could be correctly measured only by way
of probability,45 which has its root in logic. However, mere logic and
commonsense cannot give accurate results in every situation. Therefore, the
new trend among legal luminaries is to adopt a quantifying way of fact
determination. Here subjective elenents of commonsense are converted in to
numerical values to get a mathematical precision. In this section it is discussed,
how far mathematics can be adopted and adapted in the legal field for attaining a
maximum rationality in decision-making process especially in criminal
adjudication involving scientific evidence.
Probabilistic evaluation of scientific evidence is not a novel thing in the
history of fact-finding process. U.S. courts started depending on mathematical
tools from the end of 1960's. It was in People v. Collins,46 the Californian Court
44 In the first sight one may think that both statements expresses a similar meaning, but in fact they are different and gives different consequences. By the first one, the prosecutor is actually making a statement about the guilt or innocence of the defendant conditional on the frequency of the DNA profile of the forensic sample. On the other hand, the second statement establishes only the frequency of the DNA profile in the population.
45 The probabilistic evaluation of evidence is an accepted thing in the law of evidence. The important phrase "beyond a rc?asonable doubt" which is the cornerstone of the criminal trial itself justifies the application of the probabilistic evidence in criminal cases. By the very old phrase what law expects is not certainty but a maximum satisfaction that the accused 1s not prejudiced by the lack of evidence, before he is going to be convicted
46 68 Cal 26 319 (1968). During this lperiod "hypothetical testing" has been widely used for cases involving racial discrimination. But no similar attempt has been made by

of Appeal considered the legalit/ of the evidence adduced by the prosecution
completely depending on the statistical inference made by an instructor of
mathematics. The brief facts of the case reveal that the accused Collin and his
companion was arrested and tried by the State for the offence of-robbery. When
the case came up for trial, the prosecution has produced a mathematical
instructor as an attempt to e s t a t h h the guilt of the accused with the help of
certain formulas in mathematics. As a first step, prosecutor has formulated
certain characteristics of the accused basing on victims descriptions, such as the
accused was a Negro man, had a mustache and beard, drove an yellow car with
a girl having a blond pony tail hair After the narration he assigned certain values
(probabilities) to these characteristics and asked the mathematician to find out
the value of the evidence presented. Applying the "product rule" he multiplied
these probabilities and concluded that the figure of 11 12,000,000 represented
the probability of any couple possessing all the characteristics of the a c ~ u s e d . ~ '
The jury conv~cted both accused. They preferred appeal to the Supreme Court of
California, reversing the convictior~ of the trial court on several grounds. One of
the main grounds was that the court as unwarranted in this case found the
the court in applying this testing to forensic evidences like fingerprinting and blood group analysis. However, court warned that statistical evidence should not be used without evaluating it by a proper hypothetical testing. Regarding this a US. Criminal Appellate Court has stated that:
When a litigant seeks to prove his point exclusively through the use of statistics, he is borrowing the principle 0.: another discipline, mathematics.. . . He cannot be selective in which prtnciple:; are applied. He must employ a standard mathematical analysis. Any otier requirement defies logic to the point of being unjust. Statisticians do not sirrply look at two statistics . . and make a subjective conclusion that the statistics are significantly different. Rather, statisticians compare figure through an objective process known as hypothesis testing. See. Moultrie v. Martin, 690 F 2d 107'8 at 1082 (4Ih cir. 1982).
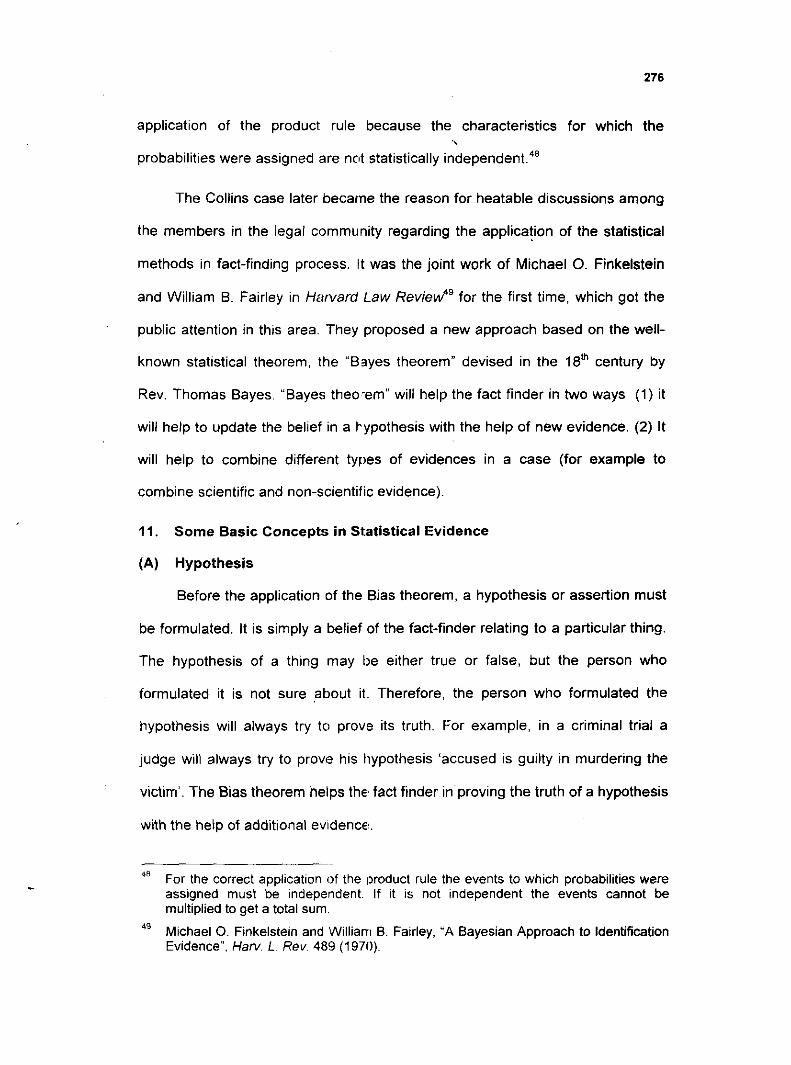
application of the product rule because the characteristics for which the ,
probabilities were assigned are not statistically inde~endent.~'
The Collins case later became the reason for heatable discussions among
the members in the legal community regarding the application of the statistical
methods in fact-finding process. It was the joint work of Michael 0. Finkelstein
and William B. Fairley in Hanard Law ~ e v i e w ~ ' for the first time, which got the
public attention in this area. They proposed a new approach based on the well-
known statistical theorem, the "Bayes theorem" devised in the isth century by
Rev. Thomas Bayes. "Bayes theo-em" will help the fact finder in two ways (1) it
will help to update the belief in a t-ypothesis with the help of new evidence. (2) It
will help to combine different types of evidences in a case (for example to
combine scientific and non-scientific evidence).
1 Some Basic Concepts in Statistical Evidence
(A) Hypothesis
Before the application of the Bias theorem, a hypothesis or assertion must
be formulated. It is simply a belief of the fact-finder relating to a particular thing.
The hypothesis of a thing may lbe either true or false, but the person who
formulated it is not sure about it. Therefore, the person who formulated the
hypothesis will always try to prove its truth. For example, in a criminal trial a
judge will always try to prove his liypothesis 'accused is guilty in murdering the
victim'. The Bias theorem helps the fact finder in proving the truth of a hypothesis
with the help of additional ev~dence
48 For the correct application of the lproduct rule the events to which probabilities were assigned must be independent. If it is not independent the events cannot be multiplied to get a total sum.
49 Michael 0. Finkelstein and William B. Fairley, "A Bayesian Approach to Identification Evidence". Haw. L Rev 489 (1970).

(B) Probability or Odds (Prior and Posterior)
The probability is the scale t)y which the truth of a hypothesis is measured.
Probabilities were formed by ass~~mptions and attributions. It is supported with
evidence as a condition. Therefore one can say that the existence of a probability
depends on the quality of the evidence adduced. For forensic purpose, the value of
probabilities is considered to be in between 0 and 1. If the probability is valued as
0 then one can come to the conc:lusion that the premise is false. On the other
hand if the value of the probability is 1 then the premise is considered as true.
The probability can be demonstrated as percentage if it is multiplied by 1 0 0 % . ~ ~
In a hypothesis testing there will be prior and posterior probabilities. In order to
apply Bayesian theorem for updating the belief of a hypothesis, a judge must
form certain prior probabilities. These prior probabilities are formed before
getting any evidence. For example, to determine the truth of a hypothetical
statement "the accused is guilty in murdering the victim", a judge may take two
prior probabilities (1) the probability that the accused killed the victim, and (2) the
probability that the accused did not killed the victim. The values of these probabilities
were then updated by additional evidence. Regarding this Finkelstein has said:
A judge might improve his performance further by using the statistically
determined prior probability :jolely as a benchmark for what he believed to
be an "average case". Where in his opinion the facts showed that the case
-- so For example. if a probability of 0.07 is multiplied by 100% one will get 70%. For more
details see. Bernard Robertson and G.A. Vignaux, Interpreting Evidence: Evaluating Forensic Science ~n The Court Room (John Wiley and Sons, 1995), pp.11-16; Mike Redmayne. "Science, Evidence and Logic". 59 Mod. L. Rev. 747 (1996); David Hodgson, "A Lawyer Looks at Bares Theorem". 76 Austl. L. J. 109 (2002).

was either stronger or weaker than usual, he could subjectively adjust the
prior accordingly5'
Posterior probability is the value of the prior probability after it is updated
by additional evidence. This posterior probability will again come as a prior
probability if any new evidence is there.
Odds are another form of mathematical method to establish the probability.
Different from probability it will be always in the form of ratios. It will give a clear
idea of how much more likely IS a i assertion is true than it is false. For example,
whether the blood stained cloths found in the possession of the accused is that
of the victim, can be given in odds as 0.50:0.50 i.e. half to half.
( C ) Likelihood Ratio
Likelihood ratio is the ratio between the probability of the further evidence if
the hypothesis is true and the probability of the further evidence if the hypothesis
is false. It was in U.K. for the first time they proved that if the scientific evidence
were presented in likelihood ra t i~s , it would give better results. The National
Research Council of U.S. in its sesond report has stated that computations of the
likelihood ratio for the hypothesis that the defendant is the source of the sample
as a proper In an Australian case R v. ~ a r g e ? ~ an expert explained
likelihood ratio as:
- 51 Michael 0. Finkelstein and William B. Fairley, "A Bayesian Approach To Identification
Evidence", 83 Haw L. Rev 489 :1970). However, the formulation of prior probabilities was seriously criticized, because they were formulated by the judge according to his subjective satisfaction. lgnoranct! about certain necessary facts connected with the predictions may affect the output of the prior probabilities.
52 , See, The Evaluation of Forensic DNA Evidence, Committee on DNA Forensic Science: an Update. National Research Council (National Academy Press. Washington, D.C. 1996).
53 [ZOO21 S.A.S.C. 294.

The likelihood ratio is becoming a more commonly used form of presenting
not only DNA evidence but other forms of forensic evidence. It is based on
the fact that, in a court situation, generally, the court is faced with two
competing scenarios, or poir~ts of view; the prosecution point of view that
the accused has left the crime stain, and the defence point of view, or
hypothesis, which is that so,ne other unrelated person has left the stain.
The calculation we do doesrl't estimate the probability that the person left
the stain, but what we can do is estimate the probability that the crime stain
and the reference sample match, if the accused left it, or if someone else
left it. You can then weigh up those two competing probabilities in what is
called the likelihood ratio.. . .'"
12. DNA Fingerprinting Database for Identifying Criminals
DNA fingerprinting can be used for identifying a real culprit as well as to
exonerate an innocent. Now the policy of the law enforcement machinery in
advanced countries is to catch the real culprits with out making much
disturbance to others. Formation of a DNA database system was evolved from
this forethought. DNA fingerprinting database is simply a database consists of
DNA samples collected from the crime scene or from individual donors.55 It is a
biological profile of a person, which will be kept by the legal machinery as a
permanent record. The normal procedure of every DNA database system is that
if a DNA sample has been obtained in connection with a crime, it is sent to a
DNA laboratory for analysis and the results are stored in a central database.
Once it is stored in the database system, then it can be used for comparing other
54 /bid. at Para 14. '' The list of donor groups ie. who is included in the donor group varies substantially
from jurisdiction to jurisdiction.

samples in the database as well a.5 against the new samples obtained from the
individual donors and the samples collected from the crime scene.56
Initially the database system was formed as an effective tool for crime
solving. It was in United States, ':he worlds first DNA information system was
introduced. The FBI under the United States Department of Justice (DOJ)
formed this in 1989. FBI started this project as a combined DNA index system
(CODIS). CODIS is a software-based system, which contains two indexes. One
index is the convicted offender index contains DNA profiles of felons convicted of
violent crimes and the other index is the forensic index contains DNA profiles
from crime scene^.^' In 1998, the FBI created another system known as the
National DNA index System (NDIS). This is an electronic system in which the
Federal, State and local law enforcement agencies can contribute DNA samples
and thereby activate the DNA database system in finding
In 1995, the world's first DNA database of persons convicted of an offence
punishable by imprisonment was established in the UK.'~ By March 1998, the
database contained the DNA profiles of more than 2,55000 suspects and convicted
persons and 30,000 profiles developed from materials found at crime scenes.60 In
1998, three other European countries, Austria. Germany and Netherlands
introduced their DNA databases."
- 56 See. Paul E. Tracy and Vincent Morgan, "Big Brother and his Science Kit: DNA
Databases For 21" Century Crime Controv, 90 J. Cnm. L. & Criminol. 635 at 642 (2000).
Ibld.
58 lbld. 59 Adrian Linacre, "The UK Nation211 DNA Database", 361 The Lancet 1841 (2003). 60 M~ke Redmayne. 'The DNA D~tabase C~vil Liberty and Ev~dentlary Issues", [I9981
Cnm L R 437 61 See, P.M. Schncider. DNA Databases for Offender Identification in Europe-the need
for Technical. Legal and Political Harmonizatlon, In Proceedings of the 2"6 European

In Australia, at federal level, a national DNA database system known as
the National Criminal Investigetion DNA Database (NCIDD) has been
established. It is operated by the Federal government agency known as Crim
Trac. The database will contain DNA profiles from each of the participating
States and Territories. Profiles mill be shared between jurisdictions. All DNA
profiles held in New South Wale:; databases will be available on the national
database system. Indexes in New South Wales include a missing persons index;
offenders index; suspects index; unknown deceased persons index; volunteers
(limited purposes) index; and a volunteers (unlimited purposes) index. Australian
database system is under the strict control of, Crimes (Forensic Procedures) Act
2ooo.62
The unresolved issue in c;onnection with this topic is regarding the
determination of the list of persons who may be included in the DNA database
system. The type of person to be included in the DNA database differs from
jurisdiction to jurisdiction which includes sex offenders, persons convicted of felony
offences, all persons convicted, persons arrested for felony offences, all persons
arrested, and total population. In UK in March 2003 it was announced that the UK
police will have the right to retain indefinitely the DNA profiles from all people from
whom DNA is collected, whether the person is charged with a crime or not.63 Robert
William and Rony Dunkan in their scientific commentary published in Nature have
Symposium on Human Identification, (Promega Corporation. Madison. WI. USA. 1998), pp.40-44, as quoted in Peter D. Martin. Hermann Schrnitter. Peter M. Schneider. "A Brief History of the Formation of DNA Databases in Forensic Science within Europe". 119 Forensic Sci int. 225-231 at 228 (2001)
62 See. Legal Information Access Centre (LIAC) - Hot Topics, http://www.austlii.edu.au 1databases.html
63 Adrian Linacre. "The UK National DNA Database", 361 The Lancet 1841(2003).

opined that it is better to take DNA profile of all individuals at birth.64 According to
them this tendency would not only act as a deterrent from crime for all members of
the community, but would make the task of catching criminals easier for police.65
The use of DNA database to identify suspects, in effect creates some
personal liberty issues in the mind of persons arguing for human rights.66 They
argued that DNA profile contains data of person's genetic characteristics, and if it
is disclosed tosome others, his privacy will be infringed. But it is clear from the
obse~a t ion made by some scientists that there is no room for such argument.
because the forensic scient~sts are using 'non-coded' loci for identification
purpose. In a non-coded region of DNA, genes are not available; therefore the
storing of DNA database will n o raise any issue against genetic privacy.
However, authorities should take extreme care in disposing of forensic samples
after conducting DNA analysi!:.
. 64 Robert Williamson and Rony Duncan, Commentary, "DNA Testing for All", 418
Nature 585 at 586 (2002).
65 /bid. 66 See, Peter Alldridge. Sanneke 13erkhout. Van Poelgest and Katherine Williams.
"DNA Profiling and the Use of Expert Scientific Witnesses in Criminal Proceedings", in Christopher Harding, Phil Fennel, Nico Jorg and Bert Swart (eds.) CriminalJustice in Europe (Oxford: Clarer~don F'ress, 1995), pp.281-282; see also, Ralph Kirby. Correspondence, "The Many Dar~gers of Relying on a DNA Database". 419 Nature 247-8 (2002).