Embed Size (px)
Citation preview
8/9/2019 Interplay Between Epigenetic Markers Related
http://slidepdf.com/reader/full/interplay-between-epigenetic-markers-related 1/9
Is the Interplay between Epigenetic Markers Related tothe Acclimation of Cork Oak Plants to HighTemperatures?
Barbara Correia1, Luis Valledor2,3, Mo nica Meijo n2,4, Jose Luis Rodriguez2, Maria Celeste Dias1,
Conceicao Santos1
, Maria Jesus Canal2
, Roberto Rodriguez2
, Glo ria Pinto1
*1 Department of Biology & Centre for Environmental and Marine Studies, University of Aveiro, Aveiro, Portugal, 2 Epiphysage Research Group, Biology of Organisms and
Systems Department, University Institute of Biotechnology & University of Oviedo, Oviedo, Spain, 3 Molecular Systems Biology Department, University of Vienna, Vienna,
Austria, 4 Gregor Mendel Institute of Plant Molecular Biology, Austrian Academy of Sciences, Vienna, Austria
Abstract
Trees necessarily experience changes in temperature, requiring efficient short-term strategies that become crucial inenvironmental change adaptability. DNA methylation and histone posttranslational modifications have been shown to playa key role in both epigenetic control and plant functional status under stress by controlling the functional state of chromatin and gene expression. Cork oak (Quercus suber L.) is a key stone of the Mediterranean region, growing attemperatures of 45uC. This species was subjected to a cumulative temperature increase from 25uC to 55uC under laboratoryconditions in order to test the hypothesis that epigenetic code is related to heat stress tolerance. Electrolyte leakageincreased after 35uC, but all plants survived to 55uC. DNA methylation and acetylated histone H3 (AcH3) levels weremonitored by HPCE (high performance capillary electrophoresis), MS-RAPD (methylation-sensitive random-amplifiedpolymorphic DNA) and Protein Gel Blot analysis and the spatial distribution of the modifications was assessed using aconfocal microscope. DNA methylation analysed by HPCE revealed an increase at 55uC, while MS-RAPD results pointed todynamic methylation-demethylation patterns over stress. Protein Gel Blot showed the abundance index of AcH3 decreasingfrom 25uC to 45uC. The immunohistochemical detection of 5-mC (5-methyl-29-deoxycytidine) and AcH3 came upon theprevious results. These results indicate that epigenetic mechanisms such as DNA methylation and histone H3 acetylationhave opposite and particular dynamics that can be crucial for the stepwise establishment of this species into such highstress (55uC), allowing its acclimation and survival. This is the first report that assesses epigenetic regulation in order toinvestigate heat tolerance in forest trees.
Citation: Correia B, Valledor L, Meijon M, Rodriguez JL, Dias MC, et al. (2013) Is the Interplay between Epigenetic Markers Related to the Acclimation of Cork Oak Plants to High Temperatures? PLoS ONE 8(1): e53543. doi:10.1371/journal.pone.0053543
Editor: Keqiang Wu, National Taiwan University, Taiwan
Received August 30, 2012; Accepted November 29, 2012; Published January 11, 2013
Copyright: 2013 Correia et al. This is an open-access article distributed under the terms of the Creative Commons Attribution License, which permits
unrestricted use, distribution, and reproduction in any medium, provided the original author and source are credited.Funding: This work is supported by FEDER through COMPETE (Programa Operacional Factores de Competitividade) and by the FCT project PTDC/AGR-CFL/112996/2009. G. Pinto is hired under the programme Cie ncia 2008 (FCT, Portugal), co-funded by the Human Potential Operational Programme (National StrategicReference Framework 2007–2013) and European Social Fund (EU). FCT supported the fellowship of M.C. Dias (SFRH/BPD/41700/2007). L. Valledor fellow wassupported by a Marie Curie Action of the European Union (FP7-PEOPLE-IEF). The funders had no role in study design, data collection and analysis, decision topublish, or preparation of the manuscript.
Competing Interests: The authors have declared that no competing interests exist.
* E-mail: [email protected]
Introduction
Plants necessarily experience changes in temperature during
their life cycle. A diversity of cellular targets is greatly affected by
atypically high temperatures that can induce a re-setting of
physiological, biochemical and molecular programs and affectplant growth and performance [1–3]. Epigenetic modifications in
the genome can be induced by environmental signals, and thus,
the single genome in a plant cell gives rise to multiple epigenomes
in response to different environmental cues [4–6]. The control of
gene expression based on chromatin organization rather than on
primary DNA sequence information is referred to as epigenetics
[7]. Epigenetic modifications occur without changing original
nucleotide sequence and can be achieved on several interdepen-
dent levels that include covalent modifications of DNA and
histones [8,9].
A number of studies have shown that DNA methylation and
histone posttranslational modifications play a key role in epigenetic
control and plant functional status under stress (e.g. [4,6,8,10,11])
by controlling the functional state of chromatin and gene
expression [12–15]. These epigenetic marks are generated fast,
can be transmitted across cell divisions (meiotically and mitotically)and can also be reversed, providing a way to confer plasticity in
the plant response and temporary ‘‘memory’’ strategies [8,16].
Experiments inquiring this subject in Arabidopsis showed that
prolonged heat stress (37uC, 42uC) induces a transient release of
gene silencing [17,18], but once a plant is removed from stress,
gene expression is re-established within 48 hours.
Histone acetylation and DNA methylation can activate or
repress transcription by generating ‘‘open’’ or ‘‘closed’’ chromatin
configuration [19–21]. Thus, open chromatin increases the
accessibility of the genome to transcription machinery, while
closed chromatin represses gene expression by limiting the
PLOS ONE | www.plosone.org 1 January 2013 | Volume 8 | Issue 1 | e53543
8/9/2019 Interplay Between Epigenetic Markers Related
http://slidepdf.com/reader/full/interplay-between-epigenetic-markers-related 2/9
accessibility [19]. Configuration of chromatin at specific loci also
controls somatic homologous recombination; heat stress affects
genetic stability through chromatin remodelling, altering accessi-
bility of DNA for repair and recombination [17].
It has long been suspected that a link exists between heat stress,
chromatin remodelling, and epigenetic regulation of gene expres-
sion but further study is required to confirm the existence and
nature of such a link [17]. The work of Kumar and Wigge [22], for
example, identified histone H2A as a thermosensor in Arabidopsis and revealed a direct link with DNA methylation. Whilst
significant progress has been made in understanding the physio-
logical, cellular and molecular mechanisms of plant response to
environmental stress factors [1] our understanding of how plants
cope with climate challenges is still very limited. Such insight is
required to understand heat-induced epigenetic processes. In fact,
because these epigenetic traits exhibit characteristic dynamics
during growth and development they may be of crucial
importance in exploring and understanding adaptation related
processes throughout the life cycle of trees, particularly in response
to stress. There is an urgent need to determine the adaptive
potential of forest trees given their importance in ecosystem
functioning and the associated ecological and economic services
they provide.
This topic was addressed in Quercus suber L. (cork oak) plants thatwere demonstrated to be extremely tolerant to elevated temper-
atures [23,24]. In the field, cork oak plants can be exposed to
temperature near 40–45uC (in shade) and experience daily stress
[23,25]. Cork oak is widely distributed and withstands a variety of
climates with contrasting temperatures and rainfall [26], making
summer drought and high temperatures clear selective agents [27].
These factors are thought to be among the most significant in the
increasing mortality of forests in response to global climate
changes [28].
Cork oak’s ability to acclimate to stress conditions may be an
important factor in the tolerance of this species to high summer
temperatures [23,24]. In the Mediterranean area, cork oak is of
great ecological and economic importance. It is expected to be
severely affected by climate change due to the increased intensityand duration of the drought and heat periods expected for this
region [27].
Few studies have been conducted which test the effect of high
temperatures in Quercus and the majority of those which have been
conducted focused on the photosynthetic apparatus and volatile
organic compounds production [23,25,29–31]. At the molecular
level information is still scarcer [32] particularly for such high
temperatures. Epigenetic changes that may occur under such
conditions therefore remain largely unexplored.
To test the hypothesis that the epigenetic code could be related
to heat stress tolerance in cork oak, DNA methylation and
acetylated histone H3 (AcH3) levels were monitored during
cumulative high temperature stress from 25uC to 55uC (in 10uC
steps). In addition, the spatial distribution of these modifications
was followed by immunolocalization in order to validate the resultsand analyse the possible correlation between heat stress tolerance
and the studied epigenetic marks. The aim of this work was to
collect, for the first time, epigenetic knowledge related to heat
tolerance in cork oak and contribute to the current understanding
of epigenetic control of heat acclimation in forest trees.
Materials and Methods
Plant material and experimental design8-month-old cork oak plants were acquired from forest plant
producer ANADIPLANTA (located in Central Portugal) and
transferred from semi controlled greenhouse conditions to aclimate chamber for a 2 weeks acclimation period. The climate
chamber environment was kept constant (air temperature = 25uC;
relative humidity = 60–70%; photosynthetic photon flux densi-
ty=250 mmol m22 s21; watering= field capacity; photoper-
iod=16 h).
During the experimental treatment, relative humidity, irradi-
ance, watering and photoperiod were held constant, while air
temperature was gradually increased by 10u
C every 3 days from25uC to 55uC, peak temperature was maintained for 3 hours.
Minimum daily temperature was 20uC during the 8 night hours.
Sampling occurred on the third day during peak heat hours
(around 12 a.m.) for each temperature (25uC, 35uC, 45uC and
55uC). Fully expanded leaves were collected from each treatment,
frozen in groups of 5 individuals (pools) in liquid nitrogen andstored at 280uC for subsequent analyses. Leaf sections were also
fixed in paraformaldehyde for further immunohistochemicaldetection. Fresh leaf samples were used for determination of
relative electrolyte leakage.
Percentage of survival, visual leaf damage anddetermination of relative electrolyte leakage
The percentage of survival plants and visual leaf damage were
recorded for each temperature. To get more information on thecell-membrane damage caused by heat stress, the membrane
permeability of the leaves was measured by electrolyte leakage.
Leaves were rinsed three times with deionized water to remove
surface-adhered electrolytes, then placed in tubes containing
20 mL of deionized water and incubated at 25uC on a shaker.
Twenty four hours later, the electrical conductivity of the bathing
solution (C1) was determined using a conductivity instrument
(pH 340/ION, WTW, Germany). The tubes were then auto-
claved at 100uC for 25 min and subsequently maintained at 25uC.
Finally, total electrical conductivity (C2) was measured and
electrolyte leakage was calculated using the following equation:
relative electrolyte leakage (%) = (C1/C2)6100. Eight biological
samples were analysed.
Nuclei isolationNuclei were isolated from 500 mg of frozen leaves using the
protocol described by Haring et al. [33] with the following
modifications: samples were transferred to 12 mL tubes containing
8 mL ice-cold cell isolation buffer (10 mM Tris pH 8.0, 400 mM
sucrose, 10 mM Na-butyrate, 0.1 mM phenylmethylsulfonyl
fluoride (PMSF), 5 mM b-mercaptoethanol, protease inhibitors
1 mg/mL) and filtered through 3 layers of Miracloth into a new
ice-cold 12 mL tube. After centrifuging the filtrate (30006g,
15 min, 4uC), the supernatant was removed and the pellet was
resuspended in 5 mL ice-cold nuclei isolation buffer A (10 mMTris pH 8.0, 250 mM sucrose, 10 mM Na-butyrate, 10 mM
MgCl2, 1% v/v Triton X-100, 0.1 mM PMSF, 5 mM b-
mercaptoethanol, protease inhibitors 1 mg/mL) and incubated
for 10 minutes on ice. The solution was centrifuged (30006g,15 min, 4uC), the resulting supernatant was removed and the
pellet was resuspended and incubated in 5 mL ice-cold nuclei
isolation buffer until pellet was light green. After centrifugation
(30006g, 15 min, 4uC) the supernatant was removed and the
pellet was resuspended in 8 mL ice-cold nuclei isolation buffer B
(10 mM Tris pH 8.0, 1.7 M sucrose, 10 mM Na-butyrate, 2 mM
MgCl2, 0.15% v/v Triton X-100, 0.1 mM PMSF, 5 mM b-
mercaptoethanol, proteinase inhibitors 1 mg/mL). The solution
was centrifuged (30006g, 15 min, 4uC), the supernatant was
removed and the isolated nuclei were kept at 280uC until DNA or
protein extraction.
Epigenetic Markers and Acclimation of Cork Oak
PLOS ONE | www.plosone.org 2 January 2013 | Volume 8 | Issue 1 | e53543
8/9/2019 Interplay Between Epigenetic Markers Related
http://slidepdf.com/reader/full/interplay-between-epigenetic-markers-related 3/9
Global nuclear DNA methylationNuclear DNA was extracted from the pre-isolated nuclei
following the procedure described by Thomas et al. [34], modified
in the ensuing points: nuclear pellets were transferred to a 2 mL
tube with 1.25 mL buffer 1 (0.25 M NaCl, 0.2 M Tris-HCl
pH 7.6, 0.05 M Na2EDTA pH 8.0, 2.5% v/v b-mercaptoethanol,
2.5% w/v polyvinylpyrrolidone (MW 40.000)). The mixture was
briefly mixed by vortexing and centrifuged (26006g for 5 min at
4u
C). After removing the supernatant, pellet was resuspended in500 mL buffer 2 (0.05 M NaCl, 0.2 M Tris-HCl pH 8.0, 0.05 M
Na2EDTA pH 8.0, 2.5% v/v b-mercaptoethanol, 2.5% w/v
polyvinylpyrrolidone (MW 40.000), 3% sarkosyl) and incubated at
37uC for 30 min with gently shaking. After adding an equal
volume of chloroform/isoamyl alcohol, centrifuging and collecting
the aqueous phase in a new tube, 350 mL of cold isopropanol was
added and slowly mixed to precipitate DNA. DNA was collected
and transferred to 500 mL 70% ethanol. Ethanol-DNA mixture
was centrifuged (190006g for 10 min at 4uC), supernatant was
discarded and after completely dry, DNA pellet was resuspended
in 100 mL ddH2O. DNA suspensions were purified using phenol-
chloroform solution and completely air-dried DNA pellets were
resuspended in 12 mL ddH2O. An aliquot of each extracted sample
was used to evaluate DNA concentration and integrity and to
detect residual RNA.
DNA hydrolysis and global DNA methylation analysis were
performed by high performance capillary electrophoresis (HPCE)
according to previously described by Hasbun et al. [35]. Four
pools of five samples and three analytical measurements were
analysed at each experimental situation. The methylation content
of each DNA sample was quantified as: 5-mdC peak area6100/
(dC (deoxycytidine) peak area + 5-mdC peak area).
Methylation-sensitive random-amplified polymorphicDNA (MS-RAPD)
Genomic DNA was extracted from 75 mg of frozen leaves with
a plant genomic DNA extraction kit (DNeasy Plant Mini Kit,
Qiagen, Germany) according to the manufacturer’s instructions.
DNA yield and purity were assessed by spectrophotometry (as
described in Valledor et al. [36]) and gel electrophoresis on
agarose gel by direct comparison with phage l DNA.
To study the epigenetic changes in specific DNA sequences it
was used MS-RAPD, a modification of the original RAPD
technique which is closer to MSAP (methylation sensitive
amplified polymorphisms) analysis. All steps in the protocol were
carefully standardized and thoroughly described in order to ensure
technical reproducibility.
In a first step, two methylation-sensitive isoschizomers ( Hpa II
and MspI) were used in parallel to digest the DNA.
After digestion, a standard RAPD procedure was used to
amplify the restriction fragments. In the first reaction, 250 gg of
each extracted DNA was added to a restriction mixture
containing: 16 restriction buffer and 10/20 U restriction endo-nuclease to a final volume of 30 mL, one mixture per endonuclease
( Hpa II/ MspI; all endonucleases and buffers were supplied by New
England Biolabs, USA). Restriction mixtures were then incubated
at 37uC overnight. The reaction was stopped by placing the tubes
on ice and restriction was checked by agarose electrophoresis.
PCR amplification was performed according to Cocconcelli et al.
[37]: 20 mL reaction mixtures containing: 12–14 ng DNA, 16
PCR buffer (Invitrogen, USA), 3.5 mM MgCl2, 75 pM dNTP,
0.25 mM each primer, 1 U Taq polymerase (Invitrogen, USA). In
a preliminary work, a total number of 20 primers was tested (one
‘arbitrary’ primer set – Operon OPH). From this preliminary test,
only the 10 most polymorphic primers were selected and used in
the current manuscript (see table 1).
Amplification was performed in a thermo cycler in 96-well
plates. The cycle conditions were as follows: initial denaturation at
94uC for 5 min, followed by 45 cycles 94uC for 1 min, annealing temperature of 29uC for 1 min and extension at 72uC for 2 min. A
ramp of 1.5 min was used between annealing (29uC) and
elongation (72uC). None of the primers used in this study revealed
any change in DNA fingerprint within the samples when RAPD
analysis was performed to undigested genomic DNA, so all of the
quantified changes are the results of changes in DNA methylation
and not in sequence-differences between individuals.
The products of RAPD assay were resolved on 1.75% agarose
gels. Interpretation of MS-RAPD bands followed the representa-
tion of MSAP (methylation sensitive amplified polymorphisms)
detected by Hpa II/ MspI endonuclease digestion according to
Valledor et al. [38] and appearance-disappearance of bands was
used to study the variation of methylation which could be classified
into two categories: de novo methylation and demethylation events.Four pools of five samples were analysed. The complete protocol
was performed two unattached times to ensure the reliability of the
results. Only consistent bands between batches were considered
for analysis.
Protein extractionProteins were extracted from the pre-isolated nuclei, following
part of the procedure described by Shechter et al. [39]. In brief,
nuclear pellets were transferred to a fresh 1.5 mL tube with 400 ml
0.8N H2SO4. The suspensions were vortexed until clumps were
dissolved and incubated on rotator, for 30 min. After this time, the
solutions were sonicated and then centrifuged (150006g for
10 min at 4uC) to remove nuclear debris. Supernatants were
transferred to a fresh 1.5 mL tube and they were added 140 mL100% trichloroacetic acid (TCA). Suspensions were incubated on
ice for 30 min and then centrifuged at 150006g during 10 min at
4uC. Supernatants were discarded and then pellets were washed
with 1 mL cold-acetone. Pellets were recovered by centrifugation
(150006g, 10 min, 4uC) and supernatants were discarded. This
washing step was repeated twice. Then the protein pellets were air-
dried at room temperature and later dissolved in appropriate
volume of protein rehydration buffer (8 M urea, 2% w/v 3[(3-
cholamidopropyl) dimethylammonio]-propanesulfonic acid
(CHAPS), 8 mM dithiothreitol (DTT), 0.5% v/v ampholytes).
Table 1. Sequences of primers used in MS-RAPD protocol.
Name Sequence
OPH-03 AGACGTCCAC
OPH-04 GGAAGTCGCC
OPH-05 AGTCGTCCCC
OPH-07 CTGCATCGTGOPH-08 GAAACACCCC
OPH-10 CCTACGTCAG
OPH-13 GACGCCACAC
OPH-18 GAATCGGCCA
OPH-19 CTGACCAGCC
OPH-20 GGGAGACATC
doi:10.1371/journal.pone.0053543.t001
Epigenetic Markers and Acclimation of Cork Oak
PLOS ONE | www.plosone.org 3 January 2013 | Volume 8 | Issue 1 | e53543
8/9/2019 Interplay Between Epigenetic Markers Related
http://slidepdf.com/reader/full/interplay-between-epigenetic-markers-related 4/9
Protein blotProtein gel blot analysis was performed as described by Valledor
et al. [38]. In brief, proteins and standards were separated by
electrophoresis in 13.5% w/v acrylamide SDS gels (Mini-
PROTEAN II Multi-Casting Chamber, BIO-RAD, USA) and
then transferred by electroblotting (350 mA for 2 hours) to
Immobilon membranes (Millipore Corp., USA). For the immu-
nodetection, the membranes were blocked overnight at 4uC in 2%
w/v powdered skimmed milk in phosphate-buffered saline (PBS)containing 0.5% v/v Tween 20. Then, the membranes were
incubated with primary and secondary polyclonal antibodies
diluted 1:2000 and 1:1000 in blocking solution for 2 and 1 hours,
respectively. The used primary antibodies were anti-acetyl-Histone
H3 (anti-AcH3 ) (rabbit, Millipore Corp., USA) and anti-actin
(rabbit, Chemicon, USA). Latter secondary antibodies (anti-
rabbit), coupled to alkaline phosphatase, were used in a dilution
of 1:5000 and signals were revealed in a nitroblue tetrazolium and
bromo-chloro-indolyl-phosphate (NBT-BCIP) mixture. Anti-actin
was used as a control for loading normalization.
Densimetric measurements were taken after immunodetection
using Kodak.1D v 3.6 Scientific Imaging Systems (USA).
Abundance index was calculated as follows: protein band
intensity/actin band intensity. Four pools of five samples were
analysed.
Immunohistochemical detectionThe immunolocalization was carried out according to the
procedure described by Valledor et al. [38]. Half cross sections of
leaf were fixed in 4% paraformaldehyde, 1% b-mercaptoethanol
in PBS overnight at 4uC and sectioned at a 50 mm thickness using
a cryomicrotome Leica CH 1510-1 (Leica Microsystems, Ger-
many). The samples were mounted on slides coated with APTES
(3-aminopropyltriethoxysilane; Sigma, USA). The leaf sections
were dehydrated and then rehydrated through ascending and
descending series of ethanol, respectively. The leaf sections were
incubated in 2% cellulase in PBS for 45 min at room temperature
and denatured in 2N HCl for 30 min. The permeabilised sections
were blocked in 5% bovine serum albumin (BSA) in PBS for10 min and incubated 1 h with mouse antibody anti-5-methylcy-
tidine (anti-5-mdC, Eurogentec, Belgium) diluted 1:50 in 1%
blocking solution or with rabbit antibody anti-acetylated-Histone
H3 (anti-AcH3, Millipore Corp., USA) diluted 1:25. Non-bound
antibodies were washed with 0.1% Tween 20 in PBS. Alexa Fluor
488-labelled anti-mouse polyclonal antibody (Invitrogen, USA)
diluted 1:25 was used as secondary antibody for the 5-mdC
detection and Alexa Fluor 488-labelled anti-rabbit polyclonal
antibody (Invitrogen, USA) for the acetylated H3 histone
detection. The slides were counterstained with DAPI (49, 6-
diamidino-2-phenylindole; Fluka, USA). Fluorescence was visual-
ized using a confocal microscope (Leica TCS-SP2-AOBS; Leica
Microsystems, Germany). Three biological samples were analysed
for each treatment and multiple 3D image stacks were acquired of each leaf. 3D images of whole leaf were reconstructed and
maximal projection was performed using Leica Software (LCS
c2.5. Leica Microsystems, Germany).
Statistical analysisStatistical analyses were conducted with SigmaPlot statistical
software package v. 11 (Systat, Germany) for Windows. Data from
electrolyte leakage, global DNA methylation and relative abun-
dance index of AcH3 were subjected to an analysis of variance
using One Way Anova. When data were statistically different
Anova test was followed by a Holm Sidak test (p,0.05).
Results
Percentage of survival, visual leaf damage and electrolyte
leakage were measured in plants exposed to temperature increases
from 25 to 55uC (in 10uC steps). All plants survived to 55uC.
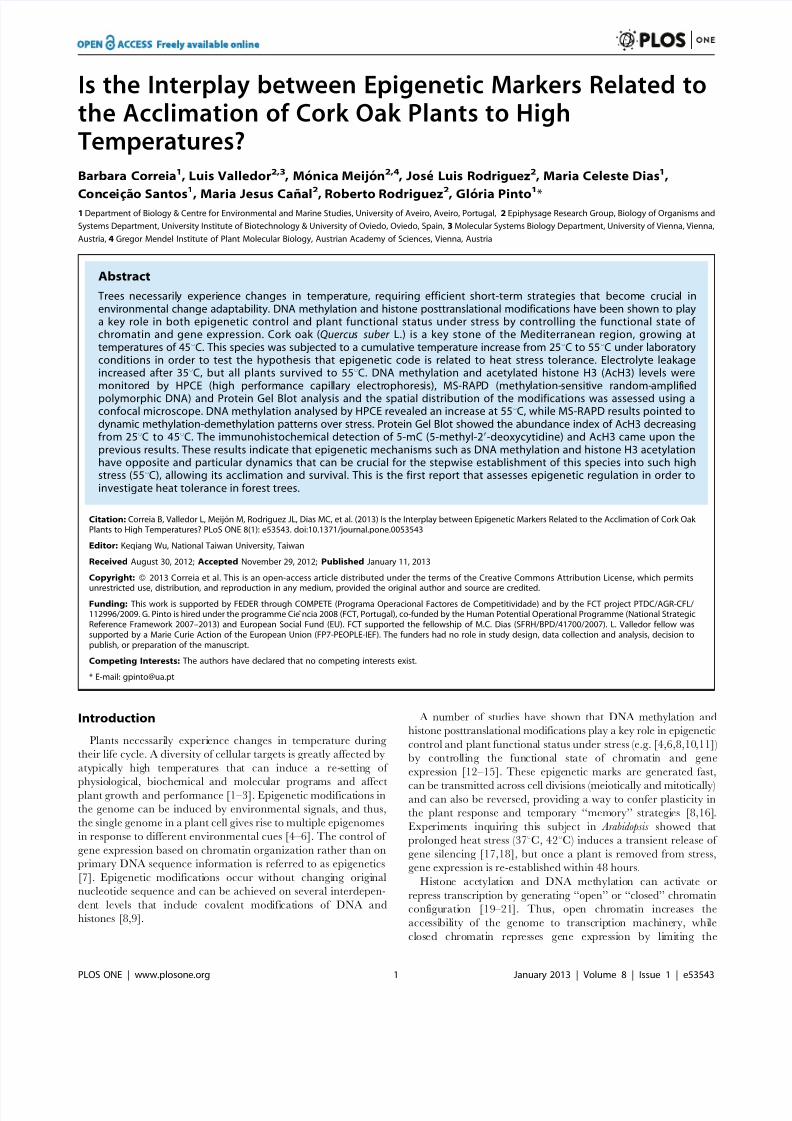
Nevertheless, visual leaf damage was evident at 55uC, where it was
possible to detect brown spots (Fig. 1). No morphological signal of
stress was detected below this temperature.
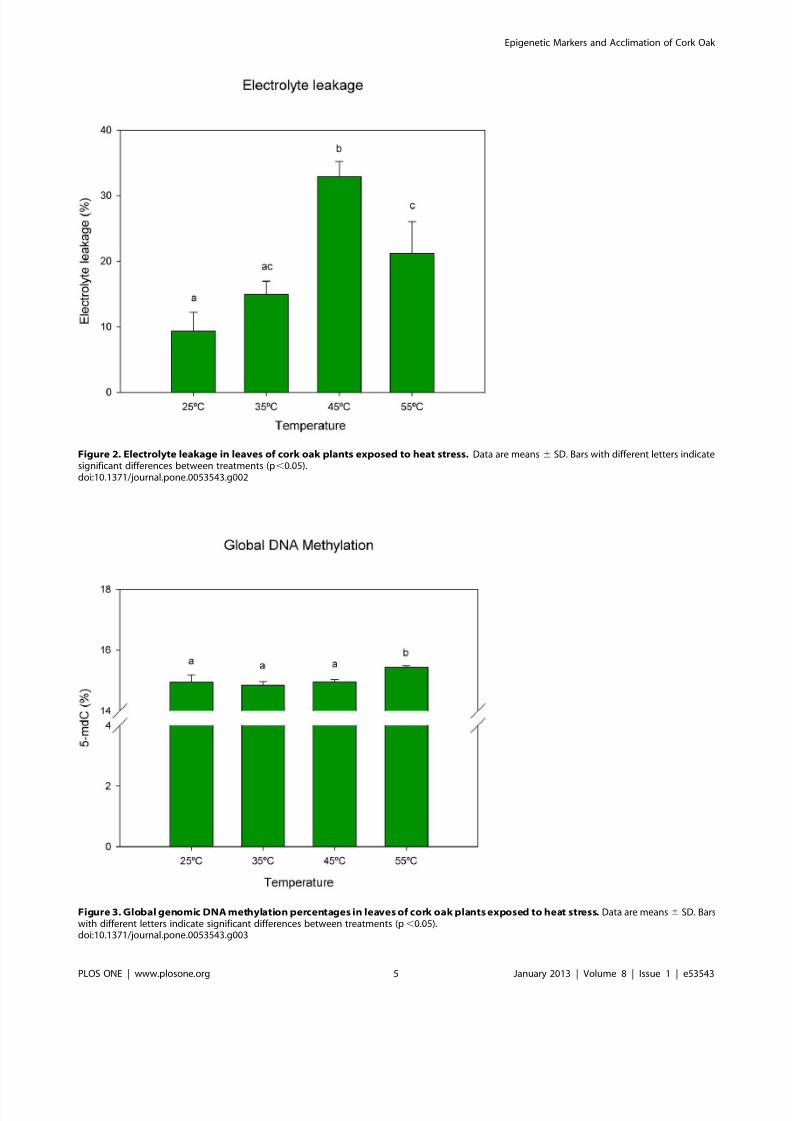
Cumulative heat stress led to higher electrolyte leakage (an
indirect parameter of membrane rupture) that increased signifi-
cantly between 35uC–45uC. The maximum degradation was
observed at 45uC. At 55uC electrolyte leakage percentage
decreased significantly (Fig. 2).
DNA methylation analysed by HPCE (Fig. 3) revealed no
significant alterations in global DNA methylation with increasing
heat stress until 45uC, but a significant increase at 55uC (p,0.05).
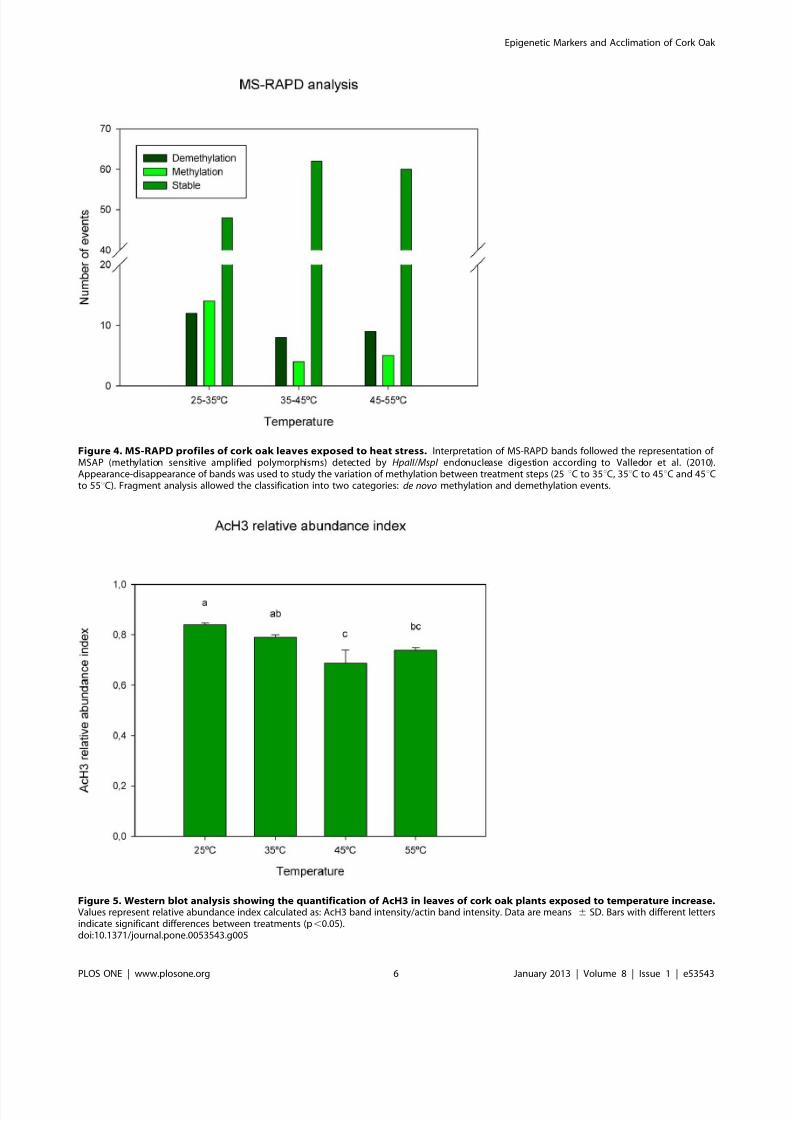
The MS-RAPD analysis showed different methylation patterns
at specific sequences. Seventy four bands were analysed: from
25uC to 35uC (12 demethylation and 14 de novo methylation
events); from 35uC t o 4 5uC (8 demethylation and 4 de novo
methylation events); finally 9 demethylation and 5 de novo
methylation events were measured from 45uC to 55uC (Fig. 4).
These results showed a high dynamic number of events between
25uC and 35uC in comparison the others increase steps of temperature.
Protein extracts from cork oak leaves exposed to 25uC, 35uC,
45uC and 55uC revealed single bands of approximately 17 and
43 kDa for acetylated histone H3 (AcH3) and actin, respectively.
The abundance index of AcH3 decreased from 25uC (0.840) until
45uC (0.790 at 35uC and 0.686 at 45uC), and presented a slightly
superior value at 55uC (0.737) (Fig. 5).
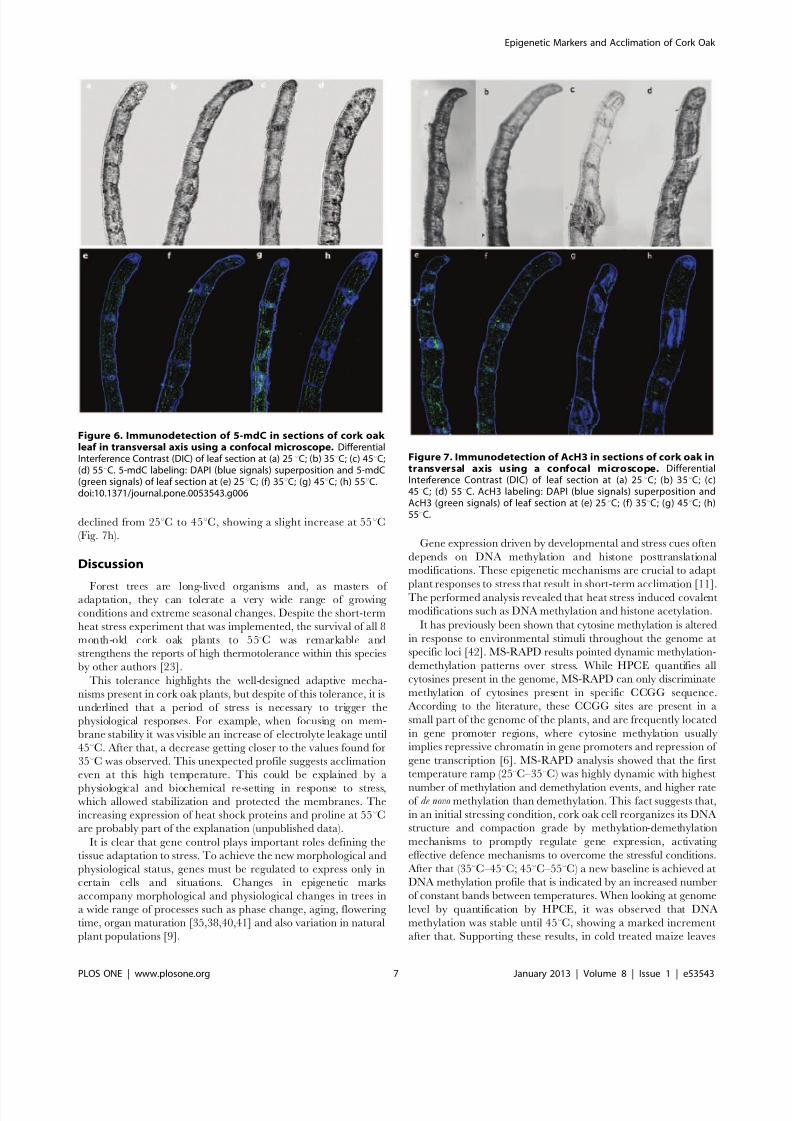
The immunolocalization analysis showed different 5-mdC levels
and spatial distribution in leaves in response to heat stress increase
(Fig. 6). At 25uC 5-mC was equitably distributed over the tissues of
the sample (Fig. 6e). An increasing in intensity of methylated
cytosine at 35uC was observed, occupying the four cellular layers
(Fig. 6f). At 45uC there is a clear redistribution of the methylated
cytosine; such redistribution is much less evident in the spongyparenchyma and more concentrated near palisade parenchyma
and vascular vessels (Fig. 6g). At 55uC the distribution occurred in
similar pattern as to that at 35uC but with much more methylated
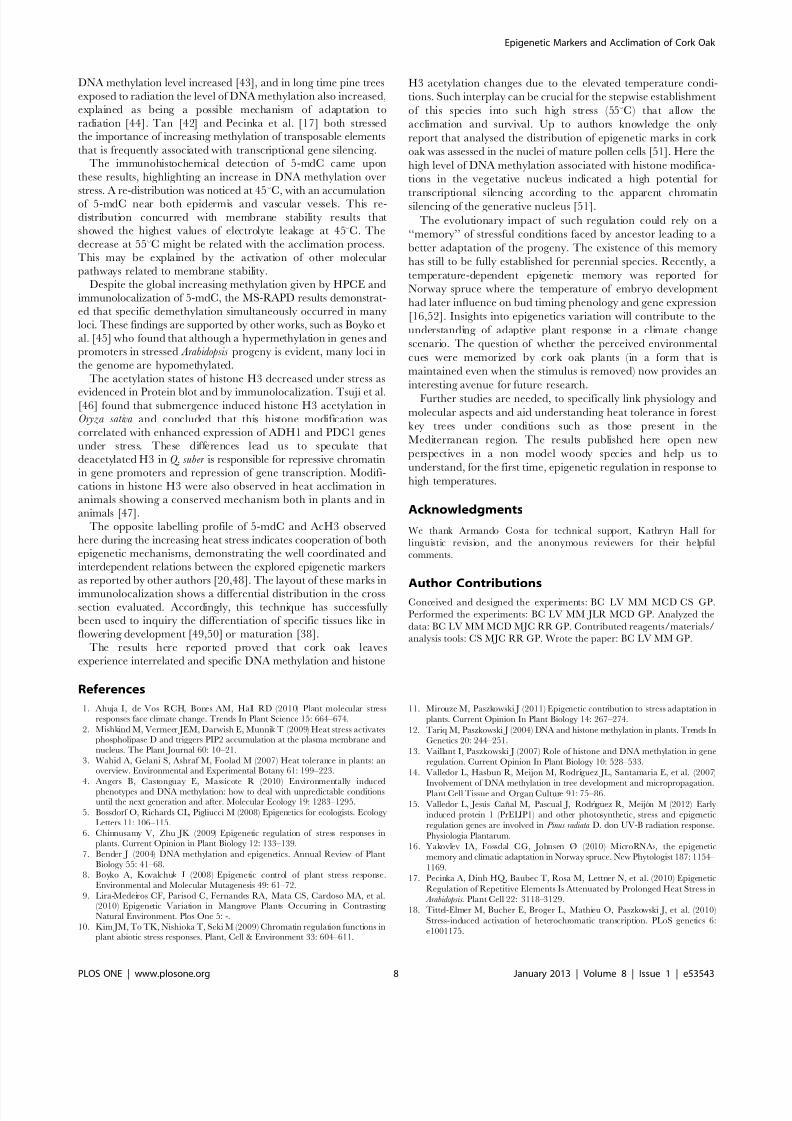
nuclei (Fig. 6h). The histone AcH3 signal presented an opposite
pattern in the immunolocalization analysis (Fig. 7): the intensity
Figure 1. Quercus suber plants used during the experience. a)Plants at 25uC; b) Plants after three days at 55uC with clear signals of stress (brown areas, black arrows).doi:10.1371/journal.pone.0053543.g001
Epigenetic Markers and Acclimation of Cork Oak
PLOS ONE | www.plosone.org 4 January 2013 | Volume 8 | Issue 1 | e53543
8/9/2019 Interplay Between Epigenetic Markers Related
http://slidepdf.com/reader/full/interplay-between-epigenetic-markers-related 5/9
Figure 2. Electrolyte leakage in leaves of cork oak plants exposed to heat stress. Data are means 6 SD. Bars with different letters indicatesignificant differences between treatments (p,0.05).doi:10.1371/journal.pone.0053543.g002
Figure 3. Global genomic DNA methylation percentages in leaves of cork oak plants exposed to heat stress. Data are means6 SD. Barswith different letters indicate significant differences between treatments (p,0.05).doi:10.1371/journal.pone.0053543.g003
Epigenetic Markers and Acclimation of Cork Oak
PLOS ONE | www.plosone.org 5 January 2013 | Volume 8 | Issue 1 | e53543
8/9/2019 Interplay Between Epigenetic Markers Related
http://slidepdf.com/reader/full/interplay-between-epigenetic-markers-related 6/9
Figure 4. MS-RAPD profiles of cork oak leaves exposed to heat stress. Interpretation of MS-RAPD bands followed the representation of MSAP (methylation sensitive amplified polymorphisms) detected by HpaII /MspI endonuclease digestion according to Valledor et al. (2010).Appearance-disappearance of bands was used to study the variation of methylation between treatment steps (25uC to 35uC, 35uC to 45uC and 45uCto 55uC). Fragment analysis allowed the classification into two categories: de novo methylation and demethylation events.
Figure 5. Western blot analysis showing the quantification of AcH3 in leaves of cork oak plants exposed to temperature increase.Values represent relative abundance index calculated as: AcH3 band intensity/actin band intensity. Data are means 6 SD. Bars with different lettersindicate significant differences between treatments (p,0.05).doi:10.1371/journal.pone.0053543.g005
Epigenetic Markers and Acclimation of Cork Oak
PLOS ONE | www.plosone.org 6 January 2013 | Volume 8 | Issue 1 | e53543
8/9/2019 Interplay Between Epigenetic Markers Related
http://slidepdf.com/reader/full/interplay-between-epigenetic-markers-related 7/9
declined from 25uC to 45uC, showing a slight increase at 55uC
(Fig. 7h).
Discussion
Forest trees are long-lived organisms and, as masters of adaptation, they can tolerate a very wide range of growing
conditions and extreme seasonal changes. Despite the short-term
heat stress experiment that was implemented, the survival of all 8
month-old cork oak plants to 55uC was remarkable and
strengthens the reports of high thermotolerance within this species
by other authors [23].
This tolerance highlights the well-designed adaptive mecha-
nisms present in cork oak plants, but despite of this tolerance, it is
underlined that a period of stress is necessary to trigger the
physiological responses. For example, when focusing on mem-
brane stability it was visible an increase of electrolyte leakage until
45uC. After that, a decrease getting closer to the values found for
35uC was observed. This unexpected profile suggests acclimation
even at this high temperature. This could be explained by a
physiological and biochemical re-setting in response to stress,which allowed stabilization and protected the membranes. The
increasing expression of heat shock proteins and proline at 55uC
are probably part of the explanation (unpublished data).
It is clear that gene control plays important roles defining the
tissue adaptation to stress. To achieve the new morphological and
physiological status, genes must be regulated to express only in
certain cells and situations. Changes in epigenetic marks
accompany morphological and physiological changes in trees in
a wide range of processes such as phase change, aging, flowering
time, organ maturation [35,38,40,41] and also variation in natural
plant populations [9].
Gene expression driven by developmental and stress cues often
depends on DNA methylation and histone posttranslational
modifications. These epigenetic mechanisms are crucial to adapt
plant responses to stress that result in short-term acclimation [11].The performed analysis revealed that heat stress induced covalent
modifications such as DNA methylation and histone acetylation.
It has previously been shown that cytosine methylation is altered
in response to environmental stimuli throughout the genome at
specific loci [42]. MS-RAPD results pointed dynamic methylation-
demethylation patterns over stress. While HPCE quantifies all
cytosines present in the genome, MS-RAPD can only discriminate
methylation of cytosines present in specific CCGG sequence.
According to the literature, these CCGG sites are present in a
small part of the genome of the plants, and are frequently located
in gene promoter regions, where cytosine methylation usually
implies repressive chromatin in gene promoters and repression of
gene transcription [6]. MS-RAPD analysis showed that the first
temperature ramp (25uC–35uC) was highly dynamic with highest
number of methylation and demethylation events, and higher rateof de novo methylation than demethylation. This fact suggests that,
in an initial stressing condition, cork oak cell reorganizes its DNA
structure and compaction grade by methylation-demethylation
mechanisms to promptly regulate gene expression, activating
effective defence mechanisms to overcome the stressful conditions.
After that (35uC–45uC; 45uC–55uC) a new baseline is achieved at
DNA methylation profile that is indicated by an increased number
of constant bands between temperatures. When looking at genome
level by quantification by HPCE, it was observed that DNA
methylation was stable until 45uC, showing a marked increment
after that. Supporting these results, in cold treated maize leaves
Figure 6. Immunodetection of 5-mdC in sections of cork oak leaf in transversal axis using a confocal microscope. DifferentialInterference Contrast (DIC) of leaf section at (a) 25uC; (b) 35uC; (c) 45uC;(d) 55uC. 5-mdC labeling: DAPI (blue signals) superposition and 5-mdC(green signals) of leaf section at (e) 25uC; (f) 35uC; (g) 45uC; (h) 55uC.doi:10.1371/journal.pone.0053543.g006
Figure 7. Immunodetection of AcH3 in sections of cork oak intransversal axis using a confocal microscope. DifferentialInterference Contrast (DIC) of leaf section at (a) 25uC; (b) 35uC; (c)45uC; (d) 55uC. AcH3 labeling: DAPI (blue signals) superposition andAcH3 (green signals) of leaf section at (e) 25uC; (f) 35uC; (g) 45uC; (h)55uC.
Epigenetic Markers and Acclimation of Cork Oak
PLOS ONE | www.plosone.org 7 January 2013 | Volume 8 | Issue 1 | e53543
8/9/2019 Interplay Between Epigenetic Markers Related
http://slidepdf.com/reader/full/interplay-between-epigenetic-markers-related 8/9
DNA methylation level increased [43], and in long time pine trees
exposed to radiation the level of DNA methylation also increased,
explained as being a possible mechanism of adaptation to
radiation [44]. Tan [42] and Pecinka et al. [17] both stressedthe importance of increasing methylation of transposable elements
that is frequently associated with transcriptional gene silencing.The immunohistochemical detection of 5-mdC came upon
these results, highlighting an increase in DNA methylation over
stress. A re-distribution was noticed at 45u
C, with an accumulationof 5-mdC near both epidermis and vascular vessels. This re-
distribution concurred with membrane stability results that
showed the highest values of electrolyte leakage at 45uC. The
decrease at 55uC might be related with the acclimation process.
This may be explained by the activation of other molecular
pathways related to membrane stability.
Despite the global increasing methylation given by HPCE and
immunolocalization of 5-mdC, the MS-RAPD results demonstrat-
ed that specific demethylation simultaneously occurred in many
loci. These findings are supported by other works, such as Boyko et
al. [45] who found that although a hypermethylation in genes and
promoters in stressed Arabidopsis progeny is evident, many loci in
the genome are hypomethylated.
The acetylation states of histone H3 decreased under stress as
evidenced in Protein blot and by immunolocalization. Tsuji et al.[46] found that submergence induced histone H3 acetylation inOryza sativa and concluded that this histone modification was
correlated with enhanced expression of ADH1 and PDC1 genes
under stress. These differences lead us to speculate that
deacetylated H3 in Q. suber is responsible for repressive chromatin
in gene promoters and repression of gene transcription. Modifi-
cations in histone H3 were also observed in heat acclimation in
animals showing a conserved mechanism both in plants and in
animals [47].
The opposite labelling profile of 5-mdC and AcH3 observed
here during the increasing heat stress indicates cooperation of both
epigenetic mechanisms, demonstrating the well coordinated and
interdependent relations between the explored epigenetic markers
as reported by other authors [20,48]. The layout of these marks in
immunolocalization shows a differential distribution in the cross
section evaluated. Accordingly, this technique has successfully
been used to inquiry the differentiation of specific tissues like in
flowering development [49,50] or maturation [38].
The results here reported proved that cork oak leaves
experience interrelated and specific DNA methylation and histone
H3 acetylation changes due to the elevated temperature condi-
tions. Such interplay can be crucial for the stepwise establishment
of this species into such high stress (55uC) that allow the
acclimation and survival. Up to authors knowledge the only
report that analysed the distribution of epigenetic marks in cork
oak was assessed in the nuclei of mature pollen cells [51]. Here the
high level of DNA methylation associated with histone modifica-
tions in the vegetative nucleus indicated a high potential for
transcriptional silencing according to the apparent chromatinsilencing of the generative nucleus [51].
The evolutionary impact of such regulation could rely on a
‘‘memory’’ of stressful conditions faced by ancestor leading to a
better adaptation of the progeny. The existence of this memory
has still to be fully established for perennial species. Recently, a
temperature-dependent epigenetic memory was reported for
Norway spruce where the temperature of embryo development
had later influence on bud timing phenology and gene expression
[16,52]. Insights into epigenetics variation will contribute to the
understanding of adaptive plant response in a climate change
scenario. The question of whether the perceived environmental
cues were memorized by cork oak plants (in a form that is
maintained even when the stimulus is removed) now provides an
interesting avenue for future research.
Further studies are needed, to specifically link physiology and
molecular aspects and aid understanding heat tolerance in forest
key trees under conditions such as those present in the
Mediterranean region. The results published here open new
perspectives in a non model woody species and help us to
understand, for the first time, epigenetic regulation in response to
high temperatures.
Acknowledgments
We thank Armando Costa for technical support, Kathryn Hall for
linguistic revision, and the anonymous reviewers for their helpful
comments.
Author ContributionsConceived and designed the experiments: BC LV MM MCD CS GP.
Performed the experiments: BC LV MM JLR MCD GP. Analyzed the
data: BC LV MM MCD MJC RR GP. Contributed reagents/materials/
analysis tools: CS MJC RR GP. Wrote the paper: BC LV MM GP.
References
1. Ahuja I, de Vos RCH, Bones AM, Hall RD (2010) Plant molecular stressresponses face climate change. Trends In Plant Science 15: 664–674.
2. Mishkind M, Vermeer JEM, Darwish E, Munnik T (2009) Heat stress activatesphospholipase D and triggers PIP2 accumulation at the plasma membrane andnucleus. The Plant Journal 60: 10–21.
3. Wahid A, Gelani S, Ashraf M, Foolad M (2007) Heat tolerance in plants: anoverview. Environmental and Experimental Botany 61: 199–223.
4. Angers B, Castonguay E, Massicote R (2010) Environmentally inducedphenotypes and DNA methylation: how to deal with unpredictable conditionsuntil the next generation and after. Molecular Ecology 19: 1283–1295.
5. Bossdorf O, Richards CL, Pigliucci M (2008) Epigenetics for ecologists. EcologyLetters 11: 106–115.
6. Chinnusamy V, Zhu JK (2009) Epigenetic regulation of stress responses inplants. Current Opinion in Plant Biology 12: 133–139.
7. Bender J (2004) DNA methylation and epigenetics. Annual Review of PlantBiology 55: 41–68.
8. Boyko A, Kovalchuk I (2008) Epigenetic control of plant stress response.Environmental and Molecular Mutagenesis 49: 61–72.
9. Lira-Medeiros CF, Parisod C, Fernandes RA, Mata CS, Cardoso MA, et al.(2010) Epigenetic Variation in Mangrove Plants Occurring in Contrasting Natural Environment. Plos One 5: -.
10. Kim JM, To TK, Nishioka T, Seki M (2009) Chromatin regulation functions inplant abiotic stress responses. Plant, Cell & Environment 33: 604–611.
11. Mirouze M, Paszkowski J (2011) Epigenetic contribution to stress adaptation in
plants. Current Opinion In Plant Biology 14: 267–274.
12. Tariq M, Paszkowski J (2004) DNA and histone methylation in plants. Trends In
Genetics 20: 244–251.
13. Vaillant I, Paszkowski J (2007) Role of histone and DNA methylation in gene
regulation. Current Opinion In Plant Biology 10: 528–533.
14. Valledor L, Hasbun R, Meijon M, Rodriguez JL, Santamaria E, et al. (2007)
Involvement of DNA methylation in tree development and micropropagation.Plant Cell Tissue and Organ Culture 91: 75–86.
15. Valledor L, Jesus Canal M, Pascual J, Rodrıguez R, Meijon M (2012) Early
induced protein 1 (PrELIP1) and other photosynthetic, stress and epigenetic
regulation genes are involved in Pinus radiata D. don UV-B radiation response.
Physiologia Plantarum.
16. Yakovlev IA, Fossdal CG, Johnsen Ø (2010) MicroRNAs, the epigenetic
memory and climatic adaptation in Norway spruce. New Phytologist 187: 1154–
1169.
17. Pecinka A, Dinh HQ, Baubec T, Rosa M, Lettner N, et al. (2010) Epigenetic
Regulation of Repetitive Elements Is Attenuated by Prolonged Heat Stress in
Arabidopsis . Plant Cell 22: 3118–3129.
18. Tittel-Elmer M, Bucher E, Broger L, Mathieu O, Paszkowski J, et al. (2010)
Stress-induced activation of heterochromatic transcription. PLoS genetics 6:
e1001175.
Epigenetic Markers and Acclimation of Cork Oak
PLOS ONE | www.plosone.org 8 January 2013 | Volume 8 | Issue 1 | e53543

8/9/2019 Interplay Between Epigenetic Markers Related
http://slidepdf.com/reader/full/interplay-between-epigenetic-markers-related 9/9
19. Lauria M, Rossi V (2011) Epigenetic control of gene regulation in plants.Biochimica et Biophysica Acta (BBA)-Gene Regulatory Mechanisms 1809: 369– 378.
20. Meijon M, Feito I, Valledor L, Rodrıguez R, Canal MJ (2010) Dynamics of DNA methylation and Histone H4 acetylation during floral bud differentiationin azalea. BMC plant biology 10: 10.
21. Salmon A, Clotault J, Jenczewski E, Chable V, Manzanares-Dauleux MJ (2008) Brassica oleracea displays a high level of DNA methylation polymorphism. PlantScience 174: 61–70.
22. Kumar SV, Wigge PA (2010) H2A. Z-Containing Nucleosomes Mediate theThermosensory Response in Arabidopsis . Cell 140: 136–147.
23. Ghouil H, Montpied P, Epron D, Ksontini M, Hanchi B, et al. (2003) Thermaloptima of photosynthetic functions and thermostability of photochemistry incork oak seedlings. Tree Physiology 23: 1031–1039.
24. Pinto G, Silva S, Dias C, Costa A, Correia B, et al. (2010) Impact of hightemperature on photosynthesis, carbon metabolism and lipid peroxidation of cork oak plants. Antalya, Turkey: 24th IUFRO Conference for Specialists in AirPollution and Climate Change Effects on Forest Ecosystems.
25. Daas C, Montpied P, Hanchi B, Dreyer E (2008) Responses of photosynthesis tohigh temperatures in oak saplings assessed by chlorophyll-a fluorescence: inter-specific diversity and temperature-induced plasticity. Annals of Forest Science65: 305–305.
26. Ramırez-Valiente JA, Valladares F, Delgado Huertas A, Granados S, Aranda I(2011) Factors affecting cork oak growth under dry conditions: local adaptationand contrasting additive genetic variance within populations. Tree Genetics &Genomes 7: 285–295.
27. Ramirez-Valiente J, Lorenzo Z, Soto A, Valladares F, Gil L, et al. (2009)Elucidating the role of genetic drift and natural selection in cork oak differentiation regarding drought tolerance. Molecular Ecology 18: 3803–3815.
28. Allen CD, Macalady AK, Chenchouni H, Bachelet D, McDowell N, et al. (2010) A global overview of drought and heat-induced tree mortality reveals emerging climate change risks for forests. Forest Ecology and Management 259: 660–684.
29. Faria T, Wilkins D, Besford RT, Vaz M, Pereira JS, et al. (1996) Growth atelevated CO2 leads to down-regulation of photosynthesis and altered response tohigh temperature in Quercus suber L seedlings. Journal of Experimental Botany47: 1755–1761.
30. Haldimann P, Feller U (2004) Inhibition of photosynthesis by high temperaturein oak ( Quercus pubescens L.) leaves grown under natural conditions closelycorrelates with a reversible heat-dependent reduction of the activation state of ribulose-1,5-bisphosphate carboxylase/oxygenase. Plant, Cell & Environment27: 1169–1183.
31. Penuelas J, Llusia J (2002) Linking photorespiration, monoterpenes andthermotolerance in Quercus . New Phytologist 155: 227–237.
32. Chaves I, Passarinho JA, Capitao C, Chaves MM, Fevereiro P, et al. (2011)Temperature stress effects in Quercus suber leaf metabolism. Journal of PlantPhysiology 168: 1729–1734.
33. Haring M, Offermann S, Danker T, Horst I, Peterhansel C, et al. (2007)Chromatin immunoprecipitation: optimization, quantitative analysis and datanormalization. Plant Methods 3: -.
34. Thomas MR, Matsumoto S, Cain P, Scott NS (1993) Repetitive DNA of Grapevine - Classes Present and Sequences Suitable for Cultivar Identification.Theoretical and Applied Genetics 86: 173–180.
35. Hasbun R, Valledor L, Santamaria E, Canal M, Rodriguez R, et al. (2007)Dynamics of DNA methylation in chestnut trees development. Acta Horticul-turae 760: 563.
36. Valledor L, Hasbun R, Rodrıguez R, Canal M (2009) RNA-free DNA
extraction protocol from pinus tissues for molecular biology or HPCE/HPLC
analyses. Journal of Plant Biochemistry and Biotechnology 18: 229–232.
37. Cocconcelli PS, Porro D, Galandini S, Senini L (1995) Development of RAPD
protocol for typing of strains of lactic acid bacteria and enterococci. Letters in
Applied Microbiology 21: 376–379.
38. Valledor L, Meijon M, Hasbun R, Jesus Canal M, Rodrıguez R (2010)
Variations in DNA methylation, acetylated histone H4, and methylated histone
H3 during Pinus radiata needle maturation in relation to the loss of in vitro
organogenic capability. Journal of Plant Physiology 167: 351–357.
39. Shechter D, Dormann HL, Allis CD, Hake SB (2007) Extraction, purification
and analysis of histones. Nature Protocols 2: 1445–1457.40. Meijon M, Valledor L, Santamaria E, Testillano PS, Risueno MC, et al. (2009)
Epigenetic characterization of the vegetative and floral stages of azalea buds:
Dynamics of DNA methylation and histone H4 acetylation. Journal of Plant
Physiology 166: 1624–1636.
41. Monteuuis O, Baurens F, Goh D, Quimado M, Doulbeau S, et al. (2009) DNA
Methylation in Acacia mangium In vitro and Ex-vitro Buds, in relation to their
Within-shoot Position, Age and Leaf Morphology of the Shoots. Silvae Genetica
58: 287.
42. Tan MP (2010) Analysis of DNA methylation of maize in response to osmotic
and salt stress based on methylation-sensitive amplified polymorphism. Plant
Physiology and Biochemistry 48: 21–26.
43. Steward N, Ito M, Yamaguchi Y, Koizumi N, Sano H (2002) Periodic DNA
methylation in maize nucleosomes and demethylation by environmental stress.
Journal of Biological Chemistry 277: 37741–37746.
44. Kovalchuk O, Burke P, Arkhipov A, Kuchma N, James SJ, et al. (2003) Genome
hypermethylation in Pinus silvestris of Chernobyl—a mechanism for radiation
adaptation? Mutation Research/Fundamental and Molecular Mechanisms of
Mutagenesis 529: 13–20.
45. Boyko A, Blevins T, Yao Y, Golubov A, Bilichak A, et al. (2010)
Transgenerational Adaptation of Arabidopsis to Stress Requires DNA Methyl-
ation and the Function of Dicer-Like Proteins. Plos One 5: e9514.
46. Tsuji H, Saika H, Tsutsumi N, Hirai A, Nakazono M (2006) Dynamic and
reversible changes in histone H3-Lys4 methylation and H3 acetylation occurring
at submergence-inducible genes in rice. Plant and Cell Physiology 47: 995–1003.
47. Tetievsky A, Horowitz M (2010) Posttranslational modifications in histones
underlie heat acclimation-mediated cytoprotective memory. Journal of Applied
Physiology 109: 1552–1561.
48. Vanyushin B (2006) DNA Methylation in Plants. DNA Methylation: Basic
Mechanisms. In: Doerfler W, Bohm P, editors: Springer Berlin Heidelberg. pp.
67–122.
49. Meijon M, Feito I, Valledor L, Rodrıguez R, Canal MJ (2011) Promotion of
flowering in azaleas by manipulating photoperiod and temperature induces
epigenetic alterations during floral transition. Physiologia Plantarum 143: 82–92.
50. Meijon M, Jesus Canal M, Valledor L, Rodrıguez R, Feito I (2011) Epigenetic
and physiological effects of gibberellin inhibitors and chemical pruners on the
floral transition of azalea. Physiologia Plantarum 141: 276–288.
51. Ribeiro T, Viegas W, Morais-Cecilio L (2009) Epigenetic marks in the maturepollen of Quercus suber L. (Fagaceae). Sexual Plant Reproduction 22: 1–7.
52. Yakovlev IA, Asante DKA, Fossdal CG, Junttila O, Johnsen Ø (2011)
Differential gene expression related to an epigenetic memory affecting climatic
adaptation in Norway spruce. Plant Science 180: 132–139.
Epigenetic Markers and Acclimation of Cork Oak
PLOS ONE | www.plosone.org 9 January 2013 | Volume 8 | Issue 1 | e53543