Embed Size (px)
Citation preview

Delivering commercial insight
www.woodmac.com
© Wood Mackenzie 1
Presented to: Clean Coal Day 2013 International Symposium
Tokyo, Japan
September 4-5, 2013
International thermal coal trade: What will the future look like for Japanese buyers?
Ellen EwartHead of Global Coal Market Research, Wood Mackenzie

Delivering commercial insight
www.woodmac.com
© Wood Mackenzie 2
Agenda
1 The global market in context – a brief history
2 Near-term outlook: oversupply, but for how long?
3 Long-term outlook: global suppliers see opportunity and risk
4 Summary and conclusions

Delivering commercial insight
www.woodmac.com
The global seaborne thermal coal market continues to evolve
© Wood Mackenzie 3
0%
10%
20%
30%
40%
50%
60%
70%
80%
0
100
200
300
400
500
600
700
800
20
08
20
09
20
10
20
11
20
12
% P
acif
ic
Seab
orn
e I
mp
ort
s (
Mt)
Atlantic Pacific % Pacific
Source: Wood Mackenzie Coal Market Service
Pacific demand now dwarfs that in the Atlantic…
0
100
200
300
400
500
600
700
800
900
1,000
20
08
20
09
20
10
20
11
20
12
Seab
orn
e E
xp
ort
s (
Mt)
Indonesia Australia Russia Colombia South Africa
USA Vietnam Canada China Other
Source: Wood Mackenzie Coal Market Service
…and Pacific suppliers are reaping the benefits

Delivering commercial insight
www.woodmac.com
Pacific demand is surging, and traditional Atlantic suppliers are keen to participate in the upside
© Wood Mackenzie 4
The map shows 2012 trade flows from major exporting countries
7
22
11
45
1
172
349
21
8
35
1
9
31
69
31
65
Atlantic Trade 210 Mt
Pacific Trade 686 Mt Pacific
Trade 686 Mt
Source: Wood Mackenzie Coal Market Service

Delivering commercial insight
www.woodmac.com
In 2012, low coal prices and a weak freight market supported a 12% rise in seaborne thermal coal trade
© Wood Mackenzie 5
Source: Wood Mackenzie Coal Market Service, Coal Supply Service
Chinese arbitrage played a major role. Now >25% of global seaborne trade
95 Mt growth in trade in 2012 to almost 900 Mt
780
800
820
840
860
880
900
Seab
orn
e T
rad
e (
Mt)
0%
5%
10%
15%
20%
25%
30%
0
100
200
300
400
500
600
700
800
900
1000
2008 2009 2010 2011 2012M
tpa
Chinese Seaborne Thermal Imports
Total seaborne trade
China as % of thermal trade

Delivering commercial insight
www.woodmac.com
Oversupply will continue to depress prices in the near term…
© Wood Mackenzie 6
Ke
y C
oa
l P
ric
es
US
$/t
(O
rig
ina
l E
ne
rgy V
alu
es
)
$20
$40
$60
$80
$100
$120
$140
Sep-10 Mar-11 Sep-11 Mar-12 Sep-12 Mar-13 Sep-13 Mar-14 Sep-14
Key Coal Prices
FOB Newcastle (Hist.) WM Forecast: FOB Newcastle
FOB Richards Bay (Hist.) WM Forecast: FOB Richards Bay
ARA DES (Hist.) WM Forecast: ARA (DES)
FOB EnviroCoal (Hist.) WM Forecast: EnviroCoal
FOB EcoCoal (Hist.) WM Forecast: EcoCoal
WM Forecast: FOB Newc. 5,500 NAR HA JPU Newcastle Contract
Source: globalCOAL & Indonesian Govt (Hist), Wood Mackenzie (Forecasts)
Ke
y C
oa
l P
ric
es
US
$/t
(O
rig
ina
l E
ne
rgy V
alu
es
)
2012: Low gas prices in US disrupt domestic thermal market, forcing suppliers offshore. Australian export supply increases.
2011: Strong Chinese demand and constrained supply keeps upward pressure on prices.
2013: Despite some pull-back of US exports and Colombian strikes, market remains over-supplied as Australians increase volume.
2014: Oversupply persists, further rationalization required…
Delivering commercial insight
www.woodmac.com
0%
10%
20%
30%
40%
50%
60%
70%
80%
90%
100%
0 10 20 30 40 50
Ma
rgin
, %
ca
sh
co
st
Margin, US$ per tonne
Vietnam
Australia
Russia
Canada
Indonesia
United States
South Africa Australia
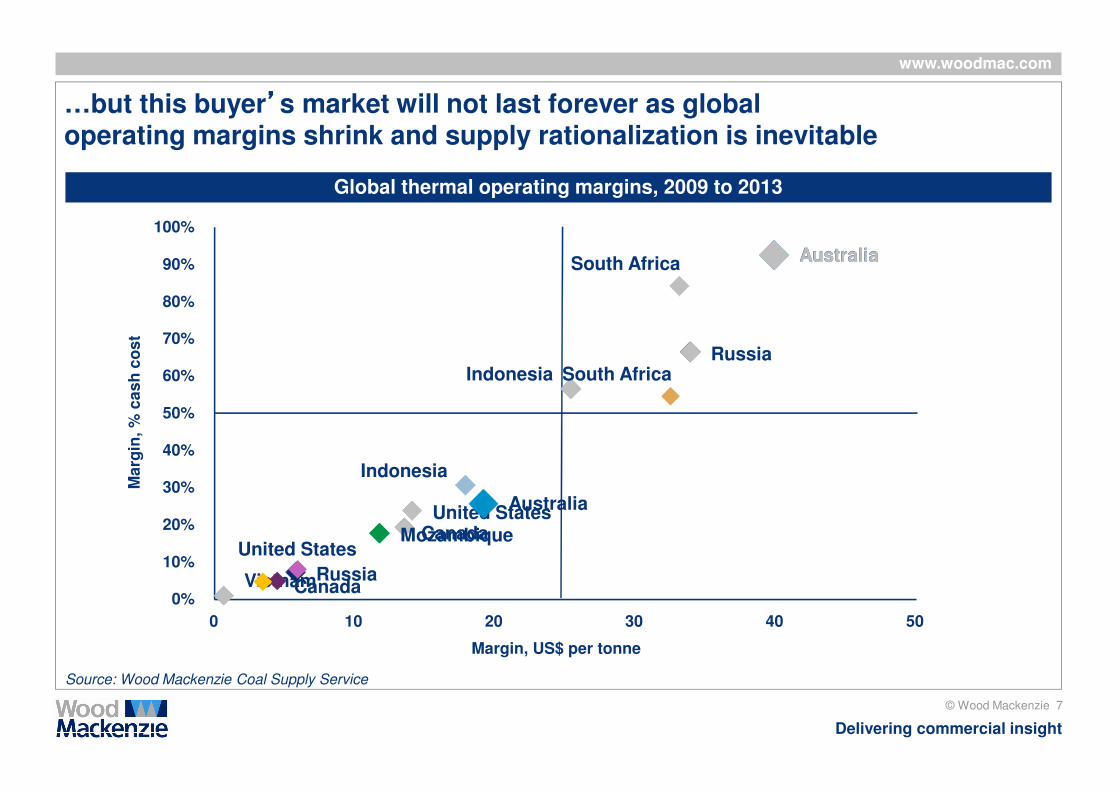
…but this buyer’’’’s market will not last forever as global operating margins shrink and supply rationalization is inevitable
© Wood Mackenzie 7
Global thermal operating margins, 2009 to 2013
Source: Wood Mackenzie Coal Supply Service
Australia
RussiaCanada
Indonesia
United States
South Africa
Mozambique

Delivering commercial insight
www.woodmac.com
2012 2013
Australian miners are deferring capital spending
© Wood Mackenzie 8
Capital spend for greenfield coal projects; old versus new forecast
Source: Wood Mackenzie Coal Global Economic Model
2011 2013 2015 2017 2019 2021 2023 2025
0
2
4
6
8
10
12
14
A$
bil
ion
(re
al 2
01
3)

Delivering commercial insight
www.woodmac.com
Longer term, demand growth will put pressure on the global supply chain
0
3,000
6,000
9,000
12,000
2012 2015 2018 2021 2024 2027 2030
Co
al d
em
an
d (
Mt)
China India JST TMPV GT Rest of world
0%
25%
50%
75%
100%
2012 2015 2018 2021 2024 2027 2030C
oal d
om
esti
c "
self
-su
ffic
ien
cy"
China India TMPV GT
© Wood Mackenzie 9
Increasing reliance on imports5.5 Bt of total coal demand growth to 2030
JST = Japan, South Korea, Taiwan; TMPV = Thailand, Malaysia, Philippines, Vietnam; GT = Germany, Turkey
Source: Wood Mackenzie Coal Market Service

Delivering commercial insight
www.woodmac.com
Over 1 Btpa of new capacity will be required from unknown sources
© Wood Mackenzie 10
Source: Wood Mackenzie Coal Market Service and Coal Supply Service
Marketable production for export (Mt)Global seaborne coal exports by destination (Mt)
1,500
3,000
2012
2014
2016
2018
2020
2022
2024
2026
2028
2030
Other China India
1,500
3,000
2012
2014
2016
2018
2020
2022
2024
2026
2028
2030
Yet to be developedOperating Projects

Delivering commercial insight
www.woodmac.com
0
20
40
60
80
100
120
140
160
180
200
US
$/t
(R
eal 2013)
-In
cen
tive P
rice
2018 FOB Newcastle 6,322 Spot Price Forecast
Current FOB Newcastle 6,322 Spot Price
Australia
Canada
Colombia
Indonesia
South Africa
Source: Wood Mackenzie Coal Supply Service and Coal Market Service
0
20
40
60
80
100
120
140
160
180
200
US
$/s
t (R
eal 2013)
–In
cen
tive P
rice
Current FOB Newcastle 6,322 Spot Price
2018 FOB Newcastle 6,322 Spot Price Forecast
Australia
Canada
Colombia
Indonesia
South Africa
Much of the new supply will need higher prices to be viable…
© Wood Mackenzie 11
10% IRR 20% IRR

Delivering commercial insight
www.woodmac.com
© Wood Mackenzie 12
…as will existing supply from the US Powder River Basin (PRB)
Stylized margin comparison ($/t, 5,100 kcal/kg coal)
Source: Wood Mackenzie Coal Market Service and Coal Supply Service
$-
$10
$20
$30
$40
$50
$60
$70
$80
$90
$100
$0
$10
$20
$30
$40
$50
$60
$70
$80
$90
$100
Co
st
US
$/t
*(R
ea
l U
S$
20
12)
Co
st
US
$/t
*R
ea
l U
S$
20
12)
Indonesia, Tutupan US PRB, Spring Creek
2018 CFR China 5,100kcal basis

Delivering commercial insight
www.woodmac.com
Straight of Juan de Fuco
Vancouver
Victoria
Pacific Ocean
Port of Morrow - 2014 - 2017(Westward \ Ambre Energy)
Coos Bay - 11 Mstpa - 2017
Port Westward - Ambre Energy - 10 Mstpa - 2014 - 2017
Gateway - 54 Mstpa - 2017
Neptune - 10 Mstpa(Expansion 4 Mstpa 2013)
Westshore - 32 Mstpa(Expansion 4 Mstpa 2014)
Greys Harbor - 4 Mstpa
Millennium - 49 Mstpa - 2017
Columbia Rive
r
Port Westward - Kinder Morgan - 17 Mstpa - 2017
Tacoma
Seattle
Portland
BRITISH COLUMBIA
CANADA
USA
WASHINGTON
OREGON
121°3'W
121°3'W
123°54'W
123°54'W
126°45'W
126°45'W
49°3
9'N
49°3
9'N
46°4
8'N
46°4
8'N
43°5
7'N
43°5
7'N
Source: Wood Mackenzie
USA
MEXICO
Pacific Ocean
Long Beach - 3 Mstpa
MT
CA
AK
ID
AZ
NV
ORWY
NM
UT CO
WA
CANADA
Ridley - 13 Mstpa(Expansion 13 Mstpa 2016)
NT
BC AB
YT
SK
NU
0 100 20050
MilesExisting Port
New Port Development
© Wood Mackenzie 13
And infrastructure hurdles remain for aspiring US suppliers
Gateway Pacific – SSA Marine (Cherry Pt., WA)• Up to 48 Mtpa• Throughput agreements with Peabody and Cloud Peak• Permitting process underway; formal protest lodged by
native American group (Lummi Nation) could be disruptive; also required to consider greenhouse gas emissions in Asia and rail transport impacts
• Earliest operation - 2018
Millenium Bulk Terminals – Ambre Energy/Arch Coal (Longview, WA)
• 25-44 Mtpa• Brownfield renovation of Alcoa site• Scoping period 8-Aug through 18-Nov, 2013• Cloud Peak has a 5 Mtpa throughput option• Earliest operation - 2017
Morrow Pacific – Ambre Energy (Port of Morrow/Port Westward, OR)
• Phase 1 = 3.5 Mtpa, Full Capacity = 8 Mtpa• Coal barging and trans-shipment on Columbia River• Scoping underway, deadline for public comment
extended; Oregon not covered by state-level environmental protection (unlike Washington)
• Earliest operation - 2015

Delivering commercial insight
www.woodmac.com
Competition for supply will intensify as China, India, and other emerging economies continue to ramp up imports
© Wood Mackenzie 14
0%
5%
10%
15%
20%
25%
30%
35%
40%
45%
50%
0
500
1,000
1,500
2,000
2,500
2008 2010 2012 2014 2016 2018 2020 2022 2024 2026 2028 2030 2032 2034
Sh
are
in
glo
bal seab
orn
e m
ark
et,
%
Seab
orn
e im
po
rts, M
t
China India Japan Other Asia China % India % Japan% Other Asia%
Source: Wood Mackenzie Coal Market Service
Seaborne thermal coal imports – Pacific Basin (Mt)
Delivering commercial insight
www.woodmac.com
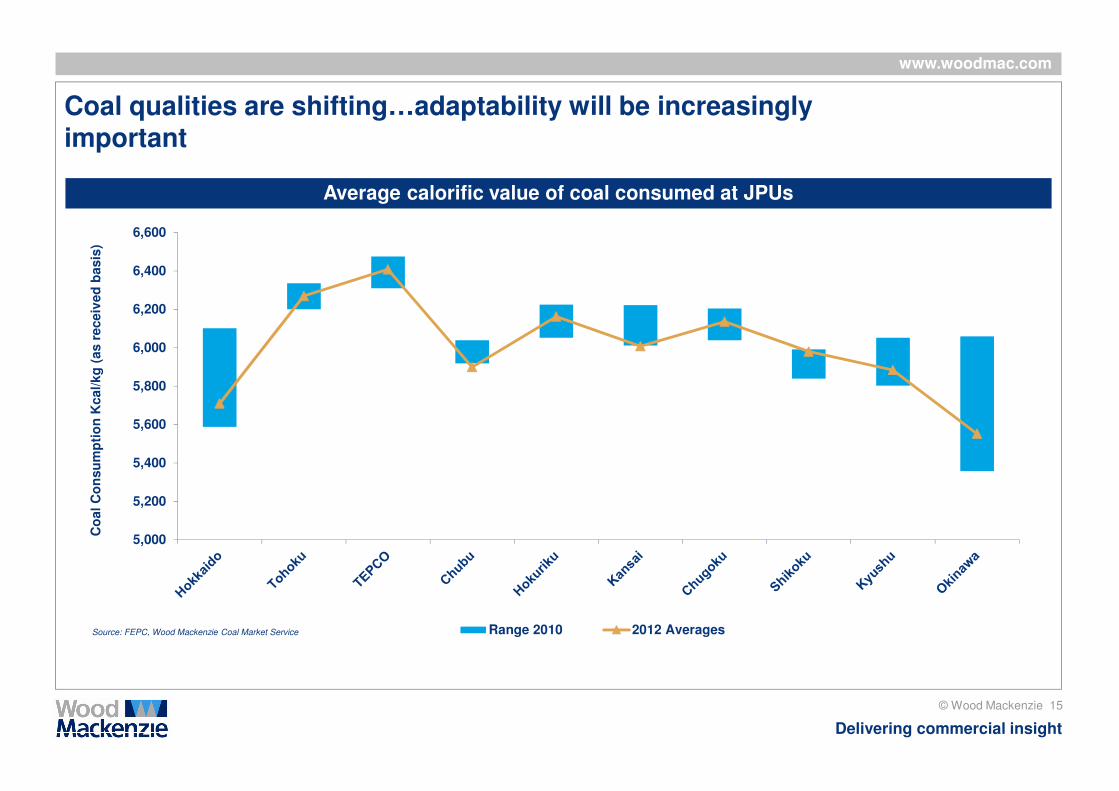
Coal qualities are shifting…adaptability will be increasingly important
© Wood Mackenzie 15
5,000
5,200
5,400
5,600
5,800
6,000
6,200
6,400
6,600
Co
al
Co
nsu
mp
tio
n K
cal/kg
(as r
eceiv
ed
basis
)
Range 2010 2012 AveragesSource: FEPC, Wood Mackenzie Coal Market Service
Average calorific value of coal consumed at JPUs

Delivering commercial insight
www.woodmac.com
Long-term coal prices will increase
© Wood Mackenzie 16
$0
$20
$40
$60
$80
$100
$120
$140
$160
2008 2010 2012 2014 2016 2018 2020 2022 2024 2026 2028 2030 2032 2034
US
$/t
, R
eal
2012
(ori
gin
al
en
erg
y v
alu
es)
FOB Newcastle @ 6,322 kcal/kg GAR FOB HA Newcastle@ 5,500 kcal/kg NAR
FOB Richards Bay @ 6,300 kcal/kg GAR FOB Indonesia EnviroCoal @ 5,000 kcal/kg GAR
FOB Indonesia EcoCoal @ 4,200 kcal/kg GAR FOB Bolivar @ 6,300 kcal/kg GAR
Source: globalCOAL and Indonesian govt. (History), Wood Mackenzie Coal Market Service (Forecasts)
Thermal coal price forecast, FOB port (US$/t, Real 2012)

Delivering commercial insight
www.woodmac.com
Summary and conclusions
The makeup of the global coal industry is changing, with demand shifting inexorably to the Pacific. Traditional Atlantic Basin suppliers are seeking means of participating in this growth market. Strong and sustainable demand, reliable infrastructure, and a supportive pricing environment are all critical to the long-term competitiveness of remote coals into the Asian market.
Global suppliers are facing margin pressure from increasing costs and a persistent low price environment. Investment decisions are being delayed as a result, which could contribute to shortages once the current supply overhang is absorbed.
China, India, and other emerging economies of Asia have shown a willingness to trade coal quality for a lower price, which is favoring lower rank coals from Indonesia and higher ash coals from Australia. The availability and pricing of higher quality coals favored by Japanese buyers may increasingly be under pressure as a result.
While Japan’’’’s market share will inevitably fall as demand from China and India increases, it will remain an important and attractive market for global suppliers. Buyers should be focused on developing a tolerance for a wider range of coal specifications in order to enhance supply security and reduce costs.
© Wood Mackenzie 17

Delivering commercial insight
www.woodmac.com
© Wood Mackenzie 18
Ellen EwartHead of Global Coal Market Research
T +1 410 295 4221E [email protected]
Ellen Ewart has worked in and around the coal and energy industries over a career spanning more
than 25 years. She joined Wood Mackenzie in July 2007 as Head of Americas Coal Consulting and
three years later moved to into her current role in Coal Market Research.
Prior to joining Wood Mackenzie, she was Vice President of Investor and Media Relations for
Foundation Coal, having moved to that role from Director of Market Research when the company
went public in 2004. She joined Foundation (and its predecessor company, RAG American Coal
Holding Co.) from Platts Research and Consulting, where she was a Principal.
Other notable stops along her career path include five years with CONSOL Energy (in Exploration
and Corporate Planning) and two years with Price Waterhouse Management Consulting.
Ellen earned a BS degree in geology from Duke University and a MS degree in mineral economics
from the Colorado School of Mines.
Delivering commercial insight
www.woodmac.com
© Wood Mackenzie 19
Contact
Ellen Ewart – Head of Global Market Research
T: +1 410 295 4221
Seles contact
Hide Kato – Client Manager, Metals and Mining Japan
T: +81 3 6860 8408
Delivering commercial insight
www.woodmac.com
Summary and conclusions
The makeup of the global coal industry is changing, with demand shifting inexorably to the Pacific. Traditional Atlantic Basin suppliers are seeking means of participating in this growth market. Strong and sustainable demand, reliable infrastructure, and a supportive pricing environment are all critical to the long-term competitiveness of remote coals into the Asian market.
Global suppliers are facing margin pressure from increasing costs and a persistent low price environment. Investment decisions are being delayed as a result, which could contribute to shortages once the current supply overhang is absorbed.
China, India, and other emerging economies of Asia have shown a willingness to trade coal quality for a lower price, which is favoring lower rank coals from Indonesia and higher ash coals from Australia. The availability and pricing of higher quality coals favored by Japanese buyers may increasingly be under pressure as a result.
While Japan’’’’s market share will inevitably fall as demand from China and India increases, it will remain an important and attractive market for global suppliers. Buyers should be focused on developing a tolerance for a wider range of coal specifications in order to enhance supply security and reduce costs.
© Wood Mackenzie 20

Delivering commercial insight
www.woodmac.com
© Wood Mackenzie 21
Global OfficesAustralia
Brazil
Canada
China
India
Global Contact DetailsEurope +44 (0)131 243 4400
Americas +1 713 470 1600
Asia Pacific +65 6518 0800
Email [email protected]
Website www.woodmac.com
Japan
Malaysia
Russia
Singapore
South Korea
United Arab Emirates
United Kingdom
United States
Wood Mackenzie is the most comprehensive source of knowledge about the world’s energy and metals industries. We analyse and advise on every stage along the value chain - from discovery to delivery, and beyond - to provide clients with the commercial insight that makes them stronger. For more information visit: www.woodmac.com