Embed Size (px)
Citation preview

National Foundation for Educational Research
International thematic probe:
The influence of relative age on learner attainment and development
Caroline Sharp, Nalia George, Claire Sargent, Sharon O'Donnell, Maureen Heron
February 2009
QSB

© QCA, 2009
This document is made available under Open Government Licence. This means that you are free to
copy, publish, distribute and transmit the information; adapt the information; and exploit it
commercially, for example, by combining it with other Information, or by including it in your own
product or application. However, in doing so, you must not use the information in a way that
suggests any official status or that the information provider endorses you or your use of the
information; ensure that you do not mislead others or misrepresent the information or its source;
and ensure that your use of the information does not breach the Data Protection Act 1998 or the
Privacy and Electronic Communications (EC Directive) Regulations 2003. You must also
acknowledge the source of the information by including the below attribution statement.
Attribution statement:
Contains public sector information, originally collated by the National Foundation for Educational
Research (NFER) in England for the Department for Education and licensed under the Open
Government Licence v1.0.: http://www.nationalarchives.gov.uk/doc/open-government-licence/

Acknowledgements
We would like to thank the Qualifications and Curriculum Authority for commissioning this
review and the following international contacts for responding to our request for information
about relative age effects in their countries or states.
Steve Benson and Ian Schagen, Ministry of Education, New Zealand
Chiara Wooning, Dutch Eurydice Unit
Carmel Gallagher, CCEA, Northern Ireland
Professor John Gardner, School of Education, Queen’s University
Annette Bridges, Early Childhood Education, Kentucky
Brigitte Lohmar, German (Land) Eurydice Unit
Andreas Messerli, IDES/EDK, Switzerland
Urs Moser, Institut für Bildungsevaluation, Switzerland
Alejandro Carrasco, Chile
Erika Bartolini, Italian Eurydice Unit
Marguerite Day, Ministry of Education, British Columbia
Sandra Mahar, Education Policy and Research Division, Department of Education and Early
Childhood Development, Victoria
Morfudd Roberts, Department for Children, Education, Lifelong Learning and Skills, Welsh
Assembly Government
Professor Collette Tayler, Chair of Early Childhood Education and Care, Melbourne
Graduate School of Education, The University of Melbourne, Queensland
Professor Masatoshi Jimmy Suzuki, Center for School Education Research, Hyogo
University of Teacher Education, Japan
We would also like to thank Sagina Khan, our project administrator as well as Marian Morris
and Jo Morrison and Dougal Hutchison from the NFER Statistical Analysis and Research
Group for their help in interpreting statistical papers. Finally, we would like to thank Alison
Jones and other members of the NFER library team for their assistance in obtaining literature
and checking the accuracy of the references.

Contents
Executive Summary 1
1. Introduction 4
2. Review Findings 8
3. Conclusion and Implications 18
4. Summaries of Evidence 21
5. References 44
Appendix 1 Search Strategy 47
Appendix 2 Country Context for the Countries Reviewed 51

1
Executive Summary
This rapid review of research evidence was commissioned by the Qualifications and
Curriculum Authority (QCA) to investigate the issue of relative age in the
international context. The review set out to examine three questions:
1. To what extent does the age of learners relative to other pupils in their year
group affect their attainment and development?
2. Does this relative age affect the attainment and development of some
groups or types of learners more than others?
3. Do certain educational policies and practices, particularly those relating to
curriculum and assessment, mediate the effect of relative age on
attainment and development?
Main findings
The review findings are drawn from 18 research studies published from 2000 to 2008
and carried out in Australia, Chile, the United Kingdom and the USA together with
further information supplied by international contacts in 13 countries and states. All
of the studies found evidence of statistically significant effects for relative age
(comparing the youngest to the oldest in the year group). Key findings on the extent
of the relative age effect are:
Pupils who are younger in the year group do less well in attainment tests
(commonly measured subjects are maths, reading, writing and average
attainment across subjects).
Studies conducted in the USA and Chile found that children who are
younger in the year group are more frequently retained (meaning that they
have to repeat a year of schooling).
Evidence from the United Kingdom and the USA shows that relatively
younger children are more frequently identified as having special
educational needs.
Evidence from two British studies found a statistically significantly higher
incidence of psychopathology and referral to psychiatric support services
among relatively younger children.
Relative age effects for attainment are quite large (effect sizes of up to 0.8)
for young children, measured soon after they start school. There is a
smaller relative age difference among older primary children but the
difference remains ‘educationally significant’ throughout primary school.
At secondary stage, the difference is still apparent but is usually not
educationally significant (i.e. effect sizes are typically below 0.25).
There was limited evidence to establish whether relative age particularly
affects the attainment and development of certain groups of learners. The
available evidence suggests that the effects of gender, economic

2
deprivation, ethnicity and relative age operate independently of one
another.
There was limited direct evidence to support particular educational
policies and practices in reducing relative age effects, apart from the
adoption of age standardised tests.
Conclusions and Implications
The most obvious explanation for relative age effects is that assessment results are not
adjusted to take account of the fact that children are younger or older when taking the
test. Other explanations that could contribute to this effect are: age in relation to peers
(age position effect) and age on starting school. A child’s age position could
contribute to poor performance and even psychological problems if younger children
cannot access a curriculum aimed at older children, if they experience failure or
stress, or compare themselves unfavourably to their older classmates. Age on starting
school could contribute to relative age effects if younger children find it harder to
adjust to the transition or to meet the requirements of a formal curriculum.
Another possible explanation for relative age effects is length of schooling (in a
system where children enter school at different points during the year, according to
their date of birth). The review found that evidence for different lengths of schooling
contributing to the magnitude of relative age effects was inconclusive. Even though
length of schooling could possibly contribute to the differences in outcomes, it could
not be the main reason for relative age effects because these are found in groups of
children who all entered school at the same time.
The review rejected the hypothesis that children who are younger in the year group
suffer from developmental delay or brain injury due to pre-natal exposure to seasonal
illness or environmental deficit. This explanation was undermined by clear evidence
that children who are born at the same time of the year in countries with similar
seasonal conditions, have better or worse outcomes according to whether they are
younger or older in relation to the school year. This means that relative age effects are
most likely to be caused by the educational system, rather than by any inherent
characteristics for children who are born at certain times of the year.
The strategies identified as most likely to help reduce relative age effects are:
Assessment: use age standardised tests; enter children for assessment
when ready. It is likely that the use of age standardised tests would remove
the relative age effect in academic achievement entirely (as has been
demonstrated in Northern Ireland) and could reduce effects for other
outcomes (such as SEN identification and psychiatric problems).
Curriculum: ensure that the curriculum is appropriate for relatively
younger children, especially in the early years of schooling when relative
age differences are greatest.

3
Pedagogy: use developmentally appropriate pedagogy, especially in the
early years of schooling. Ensure teachers are aware of relative age effects
and that they know which children are the youngest in the class; enable
younger children to have leadership opportunities and encourage them to
value their own achievements rather than to compare their progress with
that of older classmates.
Referral for special needs and psychiatric support: monitor referral
rates for the relative age effects; review the identification process to avoid
relative age being mistaken for developmental delay; raise awareness of
this issue among those responsible for decision-making.
The practices of deferring entry for children not considered to be ‘ready’ for school or
requiring children to repeat a year are not recommended for addressing relative age
effects.
The evidence suggests that the Government’s attention should be focused on ensuring
developmentally appropriate and positive experiences for relatively younger children
in the primary school and also on ensuring that the process for identifying children
with special educational needs takes account of relative age. This, together with
taking account of relative age effects in assessment results, would help to ensure that
that differences in children’s birth dates do not become a continuing source of
disadvantage for children and young people.
About the review
This rapid review sought national and international research evidence on relative age
effects, published in English between 2000 – 2008. Searches of social science and
education databases yielded 92 items which appeared to fit the parameters. The team
attempted to obtain the full text of 29 most relevant items, 18 of which were included
in the review.
An email enquiry was sent to contacts in all of the countries covered by the INCA
Archive1, 13 of whom replied. The email outlined the findings of the literature review
and asked contacts about any research in their country/state which either supported or
refuted the findings. Contacts were also asked for information on any strategies or
policies which may have been implemented to counteract the relative age effect and
of any evidence of their impact.
Because this review was carried out in a period of four months, there are inevitable
limitations on the completeness of the evidence base and the depth of analysis carried
out.
1 In addition to the INCA Archive, a contact in Chile was provided by the Qualifications and
Curriculum Authority.

4
1. Introduction
1.1 Purpose and policy context
As part of its commitment to building the evidence base for the curriculum in England, the
Qualifications and Curriculum Authority (QCA) has commissioned the National Foundation
for Educational Research (NFER) to investigate the issue of relative age in the international
context. The NFER is undertaking this through a rapid review of international literature,
followed by a request for information to international contacts, asking them to clarify and
supplement the international research evidence.
In January 2008, The Secretary of State for Education wrote to Sir Jim Rose, asking him to
lead an independent review of the primary curriculum (DCSF, 2008). The letter stated:
Entry to primary school can be problematic for summer-born children. For
example, summer-born children are up to a year younger than their
classmates when they sit tests at the end of each key stage. This can affect
their performance right though school up to the age of 16. I would like our
review to give particular consideration to how we can design the curriculum
to improve outcomes for summer-born children.
This rapid review was commissioned to contribute to the review of the primary curriculum. It
focuses on the impact of relative age on learners’ attainment and development at school. The
term ‘relative age’ refers to the age of children within a given school year group. In England,
this is commonly referred to as the ‘summer-born’ effect, because children who are the
youngest in the school year-group are born in the summer months, with their birthdays falling
in the summer term of the academic year (May to August birth dates).
The key questions for the rapid review are:
1. To what extent does the age of learners relative to other pupils in their year group
affect their attainment and development?
2. Does this relative age affect the attainment and development of some groups or
types of learners more than others?
3. Do certain educational policies and practices, particularly those relating to
curriculum and assessment, mediate the effect of relative age on attainment and
development?
Features of the school system and environment of particular interest in relation to their impact
on relative age effects included: school starting age, structure, curriculum organisation, and
teaching and learning. Outcome measures of particular interest were pupil attainment and
personal development. The review included children in the early years, primary and
secondary education, with a particular focus on primary schooling.

5
1.2 Rapid review process
This review was completed during August to December 2008. It included national and
international literature, written in English, published during the period from January 2000 to
July 2008. It involved systematic searches of: the Applied Social Sciences Index and
Abstracts (ASSIA) database; the Australian Education Index; the British Education Internet
Resource Catalogue (BEIRC); the British Education Index; CERUK Plus; ChildData;
Educational Resources Information Center (ERIC); the International Bibliography of the
Social Sciences (IBSS); and the PsycInfo database. (Further information on the search
strategy is provided in Appendix 1.) The review parameters included research and policy
information (published articles, reports and unpublished material such as conference papers).
It focused on primary education (children aged four to 11 years), but included secondary and
early years education, where relevant.
The search results were first screened to ensure that they fit within the date parameters and
did not contain duplicates. The review team then prioritised the results, to identify the items
of most relevance to the review questions (based on the information provided in the
abstracts). This was done independently by two members of the review team. In addition to
considering the relevance of each item, the team also took into consideration the country of
origin. Items from countries not already represented in the selection were given a higher
priority, because of the interest in including examples from a range of countries with different
educational systems and structures.
The team obtained a full copy of the priority items for further appraisal and prepared
summaries of their findings in relation to the review questions. The team also checked the
references cited in these studies to see whether they identified any further material of interest
to the review that had not been found in the database searches. Some of the research papers
were highly technical in nature, so the team referred certain papers to NFER’s statisticians
who helped to check the quality and interpretation of statistical analyses. All the evidence
cited in this review has passed basic checks of research quality.
A second phase of the review involved collecting further information from international
contacts (see Section 2.3).
1.3 Extent and coverage of the evidence base
The review identified 92 items of literature which appeared to fit the review parameters (on
the basis of information provided in the abstracts), 29 of which were identified as being
highly relevant to the research questions. The research team found that much of the literature
identified in the keyword searches was not directly relevant to the review because it focused
on the effect of the school starting age, rather than on a child’s age relative to other students
in the year group. The team attempted to obtain all of the 29 most relevant items. We were
unable to obtain six items: four (Bishop, 2008; Fleischman, 2007; Schrage, 2007 and Yesil-
Dagli, 2006) because they were dissertations, which the British Library was unable to obtain.
The other two were not available even though they were published articles. Chow (2007) was
6
published in an Australian journal, which would not have arrived in sufficient time to be
included in the review. Greenwood and Ayre (2005) was not included because the British
Library was unable to obtain the article.
Of the 23 items obtained, five were rejected after reading the full text. Three of these were
rejected because they did not address the research questions: Blake and Finch (2000),
Kavkler (2000), Tymms et al. (2000). Two articles (Kawaguchi, 2006 and Plug, 2001) both
analysed the effects of relative age on outcomes for young people and adults once they had
left compulsory education: these items were rejected because they did not report any
outcomes for young people in primary or secondary education, as specified in the review
parameters.
The total number of research studies identified in the literature searches and included in this
review is 18. They comprise studies carried out in Australia, Chile, the United Kingdom and
the USA. Additional evidence was supplied by contacts in13 countries/states.
1.4 Review limitations
This was a rapid review of literature, conducted in a period of just two months. The review
has a number of limitations which affect the completeness of the evidence base and the depth
of the analysis carried out.
The review focused on national and international literature dating from the period
2000–2008 and available in English only. A range of database searches was
conducted but there are other databases and websites that could have been
searched. No hand searches were carried out.
The review was carried out in a very short timescale, and therefore allowed
limited time to obtain and assess material. As noted above, a small amount of
material could not be included because it was not possible to obtain it in time.
While all of the summaries of research were checked by another member of the
team for coherence and completeness, there was insufficient time and resources to
carry out independent checks of the accuracy of all of the summaries.
1.5 Possible explanations for season of birth effects
The season of birth effect, whereby UK children born in the autumn months perform best and
children born in the summer months perform least well at school, has been recognised for
many years. It has been identified as a source of inequality and many recommendations have
been put forward for actions that should be taken to address relative age effects. In order to
make rational decisions about which actions to take it is important to understand more about
the nature of the phenomenon and why it occurs.
A number of possible causes of season of birth effects have been identified, the most
common of which are set out below.

7
Pre-natal effects: this explanation suggests that children born in the summer are
affected by seasonal conditions (such as low temperatures and lack of sunlight)
and illnesses (such as influenza) which are more prevalent in the winter months
when they are in the early stages of pre-natal development. It is thought that this
could result in brain damage or developmental delay.
Age at testing (absolute age effects): this explanation holds that season of birth
effects are an artefact of the assessment system. Children who are youngest in the
year group are also youngest and therefore least mature when tested. If all children
were tested at the same age, this hypothesis suggests that apparent differences in
attainment would disappear.
Age in relation to peers (age position effects): this suggests that being oldest in
the class gives children an advantage because they are more developmentally
mature, receive more positive feedback from teachers and assume a ‘leadership’
position; whereas the reverse is true for the youngest children in the class.
Younger children may compare themselves with older classmates, leading to
feelings of inadequacy, with resulting damage to their feelings of competency and
self worth.
Age on starting school: developmental differences are greatest when children are
young. This explanation suggests that age on starting school may be important
because the youngest children are least able to cope with the demands of a
‘formal’ curriculum, and are more likely to experience stress and failure.
Length of schooling effects: if the admission system has more than one entry
point during the year (e.g. termly or biannual entry), younger children are usually
admitted last and therefore receive less schooling than their older peers. Less
exposure to learning may lead to poorer performance in school assessments.
The rest of this report considers the research evidence and identifies which of these
explanations is best supported by the evidence.
8
2. Review Findings
This part of the report considers the evidence from 18 studies in relation to the questions set
for the review. Summaries of each study are provided at the end of this report.
2.1 To what extent does the age of learners relative to other pupils in their year group affect their attainment and development?
Seventeen of the 18 studies looked for relative age effects and all of them found evidence of
such effects. (The exception was the study by Datar, 2006, which focused on the impact of
delaying entry to school, taking account of relative age, rather than presenting direct evidence
of relative age effects). The 17 studies included children of different ages and used a variety
of outcome measures, falling into five main categories: school attainment (typically literacy
and numeracy tests); intelligence tests; progress through education (grade retention and
college entrance); special educational needs identification; and mental health.
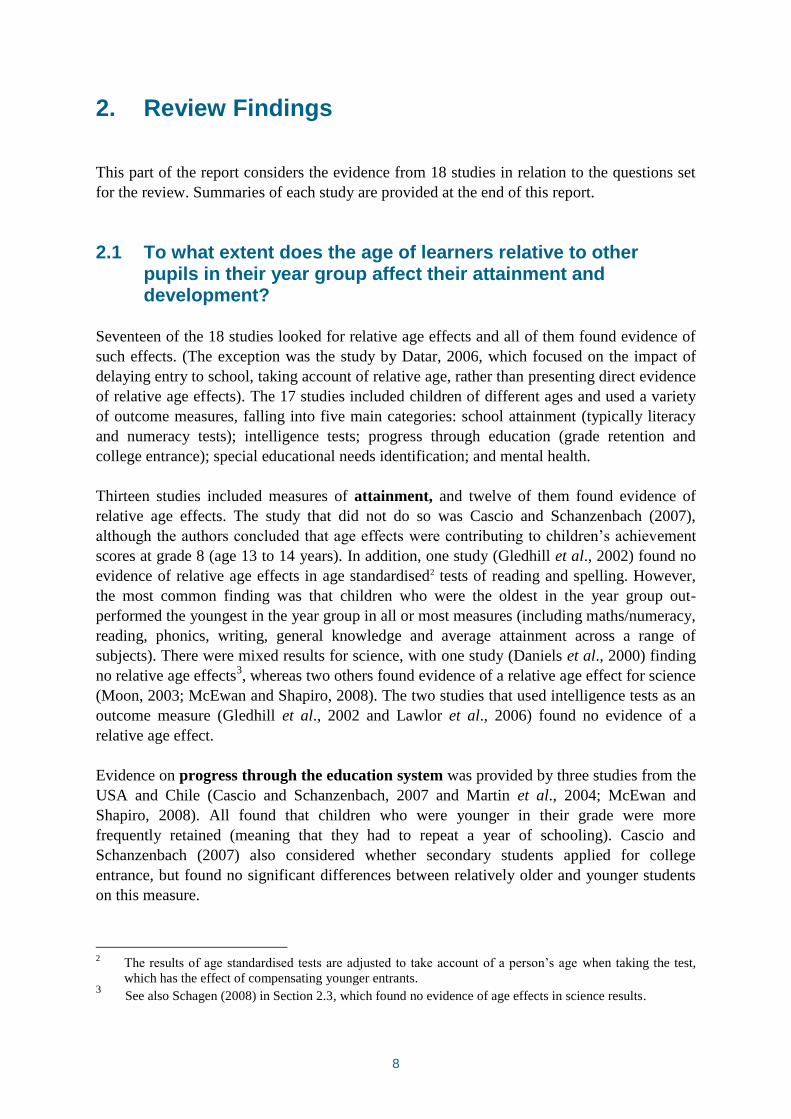
Thirteen studies included measures of attainment, and twelve of them found evidence of
relative age effects. The study that did not do so was Cascio and Schanzenbach (2007),
although the authors concluded that age effects were contributing to children’s achievement
scores at grade 8 (age 13 to 14 years). In addition, one study (Gledhill et al., 2002) found no
evidence of relative age effects in age standardised2 tests of reading and spelling. However,
the most common finding was that children who were the oldest in the year group out-
performed the youngest in the year group in all or most measures (including maths/numeracy,
reading, phonics, writing, general knowledge and average attainment across a range of
subjects). There were mixed results for science, with one study (Daniels et al., 2000) finding
no relative age effects3, whereas two others found evidence of a relative age effect for science
(Moon, 2003; McEwan and Shapiro, 2008). The two studies that used intelligence tests as an
outcome measure (Gledhill et al., 2002 and Lawlor et al., 2006) found no evidence of a
relative age effect.
Evidence on progress through the education system was provided by three studies from the
USA and Chile (Cascio and Schanzenbach, 2007 and Martin et al., 2004; McEwan and
Shapiro, 2008). All found that children who were younger in their grade were more
frequently retained (meaning that they had to repeat a year of schooling). Cascio and
Schanzenbach (2007) also considered whether secondary students applied for college
entrance, but found no significant differences between relatively older and younger students
on this measure.
2 The results of age standardised tests are adjusted to take account of a person’s age when taking the test,
which has the effect of compensating younger entrants. 3 See also Schagen (2008) in Section 2.3, which found no evidence of age effects in science results.

9
Seven studies investigated the influence of relative age effects in special educational needs
(SEN) identification (Crawford et al., 2007; Gledhill et al., 2002; Martin et al., 2004; Polizzi
et al., 2007; Wilson, 2000) and one included a measure of children’s behaviour (Menet et al.,
2000). All found evidence of statistically significant relative age effects, with the youngest
children in the year group being more frequently identified as having SEN or poor behaviour.
Finally, two studies investigated mental health indicators. Both found evidence of
significant relative age effects in measures of psychopathology and psychiatric disorders
(Goodman et al., 2003) and referrals to psychiatric support services (Menet et al., 2000).
2.1.1 How big is the effect and how long does it last?
It can be difficult to answer the question ‘How big is the relative age effect?’ when
attempting to synthesise evidence from different studies. Few studies provide information
about the extent of the effect in relation to the influence of other factors and/or consider its
persistence over time.
Many studies use tests of statistical significance, which are useful in indicating the
probability that a given difference could be the result of chance, but are less helpful in
judging the extent of an effect because they are influenced by the sample size (it is possible
for a small effect to achieve statistical significance in a large sample or a large effect to fail to
achieve statistical significance because the sample is small). An effect size is a useful means
of making comparisons to be made across studies. An effect size represents the difference
found by dividing the observed difference between two groups by the standard deviation of
the scores in the relevant population. An effect size of 1 is equivalent to a difference of one
standard deviation in the outcome. A useful rule of thumb in considering the importance of a
given value is that an effect size of 0.25 or more is likely to represent a finding which is of
educational, as well as statistical significance (Gray et al., 1990, Slavin and Fashola, 1998).
The US What Works Clearinghouse4, which provides a highly regarded resource of evidence
of ‘what works’ in education, also sets an effect size of at least 0.25 as the minimum level
indicating that an educational intervention has an impact and that is worth consideration for
wider adoption.
The evidence suggests that the difference between relatively younger and older children is
educationally significant at an early age (for example, when children start school) but
becomes progressively smaller as children grow older. This trend was evident across the
studies and was found in two studies which reported results for both primary and secondary
age-groups (Crawford et al., 2007; Oshima and Domaleski, 2006). On the other hand,
McEwan and Shapiro (2008) found larger relative age difference among 14-year-olds than
ten-year-olds, although their study used entirely different samples and measures to consider
relative age effects in children of different ages.
4 See http://ies.ed.gov/ncee/wwc/

10
Oshima and Domaleski (2006) studied academic performance in a US sample of
approximately 115,000 children. Results indicated much larger effect sizes for relative age
differences among younger children. Kindergarten (age five) effect sizes were 0.38 for
reading, 0.55 for maths and 0.50 for general knowledge. Differences between relatively older
and younger students in reading and maths were statistically significant for grades 1 – 5 (ages
6 to 11), but not for grades 6-8 (ages 11 – 14). The authors comment that the most
statistically significant predictors of positive reading and maths attainment across all age
ranges were ethnicity (which explained 10-15 per cent of the variance in scores), followed by
relative age (which explained seven per cent of the variance) and gender (which explained
one per cent).
A similar trend for relative age effects to be larger in the early years of schooling was found
in a study of English national curriculum test results by Crawford et al. (2007). Effect sizes
were at an ‘educationally significant’ level during primary education (Foundation Stage, key
stages 1 and 2), but not at secondary school levels (key stages 3 and 4). This is shown in
Figure 1 below.
Figure 1. Difference in performance between August-and September-born children by key stage results in England
Figure 1 is derived from the study by Crawford et al. (2007). It contains information from
several large national datasets recording pupils’ background characteristics and test
performance at different key stages. The bars represent the average difference in results
achieved by September- and August-born children from three different cohorts. The figure
shows a similar pattern for boys and girls. The difference between children who are youngest
and oldest in the year group is largest in the Foundation Stage (age four to five) and is still
large at key stage 1 (age six to seven). At key stage 2 (age ten to 11), the effect size is much
smaller, but is still large enough to be considered educationally significant. However in
0
10
20
30
40
50
60
70
80
9077
61
35
20
12
82
60
34
21
13
Effect size (x 100) of difference for girls
Effect size (x 100) of difference for boys

11
secondary school, although the differences are statistically significant, they are not large
enough to be considered educationally significant.
The evidence suggests that relative age effects could have a considerable impact on
children’s life chances in different educational systems. For example, a study conducted in
Georgia, USA, by Martin et al. (2004) found effect sizes ranging from 0.21 to 0.28. Summer-
born children (June to August) were more likely to be ‘overage’ for their grade. This was due
to academic ‘redshirting’ (parents holding their child out from starting school for a year) or
grade retention (children repeating a year). The authors went on to point out that 25 per cent
of the summer-born group were overage for their grade and another five to ten per cent were
placed in classes for children with specific learning disabilities.
Other studies gave some insight into the strength of relationship between relative age and
outcomes associated with SEN status and mental health. For example, Gledhill et al. (2002)
found that 23 per cent of British summer-borns were classified as having SEN, compared
with 17 per cent of spring-borns and 15 per cent of autumn-borns.
2.2 Does relative age affect the attainment and development of some groups or types of learners more than others?
We know that certain background characteristics are associated with better or poorer progress
at school. For example, children from economically disadvantaged families are less likely to
achieve well at school, and the achievement of girls differs from that of boys. The question
for this review is whether there is evidence that younger children with particular
characteristics do less well (i.e. is there a ‘multiplier’ effect for relatively younger children)?
Five of the studies investigated the influence of family and individual characteristics (namely
ethnicity, economic deprivation and gender) on outcomes for children who were younger
within the year group. Results of these investigations, taken together, provided no consistent
evidence that relative age effects had more impact on certain groups of young people.
Two of the studies found indications of different relative age effects among groups with
certain characteristics. Cascio and Schanzenbach, (2007) found that younger children from
economically deprived backgrounds were less likely to take college entry exams and Martin
et al. (2004) found a stronger correlation between relative age and being diagnosed with
specific learning difficulties for boys than girls.
Three of the studies found no evidence of differential relative age effects. Wilson (2000)
found that summer-born boys were not at a greater risk of being diagnosed as having SEN
than summer-born girls and Crawford et al. (2007) found no evidence of significant relative
age effects for gender or ethnicity. Daniels et al. (2000) concluded that effects of relative age,
length of schooling, gender and socioeconomic status operate independently of one another.

12
2.3 Do certain educational policies and practices, particularly those relating to curriculum and assessment, mediate the effect of relative age on attainment and development?
Although research into relative age effects is useful in identifying the existence and extent of
this phenomenon, it is less helpful in identifying evidence about strategies to reduce or
remove the effect.
One policy-related issue that was addressed in two of the studies was the influence of length
of schooling on relative age effects. In a system of termly entry to school (three intakes, at
the beginning of each school term) or biannual (two points of entry, usually in the autumn
and spring terms) and termly entry (three entry points a year). Crawford et al. (2007) found
evidence of a small, short-lived advantage at for younger children who started school in
September rather than later in the school year. The difference was evident in key stage 1, but
not in results obtained by older children. Daniels et al. (2000) found no difference in
attainment at key stage 1 for summer-borns who started school in September compared with
those who started school one or two terms later.
The second phase of the study aimed to gather further information on the policies and
strategies used in other countries, together with their impact on the relative age effect. The
review team sought information from international contacts, both those in countries identified
in the rapid review and others for which no evidence had been identified (because this may
have been an indication that these countries had effective strategies in place). This work took
place during October and November 2008.
The NFER team emailed contacts in 26 countries and states, representing all of the
contributors to the INCA Archive5, plus Chile (because one of the recent research studies
identified in the literature review had originated in Chile). Contacts were asked for
information about the nature and extent of relative age effects in their country/region and
whether they had any policies or strategies in place that had the effect of reducing relative age
effects.
The countries and states included in this phase were:
Australia – Queensland*
Australia – Tasmania*
Australia – Victoria*
Canada – Alberta*
5 INCA is QCA’s International Review of Curriculum and Assessment Frameworks Internet Archive at
www.inca.org.uk. It is managed and updated by the International Information Unit at the National Foundation
for Educational Research (NFER). INCA provides descriptions of government policy on education for 20
countries (three of which are federal, so information is collected from nine states – three in each country). It
focuses on curriculum, assessment and initial teacher training frameworks for pre-school, primary, lower
secondary and upper secondary education in schools (3-19 age range).
* In some countries with federal systems, the information provided relates to the education system at sub-
national (state) level.

13
Canada – British Columbia*
Canada – Ontario*
Canada – Saskatchewan*
Chile
France
Germany
Hungary
Ireland
Italy
Japan
Korea
New Zealand
Northern Ireland
Scotland
Singapore
Spain
Sweden
Switzerland
The Netherlands
USA – Kentucky
USA – Maryland
Wales.
The team received responses from contacts in 13 countries/states (Australia – Queensland,
Australia – Victoria, Canada – British Colombia, Chile, Germany, Italy, Japan, New Zealand,
Northern Ireland, Switzerland, The Netherlands, USA – Kentucky and Wales). Several of the
respondents expressed an interest in this study, but few supplied evidence of relative age
effects in their countries.
Further information about relative age effects was provided by Queensland – Australia; New
Zealand; and Japan.
In Queensland, the results of an evaluation of alternative pre-school programmes (Thorpe et
al., n.d.) included some analysis of relative age effects. A total of 1831 children were
assessed just after entry to the preparatory year (most of the children in the sample were aged
from four to five years). The assessments measured children’s attainment in five domains
(social-emotional, communication, literacy, numeracy and motor development). In addition,
teachers were asked to rate how well the children in their class had settled into school. Older
children had statistically significantly higher scores in numeracy, literacy and motor
development, but there were no age-related differences for social-emotional behaviour,
communication skills or settling into school.
In New Zealand6, the school year matches the calendar year: schools open around the end of
January and close in mid December. Children are admitted to school by chronological age,
rather than at a particular point in the school year. Although children do not have to attend
6 This section was amended in 2012, following comments from Geraldine McDonald, who supplied additional
information on the New Zealand school system.

14
school before the age of six they are permitted to enter at age five and most do so on their
fifth birthday or shortly after. The names of the levels of schooling have altered over the
years but they are now called Years. There is no formal reception class and children enter
Year 1 throughout the year. For administrative purposes children who enter after 1 July are
classified as Year 0 and Year 1 the following January. Schools may organise a ‘New Entrants
group’ from which children are filtered out into more advanced groups.
At the end of their second year of schooling children generally progress to Year 3 having
been at school for between 1½ to 2 ½ years. Children are promoted at the end of the year but
the cut-off point for promotion is 1 July (which is mid-year). However, schools generally
establish an earlier cut-off date to create a group of mid-year entrants who are born in June,
May or April and are the youngest in the year group. Some are retained for a further year and
a very few born in August or September may be accelerated. The selection process generally
involves the parents and because promotion or retention past that point is virtually automatic,
it establishes the year groups for subsequent years.
The Ministry of Education carried out some additional regression analysis of age effects
within the national data collected for international comparative studies of reading, maths and
science (Schagen, 2008). The Progress in International Reading Literacy Study (PIRLS) was
designed to measure trends in literacy achievement at the middle primary level. The Trends
in International Mathematics and Science Study (TIMSS) was designed to measure trends in
science and mathematics achievement at the middle primary and lower secondary levels.
Nearly 6,300 Year 5 New Zealand pupils from 243 schools took part in the main survey of
PIRLS at the end of 2005. The TIMSS study took place in November 2006 and involved
around 6000 Year 5 students in New Zealand.
Schagen (2008) carried out a regression analysis of the reading (PIRLS 2005), maths (TIMSS
2006) and science (TIMMS 2006) results. The analysis took account of certain key factors
known to influence attainment (gender, books in the home), as well as 11 indicators for birth
month (February to December, with January as the comparison).
Results of this analysis showed that birth month had a significant effect on children’s reading
and maths scores, with older children tending to have higher attainment. For reading, children
with a July birthday (the oldest in the class) were significantly more likely to achieve the
highest reading scores. For mathematics, children with birthdays in June through to
November were significantly more likely to achieve the highest scores (children with July to
November birthdates would be expected to be among the oldest in the class). Children born in
February were significantly more likely to have the lowest maths scores. No significant age
effects were found for science. The most likely explanation for the observed trends in the
reading and maths results is that they reflect the children’s age when tested. Further statistical
models were fitted which included both birth month and age. This revealed a few instances
where birth month was significantly related to attainment, even controlling for age on testing.
There were positive effects for children born in July for reading and for children born from
June to November for mathematics. There was a negative effect for children born in February
in mathematics. There is no obvious explanation for these additional effects.

15
In Japan, the school year starts on April 1st and ends on March 31
st. As the cut-off date is
April 1st, children born on 2
nd April are the oldest in the year group. Children born in the
three months from January to April are known as the ‘haya-umare’ (early born). The
phenomenon of relative age effects is well known in Japan, with parents of early-born
children concerned about possible educational disadvantages. Japanese early childhood
practitioners are aware of the influence of age on children’s social and physical development
(Abe et al., 1998). Enrolment in private and national junior high schools (which depends on
performance in entrance examinations) has shown evidence of an advantage for students born
in April. Research by Kawaguchi (2006) found a slight disadvantage for early-born children
throughout their compulsory education. Kawaguchi and Mori (2007) found evidence of
relative age effects in the Japanese national results from TIMMS in 1995 and 1999; and PISA
in 2003.
Evidence on international policy
Most of our contacts provided no information about policies to address relative age effects.
However, the respondent from Northern Ireland pointed out that the results of the Transfer
Procedure Test (used to select pupils for grammar school entrance) are age-adjusted to
remove relative age differences in performance, and that an evaluation of the test results
shows the age adjustment to have ensured a fairly even distribution of successful candidates
with different birth months (Gardner and Cowan, 2000).
Three of the international representatives (from the Netherlands, Germany and Switzerland)
mentioned school entry policies and the practice of allowing early entry for some (often older
children), holding back children not considered to be ready to start school and/or requiring
children to repeat a year. Their information is summarised below.
In the Netherlands, most children enter the educational system at the age of four (attendance
is compulsory at age five). Children therefore spend up to two years in kindergarten before
progressing to primary school at age six. The Education Inspectorate has evaluated the
success of keeping children of four or five years old in kindergarten for an additional year if
they seemed too immature to enter primary school. The policy was not found to be effective,
as children still appeared to have the same developmental issues after their extra year in
kindergarten. Schools can decide whether to ask children to repeat a year if they fail to attain
the required level. This affects about two per cent of the primary school population in the
Netherlands (the effectiveness of this policy has not been evaluated).
Similarly, in Germany, the main issue of interest is ‘school maturity’ rather than relative age.
Compulsory schooling starts on the 1st of August for children who have reached their 6
th
birthday by a qualifying date. Following recommendations from the Standing Conference of
Ministers of Education and Cultural Affairs in 1997, the Länder were able to set the
qualifying date between 30th
June and 30th
September. Children whose sixth birthday falls
between 1 July and 31 December (i.e. those who are relatively older) may be permitted to
start school early at their parents’ request, provided they have reached the required level of
physical and mental maturity.

16
The aim of the early entry policy was to reduce the number of children starting school later
than their classmates and to encourage parents to send their children to school as early as
possible. Research comparing children who started school early with those who started at the
normal time showed two contradictory findings. More ‘early starters’ had to repeat a grade
before the end of compulsory schooling (at age 16). On the other hand, more normal than
early starters were considered ‘unsuited’ for academic secondary school (Gymnasium) by
their primary school teachers.
In 2003, another policy was adopted in Germany to enable all children to progress
automatically from the first to the second grade in primary school. The purpose of this policy
was to give children longer to adapt to the demands of school and to avoid having to repeat a
year so soon after starting school.
In Switzerland, the effects of starting school earlier were investigated using the 2003 PISA
dataset of mathematics results. Students who started school half a year earlier were found to
have performed less well in mathematics at the end of compulsory school.
In addition to the specific answers given above, three contacts (in Australia – Victoria;
Germany, and the Netherlands) stated that their current educational policy emphasises the
importance of understanding and responding to the needs of each individual child.
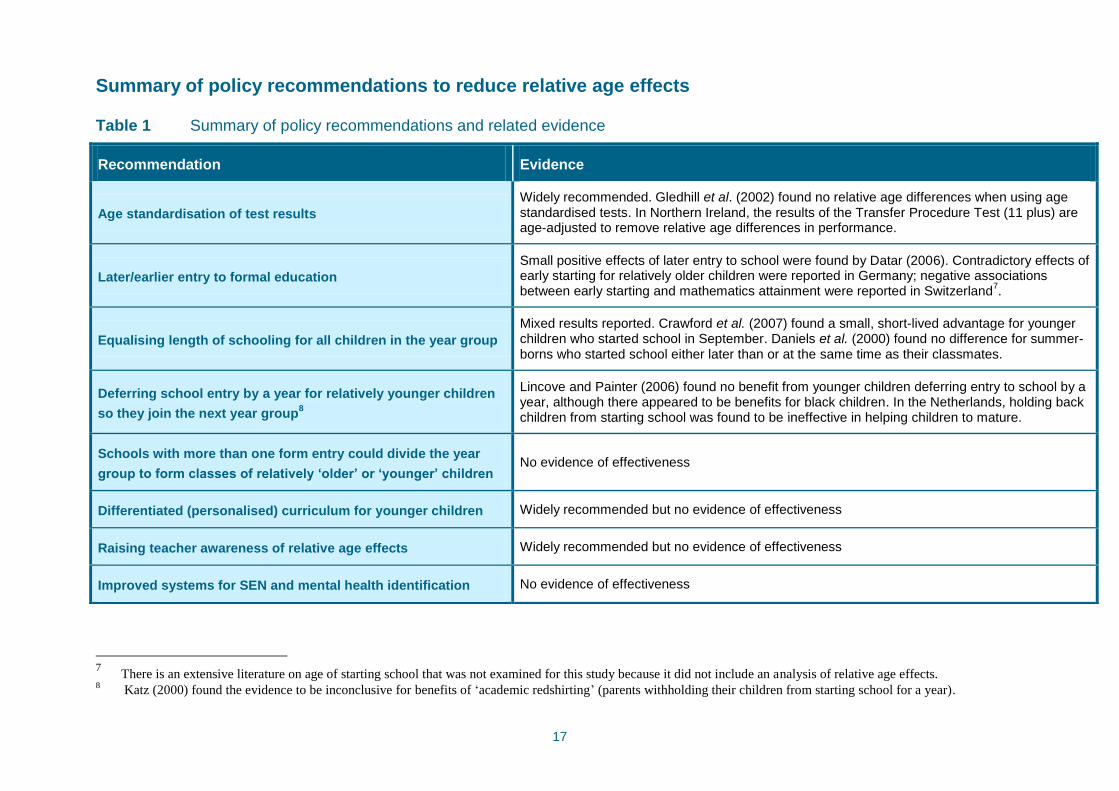
Table 1 provides a summary of policy recommendations drawn from research and/or based
on the information provided by our international contacts.
17
Summary of policy recommendations to reduce relative age effects
Table 1 Summary of policy recommendations and related evidence
7 There is an extensive literature on age of starting school that was not examined for this study because it did not include an analysis of relative age effects.
8 Katz (2000) found the evidence to be inconclusive for benefits of ‘academic redshirting’ (parents withholding their children from starting school for a year).
Recommendation Evidence
Age standardisation of test results
Widely recommended. Gledhill et al. (2002) found no relative age differences when using age standardised tests. In Northern Ireland, the results of the Transfer Procedure Test (11 plus) are age-adjusted to remove relative age differences in performance.
Later/earlier entry to formal education
Small positive effects of later entry to school were found by Datar (2006). Contradictory effects of early starting for relatively older children were reported in Germany; negative associations between early starting and mathematics attainment were reported in Switzerland
7.
Equalising length of schooling for all children in the year group
Mixed results reported. Crawford et al. (2007) found a small, short-lived advantage for younger children who started school in September. Daniels et al. (2000) found no difference for summer-borns who started school either later than or at the same time as their classmates.
Deferring school entry by a year for relatively younger children
so they join the next year group8
Lincove and Painter (2006) found no benefit from younger children deferring entry to school by a year, although there appeared to be benefits for black children. In the Netherlands, holding back children from starting school was found to be ineffective in helping children to mature.
Schools with more than one form entry could divide the year
group to form classes of relatively ‘older’ or ‘younger’ children No evidence of effectiveness
Differentiated (personalised) curriculum for younger children Widely recommended but no evidence of effectiveness
Raising teacher awareness of relative age effects Widely recommended but no evidence of effectiveness
Improved systems for SEN and mental health identification No evidence of effectiveness

18
3. Conclusion and Implications
This rapid review has considered recent evidence on relative age effects and has found
widespread evidence from Australia, Chile, Japan, New Zealand, the United Kingdom and
the USA, that children who are younger in the year-group perform less well at school.
There is strong evidence for an educationally significant relative age effect among young
children (at the beginning of primary school), particularly in reading, writing and maths. The
size of the effect appears to diminish with age, although it is still apparent throughout primary
school. A few studies find statistically significant relative age effects in young people of
secondary school age, though these differences are not usually large enough to be considered
educationally significant. There is little evidence to suggest that relative age effects impact on
the attainment of certain groups of learners more than others.
Perhaps less widely recognised is the finding that children who are younger in the year group
are disproportionately identified as having special educational needs. The evidence suggests
that this is likely to be due to mis-identification (due to a failure to take proper account of
developmental differences) rather than the actual needs of the children and young people
concerned. This is clearly a matter of concern, not just for younger children but also for
relatively older children whose support needs may not be adequately recognised.
Two studies (Goodman et al., 2003; Menet et al., 2000) provided evidence that children who
are younger in the year group have a higher incidence of mental ill health and referral to
mental health services. In the study by Goodman et al. (2003) researchers used data collected
in 1999 on a nationally representative sample of over 10,000 British five- to 15-year-olds.
They found that relatively younger children had greater levels of psychopathology symptoms
and psychiatric disorders. It is difficult to identify the causes of this relationship between
relative age and mental health, although it could possibly be due to relatively younger
children experiencing greater stress and lower attainment at school. However, as the authors
point out, this phenomenon could have important implications for public health:
More than 8 million children aged 5-15 live in Britain, of whom
approximately 750000 probably have a psychiatric disorder. Around 60,000
of these cases of child psychiatric disorder might be prevented if the youngest
and middle children in a school year were at no more risk than the oldest
children.
Goodman et al. (2003) p. 4
This review has enabled us to consider some of the most popular explanations given for
relative age effects.
Pre-natal effects: this explanation was not supported by the evidence. Relative
age effects followed the pattern of the academic year, not the seasons. Children
who were born at the same time of year and whose mothers experienced similar
climatic conditions during their pre-natal development, had better or worse results

19
according to their age in relation to the academic year (see Goodman et al., 2003;
Lawlor et al., 2006; Menet et al., 2000).
Age at testing: this appears to be a likely explanation of relative age effects (i.e.
that the test results of younger children simply reflect the fact that they are less
mature when they took the test). Use of age-adjusted assessments can reduce or
remove the impact of relative age on test scores (Gledhill et al., 2002; Gardner
and Cowan, 2000)
Age in relation to peers: this explanation is neither confirmed nor ruled out by
the evidence. It is possible that age position effect could contribute to low self-
esteem and stress among younger children, but there is no direct evidence for this
in the literature examined in the review.
Age on starting school: One study (Datar, 2006) suggested that relatively
younger children received an academic advantage from starting school at a later
age. But the evidence is not clear cut on the effects of starting formal education at
a younger or older age. (There is a large body of research into the effects of age on
starting school, which was not examined as part of this review, because of our
specific focus on relative age effects.) Children’s experience of the transition as
well as the curriculum and pedagogy offered, are likely to be important
contributory factors.
Length of schooling effects: Again, the evidence on the effect of younger
children starting school later (and therefore having less schooling than their peer
group) is not conclusive, suggesting either a small negative effect (Crawford et
al., 2007) or no effect (Daniels et al., 2000) on children’s attainment. It is clear
that length of schooling could not be the main cause of the phenomenon because
relative age effects exist where all children in the year group start school together
and have the same length of schooling.
It was difficult to find direct evidence of the effectiveness of different policies in reducing the
impact of relative age effects. However, the adoption of age standardised tests has been
shown to be effective in removing age effects in 11 plus tests in Northern Ireland (Gardner
and Cowan, 2000). Adopting a policy of equalising length of schooling for all children (i.e.
through annual entry to school) appears to have little impact on relative age effects. Evidence
from the Netherlands suggests that deferring entry to school appears to be ineffective in
improving children’s outcomes (although again, there is a large body of literature on this
subject which was not examined in this review because it did not focus on relative age
effects).
The following recommendations to address relative age effects are supported by this review,
either because there is direct evidence of effectiveness, or because the recommended strategy
is well placed to address the most likely causes of relative age differences.
Assessment: use age standardised tests; encourage use of age conversion
calculations for non-age standardised tests; enter children for assessment when
ready.
Curriculum: ensure that the curriculum is appropriate for relatively younger
children, especially in the early years of primary school; encourage
personalisation/differentiation to enable younger children to access the curriculum

20
at an appropriate level; reduce sources of failure/stress for relatively younger
children.
Pedagogy: adopt a developmentally appropriate pedagogy for relatively younger
children, especially in the early stages of education. Ensure teachers are aware of
relative age effects and that they know which children are the youngest in the
class (e.g. by putting the class register in birth date order); enable younger
children to have leadership opportunities and encourage them to value their own
achievements rather than to compare their progress with that of older classmates.
Referral for SEN and psychiatric support: monitor referral rates for relative
age effects; review the identification process to ensure that a normal rate of
development among younger children is not mistakenly identified as indicating a
learning difficulty or psychiatric condition; use standardised assessments rather
than relying exclusively on referrals; raise awareness of this issue among support
services and professional groups.
The evidence does not support the effectiveness of the following policies as a response to
relative age effects:
deferred entry to school (relatively younger children starting school a year later)
retention (requiring children to repeat a year after they have started school).
The evidence suggests that the Government’s attention should be focused on ensuring
appropriate and positive experiences for relatively younger children in the primary school and
also on the process for identifying children with special educational needs so that differences
in children’s birth dates do not become a source of continuing disadvantage for children and
young people.

21
4. Summaries of Evidence
This section contains summaries of each of the 18 studies included in the literature
review. The following table shows the review questions addressed by each of the
studies. The review questions are:
1. To what extent does the age of learners relative to other pupils in their year
group affect their attainment and development?
2. Does this relative age affect the attainment and development of some groups
or types of learners more than others?
3. Do certain educational policies and practices, particularly those relating to
curriculum and assessment, mediate the effect of relative age on attainment
and development?
Table 2 Key to the research summaries
Research study Review Question
1 2 3
1. Boardman (2006)
2. Cascio and Schanzenbach (2007)
3. Crawford et al. (2007)
4. Daniels et al. (2000)
5. Datar (2006)
6. Dunsmuir and Blatchford (2004)
7. Gledhill et al. (2002)
8. Goodman et al. (2003)
9. Lawlor et al. (2006)
10. Lincove and Painter (2006)
11. Martin et al. (2004)
12. McEwan and Shapiro (2008)
13. Menet et al. (2000)
14. Moon (2003)
15. Oshima and Domaleski (2006)
16. Polizzi et al. (2007)
17. Wallingford and Prout (2000)
18. Wilson (2000)

22
Boardman, M. (2006). ‘The impact of age and gender on prep children’s academic
achievement’, Australian Journal of Early Childhood, 31, 4, 1–6.
This study addressed the impact of relative age and gender on the academic
achievement of five- and six-year-olds in Tasmania. Performance Indicators of
Primary Schools (PIPS) testing for maths, reading and phonics was carried out on
children at the start of their first year in Preparatory9. Children in the study were
between 5.00 and 6.03 years on January 1st 2004.
The study focused on the attainment of the youngest children in the class (aged 5.0)
relative to the oldest (aged 6.03) using state representative data for a sample of 884
children from 38 primary and district high schools across three education districts.
Attainment in relation to gender was analysed independently of relative age (and is
therefore not relevant for the purposes of this review). Research methods involved an
analysis of assessment data from PIPS, obtained through teacher questionnaires, and
included information on pupil characteristics, such as age and gender. Focus-group
interviews were held with 15 teachers to discuss trends in PIPS data analysis.
The key finding was that children aged 5.00-5.03 had the lowest mean PIPS score
across three PIPS outcomes relative to their older peers. The difference in maths
scores were statistically significant for children aged 5.00-5.03 (32.14) and 5.07-5.09
(36.05) with a significance level of p = 0.002, and for children aged 5.00-5.03 and
5.10-6.00 (35.89) with a result of p = 0.006. For reading, a significant difference at
probability level (p) = 0.05 was found between children aged 5.00-5.03 (42.74) and
5.10-6.00 (50.76). Phonics results for children between 5.00-5.03 (10.83) and 5.10 -
6.00 (12.78) were statistically significantly different with a result of p = 0.046. The
mean score averaged across all three PIPS outcomes was statistically significantly
different for children aged 5.00-5.03 (83.37) and 5.07-5.09 (94.97) with a result of p =
0.045.
Qualitative data from the focus-groups reinforced the PIPS findings. Teachers stated
that the youngest children (born in October and November) were not performing as
well as older children due to developmental differences caused by relative age.
Teachers felt that PIPS questions and tasks were designed in a way which younger
children were less likely to understand. Teachers also found that children who were
younger found it difficult to cope with the academic demands of the Prep curriculum.
The author recommends changes to the curriculum to include more play-based
learning activities that are more suited to the needs of younger learners.
9 Preparatory is the first year of compulsory schooling in Tasmania. Children are generally aged
between 5.0 and 6.0 years old on January 1st when they start school. The academic term commonly
begins in late January/early February.

23
Cascio, E. and Schanzenbach, D. (2007). First in the Class? Age and the Education
Production Function (NBER Working Paper No. 13663). Cambridge, MA: National
Bureau of Economic Research.
The study estimates the effects of relative age on children’s academic performance,
using data obtained from Project Student-Teacher Achievement Ratio (STAR), which
was designed to study the effects of class size on children’s achievement. In 1985,
kindergarten students (aged 5/6) and teachers in 79 Tennessee10
schools were
randomly assigned to three classes within their schools: small (13-17 children);
regular (22-25 students) and regular with a full-time teaching assistant.
The cohort remained in one of the three class types until third grade (aged 8/9), after
which they were returned to standard class sizes (the authors do not give precise
details of the sample size, although outcomes data is presented on between 4,400 and
6,200 pupils). Only children for whom background characteristics including date of
birth, ethnicity, gender, eligible for FSM were available were included in the sample.
The study also recorded class data, such as the proportion of those with similar
kindergarten classmates (average age, fraction Black, fraction female and fraction
eligible for FSM) and teacher characteristics (experience, education and race).
Outcome variables were measured by tests administered to the Project STAR sample
from kindergarten through to high school. At the end of kindergarten (spring 1986),
children were assessed using the Stanford Achievement Test and children from grades
five to eight were tested on the Comprehensive Test of Basic Skills (children in the
sample would have completed eighth grade in spring 1994). Both tests are multiple
choice tests with reading and maths elements: they are not age-standardised. The final
outcome variable was an indicator of whether the sample took their ACT or
Scholastic Aptitude Test (SAT) college entrance exams in 1999, some 12 to 13 years
later. ACT and SAT are not age standardised.
Key findings revealed no statistically significant differences in assessment scores
between the youngest children in the class relative to their peers, irrespective of the
size of the class. A child’s age position (rank order within class) was not clearly
related to their test performance. The authors conclude that both absolute age and age-
position contributed to, but did not fully explain the persistence of test score
differences in grade 8 (13- to 14-year-olds). Age position was, however, related to
their risk of grade retention, with the youngest children more likely to be retained.
There was no relationship between gender and age effects for outcomes at grade 8.
But there was a relationship between eligibility for FSM and relative age, with fewer
such children taking college entrance exams. For example, free lunch recipients who
were in the youngest 25 per cent in their kindergarten classes were 8.4 percentage
10
In autumn 1985, the academic year in Tennessee began on September 1st and children could start
kindergarten if they were five before September 30th
. Therefore, children born on September 30th
would be the oldest in the class and those born on October 1st would be the youngest.

24
points less likely to take the ACT or SAT. The authors state that the reasons for this
are unclear but speculate that disadvantaged children do not receive sufficient
educational ‘investments’ to compensate for the negative effect of being relatively
young in the class when they start school.

25
Crawford, C., Dearden, L. and Meghir, C. (2007). When You Are Born Matters: the
Impact of Date of Birth on Child Cognitive Outcomes in England. London: The
Institute for Fiscal Studies [online]. Available:
http://www.ifs.org.uk//docs/born_matters_report.pdf [3 December, 2008].
This study focused on the impact of children’s date of birth on cognitive outcomes in
England. The authors set out to establish whether differences between August- and
September-born children are due to the following effects: absolute age, age of starting
school, length of schooling or relative age.
The study analysed data for three cohorts of children who were born in the following
academic years: 1997 – 1999 (Group 1); 1990 – 1992 (Group 2) and 1985 – 1988
(Group 3). The project tracked a sample of children from the Foundation Stage (age
5) to Key stage 5 (age 18). For Group 1, a one-in-ten sample of children aged from 5
to 7 was chosen (girls, n = 45,842 and boys, n = 47,908). The ages of Groups 2 and 3
ranged from seven to18, and sample sizes were: Group 2 girls, n = 543,378 and boys,
n = 565,376 and for Group 3 girls, n = 736,386 and boys, n = 748,879. The data
comprised key stage assessment results for all children in state schools in England.
Key findings showed that in the Foundation Stage, August-born girls (boys) were
0.768 (0.817) standard deviations below September-born girls (boys). For key stage 1,
the difference decreased to 0.609 (0.602) and to 0.351(0.337) by key stage 2. At key
stage 3, standard deviations were 0.204 (0.212); and 0.116 (0.131) at key stage 4.
After controlling for all observable differences which may affect the outcome of
August- compared to September-born children, the study found the most significant
differences were connected to date of birth.
Children who spent longer in the reception year (September start) did slightly better
than those with less time (January or April start dates). However, these differences did
not persist beyond KS1.
The study analysed the August birth effect in a number of subgroups, including
gender, children eligible for FSM, those living in high deprivation areas, children with
SEN, and those from different ethnic groups (Black, Black Caribbean, White British,
Pakistani and Bangladeshi). The authors found no statistically significant differences
for boys or girls for August-born children relative to September-born children. In
terms of FSM status, both September-born children who were eligible for FSM and
those who were not eligible scored higher than August-born children, across all
cohorts. A higher proportion of August-born children were recorded as having SEN.
At Foundation Stage, the difference was statistically significant at the five per cent
level for girls but was not statistically significantly different for boys. Across the
remaining cohorts, higher proportions of August-born boys and girls had SEN status
than September-born boys and girls, with differences significant at the one per cent
level. The authors found no statistically significant differences across the ethnic
groups for August-born children relative to September-born children.

26
The authors conclude that their study provides evidence in support of a relative age
effect on attainment and SEN status. In most cases, August-born children, regardless
of their characteristics, face the same disadvantage relative to September-born
children. For this reason, policies aimed at mediating the effects of the August birth
effects should benefit all subgroups equally. Policy recommendations include raising
teacher awareness of relative age effects so that teachers can differentiate their
teaching for children of different ages, age normalisation of test results, testing when
ready and adopting more flexible nursery and school starting dates to ensure that
August-born children reach the same expected outcomes as September-born children.

27
Daniels, S., Shorrocks-Taylor, D. and Redfern, E. (2000). ‘Can starting summer–born
children earlier at infant school improve their national curriculum results?’ Oxford
Review of Education, 26, 2, 207–220.
The article reports on the effects of the age-position of children in their class and
considers whether any advantage can be gained by increasing the length of schooling.
The study focuses on the results of key stage 1 assessments of two datasets used in the
1991 and 1992 Evaluation of National Curriculum Assessment at key stage 1. Subject
assessments were English (reading), English (writing), number and science. They
drew a nationally representative sample of seven-year-olds across England of 2500
children in 1991 and 1800 children in 1992, with an equal representation of boys and
girls across both samples, for whom data was collected over two years. Data was
analysed using multilevel modelling, testing the hypothesis that attainment for
summer-born children with seven terms of schooling were significantly different for
those with nine terms of schooling. The effects of gender and socioeconomic status
were also analysed.
Key findings for the 1991 cohort were that the length of schooling (either seven or
nine terms) had no statistically significant effects for summer-borns on any of the four
measures. Analysis for children’s age in days showed statistically significant effects
for English reading and writing. For reading (writing), the significance level was
p<.05 (p<.01), indicating that older summer born children performed better than
younger summer born children. Across the socio-economic group, differences were
also statistically significant across all four measures at p<.001 level, indicating that
summer-born children with a higher socio-economic status outperformed those from a
lower socio-economic status. The gender difference was only statistically significant
for English (writing), indicating that summer-born girls performed better than
summer-born boys.
For the 1992 cohort, there were no statistically significant differences for number of
terms attended. For English (reading), children’s age had a statistically significant
impact (p< 0.05) indicating that older children outperformed their younger peers.
Across the socio-economic group, there were significant differences for English
reading (p< 0.001), writing (p< 0.05) and number (0.063, p< 0.05), which were all in
favour of children from higher socio-economic backgrounds. The difference for
gender was only statistically significant for English reading and writing (p< 0.05 and
p< 0.01 respectively), again indicating that summer-born girls scored higher than
summer-born boys.
The authors conclude that effects of relative age, length of schooling, gender and
socioeconomic status operate independently. The authors do not offer policy
recommendations because their sample included children from a number of schools
and local authorities with differing admission policies and teaching approaches.
28
Datar, A. (2006). ‘Does delaying kindergarten entrance give children a head start?’
Economics of Education Review, 25, 1, 43–62.
This study set out to consider whether school entrance age affects children’s
attainment and progress in the first two years at school. The researcher used data from
the Early Childhood Longitudinal Study – Kindergarten Class which drew a
nationally representative cohort of children from about 1,000 US kindergartens in the
autumn and spring of the 1998 to 1999 school year. Data was collected at
kindergarten entry and again at the end of two years in school (Grade 1). Outcome
measures were scores on reading and maths tests (it is not stated whether these are age
standardised). The analysis included results for about 13,700 children for maths and
13,000 children for reading. The study focused on children’s age in months and their
age on entry to kindergarten. The analysis took a variety of child and family variables
into account such as race, gender, disability status, number of siblings, mother’s
education, language spoken at home and poverty status.
In the USA, kindergarten entrance age is determined by each state. The most common
compulsory age at which children must be in kindergarten was six. However, there
was considerable variation between states, with the entrance age ranging from five in
eight states (Arkansas, Delaware, District of Columbia, Maryland, New Mexico,
Oklahoma, South Carolina and Virginia) to eight in two states (Pennsylvania and
Washington). Parents could also exercise choice over when their children started
school. Boys, children from ‘white’ ethnic backgrounds and children with disabilities
were more likely to start kindergarten at an older age. Children from poor families
and from families with lower maternal education were more likely to start
kindergarten at a younger age.
Key findings showed that children starting kindergarten one year later made greater
progress during the first two years at school. The analysis used statistical modelling to
remove any effects of being relatively older or younger in the year group. (The author
suggests that previous studies using less sophisticated statistical analysis may have
underestimated the effects of starting school later.) This study found that children who
entered school at an older age made statistically significantly greater progress in
reading, taking relative age into account (p<0.001). Children who were not disabled
made greater progress in both maths and reading when they started school at a later
age. Children from poor families and girls also made greater progress in maths when
they started school later. Children from non-poor backgrounds, disabled children,
non-disabled children and boys made greater progress in reading when they started
school at a later age (all these results were statistically significant at the p<0.05). The
author concludes that the effects of delayed kindergarten entrance by one year are
relatively small (effect size of between 0.07 and 0.10), but may be important for later
progress, given that early test scores have been shown to predict later academic
success. She acknowledges that the study does not establish the impact of a later
school starting age after the first two years in school and discusses the possible
consequences of setting a later kindergarten starting age (including the increased
economic burden on families).

29
Dunsmuir, S. and Blatchford, P. (2004). ‘Predictors of writing competence in 4 to 7
year old children’, British Journal of Educational Psychology, 74, 3, 461–483.
This study addresses factors at home and school that influence children’s writing
attainment in England. Home background variables included socioeconomic status,
parental education and whether writing materials were available at home. Assessment
measures collected at school entry were based on language (British Picture
Vocabulary Scale, Wechsler Pre-school and Primary Scale of Intelligence – Revised
and British Ability Scales Verbal Fluency Subtest), knowledge about literacy
(Concepts about Print Test and the Letter Identification Test) and measures of writing
(British Ability Scales Copying Subtest). Assessment data gathered at KS1 children
were linked to National Curriculum writing objectives. Longitudinal data for a sample
of 60 children aged four to seven were obtained from four participating project
schools, which were selected for variability. The children were divided into season of
birth groups, which also related to the term they started school: summer (entry in
1993, 40 per cent), autumn (entry in 1993, 35 per cent) and spring (entry in 1994, 25
per cent).
Methods included semi-structured interviews, questionnaires, structured observation,
literacy assessments and analysis of writing samples. Child characteristics such as
gender, socio-economic status and family size, birth order, parents’ occupation,
qualification and employment status and previous childcare arrangements were all
used as variables. These variables were regressed against variables including home
writing activities, number of materials at home, parental assessment of child’s writing
ability, parent models and questionnaires.
Key findings showed a statistically significant relationship between season of birth
and writing at age seven. Summer-born children had lower attainment than others in
the same year group (p<0.01), while outcomes for spring-born children were not
significantly different from others.
The authors point out that, because schools admitted children into year 1 in the school
term after their fifth birthday, summer-born children in this study were youngest in
the year group and they had experienced less schooling than those born in the autumn.
They acknowledge that schools had begun to introduce policies, such as using age-
adjusted tests, which should help teachers to take account of children’s developmental
levels when making judgements about their performance.

30
Gledhill, J., Ford, T. and Goodman, R. (2002). ‘Does season of birth matter? The
relationship between age within the school year (season of birth) and educational
difficulties among a representative general population sample of children and
adolescents (aged 5-15) in Great Britain’, Research in Education, 68, 41–47.
The study aimed to examine the relationship between season of birth, special
educational needs, learning difficulties and performance on age-standardised tests of
IQ, reading and spelling. Data for a representative sample of 8,036 young people aged
5-15 years was collected in 1999 as part of the Mental Health of Children and
Adolescents in Great Britain survey. Methods comprised face-to-face interviews and
self-report questionnaires completed by parents, teachers and children over 11 years.
The sample was categorised into three groups by season of birth: autumn (September-
December); spring (January-April); and summer (May-August). Socio-demographic
measures were age, gender, ethnicity (White, Black, Indian, Bangladeshi, Pakistani
and ‘other’), socioeconomic class (defined by occupation of the head of household),
special educational needs (SEN) classification based on the Code of Practice (1994)
levels 1-5 and additionally, specific learning difficulties for five per cent of children
with the largest difference between predicted and attained levels.
Key findings revealed that a significantly higher proportion of summer-born children
(23 per cent) were classified as having SEN, compared to autumn-born (15 per cent)
and spring-born children (17 per cent). These differences were significant at p<0.0001
level. Summer-born children were also statistically significantly more likely to be
diagnosed at levels 1-3 (p<0.001) and 4-5 (p=0.03) of the SEN Code of Practice.
There were no significant season of birth differences found for the age-standardised
measures of children’s IQ, reading ability, spelling ability or learning difficulties.
There were also no significant season of birth differences across any of the socio-
demographic characteristics.
The authors conclude that the reading and spelling ability of summer born children
were as expected for their age, as were outcomes for those born in autumn and spring,
thus a higher incidence of SEN referrals amongst summer born children indicates that
teacher expectations may inappropriately influence SEN assessments. The authors
recommend changes to classroom practice to mediate the effects of the high number
of summer-born children diagnosed with SEN, including grouping children in classes
based on terms of birth and arranging the register in order of date of birth, to increase
teachers’ awareness of season of birth effects.

31
Goodman, R., Gledhill, J. and Ford, T. (2003). ‘Child psychiatric disorder and relative
age within school year: cross sectional survey of large population sample’, British
Medical Journal, 327, 7413, 472–475.
This study considers the relationship between relative age and psychopathology,
testing the hypothesis that the youngest children within the school year are more at
risk of developing emotional and behavioural problems. Data collected in 1999
produced a nationally representative sample of 10,438 children from Britain (England,
Scotland11
and Wales) aged five to 15 years old. Methods included a cross sectional
survey utilising validated strengths and difficulties psychopathology questionnaires
which were completed by parents, teachers and 11- to 15-year-olds and psychiatric
diagnosis based on a clinical review of interview data with young people aged 11 to
15 and their parents(it is not clear how many young people in the sample were in the
11- to 15-year-old age range). Children were categorised by birth month in relation to
the school terms for England and Wales: autumn (September to December), spring
(January to April) and summer (May to August); and for Scotland into the oldest third
(March to June), middle third (July to October) and the youngest third (November to
February). Socio-demographic characteristics such as gender, ethnic group,
socioeconomic status and family type were also included in the analysis.
Key findings were that the youngest children in the school year had statistically
significantly higher symptom scores and a higher proportion were judged as suffering
from psychiatric disorders. For teacher and parent reports, the relative age results
indicated significant differences at p<0.0001. For self reported difficulties, differences
were significant at p<0.05. Relative age was found to be an independent risk factor for
psychiatric disorder after controlling for socio-demographic characteristics. Similar
relative age differences were found when Scottish data was compared with
English/Welsh data. However, when comparing months of birth, Scottish children
born in January/February (who were the youngest in the class) were more
disadvantaged than English/Welsh children born in the same months, who performed
at an average level. The authors suggest that this indicates a relative age effect,
(because the Scottish children were the youngest in the year group, whereas the
English children were in the middle of the year group) as opposed to a purely
‘seasonal’ effect (because both groups were born in the same months of the year).
The authors conclude that their study provides ‘robust’ evidence of a link between
relative age and mental health. They suggest that being youngest in the class is
stressful for children. While there is a fairly ‘weak’ effect on an individual’s mental
health (for example, compared to the impact of family discord or adverse life events),
it could prove important for public health. For example, if all British children had the
same risk of psychopathology as that identified among the oldest in the year group,
around 60,000 cases of child psychiatric disorder might be prevented. They
11
In 1999 in Scotland the academic year began in August and children who were born between March
and August started compulsory schooling in the academic year during which they became five.
Children who were born between September and February started school in the August preceding
their fifth birthday or their parents could defer school entry for one year.

32
recommend age grouping within classes, greater teacher awareness of relative age
effects (e.g. calling the register in birth order) and relative age streaming within year
groups. They point to the policy in New Zealand of allowing young children to
progress from a preparatory class to primary school when ready and to the Scottish
system whereby parents can choose to defer entry for younger children who do not
seem ready for school. They recommend further evaluation (Randomised Control
Trials) of the impact of allowing the youngest children experiencing difficulties to
repeat the academic year or allowing deferred school entry.

33
Lawlor, D.A., Clark, H., Ronalds, G. and Leon, D.A. (2006). ‘Season of birth and
childhood intelligence: findings from the Aberdeen children of the 1950s cohort
study’, British Journal of Educational Psychology, 76, 3, 481–499.
This study aimed to determine whether childhood intelligence and school
performance are affected by season of birth. The research considered two hypotheses
for season of birth effects: the impact of school entry policy and seasonally patterned
prenatal exposure to factors such as outdoor temperature, maternal nutrition and
infection causing lasting damage to intelligence.
The dataset comprised 12,150 individuals who were born in Scotland12
between 1950
and 1956, attended one of 52 schools in Aberdeen and participated in the Aberdeen
Child Development Survey of 1981. Measures of childhood intelligence were
recorded at age seven, using Moray House Picture Intelligence tests, which measured
perception and pictorial differences. At age nine, participants’ reading ability was
measured using Schonell and Adams Essential Intelligence tests. At 11, children were
assessed using Moray House tests of verbal reasoning, arithmetic and English.
Prenatal data records were also analysed and included detailed information such as
individuals’ birth weight, gestational age, gender, social class (defined by father’s
occupation), maternal age at the time of the child’s birth and birth order. The analysis
controlled for a number of covariates including gender, socioeconomic status, birth
weight and temperature at different gestational periods.
Key findings showed that children born between September and December (the
youngest in the age group at the time) had the lowest mean scores in reading and
arithmetic relative to those born between February and April. There were statistically
significant age effects in reading at age nine (p= 0.002) and arithmetic at age 11 (p=
.05). No significant month of birth associations were found for any of the remaining
intelligence tests, for season of birth patterned exposure to factors such as
temperature/infection, or for any of the other covariates analysed.
The authors conclude that any variation in childhood intelligence is weak and largely
explained by age at entry to school and relative age.
12
In Aberdeen in 1960 the academic year started in August and there were three (termly) entry points.
Children born between April and the end of August started school in August (with the possibility of
September- and October-born children also joining in order to increase class sizes). Children born
between September and December were admitted in January (in Scotland, parents could allow
children born between January and March to be admitted in January also) and in April all remaining
children born between January and March were admitted to existing classes.

34
Lincove, J.A. and Painter, G. (2006). ‘Does the age that children start kindergarten
matter? Evidence of long-term educational and social outcomes’, Education
Evaluation and Policy Analysis, 28, 153–179 [online]. Available: http://www-
rcf.usc.edu/~gpainter/Season%20of%20Birth%2009_04.pdf [29 September, 2008].
This study examined the long-term effects of age at school entry. The study used data
from the US National Educational Longitudinal Study of 1988, which provided pupil
and family characteristics, assessment and employment information for students in the
eighth grade (13-14) to the age of 26 (at the time the report was written). The dataset
was selected from an original sample of 1,000 schools, from which 25,000 children in
the eighth grade were surveyed. Follow-up surveys were conducted in 1990, 1992,
1994 and 2000. A random sample of 15,273 of the original sample participated in the
2000 survey. Survey data was collected from students, parents and schools. Each
student’s age at school entry was categorised into three seasons of birth. These
comprised the ‘young’ group (n=2794) with summer birthdates in June, July or
August of 1974/75 who started kindergarten shortly after their fifth birthday; the
‘older’ group (n=2535) who had winter birthdates in December, January or February
of 1972/73/74 and started kindergarten at approximately five and a half years old and
the redshirted13
group (n=227) who had summer birthdates 1973/74 and started school
one year later than the other two groups. The analysis included variables such as
socio-economic status, ethnicity, parental education, family income and occupational
status. Measures of long-term outcomes were based on standardised eighth grade
assessments (not age standardised), behavioural problems, having a child out of
wedlock, non-completion of high school, attending college and salary in 1999.
Key findings were that younger children were statistically significantly more likely to
repeat kindergarten (p<0.001) and grades 1-8 (p<0.001) compared to the older group.
There were no significant differences in academic outcomes comparing summer borns
who were redshirted (those that began kindergarten at age 6) and summer borns who
started kindergarten at age 5. Younger children who started school in the expected
year group were more likely to repeat kindergarten but redshirted children were more
likely to repeat grades 1-8.
Black and Hispanic children in the younger age-group performed statistically
significantly less well than their counterparts in the older age group (p<0.01 and
p<0.05 respectively). The youngest Black children performed significantly less well
than their counterparts in the redshirted group (p<0.10) but there were no significant
differences for Hispanic children.
Based on the results of results of the study, the authors conclude that there are no
benefits to deferring kindergarten entry by a year, as this will not necessarily increase
the academic attainment of relatively young children in the longer-term.
13
The term ‘Redshirting’ is used in the USA to refer to the practice of postponing a child’s entrance
into school by a year to allow extra time for developmental growth. This usually applies to children
whose birthdates are close to the cut-off date for school entrance and who would normally be
among the youngest in the class. These children usually join the next year’s kindergarten cohort,
where they become amongst the oldest in the class.

35
Martin, R.P., Foels, P., Clanton, G. and Moon, K. (2004). ‘Season of birth is related to
child retention rates, achievement, and rate of diagnosis of specific LD’, Journal of
Learning Disabilities, 37, 4, 307–317.
This study focuses on the association between season of birth and children’s
attainment, and explores the hypothesis that children who are born in the summer
months are more likely to be diagnosed with specific learning difficulties (SLD)
compared to those born at other times of the year. The sample comprised 2,768
children (2,007 boys and 761 girls) born between September 1st 1984 and August 31
st
1990; children were in grades four (ages 9/10) to nine (ages 14/15) at the time of data
collection. The sample was selected from 28 county school systems in northeast
Georgia, USA and was representative of adjoining counties. Data for children
diagnosed with SLD was obtained from all 28 schools during 2000-2001 and included
the following background characteristics: gender, ethnicity, date of birth and SLD
diagnosis. The SLD sample only included children who self-identified as European
Americans, as other ethnicities were proportionally too low across the SLD sample to
meet the requirements of the research design. General achievement across the schools
was measured using fifth grade (ages ten to 11) test scores, assessed using the Iowa
Test of Basic Skills (ITBS). This test is not age standardised. Children’s achievement
data were obtained from the spring 2000 achievement testing in Georgia which covers
vocabulary, reading, mathematics, and science. Data analysis was used to differentiate
the effects of grade retention and academic ‘redshirting’ when determining season of
birth effects.
Key findings indicate that children who were born in June, July and August were
statistically significantly more likely to be overage for their grade when compared to
children born during other months of the year, indicating ‘redshirting’ or grade
retention (p< 0.0001). Across all outcomes, children born in June, July and August
scored statistically significantly lower than those born in September, October and
November (p< 0.05). Achievement scores across all outcomes were measured both
excluding and including overage children. Effect sizes when overage children were
excluded ranged from 0.12 to 0.17 standard deviations, p< 0.001; when they were
included, effects sizes ranged from 0.21 to 0.28, p< 0.0001.
Compared with the population of children in the area, the sample of children with
SLD had a higher proportion born June and August and a lower proportion born in
September to May. Children born in June to August were statistically significantly
more likely to be diagnosed with SLD (p< 0.001). Correlations between relative age
(birth month) and SLD diagnosis were highest in Grade 8 (0.78). The correlation
between relative age and SLD diagnosis was generally higher for boys than for girls.
The authors conclude that there are clear consequences of being born in July to
August, with about 25 per cent of children being retained or redshirted and another
five to ten per cent being placed in classes for children with SLD. They suggest that
the most likely explanation is one of maturity: i.e. that younger children perform less
well and are at greater risk of being diagnosed as having SLD because they are less

36
mature. The authors recommend two school entry points, one in August and one in
January, with relatively younger children starting school in January. However, they
suggest that further research and consideration of the implications of such a system
would be necessary before implementation.

37
McEwan, P. and Shapiro, J. (2008). ‘The benefits of delayed primary school
enrollment: discontinuity estimates using exact birth dates’, Journal of Human
Resources, 43, 1, 1–29.
This study examines the effects of delayed school entry on students in Chile and
explores the effects of enrolment age and season of birth effects on student outcomes.
In Chile, the school year begins on March 1st, and the most common enrolment cut-off
date is July 1st. Children who are six on or after the cut-off date have to delay
enrolment until the following year. The sample was obtained from three data sources:
firstly, a sample of 1,013,081 children in the first grade (aged 6/7) was obtained from
six annual surveys conducted from 1998-2003. Data included children’s’ date of birth,
gender, level of maternal education and nutritional status. Secondly, a representative
sample of 144,047 fourth grade students (aged 9/10) was obtained from a 2002
national census, and their test scores in maths and Spanish were analysed. Finally, a
nationally representative sample of 5,582 eighth grade students (aged 13/14) was
obtained using data from the 1999 Trends in Mathematics and Science Study
(TIMSS), which comprised students’ maths and science scores.
Key findings show that children who were older in the year group (July to December
birthdates) had a statistically significantly lower probability of being retained in
kindergarten, compared to those who were younger (January to June birthdates). The
difference was approximately one percentage point – relative to the overall mean
baseline of 2.8 per cent retentions (p<0.01). Fourth grade attainment results showed
that relatively older students had higher maths test scores by 0.29 standard deviations
and higher language scores by 0.38 standard deviations, both of which are statistically
significant (p<0.01). In the eighth grade, relatively older students had an increase of
0.43 standard deviations in their maths test scores and 0.72 standard deviations in
science, both of which were statistically significant (p<0.01).
The authors conclude that their findings may be due to absolute or relative age effects.
If findings are due to age-at-test results, they suggest that increasing the enrolment
age would increase test scores as children would be older when tested, although they
may not necessarily learn more. On the other hand, if relative age is accepted as the
cause of the findings, changing the cut-off dates would redistribute achievement,
without overall gains. They suggest that intervention policies which assess children’s
school readiness in preschool, such as interventions to improve early nutrition, would
benefit children from disadvantaged backgrounds (whose families are more likely
delay enrolment due to malnourishment or stunted growth). This could offer greater
long-term effects and improved attainment which may avoid the need to mandate a
later school starting age.

38
Menet, F., Eakin, J., Stuart, M. and Rafferty, H. (2000). ‘Month of birth and effect on
literacy, behaviour and referral to psychological service’, Educational Psychology in
Practice, 16, 2, 225–234.
The authors studied the effects of month of birth on children’s literacy, behaviour, and
propensity for psychological referrals in a primary school cohort in Northern
Ireland14
. They wanted to establish whether the youngest children performed less well
relative to their older classmates. The sample included children from Years 1, 3 and 5
(ages four to nine) and analysed school assessment data and psychological referral
lists. Psychological referral lists comprised 695 new referrals from the preceding year.
Data for 108 May/June- and July/August-born children across the sample were
studied (the authors do not indicate the date the study took place).
Key findings for the Year 1 sample (ages four to five) May/June-born children (the
youngest in the year-group) were that these children scored significantly lower in
literacy and behaviour mean scores than July/August-born children. Statistically
significant effects for letter recognition, word recognition and behaviour scores were
p< 0.008, p< 0.002 and p<0.000 respectively. Findings for the Year 3 and 5 samples
(ages 6-9) were similar, with May/June-born children obtaining the lowest mean
scores relative to July/August-born children. Statistically significant effects for
reading, spelling and behaviour scores were p< 0.001, p< 0.01 and p<0.0001
respectively. Psychological referral analysis showed that the number of referrals
increased towards the May/June birth date. The number of referrals for May/June- and
July/August-born children were significantly different from the expected numbers
(p<0.05).
The authors recommend a number of strategies to help mediate the relative age effects
and raise attainment of the youngest children in the class. Recommendations for
policy and practice include age normalisation of test results, age grouping within
classes, a developmentally appropriate curriculum, smaller classes in Year 1 and
small group support, greater teacher awareness and training, parental involvement and
a wider availability of psychological services resulting in early intervention.
14
Primary schools in Northern Ireland have a single entry point. Children who reach the age of four
on or before 1 July start compulsory schooling on 1 September that year. Children who reach the
age of four after 1 July would not begin compulsory schooling until the following year. Therefore,
children born in May and June will be the youngest in the class and those born in July and August
will be the oldest.

39
Moon, S. (2003). ‘Birth date and pupil attainment’, Education Today, 53, 4, 28–33.
This small scale study assesses whether season of birth affected the GCSE attainment
of a cohort of 308 Year 11 pupils within the same school in England (the author does
not indicate where in England the study took place). Pupils’ birth dates were used to
categorise the pupils into autumn (September to December), spring (January to April)
or summer (May to August) terms of birth. Pupils sat their GCSEs in 2000 and
assessment data from 1999/2000 was used to classify pupils based on Cognitive
Ability Test scores. Analysis of variance was used to identify statistically significant
differences between pupils of the same cognitive ability with a relative age variable.
Analysis included GCSE results across all subjects and for English, maths and
science.
Key findings across all GCSE subjects showed no statistically significant differences
between pupils across the three terms of birth. However, for English, maths and
science, there were small differences between children with autumn and summer
birthdates which were statistically significant at the 0.1 per cent level. For English
(maths and science) summer-born pupils scored 0.5 (0.6 and 0.5) average points
below autumn-born pupils.
The author makes the following policy recommendations to counteract the season of
birth effect: adopt a curriculum tailored to the development of summer-born children,
use age normalisation of test results and attempt greater alignment between primary
and secondary schools to ensure that summer-born children at risk of
underachievement are identified throughout their school career.

40
Oshima, T.C. and Domaleski, C.S. (2006). ‘Academic performance gap between
summer-birthday and fall-birthday children in grades K-8’, Journal of Educational
Research, 99, 4, 212–217.
This study reports on the differences in academic performance between children with
summer (June, July and August) and autumn birthdays (September, October and
November). The study used data from the US Early Childhood Longitudinal Study of
the Kindergarten Class of 1998-99 to produce a sample of children aged five and six;
3,862 of whom had summer and 2,693 had autumn birthdays. A different sample for
grades 1-8 was randomly selected from a state-wide pool of non-age standardised
tests administered in 2002, comprising 3,000 students (ages six to 14). Methods
included analysis of students’ reading, maths and general knowledge scores (with the
addition of approaches to learning, self-control and social interaction variables for
kindergarten students). Gender and ethnicity were also included as variables.
Key findings showed that older kindergarten children had a higher mean score
relative to younger kindergarten children with effect sizes of 0.38 for reading, 0.55 for
mathematics and 0.50 for general knowledge. Children with autumn birthdays had
higher reading and maths mean scores than children with summer birthdays, across all
grades and all results were statistically significant from kindergarten through to fifth
grade at p< 0.001 (ages five to 11). Differences in mean scores were not significantly
different for grades 6-8 (ages 11-14). The most statistically significant predictors of
positive reading and maths attainment across all age ranges at p< 0.001 were ethnicity
(which explained 10-15 per cent), followed by relative age (seven per cent) and
gender (one per cent).
The authors conclude that before parents choose to defer school entry of children with
summer-birthdays by a year, a number of issues need to be taken into account,
including whether children learn from older peers, whether the child may be affected
by not performing as well as their older peers, and the child’s gender and reading
ability.

41
Polizzi, N., Martin, R.P. and Dombrowski, S.C. (2007). 'Season of birth of students
receiving special education services under a diagnosis of emotional and behavioural
disorder', School Psychology Quarterly, 22, 1, 44–57.
This study explored the hypothesis that a disproportionate number of US children who
receive special education services for emotional or behavioural disorders (EBD) are
born during late spring and summer, compared to other times of the year. The authors
also investigated whether seasonal birth rate effects followed cyclical patterns over a
ten year period. The sample comprised 8,578 children who were born between
September 1st 1983 and August 31st 1994 and were all receiving special education
services for EBD disorders. Data was obtained from 44 counties in Georgia and
included each pupil’s date of birth, gender, grade and special education status. The
sample consisted of European American (61 per cent) and African American (39 per
cent) children only and was representative of the northeast Georgia region.
Key findings from a comparison of monthly birth rates between the sample and for
the population in the state of Georgia as a whole revealed that fewer than expected
children receiving special education were born in September and October. For African
Americans receiving special education, a higher number than expected were born in
May to August and for European Americans receiving special education, a higher
proportion than expected were born in May, June and August. The authors do not
report on gender effects.
The authors conclude that their results are open to interpretation. If relative age is
accepted as a hypothesis, this may indicate that summer-born children are over
diagnosed for EBD. However, if pre-natal factors causing brain injury or
developmental delay is accepted as a hypothesis, autumn school cut-off dates
disadvantage summer-born children further. In order to mediate the season of birth
effects the authors recommend early identification of children who are born in the
summer months and may be at risk, biannual cut-off dates for school entry, greater
awareness of relative age effects by teachers and improved information sharing
between parents, teachers and psychologists on childrens pre-natal history.

42
Wallingford, E.L. and Prout, H.T. (2000). ‘The relationship of season of birth and
special education referral’, Psychology in the Schools, 37, 4, 379–387.
The purpose of this study was to establish whether children with summer birthdates,
who were the youngest in their grades, were significantly overrepresented in the
number of special educational needs (SEN) referrals. The sample comprised 1,222
SEN referrals for a 1995-96 cohort of children from kindergarten to fifth grade (aged
5-14) in a south-eastern state in the USA (the author does not indicate exactly where
the study took place). The number of SEN referrals received was analysed and
compared with the expected number of referrals for a control group of 16,379 children
within the same age range, across the state. Pupil characteristics were obtained from
referral data and children were categorised based on their season of birth. The
youngest students in the grade had birthdates from June to September (months 6-9);
the oldest children in the grade had birthdates from October to January (months 10-1)
and the middle group of children had birthdates from February to May (months 2-5).
Children were divided into three age groups by birth date parameters; kindergarten
and first grade (ages 5-7); second and third grade (ages 8-9); and fourth and fifth
grade (aged 10 and over). Outcome measures were season of birth, gender and age at
referral.
Key findings were that children in the five to seven age-group had significantly more
SEN referrals than expected, compared to the other two age groups. The number of
actual referrals for the youngest children (months 6-9) was greater than expected
(significant at p< 0.0042 level) across all outcome measures. For the five to seven-
year-old age group overall and for boys, differences were significant at p< 0.0001 and
for girls differences were significant at the p< 0.0011 level. No significant differences
were found for children in the two older age groups.
The authors conclude that there is more than one factor inherent in the referral
process, including teachers’ failure to take sufficient account of primary-age
children’s rates of development which leads to unrealistic expectations of younger
children’s academic achievement level. To reduce the overrepresentation of SEN
referrals for children who are younger relative to their peers, the authors recommend
an evaluation of the current SEN referral process, pre-referral intervention strategies
and greater caution by teachers when referring young children for special education.

43
Wilson, G. (2000). ‘The effects of season of birth, sex and cognitive abilities on the
assessment of special educational needs’, Educational Psychology, 20, 2, 153–166.
This small scale study explores the correlation between season of birth, gender and
cognitive abilities of children with special education needs (SEN) in an 11-18
comprehensive school in England (1225 pupils). The sample comprised 178 pupils
from Years 7 to 11 (aged 11-16) who were classified according to the SEN Code of
Practice 1994 on a scale of 1-5 in 1997. The sample was categorised into three season
of birth groups: autumn (September to December), spring (January to April) and
summer (May to August). Statistical modelling was used to analyse SEN
categorisations in relation to outcomes on the Cognitive Abilities Test (CAT).
Key findings showed that autumn-born children were under-represented in SEN
classifications. Overall in Years 7 to 11, ten per cent of autumn-born children had
SEN, relative to 17 per cent of both spring- and summer-born children. Season of
birth effects for spring and summer-born children were both statistically significant
(p<0.01). Across each year group, statistically significantly more boys were
diagnosed with SEN compared to girls (p<0.001). However, the findings indicated
that summer-born boys were at no statistically significantly greater risk of being
diagnosed with SEN compared to summer-born girls. As expected, CAT scores for
pupils with SEN were lower than those attained by pupils who were not classified as
having SEN (the author does not indicate whether this is a statistically significant
difference). When associated with season of birth, mean CAT scores (prior to age
adjustment) for summer-born children with SEN (88.5) were actually slightly higher
than those for autumn-born children with SEN (87.1), indicating that the number of
summer-born children diagnosed with SEN cannot be explained by differences in
cognitive abilities for different birth groups.
The author discusses a number of factors which may contribute to season of birth
differences, including age on entry to primary school, the suitability of the curriculum
for the youngest children in the year group and teacher expectations and assessments.
He concludes that the inconsistencies found between the estimated ability of summer-
born children compared to their actual ability may be indicative of inappropriate
teacher referrals for SEN, which may not take sufficient account of the developmental
differences between the youngest children in a year group relative to their peers.

44
5. References
Abe, K., Mimura, K., Wang, C., Mimura, T., Mikami, S., Ninomiya, T. and
Shiomithu, K. (1998). ‘Correlation between children’s physique and motor
performance divided month age’, Education, Psychology, Special Education and
Physical Culture, 47, 1, 225–238.
Bishop, J.L. (2008). ‘A comparative analysis of self-esteem, school involvement,
family cohesiveness and academic achievement in seventh and eighth graders
dependent upon their relative age’, Dissertation Abstracts International Section A –
Humanities and Social Sciences, 69, 1, 106.
Blake, M. and Finch, S. (2000). Survey of the Movement of Children from Playgroups
to Reception Classes. London: National Centre for Social Research.
Boardman, M. (2006). ‘The impact of age and gender on prep children’s academic
achievements’, Australian Journal of Early Childhood, 31, 4, 1–6.
Cascio, E. and Schanzenbach, D. (2007). First in the Class? Age and the Education
Production Function (NBER Working Paper No. 13663). Cambridge, MA: National
Bureau of Economic Research.
Chow, S.C. (2007). ‘Effect of fractional age difference on academic performance for
children under twelve’, Australian Research in Early Childhood Education, 14, 33–
43.
Crawford, C., Dearden, L. and Meghir, C. (2007). When You Are Born Matters: the
Impact of Date of Birth on Child Cognitive Outcomes in England. London: The
Institute for Fiscal Studies [online]. Available:
http://www.ifs.org.uk//docs/born_matters_report.pdf [3 December, 2008].
Daniels, S., Shorrocks-Taylor, D. and Redfern, E. (2000). ‘Can starting summer–born
children earlier at infant school improve their national curriculum results?’ Oxford
Review of Education, 26, 2, 207–220.
Datar, A. (2006). ‘Does delaying kindergarten entrance give children a head start?’
Economics of Education Review, 25, 1, 43–62.
Department for Children Schools and Families (2008). Letter to Sir Jim Rose from Ed
Balls, Secretary of State for Education. London: DCSF. [online]. Available:
http://www.dcsf.gov.uk/pns/DisplayPN.cgi?pn_id=2008_0003 [28 October, 2008].
Dunsmuir, S. and Blatchford, P. (2004). ‘Predictors of writing competence in 4 to 7
year old children’, British Journal of Educational Psychology, 74, 3, 461–483.
Fleischman, D. (2007). ‘Associations between age at school entry and academic
performance: using data from a nationally representative, longitudinal sample’,
Dissertation Abstracts International Section A – Humanities and Social Sciences, 68,
879.

45
Gardner, J. and Cowan, P. (2000). Testing the Test: a Study of the Reliability and
Validity of the Northern Ireland Transfer Procedure Test in Enabling the Selection of
Pupils for Grammar School Places. Belfast: University of Belfast, Graduate School of
Education [online]. Available:
http://gtcni.openrepository.com/gtcni/handle/2428/6312 [26th November, 2008]
Gledhill, J., Ford, T. and Goodman, R. (2002). ‘Does season of birth matter? The
relationship between age within the school year (season of birth) and educational
difficulties among a representative general population sample of children and
adolescents (aged 5-15) in Great Britain’, Research in Education, 68, 41–47.
Goodman, R., Gledhill, J. and Ford, T. (2003). ‘Child psychiatric disorder and relative
age within school year: cross sectional survey of large population sample’, British
Medical Journal, 327, 7413, 472–475.
Gray, J., Jesson, D. and Sime, N. (1990). ‘Estimating differences in the examination
performances of secondary schools in six LEAs: a multi-level approach to school
effectiveness’, Oxford Review of Education, 16, 2, 137–158.
Greenwood, A. and Ayre, K. (2005). ‘The impact of date of birth on placement on the
Special Educational Needs Register: variations between category of need, key stage
and gender, and the role of standardised assessment’, DECP Debate, 116, 15–24.
Katz.L .G. (2000). Academic Redshirting and Young Children. Washington, DC: US
Department of Education, Education Resources Information Center [online].
Available: http://findarticles.com/p/articles/mi_pric/is_200011/ai_3019667772 [29
October, 2008].
Kavkler, M. (2000). ‘Getting it right from the start? The influences of early school
entry on later achievements in mathematics’, European Early Childhood Education
Research Journal, 8, 75–93.
Kawaguchi, D. (2006). The Effect of Age at School Entry on Education and Income
(ESRI Discussion Paper Series No. 162). Tokyo: Cabinet Office, Economic and
Social Research Institute [online]. Available:
http://www.esri.go.jp/jp/archive/e_dis/e_dis170/e_dis162.pdf [3 December, 2008].
Kawaguchi, D. and Mori, M. (2007). ‘Birthday, test scores and educational
attainment’, Japanese Journal of Labour Studies, 49, 12, 29–42.
Lawlor, D.A., Clark, H., Ronalds, G. and Leon, D.A. (2006). ‘Season of birth and
childhood intelligence: findings from the Aberdeen children of the 1950s cohort
study’, British Journal of Educational Psychology, 76, 3, 481–499.
Lincove, J.A. and Painter, G. (2006). ‘Does the age that children start kindergarten
matter? Evidence of long-term educational and social outcomes’, Education
Evaluation and Policy Analysis, 28, 153–179. [online]. Available: http://www-
rcf.usc.edu/~gpainter/Season%20of%20Birth%2009_04.pdf [29 September, 2008].
Martin, R.P., Foels, P., Clanton, G. and Moon, K. (2004). ‘Season of birth is related to
child retention rates, achievement, and rate of diagnosis of specific LD’, Journal of
Learning Disabilities, 37, 4, 307–317.

46
McEwan, P. and Shapiro, J. (2008). ‘The benefits of delayed primary school
enrollment: discontinuity estimates using exact birth dates’, Journal of Human
Resources, 43, 1, 1–29.
Menet, F., Eakin, J., Stuart, M. and Rafferty, H. (2000). ‘Month of birth and effect on
literacy, behaviour and referral to psychological service’, Educational Psychology in
Practice, 16, 2, 225–234.
Moon, S. (2003). ‘Birth date and pupil attainment’, Education Today, 53, 4, 28–33.
Oshima, T.C. and Domaleski, C.S. (2006). ‘Academic performance gap between
summer-birthday and fall-birthday children in grades K-8’, Journal of Educational
Research, 99, 4, 212–217.
Plug, E.J.S. (2001). ‘Season of birth, schooling and earnings’, Journal of Economic
Psychology, 22, 5, 641–660.
Polizzi, N., Martin, R.P. and Dombrowski, S.C. (2007). ‘Season of birth of students
receiving special education services under a diagnosis of emotional and behavioural
disorder’, School Psychology Quarterly, 22, 1, 44–57.
Schagen, I. (2008). Analysis of International Data for New Zealand to Investigate the
Relationships between Performance, Age and Birth Month. Unpublished report.
Schrage, D.N. (2007). ‘The relationship between early admission to first grade and
school success of elementary school children’, Dissertation Abstracts International
Section A – Humanities and Social Sciences, 68, 6A, 2325.
Slavin, R.E. and Fashola, O.S. (1998). Show Me the Evidence! Proven and Promising
Programs for America's Schools. London: Corwin Press.
Thorpe, K., Tayler, C., Bridgstock, R., Grieshaber, S., Skoien, P., Danby, S. and
Petriwskyj, A. (n.d.). Preparing for School: Report of the Queensland Preparing for
School Trial 2003/4. Queensland, QLD: Queensland Government [online]. Available:
http://education.qld.gov.au/etrf/pdf/qutreportqldpreptrial.pdf [3 December, 2008].
Tymms, P.B., Merrell, C.H. and Henderson, B. (2000). ‘Baseline assessment and
progress during the first three years at school’, Educational Research and Evaluation,
6, 2, 105–129.
Wallingford, E.L. and Prout, H.T. (2000). ‘The relationship of season of birth and
special education referral’, Psychology in the Schools, 37, 4, 379–387.
Wilson, G. (2000). ‘The effects of season of birth, sex and cognitive abilities on the
assessment of special educational needs’, Educational Psychology, 20, 2, 153–166.
Yesil-Dagli, U. (2006). ‘The effects of kindergarten entrance age on children’s
reading and mathematics achievement from kindergarten through third grade’,
Dissertation Abstracts International Section A – Humanities and Social Sciences, 67.

47
Appendix 1 Search Strategy
The following section provides information on the keywords and search strategy for each
database searched. All searches were conducted by information specialists at NFER. The
databases were searched in the order: BEI, AEI, ERIC, BEIRC, ASSIA, CERUK Plus,
PsycINFO, ChildData and IBSS. The keywords used in the searches, together with a brief
description of each of the databases searched, are outlined below. The following conventions
have been used: (ft) denotes that free-text search terms were used and * denotes a truncation
of terms.
Searches were conducted for national and international literature, written in English and
published during the period from January 2000 to July 2008.
Table 3: Overview of searches
Source Items found Items selected for
consideration
Databases
Applied Social Sciences Index and Abstracts (ASSIA)
333 4
Australian Education Index (AEI) 165 23
British Education Index (BEI) 243 17
ChildData 40 9
Education Resources Information Center (ERIC)
309 36
International Bibliography of the Social Sciences (IBSS)
107 1
PsycINFO 608 21
Internet databases/portals
British Education Internet Resource Catalogue (BEIRC)
22 0
CERUK Plus 42 2

48
Applied Social Sciences Index and Abstracts (ASSIA) (searched via CSA 03/09/08)
ASSIA is an index of articles from over 500 international English language social science
journals.
#1 school and entry #8 birth and season
#2 school and entrance #9 age and difference*
#3 entry and age #10 school* or preschool* or class* or grade*
#4 entrance and age #11 #1 or #2 or #3 or #4 or #5 or #6 or #7 or #8
#5 summer and born #12 #9 and #10
#6 date and birth #13 #11 or #12
#7 starting and school
(all ft)
Australian Education Index (AEI) (searched via Dialog 29/08/08)
AEI is Australia’s largest source of education information covering reports, books, journal
articles, online resources, conference papers and book chapters.
#1 age differences #8 date and birth (ft)
#2 age grade placement #9 late birthday (ft)
#3 school readiness #10 birthday and effect* (ft)
#4 learning readiness #11 preschool* or school* or curriculum (ft)
#5 school entrance age #12 #1 and #11
#6 relative age (ft) #13 #2 or #3 or #4 or #5 or #6 or #7 or #8 or #9 or #10
#7 seasonal and effect* (ft) #14 #12 or #13
British Education Index (BEI) (searched via Dialog 28/08/08)
BEI provides information on research, policy and practice in education and training in the
UK. Sources include over 300 journals, mostly published in the UK, plus other material
including reports, series and conference papers.
#1 age differences #10 summer and born (ft)
#2 age grade placement #11 season and birth (ft)
#3 enrolment trends #12 date and birth (ft)
#4 school entrance age #13 birthdate (ft)
#5 school readiness #14 school* or curriculum or preschool* (ft)
#6 early admission #15 #1 and #14
#7 learning readiness #16 #2 or #3 ………or #13
#8 relative age (ft) #17 #15 or #16
#9 rising five* (ft)

49
British Education Internet Resource Catalogue (BEIRC) (searched 02/09/08)
The British Education Internet Resource Catalogue is a freely accessible database of
information about professionally evaluated and described internet sites which support
educational research, policy and practice.
#1 Learning readiness or age grade placement or pupil placement or age differences or
early admission or acceleration: education or school entrance age or school readiness
CERUK Plus (searched 04/09/08)
The CERUK Plus database provides access to information about current and recently
completed research, PhD level work and practitioner research in the field of education and
children’s services.
#1 Age factor or season of birth or school entrance age or school readiness
ChildData (searched 05/09/08)
ChildData is the National Children’s Bureau database, containing details of around 35,000
books, reports and journal articles about children and young people.
#1 relative age (ft) #7 age (ft)
#2 summer and born (ft) #8 starting school or starting preschool
#3 season and birth (ft) #9 #7 and #8
#4 birth and month (ft) #10 #1 or #2 or #3 or #4 or #5 or #6 or #7
#5 early entry (ft) #11 #9 or #10
#6 age and grade (ft)
Education Resources Information Center (ERIC) (searched via Dialog 01/09/08)
ERIC is sponsored by the United States Department of Education and is the largest education
database in the world. Coverage includes research documents, journal articles, technical
reports, program descriptions and evaluations and curricula material.
#1 age group placement #7 age (ft)
#2 school entrance age #8 school readiness
#3 relative age (ft) #9 #7 and #8
#4 summer and born (ft) #10 #1 or #2 or #3 or #4 or #5 or #6
#5 season and birth (ft) #11 #9 or #10
#6 school and starting and age (ft)

50
International Bibliography of the Social Sciences (IBSS) (searched via EBSCOhost 18/09/08)
The International Bibliography of the Social Sciences (IBSS), produced by the
London School of Economics and Political Science, includes over 2.5 million
references to journal articles, books, reviews and selected chapters. It focuses mainly
on the four core social science disciplines - anthropology, economics, politics and
sociology - but it also covers a range of interdisciplinary subjects. IBSS is especially
strong on international material with over 50 per cent of journals published outside
the US or UK.
#1 season and birth #8 classroom* or class
#2 birth and date #9 school* or preschool*
#3 starting and school and age #10 #8 or #9
#4 summer and born #11 #1 or #2 or #3 or #4 or #5 or #6
#5 school readiness #12 #7 and #10
#6 relative age #13 #11 or #12
#7 age difference*
(All ft)
PsycINFO (searched via Silverplatter 05/09/08)
The PsycINFO database is produced by the American Psychological Association
(APA).
It contains references to the psychological literature, including articles from over
1,300 journals in psychology and related fields, chapters and books, dissertations and
technical reports.
#1 seasonal variations #9 birth and month (ft) #2 birth and month* (ft) #10 classroom* or class or classes (ft) #3 early admission (ft) #11 school* or preschool* (ft) #4 relative age (ft) #12 pupil* or student* or grade* #5 summer and born (ft) #13 #10 or #11 or #12 #6 season and birth (ft) #14 #1 or #2 ………. or #9 #7 age and entry (ft) #15 #13 and #14 #8 age and grade (ft)

51
Appendix 2 Country Context for the Countries Reviewed
For each of the countries/states for which highly relevant research articles were
identified, NFER information colleagues provided the research team with a brief
contextual summary. This provides information on the organisation of year groups/
phases and of the school year for the country/federal state concerned. These
contextual ‘fiches’ follow.
Chile
Year/Grade Approximate age range
Year 1 6-7
Year 2 7-8
Year 3 8-9
Year 4 9-10
Year 5 10-11
Year 6 11-12
Year 7 12-13
Year 8 13-14
Year 9 14-15
Year 10 15-16
Year 11 16-17
Year 12 17-18
Bold=compulsory
General Basic Education (Educación general básica – EGB) is compulsory for eight
years from age 6 to age 14. All children aged 6 on the 31st March of the relevant year
start school. EGB is divided into two cycles, each of four years.
The school year runs from the 1 March to the 31st December.
Source: World Data on Education: Chile 6th
Edition 2006/07. Online:
http://www.ibe.unesco.org/en/access-by-country/latin-america-and-the-
caribbean/chile/profile-of-education.html

52
Country Context: Georgia (USA)
Bold = compulsory
Georgia law requires that students attend a public or private school or a home study
programme from their sixth to their sixteenth birthdays. Public kindergarten is
available in every school system, but is not mandatory.
A child must be five years old on or before September 1 to enter a public
kindergarten. The child must be six years old on or before September 1 to enter first
grade (Year 1). School systems must verify age before enrolment.
Individual school districts are responsible for setting the annual school calendar.
Georgia law sets a requirement of 180 school days for students and 190 days for
teachers (the 180 student teaching days, plus 10 training days). In most districts, the
school year runs from August to June and consists of three 12-week terms, with two
or more weeks’ break at Christmas and in the spring, and 10/12 weeks in the summer.
There are usually no mid-term breaks, other than days for national holidays.
Year/Grade Approximate age range
Kindergarten 5-6
Grade 1 6-7
Grade 2 7-8
Grade 3 8-9
Grade 4 9-10
Grade 5 10-11
Grade 6 11-12
Grade 7 12-13
Grade 8 13-14
Grade 9 14-15
Grade 10 15-16
Grade 11 16-17
Grade 12 17-18

53
Country Context: Northern Ireland
Bold = compulsory
A child who reaches the age of four on or before 1 July must start full-time education
on 1 September of that year. The compulsory school starting age in Northern Ireland
was lowered from five to four years in 1989 because it was thought that all children
would benefit from spending a total of 12 full years at school (seven years at primary
school and five at secondary school).
Prior to the 1998/99 school year, some schools which had sufficient places available,
also enrolled four-year-olds whose birthdays fell after 1 July (that is, children who
had not reached compulsory school age) in primary education. Since September 1999,
this practice has only been allowed to continue in schools already using it. Schools
Year
Group
Age range Key stage Phase
0-3 Pre-school and nursery education
3-4 Pre-school and nursery education
Year 1 4-5 Foundation stage Primary
Year 2 5-6 Foundation stage Primary
Year 3 6-7 Key stage 1 Primary
Year 4 7-8 Key stage 1 Primary
Year 5 8-9 Key stage 2 Primary
Year 6 9-10 Key stage 2 Primary
Year 7 10-11 Key stage 2 Primary
Year 8 11-12 Key stage 3 Secondary
Year 9 12-13 Key stage 3 Secondary
Year 10 13-14 Key stage 3 Secondary
Year 11 14-15 Key stage 4 Secondary
Year 12 15-16 Key stage 4 Secondary
Year 13 16-17
Year 14 17-18

54
which did not have this as an existing policy are no longer permitted to introduce a
policy of admitting children under compulsory school age, even in instances where
there is surplus capacity.
Schools in Northern Ireland are required to be in operation for 200 days a year and the
school year runs from the beginning of September to the end of the following June,
with eight weeks’ summer break and approximately two weeks at Christmas and
Easter.

55
Country Context: Tasmania (Australia)
Bold = compulsory
In Tasmania, the Preparatory Year (5- to 6-year-olds) is compulsory and the school
leaving age is 16. Legislation introduced in January 2008 introduced additional
requirements which mean that, after leaving Year 10 (at around age 16), young people
must continue in education or training for two years or until they turn 17.
The school year in Australia is generally organised around four terms and begins in
late January/early February; the annual five- to six-week summer holiday is in
December and January. Exceptionally, in Tasmania, there are three main terms in
school education. Term one runs from February to late May/early June. This term is
followed by a 10-day (two-week) holiday. There is also a 10-day (half-term) break for
Easter in the middle of the first term. Term two runs from June to September and is
followed by a 10-day holiday; and term three commences in late September and ends
just before Christmas.
Year/Grade Age range
Year 0 (known as Preparatory or Kindergarten) 5-6
Year 1 6-7
Year 2 7-8
Year 3 8-9
Year 4 9-10
Year 5 10-11
Year 6 11-12
Year 7 12-13
Year 8 13-14
Year 9 14-15
Year 10 15-16
Year 11 16-17
Year 12 17-18