Embed Size (px)
Citation preview

International Research Journal of COMPUTER SCIENCE
(IRJCS)
ISSN: 2393-9842 Volume 2, Issue 12 of December 2015
AM PUBLICATIONS© (2014-15)
www.irjcs.com Email: [email protected]

IRJCS
INTERNATIONAL RESEARCH JOURNAL OF COMPUTER
SCIENCE
Scientific Journal High Impact Factor value for 2014= 2.023 http://www.sjifactor.inno-space.net/passport.php?id=17807 (click)
Volume 2, Issue 12 of December 2015
ISSN: 2393-9842
A Monthly Journal of Computer Science
Follow us:

IRJCS Editorial Board Dr. Mary Lourde R., BITS-PILANI DUBAI, UAE Dr. Pankaj Gupta, Microsoft Corporation, U.S.A. . Dr. Shimon K. Modi, Director of Research BSPA Labs, Purdue University, USA Dr Venu Kuthadi, University of Johannesburg, Johannesburg, RSA Dr S. Rajalakshmi, Botho College, South Africa Dr. Mehrdad Jalali, Azad University, Mashhad, Iran Dr. Kashif Nisar, University Utara Malaysia, Malaysia Dr. Muhammad Asif Khan, King Faisal University, Saudi Arabia Dr. Wei Zhang, Amazon.com, Seattle, WA, USA Dr. Mohammad A. Mezher, Fahad Bin Sultan University, KSA Dr. Manish Kumar Anand, Salesforce (R & D Analytics), San Francisco, USA Dr. Gerard G. Dumancas, Oklahoma Medical Research Foundation, USA Dr. Hazra Imran, Athabasca University, Canada Dr. D. Nagarajan, Salalah College of Technology, Sultanate of Oman Dr. Hamza Aldabbas, Al-Balqa’a Applied University, Jordan Dr. Khaled Eskaf, Arab Academy for Science & Technology & Maritime Transportation, Egypt Dr. Nasser Lotfi, Eastern Mediterranean University, Northern Cyprus Dr. Rahul Malik, Cisco Systems, USA Dr. Neeraj Kumar, SMVD University, Katra (J&K), India Dr. Durgesh Kumar Mishra, Acropolis Institute of Technology and Research, Indore, MP, India Dr.C.Suresh Gnana Dhas, Vivekananda Engineering College, India Dr. Shishir Kumar, Jaypee University of Information Technology, Wakanaghat (HP), India Dr. Poonam Garg, Institute of Management Technology, India Dr. S Santhosh Baboo, D.G.Vaishnav College, Chennai, India Dr. Arunkumar Thangavelu, VIT University, India Dr Suresh Jain, Professor, Devi Ahilya University, Indore (MP) India, Dr. Utkarsh Seetha, Data Infosys Limited, India Dr. A. Neela madheswari, MES, India Dr. Atul Gonsai, Saurashtra University, Gujarat, India Dr. P. Subashini, Avinashilingam University for Women, India Dr. R. Baskaran, Department of Computer Science and Engineering, Anna University, Chennai Dr. Dhavachelvan Ponnurangam, Pondicherry Central University, India Dr. Abdul Wahid, AKG Engg. College, Ghaziabad, India Dr. Sabu M. Thampi, .B.S Institute of Technology for Women, Kerala University, India Dr. Himanshu Aggarwal, Department of Computer Engineering, Punjabi University, India Dr. M. Aramudhan, Perunthalaivar Kamarajar Institute of Engineering and Technology, India Dr. M. P. Thapliyal, CSE, HNB Garhwal University (Central University), India

IRJCS Reviewers Board Dr. Manjaiah D.H, Mangalore University, India Dr. Deepak Laxmi Narasimha, Faculty of CS, University of Malaya, Malaysia Dr. Mohammed M. Kadhum, Universiti Utara Malaysia Dr. Shahaboddin Shamshirband, Islamic Azad University, Iran Dr. Dang Tuan NGUYEN, University of IT, Vietnam National University - Ho Chi Minh City Dr. Mana Mohammed, University of Tlemcen, Algeria Dr. Bin Guo, Institute Telecom SudParis, France Dr. Venkatramreddy Velma,University of Mississippi Medical Center, Jackson MS USA Dr. Natarajan Meghanathan, Jackson State University, Jackson, MS, USA Dr. S. Abdul Khader Jilani, University of Tabuk, Tabuk, Saudi Arabia Dr. Amjad Rehman, University Technology Malaysia, Malaysia Dr. Lena Khaled, Zarqa Private University, Aman, Jordon Dr. Tossapon Boongoen , Aberystwyth University, UK Dr . Bilal Alatas, Firat University, Turkey Dr. Muzhir Shaban Al-Ani, Amman Arab University Amman – Jordan Dr. Dhuha Basheer abdullah, Mosul university, Iraq Dr. Hosam I. Faiq, USM, Malaysia Dr. Mohamed A. Deriche, King Fahd University of Petroleum and Minerals, Saudi Arabia Dr. Nikolai Stoianov, Defense Institute, Bulgaria Dr. Md. Ekramul Hamid, Rajshahi University, Bangladesh Dr. Nighat Mir, Effat University, Saudi Arabia Dr. Terry H. Walcott, E-Promag Consultancy Group, United Kingdom Dr. Smriti Agrawal, JB Institute of Engineering and Technology, Hyderabad Dr. K. Reji Kumar, N S S College, Pandalam, India Dr. Abhay Bansal, Amity University, India Dr. Kannan Balasubramanian, Mepco Schlenk Engineering College, India Dr. S. Sankara Gomathi, Panimalar Engineering College, India Dr. Vishal Bhatnagar, Ambedkar Institute of Advanced Communication Technologies & Research, India Dr Sanjay Bhargava, Banasthali University, India Dr. Amit Wason, Hindustan Institute of Technology & Management, Punjab Dr. Ashu Gupta, Apeejay Institute of Management, India Dr. N. Karthikeyan, SNS College of Engineering, Anna University, India Dr. Binod Kumar, JSPM's, Jayawant Technical Campus, Pune, India Dr. Preeti Khanna, SVKM’s NMIMS, School of Business Management, India Dr. Dr. Rajan Gupta, GGSIP University, New Delhi, India Dr. Neeraj Tomer, SINE International Institute of Technology, Jaipur, India Dr. S. Santhi, SCSVMV University, India Dr. Setu Kumar Chaturvedi, Technocrats Institute of Technology, Bhopal, India Dr. K.V.N.R.Sai Krishna, S.V.R.M. College, India Dr. H.S. Behera, Veer Surendra Sai University of Technology (VSSUT), India Dr. Shrikant Tiwari, Shri Shankaracharya Technical Campus (SSTC), India Dr. R. Sathishkumar, Sri Venkateswara College of Engineering, India Dr. S. Malathi, Panimalar Engineering College, Chennai, India Dr. V. Subedha, Panimalar Institute of Technology, Chennai, India Dr. Prashant Panse, Swami Vivekanand College of Engineering, Indore, India Dr. G. Rasitha Banu, Vel's University, Chennai Dr. V. D. Ambeth Kumar, Panimalar Engineering College, Chennai Dr. S.C. Lingareddy, ALPHA College of Engineering, India Dr. Uttam Mande, Gitam University, India Dr. K. R. Ananth, Velalar College of Engineering and Technology, India Dr. Aruna Ranganath, Bhoj Reddy Engineering College for Women, India Dr. Virendra Gomase , Department of Bioinformatics, Padmashree Dr. D.Y. Patil University Dr. Padmavathi Ganapathi, Avinashilingam University for Women, Coimbatore Dr. P.Chakrabarti, Dept.of CSE, Sir Padampat Singhania University, Udaipur, India

CONTENTS
S. No
IRJCS- Vol2,Issue 12 of December 2015
Titles / Author Name
Paper ID
01
The 3D Game Simulation of “Anjungan DKI Jakarta” at Taman Mini Indonesia Indah and Betawi Culture based on FPS (First Person Shooter) Author: Desi Ramayanti
DCCS10080
02
Improved Performance for Cloud Services using Memory Allocation Techniques Authors: Mohamed Al-Ibrahim, Naser Al-Ibrahim
DCCS10082
03
Satellite Imagery Dimensionality Reduction Using Discrete Wavelet Transform For the Extraction of Cadastral Features Authors: Babawuro Usman ,Adamu Mustapha
DCCS10083
International Research Journal of Computer Science (IRJCS) ISSN: 2393-9842 Issue 12, Volume 2 (December 2015) www.irjcs.com
_________________________________________________________________________________________________ IRJCS: Impact Factor Value - Scientific Journal High Impact Factor value for 2014= 2.023
© 2014-15, IRJCS- All Rights Reserved Page -1
The 3D Game Simulation of “Anjungan DKI Jakarta” at Taman Mini Indonesia Indah and Betawi Culture based on
FPS (First Person Shooter)
Desi Ramayanti Faculty of computer science & University of Mercu Buana
Abstract— Taman Mini Indonesia Indah (TMII) is a culture miniature of Indonesia, it’s content of 33 traditional homes (Anjungan) from around Indonesia. Focus of research is Anjungan DKI Jakarta. The purpose of research is how to make an interesting learning material of education culture for student of elementary school. So, based on that purpose, this learning presented a 3D games and simulation of Anjungan DKI Jakarta. The story line is each player must find 20 rolls of paper for the challenge, in each paper contains information about the culture of DKI Jakarta. Players will visit all location of Anjungan, if finished collecting it.
Keywords— TMII, 3D Games, Jakarta, Learning, Culture, Human Computer Interaction
I. INTRODUCTION
Taman Mini Indonesia Indah (TMII) or “Beautiful Indonesia Miniature Park” is a culture miniature of Indonesia, contents of 33 traditional homes (called Anjungan) from 33 city of Indonesia. TMII is built from 1972 until 1975, it has an area is about 250 hectare. The propose of this place is presented of culture from all city of Indonesia (clothing, dance, traditions and traditional home). One of Anjungan at TMII is Anjungan DKI Jakarta. DKI Jakarta is the capital of Indonesia and the largest city of Indonesia. DKI Jakarta is one of the most populous urban agglomerations in the world.
The indigenous people of Jakarta are the Betawi, a community of mixed descent, a mixture of different races and ethnic groups, who for generations have made Jakarta their home. Very outspoken and democratic, the Betawi have assimilated different cultures in their daily life, arts, music and traditions. Staunch Muslims, the Betawi blends the original Malay language with neighbouring Sundanese words, mixed with Javanese, Chinese, Indian, Arab and Dutch words. Betawi have a many culture like a music called tanjidor which uses the trombone, piston tenor, clarinet. In dance, a betawi jaipong dance, and a culinary like kerak telor, and etc.
Because Jakarta is one of the most populous urban agglomerations in the world, is bringing out many problems, including the betawi culture. Betawi culture is a foreign culture for a people of Jakarta. It’s causing of modernity. It’s a serious problem for next generation, because today education of learning about betawi culture at elementary school is a boring lessons and not interested. These children are the next generation who will be responsible for educate people about betawi culture. If the present children’s not interest to learn and conserve this traditional culture, the next generation will be generation with zero information about betawi culture.
Based on this, the research concern for how to make a teaching materials for learning a culture betawi with interesting ways for children, like a Games 3D. Anjungan DKI Jakarta presented with 3D simulation and packed games. the rule of games is every child or user or player must collecting one by one roll of paper, its content is information of many culture of betawi, like a custom, traditional music, traditional culinary, traditional tools, betawi figures and etc.
II. RELATED OF DKI JAKARTA AND BETAWI CULTURE
This harbour town was first known as Sunda Kelapa. But on 22 June 1527 Prince Fatahillah razed Sunda Kelapa and founded the town of Jayakarta on the same site. This is the date that Jakarta takes as the establishment of the city. Jayakarta was a thriving port where traders from China, India, Arabia and later the Europeans, as well as those from all over the archipelago exchanged their wares.
In 1619, the Dutch VOC under Jan Pieterszoon Coen destroyed Jayakarta and built a new town on the west bank of the Ciliwung River, which he named Batavia, after the Batavieren, the Dutch tribal ancestors. Batavia was planned similar to Dutch towns, in a series of blocks cut by canals and defended by a fortified wall and a moat. This part of Batavia was completed in 1650. Old Batavia was where the Europeans lived, while the Chinese, Javanese and other indigenous groups were relegated outside the city entrenchment.
In its heydays, Batavia became known as the Jewel of the East, the seat of the VOC and later it became the seat of the Dutch Government over the sprawling East Indies archipelago. During the Japanese occupation in 1942, the Japanese again changed the name from Batavia to Jakarta [1].
The indigenous people of Jakarta are the Betawi, a community of mixed descent, a mixture of different races and ethnic groups, who for generations have made Jakarta their home.

International Research Journal of Computer Science (IRJCS) ISSN: 2393-9842 Issue 12, Volume 2 (December 2015) www.irjcs.com
_________________________________________________________________________________________________ IRJCS : Impact Factor Value - Scientific Journal High Impact Factor value for 2014= 2.023
© 2014-15, IRJCS- All Rights Reserved Page -2
Very outspoken and democratic, the Betawi have assimilated different cultures in their daily life, arts, music and traditions. Staunch Muslims, the Betawi blends the original Malay language with neighbouring Sundanese words, mixed with Javanese, Chinese, Indian, Arab and Dutch words.
The wedding costume of the bride adopts the Chinese tradition of bright red embroidered top with a veil of golden tassels. Whereas the bridegroom wears very contrasting costume inspired by the Arab and Indian Dons. The Betawi also absorb music from different races, including from the colonial Portuguese, Dutch, Arab and Indian traders, as also from neigbouring West and Central Java, making it all their very own. For musical instruments they use the Sunda trumpet and drums, while from Europe they have adopted the trombone and guitar, as well as Chinese instruments. While inspired by Portuguese music this has resulted in the distinct Jakarta music genre popularly known as Keroncong. With time there developed the Tanjidor , which uses the trombone, piston tenor, clarinet. This latter genre is said to have originated from the European plantations, since their tunes have European sounding names, such as Bananas, Delsi, Batalion, Welnes, and so on. But now they have become more local-sounding with tunes like Jali-Jali, Surilang, and the popular dangdut music. In dance, the Betawi Jaipong Dance fuses local choreography with distinct Chinese dance costumes inspired by the Beijing Opera [2].
III. METHODOLOGY
Problem analysis: how to analysis problem in education learning to make it interested. The the goal is presented education learn with games 3D.
Collecting Material DKI Jakarta and betawi culture: visit of Taman Mini Indonesia Indah, province of DKI Jakarta, Organization of Betawi, and text book about DKI Jakarta and
Betawi Culture
Methodology of software Engineering : Based on Multimedia is Games Simulation, methodology engineering is Luther [3]
Functional Analysis: Application Area: Public (Student of elementary School)
User Interface Model: 3D Type of Application: Games FPS (First Person Shooter) and Simulation
Object of Application: Anjungan DKI Jakarta Goal of Application: Material learning for culture education
Design & Material Collecting Rule of Games presented with flowchart
Story board Material Collecting : all about anjungan DKI Jakarta and betawi culture [4][5]
Implementation: 3D Simulation : Blender [6] and UDK [7]
Testing: uses alpha testing

International Research Journal of Computer Science (IRJCS) ISSN: 2393-9842 Issue 12, Volume 2 (December 2015) www.irjcs.com
_________________________________________________________________________________________________ IRJCS : Impact Factor Value - Scientific Journal High Impact Factor value for 2014= 2.023
© 2014-15, IRJCS- All Rights Reserved Page -3
IV. DESIGN 4.1 RULE OF GAMES THE RULES OF GAMES IS PRESENTED WITH FLOWCHART (FIGURE 1)
Fig. 1 Flowchart of the rule games in Anjungan DKI jakarta
4.1 STORY BOARD STORY BOARD THE GAMES SHOWED AT TABLE 1.
TABLE 1. STORY BOARD Games : Betawi Culture Scene Image Description Duration 1
Title : main page Action : click of dot Anjungan DKI Jakarta for starting game Back Sound : Indonesia Raya (Song of nation)
Until user click of the dot
2
Title : Welcome page Anjungan DKI Jakarta Home Action : click of the sub menu for the next action : Main play the game Cara Bermain how to play the games Sejarah Jakarta History of Jakarta Gambar Ondel ondel the picture icon of betawi Back Sound : Ondel Ondel (traditional Song betawi)
Until user click of the sub menu
3 Title : Anjungan DKI Jakarta Action : play games with mode FPS (First Person Shooter) Player will explore around location of Anjungan DKI Jakarta to finding 20 roll of paper. The piece of paper contains information about Betawi culture. Back Sound : Tanjidor music traditional of betawi
Until user finding 20 paper or exit button

International Research Journal of Computer Science (IRJCS) ISSN: 2393-9842 Issue 12, Volume 2 (December 2015) www.irjcs.com
_________________________________________________________________________________________________ IRJCS : Impact Factor Value - Scientific Journal High Impact Factor value for 2014= 2.023
© 2014-15, IRJCS- All Rights Reserved Page -4
4.2 COLLECTING MATERIAL MATERIAL USES IN THESE GAMES CAN BE VIEW AT TABLE 2
TABLE 2: COLLECTING MATERIAL Games : Betawi Culture No Image Description 1
Building A half of monas Size File: 680 KB Size Pict : 1600 x 1200 Type : jpq Camera : Samsung GT-S5360
2
Building : Kebaya House Size File: 965KB Size Pict : 1600 x 1200 Type : jpq Camera : Samsung GT-S5360
3
Building : Performance House Size File: 685 KB Size Pict : 1600 x 1200 Type : jpq Camera : Samsung GT-S5360
Building : Piramida 1 Size File: 737 KB Size Pict : 1600 x 1200 Type : jpq Camera : Samsung GT-S5360
Building : Piramida 2 / Balkon Size File: 728 KB Size Pict : 1600 x 1200 Type : jpq Camera : Samsung GT-S5360

International Research Journal of Computer Science (IRJCS) ISSN: 2393-9842 Issue 12, Volume 2 (December 2015) www.irjcs.com
_________________________________________________________________________________________________ IRJCS : Impact Factor Value - Scientific Journal High Impact Factor value for 2014= 2.023
© 2014-15, IRJCS- All Rights Reserved Page -5
Building Prism Size File: 4.17 MB Size Pict : 4608 x 3072 Pixel Type : jpq Camera : NIKON D3100
Ondel Ondel Size File: 4.17 MB Size Pict : 4608 x 3072 Pixel Type : jpq Camera : NIKON D3100
Monas Size File: 0.98 MB Size Pict : 969 x 1200 Pixel Type : jpq Source : http://www.jakarta.go.id/web/encyclopedia/detail/1989/Nasional-Monumen
Badik Size File: 3.75 MB Size Pict : 604 x 421 Pixel Type : jpq Source : http://www.jakarta.go.id/web/encyclopedia/detail/64/Badik-Cangkingan
Yapong Dance Size File: 25.2 MB Size Pict : 287 x 375 Pixel Type : jpq Source : http://www.jakarta.go.id/web/encyclopedia/detail/3603/Yapong
Lenong Size File: 35.9 MB Size Pict : 450 x 275 Pixel Type : jpq Source : http://www.jakarta.go.id/web/encyclopedia/detail/1739/Lenong
International Research Journal of Computer Science (IRJCS) ISSN: 2393-9842 Issue 12, Volume 2 (December 2015) www.irjcs.com
_________________________________________________________________________________________________ IRJCS : Impact Factor Value - Scientific Journal High Impact Factor value for 2014= 2.023
© 2014-15, IRJCS- All Rights Reserved Page -6
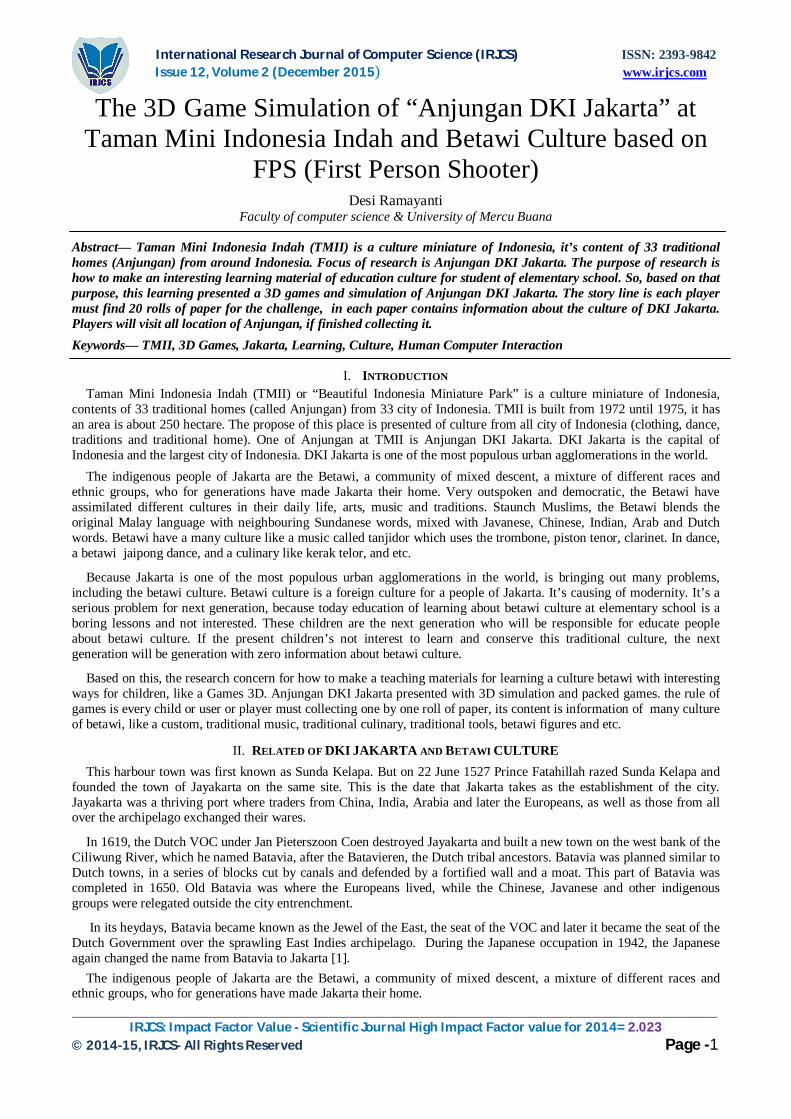
Custom Traditional Size File: 9.76 MB Size Pict : 350 x 422 Pixel Type : jpq Source : http://www.jakarta.go.id/web/news/2010/01/Pakaian
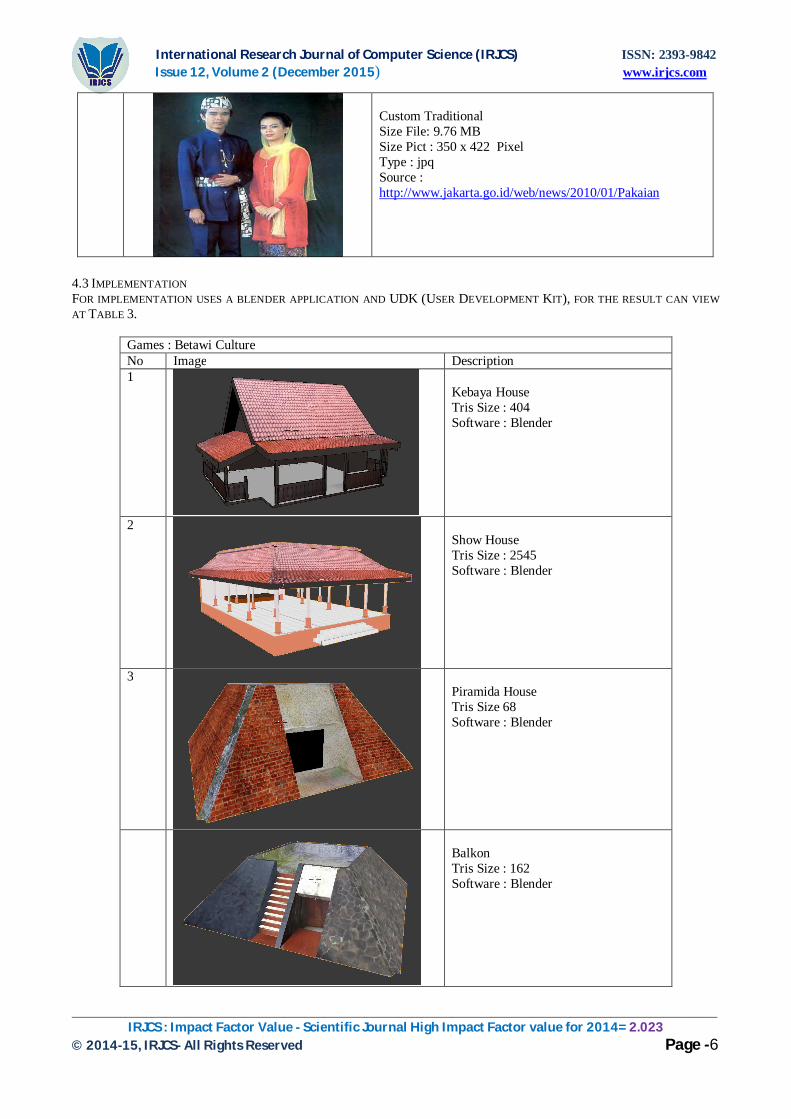
4.3 IMPLEMENTATION FOR IMPLEMENTATION USES A BLENDER APPLICATION AND UDK (USER DEVELOPMENT KIT), FOR THE RESULT CAN VIEW AT TABLE 3.
Games : Betawi Culture No Image Description 1
Kebaya House Tris Size : 404 Software : Blender
2
Show House Tris Size : 2545 Software : Blender
3
Piramida House Tris Size 68 Software : Blender
Balkon Tris Size : 162 Software : Blender

International Research Journal of Computer Science (IRJCS) ISSN: 2393-9842 Issue 12, Volume 2 (December 2015) www.irjcs.com
_________________________________________________________________________________________________ IRJCS : Impact Factor Value - Scientific Journal High Impact Factor value for 2014= 2.023
© 2014-15, IRJCS- All Rights Reserved Page -7
Welcome Page
Scene Anjungan DKI Jakarta
Scene Anjungan DKI Jakarta
Scene Anjungan DKI Jakarta
Scene Anjungan DKI Jakarta
Scene Anjungan DKI Jakarta

International Research Journal of Computer Science (IRJCS) ISSN: 2393-9842 Issue 12, Volume 2 (December 2015) www.irjcs.com
_________________________________________________________________________________________________ IRJCS : Impact Factor Value - Scientific Journal High Impact Factor value for 2014= 2.023
© 2014-15, IRJCS- All Rights Reserved Page -8
V. CONCLUSIONS In this paper, we have presented a research in the field of Human Computer Interaction for education culture by
providing a alternative material learning with formed interesting for student elementary school. That may allow teacher and students to transfer knowledge and learn by interesting. In the next research, we will try to accommodate all of culture of Indonesia.
REFERENCES
[1] Pemda DKI Jakarta, “Historic Jakarta.” [Online]. Available: http://www.jakarta-tourism.go.id/taxonomy/term/7. [2] Pemda DKI Jakarta, “Heritage and Culture.” [Online]. Available: http://www.jakarta-tourism.go.id/node/50. [3] Jose L. Encarnacao and J. D. Foley, Multimedia : System Architectures and Applications. Springer Science &
Business media, 2012. [4] A. Shahab, RobinHood Betawi : Kisah Betawi Tempo Doeloe. jakarta: Penerbit Republika, 2001. [5] Muhadjir, Bahasa Betawi: Sejarah dan perkembangannya. Yayasan Obor Indonesia, 2000. [6] Allan Brito, Blender 3D 2.49 Architecture, Buildings, and Scenery. England: Birmingham, 2010. [7] Rachel Cordone, Unreal development kit game programming with unrealscript. : Beginners guide create games
beyond your imagination with the Unreal Development Kit. Birmingham : Packt Pub, 2011.

International Research Journal of Computer Science (IRJCS) ISSN: 2393-9842 Issue 12, Volume 2 (December 2015) www.irjcs.com
_________________________________________________________________________________________________ IRJCS : Impact Factor Value - Scientific Journal High Impact Factor value for 2014= 2.023
© 2014-15, IRJCS- All Rights Reserved Page -9
Improved Performance for Cloud Services using Memory Allocation Techniques
Mohamed Al-Ibrahim, Dr. Naser Al-Ibrahim, Eng. Computing Dept. , KILAW Computer Eng. Dept. , Kuwait University
Abstract— The technological advancements over the years towards the improvements of the processor were astonishing, however memory developments weren’t as much. Memory allocation is a technique used to improve the memory assignment of programs in memory. The process of memory allocation is to assign either partial or complete portion of memory to the execution of processes. In this paper, we focus towards the concept of dynamic memory allocation in cloud computing environments where we present a cloud environment with a global memory and a stream of requests that requires to be assigned part of the global memory for a period of time. Different memory allocation schemes such as first-fit and best-fit have solved this problem. The proposed allocation scheme of this paper uses variant of sequential fit to produce slightly better results depending on the used environment. In this scheme, portals are proposed in order navigate and reserve memory. In order to demonstrate the efficiency of the proposed allocation scheme, we have simulated a pre-defined memory environment where we compared the performance of our technique with other techniques mentioned in the literature.
Keywords— cloud computing, memory management, sequential fit,
I. INTRODUCTION
Cloud computing has been a topic for interest for quite some time. Forrester Research [14] mentioned that the cloud computing market would grow up to 241$ billion by 2020 compared to 2010 where it was only 40$ billion. As an emerging topic of interest, cloud services are becoming the primary source of computing power for business and personal applications. Cloud computing operates by providing for their users a shared pool of servers in a secure data center where they offer subscription based and easily attainable computation in a scalable manner. Several cloud service models were proposed based on the generality of these resources: Infrastructure as a Service (IaaS), Platform as a Service (PaaS), and Software as a Service (SaaS) [15]. A new cloud service model was recently introduced [16] named Resource as a Service (RaaS). The RaaS model operates by renting resources separately instead of a fixed bundle. This results in transforming memory into an important billed resource. Thus stimulating a new interest in memory allocation as part of memory management.
Memory allocation is a technique in memory management to efficiently assign memory to different computer process and programs. Memory allocation is divided into two types: Static and Dynamic. Static memory allocation operates at compile time where all memory assignments are done, however dynamic memory allocation functions at run time where memory assignments have to be done on the fly. Since dynamic memory allocation operates at run time, the crucial aspect of any dynamic memory allocation is speed because a slow allocator would become a major bottleneck. Moreover, as the memory is limited is space, other the goal is not waste any memory space.
There are three basic categories for any memory allocation algorithm: sequential fits, segregated free and buddy system [17, 18, 19]. The mechanism of sequential fits is to keep track of free memories (holes) as a linked list that can be searched later sequentially. There are different techniques to search the list such as: random, first-fit, or best-fit. The random technique operates by random selecting a hole that fits the requesters criteria. While first fit functions by selecting the first hole in the list that fits the criteria. On the other hand, best fit works by selecting the best hole that fits the given criteria. Fig. 1 illustrates the random, first fit and best fit strategies given that the requestors memory criteria is 10 GB.
Fig. 1: Memory snapshot given that a users requesting 10GB [6]

International Research Journal of Computer Science (IRJCS) ISSN: 2393-9842 Issue 12, Volume 2 (December 2015) www.irjcs.com
_________________________________________________________________________________________________ IRJCS : Impact Factor Value - Scientific Journal High Impact Factor value for 2014= 2.023
© 2014-15, IRJCS- All Rights Reserved Page -10
In this paper, we introduce a new memory allocation technique that is based on the concept of sequential fits. The proposed solution exploits the concepts of portals to traverse memory in different manner. For simplicity we will assume that there exists a single portal in memory that can group different location of memory together. The scheme operates in a fashion similar to first fit until some user requesting memory gets blocked near a portal. In this case, it checks if it is possible to switch the portal into ON/OFF and check if it is possible to allow the user to reserve the memory space. We illustrate the resourcefulness of our approach by comparing it with other well versed approaches such as first fit, best fit and random memory allocation techniques. The rest of this paper is organized as follows: Section II presents the literature review of this field. The problem definition and analysis of the problem is defined in section III. In section IV we introduce our proposed technique where it is implemented and shown in section V. Section VI presents our results. We conclude in section VII with future work.
II. LITERATURE REVIEW
Memory allocation is a major topic of interest in the field of improving memory performance. Several works like Albers et al. [1] analyzed the first fit technique on the classical bin-packing problem where objects of different volumes must be placed inside fixed size containers while minimizing the number of bins used. They generalized the multi-dimensional Markov chain to demonstrate that the bin-packing algorithm is stable under pre-defined conditions. They created a tight bound to solve this NP-Complete problem. While Aron et al. in [2] proposed a new technique called cluster reserves to improve the performance of a webserver. They have evaluated a prototype implementation of their idea. Their attained results yield an increase in higher resource utilization and performance than the approaches used at the time.
In [3], Shore et al. published a through comparison on the effects of first-fit and best-fit memory allocation algorithms. Through simulation, the data obtained relative to the performance of the algorithms was acceptable. Their results demonstrated that with a small distribution both algorithms perform similarly while using an exponential distribution the first-fit algorithm outperformed best fit. They concluded that when the variation of the request distribution is greater than unity, first-fit would outperform best fit.
Stillwell et al. in [4] have proposed several algorithms to solve the resource allocation problem. They believe that the best approach to solve the problem is to perform a binary search over the yield. Among the different algorithms suggested, the Chose Pack vector- packing algorithm is the best. The disadvantage of the paper is that the workloads for which the number of instances per service do not change throughout time.
Costea et al. proposed an alternative resource allocator other than the generic allocation algorithms such as best-fit or first-fit for the miriaPOD platform in [5]. They claim that their allocator exploits the memory sharing features of the virtualization backend. They implemented a simulator that determines the performance of their proposed allocator. However, the proposed allocator is custom made for the miriaPOD platform.
In [6], Al-Yatama et al. proposed a novel technique that segregates the memory holes according to the size of the hole. After running their algorithm, they claim that their new algorithm is faster than traditional used techniques, it was also found that the proposed technique was distributing the data to the memory more fairly. Consequently, Younis et al. in [7] proposed a generic algorithm that handles segregated list of different size holes. They claim that their simulation results improved the performance of their system.
Lioa et al. have proposed another novel technique in [8]. The technique focuses on the energy consumption, which uses two heuristic algorithms that use Xan heaps. The simulation presented in the paper yielded 50% more energy efficiency than the standard used algorithms.
Elias et al. in [9] presented six different memory-allocating algorithms where they have compared them with each other in terms of execution time and memory usage. They claim that the Ptmallocv2 algorithm was superior in terms of time while the Ptmallocv3 algorithm was better in terms of memory usage.
In [10], Husagic-Selman et al. proposed a method that uses fuzzy logic in order to quickly handle real time memory allocation. Their simulated results yield a slight increase in speed by using their methodology. However, they claim that by changing and improving the fizzy pattern, the fizzy allocator is to be improved leading to better results.
Chung et al. in [11] proposed a new dynamic memory allocation scheme called Lazy-Fit. The scheme operates by using pointer increments as the main allocation method and conventional schemes such as First-Fit and Best-Fit are used as a backup. They claim that their proposed scheme if implemented properly could be faster than conventional schemes. However, the disadvantage of their scheme is the large increase of fragmentation that could be inadequate.
In [12], Hasan et al. performed a study of the different implementation of the Best-Fit memory allocator technique. In their study, they noticed that a 33% increase of performance is achieved if the algorithm is implemented by using the Doug Lea method. However, they should have included the First-Fit technique in their study to obtain even better results.
Orna et al. in [13], have proposed “Ginseng” a market-driven memory allocator. Their scheme inspires clients to bid their true memory needs upon actually requiring it.

International Research Journal of Computer Science (IRJCS) ISSN: 2393-9842 Issue 12, Volume 2 (December 2015) www.irjcs.com
_________________________________________________________________________________________________ IRJCS : Impact Factor Value - Scientific Journal High Impact Factor value for 2014= 2.023
© 2014-15, IRJCS- All Rights Reserved Page -11
By continuously gathering clients’ bids, they claim that Ginseng finds an efficient memory allocator, re-allocates physical memory and present it to the clients. They state that an improvement of 83-100% of the optimum in aggregated client satisfaction is achieved when compared with other state of the art approaches in cloud memory allocation. Similar to the work done in [6], we have proposed a new memory allocation scheme explained in details in the following sections.
III. PROBLEM DEFINITION & OBJECTIVES
To improve the performance of computer programs, the physical memory should be utilized efficiently. Memory allocation is a technique used to further utilize the physical memory. In order to improve the overall performance of computer systems, a suitable memory allocation algorithm should be used.
Given a physical memory of size X and a stream of requests of different instance types following a pre-defined distribution desiring to utilize the given memory. A memory allocation scheme will assign each request to a location in memory to utilize for a given period of time T. In order to improve the performance, the number of requests unable to utilize the memory given that the memory is full, must be minimized.
In brief, we do the following:
Describe the new memory allocation scheme that improves the performance and postpone the life of the physical memory by reducing the fragmentation occurring in the memory
Implement and simulate the proposed scheme Compare the proposed scheme with other well-known memory allocation schemes such as First-Fit and Best-Fit
Further, we define the work environment, and determine the representation of data.
A. Defining Environment
We assume a physical memory consisting of M memory units and I different instances, each having different memory requirements.
∀푖 ∈ 퐼∃푚 ≪ 푀 We will assume the smallest memory unit is u = 0.5 GiB. The amazon elastic cloud instances [20] t2.small and r3.8xlarge
are equal to 2 and 244 GiB respectively. Thus the t2.small and r3.8xlarge will require 4 and 488 memory units respectively. We will define the different instances I according to the amazon instances. Table 1 shows the different amazon instances and their corresponding memory units.
TABLE 1 AMAZON CLOUD INSTANCES
Name Memory Size (GiB) Memory Units (u) t2.micro 1 2 t2.small 2 4
t2.medium 4 8 t2.large 8 16
m4.xlarge 16 32 m4.2xlarge 32 64 m4.4xlarge 64 128 m4.10xlarge 160 320 r3.8xlarge 244 488
We will assume that each instance will arrive to our system following the Poisson distribution with λ requests per unit time. The normalized arrival rate for an instance can be obtained using the following equation:
λ = λ∑ λ
The holding time of requests in the system is assumed to follow the exponential distribution with a mean of 1 unit of time (e.g. 2 hours). Additionally, we assume that blocked requests will not enter the system again which implies that request-retrial rate is insignificant. We define the lost revenue in $ to be the sum of all blocking probability of requests multiplied by the requests demand for all 푖 ∈ 퐼. Then,
LostRevenue = D∈
xb $
and the normalized lost revenue is
NormalizedLostRevenue = ∑ D∈ xb
∑ D∈%

International Research Journal of Computer Science (IRJCS) ISSN: 2393-9842 Issue 12, Volume 2 (December 2015) www.irjcs.com
_________________________________________________________________________________________________ IRJCS : Impact Factor Value - Scientific Journal High Impact Factor value for 2014= 2.023
© 2014-15, IRJCS- All Rights Reserved Page -12
퐷 is given by the following demand function 퐷 = 푚 푥휆 where 푚 is the request memory unit size and 휆 is the arrival rate for that request type. The blocking probability 푏 is the probability that a specific request type will be blocked from the system.
IV. DESIGN METHODOLOGY The scheme is tested under different environments such that the arriving requests could be in uniform, exponential or bell
distribution. The lost revenue is then calculated for each environment and compared with different memory allocation strategies in a graph.
Portal is used in the scheme to navigate the memory. Portal, simply, is different arrangement of the memory. Fig. 3 below shows how portals function in the memory.
1
1 Portal Entrance 2 2 3 4 Portal Exit 4 5 5 3
Fig.3: Memory Snapshot of the portal closed and opened. The memory on the left shows the memory arrangement when the portal is closed while the memory on the right shows the memory arrangement when it is open
We notice from Fig. 3 that the memory in both cases is sequential listed. The algorithm exploits this feature by assigning users memory space in both situations if it is possible. The overall architectural design of this algorithm can be implemented by adding one extra bit in the hardware design. The underlying algorithm behind this technique is based on the first fit algorithm mentioned previously.
A. Algorithm Functionality
The algorithm functions initially by receiving a request to reserve a specific amount of memory. Next, it acquires the memory in a sequential linked list based on the state of the portal. Then , by using the underlying methodology, it navigates the memory and attempts to assign the user a part of that memory while saving the state of the portal in order to release it later on. If the attempt fails, the algorithm will check if it is possible to switch the portal state by checking surrounding memory locations around the portal. Assuming memory is free around the portal, the algorithm will switch the state of the portal and acquires the memory in a sequential linked list again but with the different state and attempts to assign the user some memory. Otherwise, the user is blocked until some memory is released. Fig. 4 shows a flow chart of the methodology.
Fig. 4 Architecture Overview of the Proposed Memory Allocation Algorithm
B. Portals Placement
The key issue in the algorithm is where to place the portals in the memory? There are many ways to place the entrance and exit portals in the memory. We argue that in order to effectively benefit from the portals, certain conditions must be met. First condition is that the entrance portal must be place before the exit portal in order reassign parts of the memory correctly. This idea rises from the concept of a wormhole. The other condition is that the distance between portals have to be equal.

International Research Journal of Computer Science (IRJCS) ISSN: 2393-9842 Issue 12, Volume 2 (December 2015) www.irjcs.com
_________________________________________________________________________________________________ IRJCS : Impact Factor Value - Scientific Journal High Impact Factor value for 2014= 2.023
© 2014-15, IRJCS- All Rights Reserved Page -13
Since we are assuming one portal to be used here, we believe that placing the entrance portal after 25% from the beginning of the memory and placing the exit portal 25% before the end of the memory will give us optimal results. Fig. 5 shows an example of where the entrance and exit portals should be placed in memory given one or two portals. Since we are using one portal, we will use the memory arrangement shown in Fig. 5 Part A.
25% 20% 20% 20%
Entrance 1 Entrance 1 Entrance 1
Entrance 20% 20% 20%
50%
Entrance 2 Exit 1 Entrance 2
20% 20% 20%
Exit 1 Entrance 2 Exit 2
Exit 20% 20% 20%
25% Exit 2 Exit 2 Exit 1
20% 20% 20%
A B C D
Fig. 5 Shows different arrangement of the memory with different portal assignments. Part A shows only one portal in use while Parts B, C, D shows the possible portals placement in memory.
V. IMPLEMENTATION
In order to simulate the proposed scheme, Java Object-Oriented Programming Language was used to write a custom simulator. The generated data by the simulator was fed into Microsoft Excel to represent and plot the data in graphical shape.
We have assumed that the arrival of requests to our system in Section 3 to be followed through the Poisson distribution with the arrival rate lambda λ. Similarly, we stated that the dwell time of these requests follow the exponential distribution. This is an example of the M/M/1 system in queuing theory. To implement this, we exploit the special case of the Poisson distribution where the inter arrival time is memory less therefore following an exponential distribution. Now using only the exponential distribution; we can simulate the arrivals of requests by using the inter-arrival time and dwell time of those requests. In order to simulate this system with two variables, we have assumed that one of the variable “the dwell time of requests” to be 1-time unit under different arrivals rates. Fig. 6 shows the flow chart of the system.
Fig. 6: Overall Flow Chart of the System

International Research Journal of Computer Science (IRJCS) ISSN: 2393-9842 Issue 12, Volume 2 (December 2015) www.irjcs.com
_________________________________________________________________________________________________ IRJCS : Impact Factor Value - Scientific Journal High Impact Factor value for 2014= 2.023
© 2014-15, IRJCS- All Rights Reserved Page -14
VI. RESULTS The proposed memory allocation technique was simulated with the system previously discussed under three different
environments. The first environment assumes a cloud where users select the different instances uniformly. Fig. 7 illustrates that our proposed scheme under this environment performed equally with the First-Fit and Best-Fit schemes and better than the Random scheme. The second environment under-take a scenario where cloud services are selected exponentially. This means that the lower instances such as the t2.micro instance has a higher chance than of being selected than the r3.8xlarge instance. The results shown in Fig. 8 shows that the proposed portal scheme performed slightly better than the other mentioned schemes. The final environment was tested on a cloud where users have a higher chance of selecting instances such as m4.xlarge & m4.2xlarge instead of t2.micro & r3.8xlarge thus leading to a normally distributed cloud. Fig. 9 shows that our proposed scheme performs slightly better than the other mentioned schemes. Using students t-distribution, we are 95% confidence of our results.
Fig. 7: Amazon Instances are selected based on the Uniformly Distribution
Fig. 8 Amazon Instances are selected based on the Exponential Distribution
0.0%
10.0%
20.0%
30.0%
40.0%
50.0%
60.0%
60 70 80 90 100 110 120
Nor
mal
ized
Lost
Rev
nue
Arrival Rates (per time unit)
Uniformly Distributed Instances
First Fit
Best Fit
Random
Proposed Portal
0.00%5.00%
10.00%15.00%20.00%25.00%30.00%35.00%40.00%
280 300 320 340 360 380 400
Nor
mal
ized
Lost
Rev
nue
Arrival Rates (per time unit)
Exponentially Distributed Instances
First Fit
Best Fit
Random
Proposed Portal

International Research Journal of Computer Science (IRJCS) ISSN: 2393-9842 Issue 12, Volume 2 (December 2015) www.irjcs.com
_________________________________________________________________________________________________ IRJCS : Impact Factor Value - Scientific Journal High Impact Factor value for 2014= 2.023
© 2014-15, IRJCS- All Rights Reserved Page -15
Fig. 9 Amazon Instances are selected based on the Normal Distribution (Bell-Shaped)
VII. CONCLUSION & FUTURE WORK
In this paper, we have proposed a new memory allocation algorithm in order to improve the performance of computer
systems in cloud services. Additionally, we have simulated our proposed methodology and obtained some promising results compared with other widespread scheme. Future works will explore the potentials of adding a multiple portals and the different effects on the system, other works will explore a more improved version of the proposed scheme where the algorithm have some kind of intelligence in order to differentiate between different tasks.
REFERENCES
[1] Susanne Albers and Michael Mitzenmacher. Average-case analyses of first fit and random fit bin packing. In SODA, volume 98, pages 290–299, 1998.
[2] Mohit Aron, Peter Druschel, and Willy Zwaenepoel. Cluster reserves: a mechanism for resource management in cluster-based network servers. In ACM SIGMETRICS Performance Evaluation Review, volume 28, pages 90–101. ACM, 2000.
[3] John E Shore. On the external storage fragmentation produced by first-fit and best-fit allocation strategies. Communications of the ACM, 18(8):433–440, 1975.
[4] Mark Stillwell, David Schanzenbach, Fr ́ed ́eric Vivien, and Henri Casanova. Resource allocation algorithms for virtualized service hosting platforms. Journal of Parallel and distributed Computing, 70(9):962–974, 2010.
[5] Stefan Costea, Marian Barbu, Constantin Muraru, and Razvan Rughinis. Resource allocation heuristics for the miriapod platform. In Networking in Education and Research, 2013 RoEduNet International Conference 12th Edition, pages 1–6. IEEE, 2013.
[6] Imtiaz Ahmad Anwar Alyatama and Naelah Al-Dabbous. Memory allocation algorithm for cloud service environments. The Computer Journal
[7] Manal F Younis. Memory allocation technique for segregated free list based on genetic algorithm. [8] Xiaofei Liao, Hai Jin, Shizhan Yu, and Yu Zhang. A novel memory allocation scheme for memory energy reduction
in virtualization environment. Journal of Computer and System Sciences, 81(1):3–15, 2015. [9] Diego Elias, Rivalino Matias, Marcia Fernandes, and Lucio Borges. Experimental and theoretical analyses of
memory allocation algorithms. In Proceedings of the 29th Annual ACM Symposium on Applied Computing, pages 1545–1546. ACM, 2014.
[10] Alma Husagic Selman, Ali Aburas, and Suvad Selman. Intelligent memory allocation based on fuzzy logic. SouthEast Europe Journal of Soft Computing, 3(1), 2014.
[11] Chung, Y., & Moon, S. M. (2000, October). Memory allocation with lazy fits. In ACM SIGPLAN Notices (Vol. 36, No. 1, pp. 65-70). ACM.
[12] Hasan, Y., & Chang, M. (2005). A study of best-fit memory allocators. Computer Languages, Systems & Structures, 31(1), 35-48.
[13] Agmon Ben-Yehuda, O., Posener, E., Ben-Yehuda, M., Schuster, A., & Mu'alem, A. (2014). Ginseng: Market-driven memory allocation. ACM SIGPLAN Notices, 49(7), 41-52.
0.00%
5.00%
10.00%15.00%
20.00%
25.00%30.00%
35.00%
40.00%
280 300 320 340 360 380 400
Nor
mal
ized
Lost
Rev
nue
Arrival Rates (per time unit)
Normally Distributed Instances
First Fit
Best Fit
Random
Proposed Portal

International Research Journal of Computer Science (IRJCS) ISSN: 2393-9842 Issue 12, Volume 2 (December 2015) www.irjcs.com
_________________________________________________________________________________________________ IRJCS : Impact Factor Value - Scientific Journal High Impact Factor value for 2014= 2.023
© 2014-15, IRJCS- All Rights Reserved Page -16
[14] Ried, S., Kisker, H., Matzke, P., Bartels, A., and Lisserman, M. (2011) Sizing the cloud—Understanding and quantifying the future of cloud computing. Technical Report, Forrester Research, Cambridge, MA . http://www.forrester.com/Sizing+The+Cloud/ fulletxt/E-RES58161.
[15] Manvi, S. and Shyam, G. (2014) Resource management for infrastructure as a service (IaaS) in cloud computing: a survey,” Journal of Network and Computer Applications, 41, pp. 424-440.
[16] Ben-Yehuda, O., Ben-Yehuda, M., Schuster, A., and Tsafrir, D. (2014) The Rise of RaaS: the Resource-as- a-Service cloud,” Communications of the ACM, 57, pp. 76-84.
[17] Sun, X., Wang, J., and Chen, X. (2007) An improve- ment of TLSF algorithm. Real-Time Conference, 15th IEEE- NPSS, 1, Batavia, IL.
[18] Masmano, M., Ripoll, I., Crespo, A., and Real, J. (2004) TLSF: a new dynamic memory allocator for real- time systems.16th Euromicro Conference on Real-Time Systems ECRTS, pp. 79-88.
[19] Peterson, J. and Norman, T. (1977) Buddy systems. Communications of the ACM, 20, pp. 421-431. [20] Amazon Web Services Instance types matrix, Ama- zon EC2 instances, http://aws.amazon.com/ec2/ instance-types
(August, 2014).

International Research Journal of Computer Science (IRJCS) ISSN: 2393-9842 Issue 12, Volume 2 (December 2015) www.irjcs.com
______________________________________________________________________________________________________ IRJCS : Impact Factor Value - Scientific Journal High Impact Factor value for 2014= 2.023
© 2014-15, IRJCS- All Rights Reserved Page -17
SATELLITE IMAGERY DIMENSIONALITY REDUCTION USING DISCRETE WAVELET TRANSFORM FOR THE
EXTRACTION OF CADASTRAL FEATURES
Babawuro Usman1, Department of Computer Science,
Kano University of Science and Technology, Wudil
Adamu Mustapha2 Department of Geography,
Kano University of Science and Technology, Wudil
Abstract-The Satellite imagery being naturally rich in information, careful information extraction is needed for the various applications that utilize it, as it is not suitable to be used in raw form because of the huge redundant information embedded therein. Therefore, satellite image dimensionality reduction is necessary in order to remove the unwanted information for further processing with less computational fatigue. This has made us to apply Discrete Wavelet Transform, to the High resolution satellite imagery so that it would contain less but more useful information for the extraction of cadastral features. Finally, having practically applied the 2D Discrete Wavelet Transform to the imagery, it has proved successful and made it more suitable for further cadastral analysis. Keywords-Satellite Imagery, Discrete Wavelet Transform, Dimensionality Reduction, Cadastral analysis, Georectification
I. INTRODUCTION Diverse needs for land information and technological advancements have necessitated changes in land administration systems, which are then placing greater pressure on the ways and manners organizations operate [1]. Similarly, and more importantly, Cadastral survey should evolve for a more sustainable socio economic and environmental development, as stated by [2]. Therefore, the innovative research primarily aims at using comprehensive and integrated Digital Image Processing algorithmic formulations to extract representations of cadastral feature from High Resolution Satellite Imagery, HRSI data with minimum human interventions, as an alternative. Achieving that objective would necessitate the use of Discrete Wavelet Transform, DWT algorithms to reduce the dimensionality of the HRSI. In most cases, dimensionality reduction of the imagery data is required to enhance, among others, processing time and storage space as stated by Du H. et al. [3], that dimensionality reduction is an important pre-processing step in satellite imagery analysis, as it eliminates redundant bands and diminishes computational burden. Dimensionality reduction is an important task in processing HRSI because of its huge redundant information. It facilitates better classification, compression, and visualization of high-dimensional data by mitigating undesired properties of the high-dimensional space. Most of the techniques for dimensionality reduction are based on the intuition that data lies on or near a complex low-dimensional manifold that is embedded in the high-dimensional space [4]. The techniques for the reduction aim at identifying and extracting the much needed data from the high-dimensional space. Methods for dimensionality reduction, amongst others include Principal component analysis, Independent component analysis, Discrete Cosine Transform, DCT, Discrete Wavelet Transform, DWT.
In our case, dimensionality of the imagery is reduced by applying DWT independently to eliminate redundant information that could otherwise have the image to occupy more space and consume processing time. Unlike, the human eye that is limited to the visual band of electromagnetic, EM, spectrum, Digital image processing covers the entire EM spectrum, ranging from gamma to radio waves. It as well operates on images from other sources, such as images from ultrasound, electron microscopy, and other computer generated images [5][12]. This has made us to apply DWT, to the Satellite imagery so that we could be left with less but more useful information for our task. The paper concludes as follows. Section II Related works; Section III contains the mathematical background; Section IV contains the implementation details; Section V contains the practical results; Section VI has discussions while Section VII contains the conclusion.
II. RELATED WORKS
Several methods have been carried out for image dimensionality reduction. Though they differ technically but they do have the common goal of eliminating redundant information while retaining the much needed features for analysis. Patil S.R. et al. [4] used the method of principal component analysis, PCA, and reduced the redundant dimension of satellite imageries. They concluded that, though PCA is a lossy method, but it is effective. Ludovic J. et al. [6] presented in their study an objective comparison of several dimensionality reduction methods, by evaluating their capabilities to provide usable inputs to the K-means clustering algorithm classification using multispectral imageries. Their results show that linear methods run faster than non-linear but they provide images with relatively lower qualities as some demerits. Dutra da Silval R. et al. [7] in the course of achieving the goal used Wavelet transforms with two levels of decomposition for reducing the image. Antonio P. et al. [8] describe sequences of extended morphological transformations for filtering of high-dimensional remotely sensed hyper spectral datasets. Their approach is based on the concepts of mathematical morphology.

International Research Journal of Computer Science (IRJCS) ISSN: 2393-9842 Issue 12, Volume 2 (December 2015) www.irjcs.com
______________________________________________________________________________________________________ IRJCS : Impact Factor Value - Scientific Journal High Impact Factor value for 2014= 2.023
© 2014-15, IRJCS- All Rights Reserved Page -18
They revealed that, by designing morphological filters that take into account the complementary nature of spatial and spectral information, it is possible to achieve a good result. Considering the fact that each method suits some peculiar tasks, discrete wavelet transform for the dimensionality reduction of the HRSI is used in this work. It successfully reduces the imagery to a much lighter dimension while retaining the needed cadastral features for further analysis.
III. MATHEMATICAL BACKGROUND Wavelet analysis has opened up many new information processing methods in HRSI. Wavelet is a mathematical function used to divide a given function or continuous-time signal into different scale components. A frequency range is assigned to each scale component. Each scale component is studied with a resolution that matches its scale. Thus the Wavelet is a multi-resolution representation function. Wavelet transform is the discrete sampling of the wavelets [9]. There are several choices of Wavelets including the Morlet wavelet, Daubechet wavelet, Har wavelet, et al. There are also variations as contained in [10]. If the image data is further transformed before encoding, then the compression scheme is called a Transform coding scheme. Commonly known examples are the DCT and the DWT. There are several reasons why it is better to encode the image in a transform-domain rather than directly in its spatial representation. First, the transformation de-correlates the image data and thus reduces inherent redundancy. Second, the representation in the transform domain is more closely related to the Human Visual System, HVS, perception structure [11] which gives it a natural sense. In this research we employed the DWT to dimensionally reduce the satellite imagery. The aim is to do space frequency localization for the imagery. DWT syntax: Single-level discrete 2-D wavelet transform:
[cA,cH,cV,cD] = dwt2(X,‘wname’) [cA,cH,cV,cD] = dwt2(X,Lo_D,Hi_D)
The dwt2 command performs single-level 2D wavelet decomposition with respect to either a particular wavelet or wavelet decomposition filters (Lo_D and Hi_D). [cA, cH, cV, cD] = dwt2(X, ‘wname’) computes the approximation coefficients matrix cA and details coefficients matrices cH, cV, and cD (horizontal, vertical, and diagonal), obtained by wavelet decomposition of the input matrix X. The ‘wname’ string contains the wavelet name. [cA, cH, cV, cD] = dwt2(X, Lo_D, Hi_D) computes the 2D wavelet decomposition, based on wavelet decomposition filters that are specified, where Lo_D is the decomposition low-pass filter and Hi_D is the decomposition high-pass filter. Lo_D and Hi_D must have the same lengths. We employed the Dyadic partitioning technique as shown at Fig.3.1.
LL3 HL3
LH3 HH3
Fig. 3.1 Three levels decomposition showing the 10 sub bands of DWT
Fig.3.2 Cascaded analysis filter bank showing wavelet decomposition of an image
HL1
HH1 LH1
HL2
HH2 LH2
2
2
2
2
nh
nh
2
2
mh
mh
mh
mh , ,j m nW
, ,D
j m nW
, ,V
j m nW
, ,H
j m nW 1, ,j m nW

International Research Journal of Computer Science (IRJCS) ISSN: 2393-9842 Issue 12, Volume 2 (December 2015) www.irjcs.com
______________________________________________________________________________________________________ IRJCS : Impact Factor Value - Scientific Journal High Impact Factor value for 2014= 2.023
© 2014-15, IRJCS- All Rights Reserved Page -19
Where h and h are the high pass (wavelet filter) and low pass filters (scaling filter); j+1 and j are scales, m, and n are the
rows and columns indices. 1, ,j m nW is the original image and is the approximate image obtained along
LL portion of the image. , , and are the detailed images along the diagonal, vertical and horizontal directions.
IV. IMPLEMENTATION
Satellite Imagery Dataset: The remote sensing image used in this study is a Quick Bird high resolution Satellite imagery with a 2.4m resolution, over a relatively flat landscape in Changsha city, Hunan province, China. This, imagery, 593X533, has a total number of pixel vectors, N, 316069. It is composed of a residential matrix textured with farmland patches of varying sizes and shapes which are excellent features with cadastral values. The three land-use classes dominating the scene are residential, agriculture and commercial. In this work, 2D DWT is used to reduce the imagery data, Fig. 4.2 to certain reasonable dimension at the same time retaining the relevant features needed for further image feature analysis. For more details refer to Fig.3.1 and Fig.3.2 which show how DWT decomposes the high resolution satellite imagery into sub-resolutions for better analysis.
Fig. 4.1 Rectified satellite imagery Fig 4.2 Gray scale Imagery of the Image
The HRSI contains cadastral features that are supposed to be extracted and analyzed. The following are the implementation steps
1: Replace each image column with its 1D DWT. 2: Replace each image row with its 1D DWT. 3: Repeat steps (1) and (2) on the lowest sub band to create the next scale. 4: Repeat step (3) until the desired number of scales has been created.
Using the three levels discrete wavelet transform, the input 2D signal, image, is decomposed into two frequency coefficients, the approximation coefficients as the low frequency part and the detail coefficients as the high frequency part. This is called wavelet decomposition. With higher level decompositions, multi resolution representation of the image is achieved. Conceptually, Fig.5.1 shows the wavelet decomposition of the satellite imagery. The other images, are the decompositions at higher levels from the satellite images as we can see visually. Fig.4.3 shows the flowchart of the whole process using discrete wavelet transform.
, ,j m nW
, ,D
j m nW , ,V
j m nW , ,H
j m nW

International Research Journal of Computer Science (IRJCS) ISSN: 2393-9842 Issue 12, Volume 2 (December 2015) www.irjcs.com
______________________________________________________________________________________________________ IRJCS : Impact Factor Value - Scientific Journal High Impact Factor value for 2014= 2.023
© 2014-15, IRJCS- All Rights Reserved Page -20
Fig.4.3 Flowchart of imagery dimensionality reduction using discrete wavelet transform
The wavelets decomposition provides the important information from the original data used for feature extraction and general image analysis. The data set, feature vectors, obtained by using DWT is processed. Practically Fig.5.1 shows the output of the HRSI having been processed with DWT.
V. PRACTICAL RESULTS/ OUTPUT
Fig.5.1 DWT decomposed Satellite Imagery
VI. DISCUSSIONS Wavelets provide a framework of multi resolution representation of the Satellite imagery. One desirable
characteristics of the wavelet transform is that the coefficients are nearly uncorrelated [13], i.e. the wavelet transformed image covariance matrix has off-diagonal terms nearly zero. Thus the wavelet coefficients are more effective than the original data as features. For each pixel in the sub images a feature vector can be constructed for further analysis. However, as we used down sampled sub bands in DWT, we are associated with certain disadvantages as highlighted by [11] as follows: Firstly, for each frequency level the decomposition contains typically 3 sub bands, representing the horizontal, vertical and diagonal details.
Dimentionality Reduction using DWT
5 10 15 20 25
5
10
15
20
25
End image
Decompose the imagery by 2D-DWT, i+1 level (i= 0, 1, 2)
Normalize the data
Store the local feature values in a vector form [1xb]
Input image (N, N)
Stop

International Research Journal of Computer Science (IRJCS) ISSN: 2393-9842 Issue 12, Volume 2 (December 2015) www.irjcs.com
______________________________________________________________________________________________________ IRJCS : Impact Factor Value - Scientific Journal High Impact Factor value for 2014= 2.023
© 2014-15, IRJCS- All Rights Reserved Page -21
This limitation to just three orientations is necessary to avoid any data redundancy. The diagonal sub band contains both 45°and 135° directions. Consequently, as a demerit, these two orientations cannot be distinguished. Thus, an introduced distortion can either be oriented like the original signal or to its perpendicular. Secondly, the horizontal and vertical sub bands might encroach into the diagonal sub band. Depending on how broad the 1D-filters are in horizontal and vertical directions, the energy of the diagonal sub band can end up partially in the horizontal and vertical sub bands.
VII. CONCLUSION
Satellite imagery being naturally rich in information, information extraction is needed for the various applications including our task, as it is not suitable to be utilized in raw form because of the huge redundant information embedded therein. Therefore, image dimensionality reduction is necessary in order to remove the unwanted information for further processing with less computational fatigue. Hence the HRSI used in this paper is prepared for the effective and efficient extraction of the cadastral features therein.
ACKNOWLEDGEMENT
The authors express gratitude to Kano University of Science and Technology, KUST, Wudil, Mrs. Aishat Ayuba and Mrs. Asiya Isa Muhd for their unalloyed technical and nontechnical supports.
REFERENCES [1]. J.D. Ondulo and W.Kalande, High Spatial Resolution Satellite Imagery for PID Improvement in Kenya, Shaping the
Change. International Federation of Surveyors, FIG, Congress, 2006, 23. .[2] B. Usman, Design and Implementation of Systems for the Management of Land Related Information. M.Sc. Thesis,
Central South University, Changsha, Hunan, China, 2002. [3] H. Du, H. Qi, X. Wang, R. Ramanath, E. S. Wesley, Band Selection using Independent Component Analysis for Hyper
Spectral Image Processing. Proc. of 32nd Applied Imagery Pattern Recognition Workshop, 2003:93 ~ 98 [4] S.R. Patil, M.B. Sanjaypande, Dimensionality Reduction of Satellite images using Principal Component analysis.
International Journal of Communication Engineering Applications, IJCEA, 2011, 2(4). [5] R.C. Gonzalez, R.E. Woods, Digital Image Processing. Third Edition, 2010.1 [6] L. Journaux, I. Foucherot, P. Gouton, Operational Comparison of Dimensionality Reduction Techniques applied on
Multispectral Satellite Images. Mercu Buana University Research, Proceeding, Journal and Article, June 2010: 476 ~ 484. [7] R. Dutra da Silva, W. R. Schwartz, H. Pedrini, Image Segmentation based on wavelet feature descriptor and
dimensionality reduction applied to remote sensing. Chilean Journal of Statistics, September 2011, 2(2):51~60. [8] A. Plaza,P. Martínez, J. Plaza, R. Pérez, Dimensionality Reduction and Classification of Hyperspectral Image Data using
Sequences of Extended Morphological Transformations. IEEE transactions on Geoscience and Remote Sensing, 2005, 43(3).
[9] I.P. Williamson, The Justification of Cadastral Systems in Developing Countries.Canadian Institute of Geomatics, Geomatica, 1997, 51(1):21~36.
[10] G. Inoussa, H. Peng, Z. C. Ye, U. Babawuro, S. Umaru, Local Polynomial Wavelet Neural Network with a Nonlinear Structured Parameter Optimization Method. Accepted for publication, 2012.
[11] M. Nadenau, Integration of Human Color Vision Models into High Quality Image Compression. Ph.D. Thesis, Ecole Polytechnique, F´Ed´Erale De Lausanne, 2000.
[12] U. Babawuro, Z. Beiji, X. Bing, High Resolution Satellite Imagery Rectification using Bi-linear Interpolation Method for Geometric Data Extraction. ISDEA2012 Second International Conference on Intelligent System Design and Engineering Application, 2012:1430~1434.
[13] C. H. Chen, Transform Methods for Remote Sensing Environmental Monitoring, from IEEE Xplore, 2008.

AM PUBLICATIONS© (2014-15) Plot-9, Varuna Golden Enclave,
Opp-Anand Electronics, Near OLD BUS Stand
HOSUR – 635109 Tamil Nadu, INDIA
www.irjcs.com Email: [email protected]
Phone: 07402613921