Embed Size (px)
Citation preview

International Journal of Fatigue 55 (2013) 245–256
Contents lists available at SciVerse ScienceDirect
International Journal of Fatigue
journal homepage: www.elsevier .com/locate / i j fa t igue
Effect of quality control parameter variations on the fatigue performanceof ultrasonic impact treated welds
0142-1123/$ - see front matter � 2013 Elsevier Ltd. All rights reserved.http://dx.doi.org/10.1016/j.ijfatigue.2013.06.023
⇑ Corresponding author. Address: Department of Civil and Environmental Engi-neering, University of Waterloo, 200 University Avenue West, Waterloo, OntarioN2L 3G1, Canada. Tel.: +1 (519) 888 4567x38066; fax: +1 (519) 888 4349.
E-mail address: [email protected] (S. Walbridge).
Rana Tehrani Yekta, Kasra Ghahremani, Scott Walbridge ⇑Department of Civil and Environmental Engineering, University of Waterloo, Canada
a r t i c l e i n f o
Article history:Received 25 April 2013Received in revised form 11 June 2013Accepted 21 June 2013Available online 9 July 2013
Keywords:Ultrasonic impact treatment (UIT)Quality controlStructural steel weldsCompressive under-loadsFracture mechanics
a b s t r a c t
Fatigue tests were conducted of steel non-load carrying filet welded attachments subjected to ultrasonicimpact treatment (UIT) at various levels simulating proper, under-, and over-treatment. Two loading his-tories were investigated: one constant amplitude and one with high compressive under-load cycles. Localproperties were measured, finite element (FE) analyses were performed to obtain stress concentrationfactor (SCF) distributions for the measured weld toe geometries, and a fracture mechanics model was val-idated and used to investigate the effects of the local property variations on the fatigue life. UIT signifi-cantly improved the fatigue lives of the welded specimens in all cases. A strong correlation was seenbetween the measured indent depth and the local residual stresses and microhardness. The fracturemechanics analysis predicts the fatigue performance of the specimens and finds it to be most sensitiveto variations in the residual stresses and initial defect depth.
� 2013 Elsevier Ltd. All rights reserved.
1. Introduction
Residual stress-based post-weld treatments (PWTs) can be aneffective means of improving the fatigue performance of weldedstructures. With these treatments, the objective is to introduce com-pressive residual stresses by plastically deforming the weld toe, inorder to slow or stop the propagation of fatigue cracks. Needle andhammer peening are well studied and established examples of resid-ual stress-based PWTs. Their effectiveness for increasing fatigue lifehas been demonstrated in numerous studies (e.g. [1–3]). Modelshave been developed for predicting their effect on fatigue perfor-mance (e.g. [2,3]). Methods for proper execution and quality controlare described and the resulting fatigue life increase is recognized inseveral recommendations and codes (e.g. [4–6]).
Ultrasonic impact treatment (UIT) is a relatively new residualstress-based PWT, which has received considerable attention overthe last decade. As discussed in [7], UIT was first developed in the for-mer Soviet Union. UIT is similar to needle or hammer peening inmany respects. An important difference is that rather than using apneumatic tool, which causes needles or a single hammer-like rodto impact the weld surface at a frequency of 25–100 Hz, with UIT,the weld is impacted by a small number of rods vibrating at a higherfrequency on the order of 18,000–27,000 Hz. UIT offers a number ofadvantages over conventional peening. First and foremost, it is a
much quieter device, which vibrates at a lower intensity, so that anoperator can use it for longer periods of time before tiring.
Numerous experimental studies of UIT have been reported re-cently in the literature. Tests of fatigue details on large-scale girderspecimens are reported in [7,8]. Based on the results of these tests,it is proposed that the detail category (according to [9]) for certainUIT treated details be increased by one level (i.e. Det. Cat. ‘C’ up to‘B’ for transverse stiffener welds). Testing on UIT for application tohigh strength steel structures is summarized in: [10]. These studieshave generally focused on constant amplitude, tension-only load-ing. Recent efforts to study the effectiveness of UIT under variableamplitude (VA) loading conditions are discussed in [11–13]. Effortsto study to the application of UIT applied under load, e.g. when ret-rofitting civil structures in-service, are discussed in [14].
The AASHTO Bridge Construction Specification [15] was re-cently updated with new clauses regarding the use of UIT onbridges, based on the research summarized in [7,8]. This standardrecommends ‘‘as a guide, not a requirement’’ a final indent depthdue to UIT falling within the range of 0.25–0.5 mm. An ideal notchradius of 3 mm is recommended. Additional guidelines concerningUIT application and qualitative quality control procedures are alsoprovided in this reference.
Efforts are underway to consolidate the research conducted todate on UIT by various research groups. For design of welds treatedby UIT (or ‘‘high frequency mechanical impact’’), 228 data points(under constant amplitude, tension only loading) are used in [16]to develop strength improvement factors that account for the in-creased benefit of the treatment when applied to higher strengthsteels. A similar approach is used in [17] to evaluate various ‘‘local
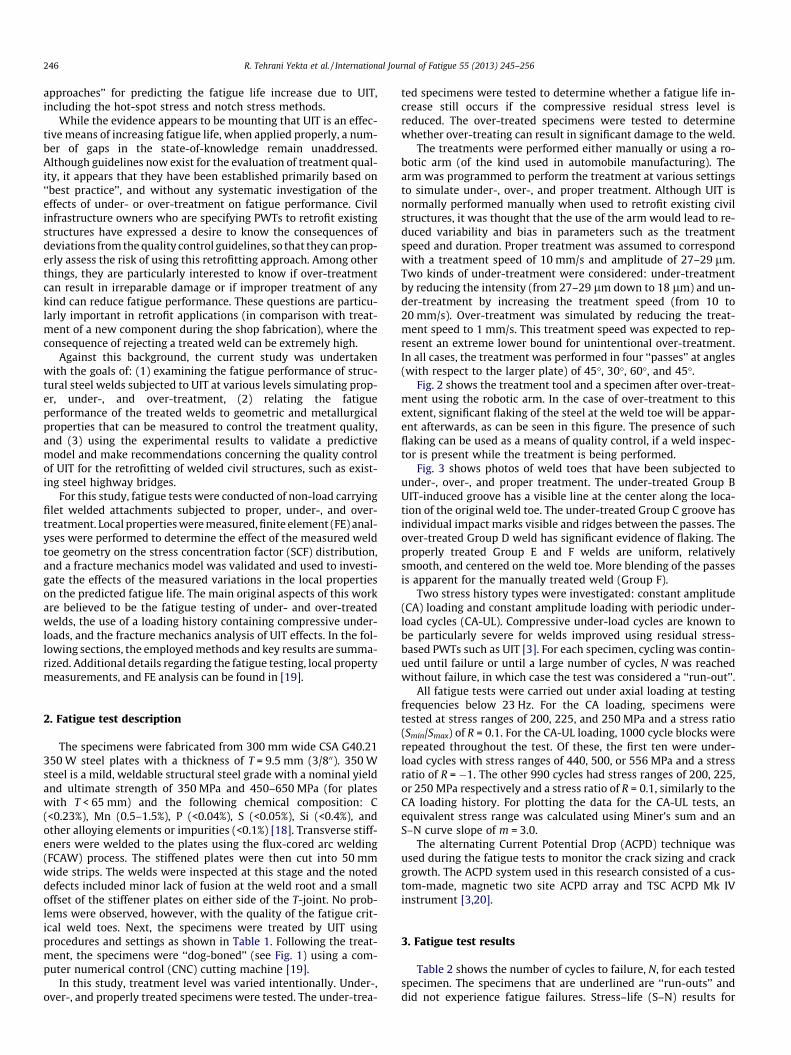
246 R. Tehrani Yekta et al. / International Journal of Fatigue 55 (2013) 245–256
approaches’’ for predicting the fatigue life increase due to UIT,including the hot-spot stress and notch stress methods.
While the evidence appears to be mounting that UIT is an effec-tive means of increasing fatigue life, when applied properly, a num-ber of gaps in the state-of-knowledge remain unaddressed.Although guidelines now exist for the evaluation of treatment qual-ity, it appears that they have been established primarily based on‘‘best practice’’, and without any systematic investigation of theeffects of under- or over-treatment on fatigue performance. Civilinfrastructure owners who are specifying PWTs to retrofit existingstructures have expressed a desire to know the consequences ofdeviations from the quality control guidelines, so that they can prop-erly assess the risk of using this retrofitting approach. Among otherthings, they are particularly interested to know if over-treatmentcan result in irreparable damage or if improper treatment of anykind can reduce fatigue performance. These questions are particu-larly important in retrofit applications (in comparison with treat-ment of a new component during the shop fabrication), where theconsequence of rejecting a treated weld can be extremely high.
Against this background, the current study was undertakenwith the goals of: (1) examining the fatigue performance of struc-tural steel welds subjected to UIT at various levels simulating prop-er, under-, and over-treatment, (2) relating the fatigueperformance of the treated welds to geometric and metallurgicalproperties that can be measured to control the treatment quality,and (3) using the experimental results to validate a predictivemodel and make recommendations concerning the quality controlof UIT for the retrofitting of welded civil structures, such as exist-ing steel highway bridges.
For this study, fatigue tests were conducted of non-load carryingfilet welded attachments subjected to proper, under-, and over-treatment. Local properties were measured, finite element (FE) anal-yses were performed to determine the effect of the measured weldtoe geometry on the stress concentration factor (SCF) distribution,and a fracture mechanics model was validated and used to investi-gate the effects of the measured variations in the local propertieson the predicted fatigue life. The main original aspects of this workare believed to be the fatigue testing of under- and over-treatedwelds, the use of a loading history containing compressive under-loads, and the fracture mechanics analysis of UIT effects. In the fol-lowing sections, the employed methods and key results are summa-rized. Additional details regarding the fatigue testing, local propertymeasurements, and FE analysis can be found in [19].
2. Fatigue test description
The specimens were fabricated from 300 mm wide CSA G40.21350 W steel plates with a thickness of T = 9.5 mm (3/800). 350 Wsteel is a mild, weldable structural steel grade with a nominal yieldand ultimate strength of 350 MPa and 450–650 MPa (for plateswith T < 65 mm) and the following chemical composition: C(<0.23%), Mn (0.5–1.5%), P (<0.04%), S (<0.05%), Si (<0.4%), andother alloying elements or impurities (<0.1%) [18]. Transverse stiff-eners were welded to the plates using the flux-cored arc welding(FCAW) process. The stiffened plates were then cut into 50 mmwide strips. The welds were inspected at this stage and the noteddefects included minor lack of fusion at the weld root and a smalloffset of the stiffener plates on either side of the T-joint. No prob-lems were observed, however, with the quality of the fatigue crit-ical weld toes. Next, the specimens were treated by UIT usingprocedures and settings as shown in Table 1. Following the treat-ment, the specimens were ‘‘dog-boned’’ (see Fig. 1) using a com-puter numerical control (CNC) cutting machine [19].
In this study, treatment level was varied intentionally. Under-,over-, and properly treated specimens were tested. The under-trea-
ted specimens were tested to determine whether a fatigue life in-crease still occurs if the compressive residual stress level isreduced. The over-treated specimens were tested to determinewhether over-treating can result in significant damage to the weld.
The treatments were performed either manually or using a ro-botic arm (of the kind used in automobile manufacturing). Thearm was programmed to perform the treatment at various settingsto simulate under-, over-, and proper treatment. Although UIT isnormally performed manually when used to retrofit existing civilstructures, it was thought that the use of the arm would lead to re-duced variability and bias in parameters such as the treatmentspeed and duration. Proper treatment was assumed to correspondwith a treatment speed of 10 mm/s and amplitude of 27–29 lm.Two kinds of under-treatment were considered: under-treatmentby reducing the intensity (from 27–29 lm down to 18 lm) and un-der-treatment by increasing the treatment speed (from 10 to20 mm/s). Over-treatment was simulated by reducing the treat-ment speed to 1 mm/s. This treatment speed was expected to rep-resent an extreme lower bound for unintentional over-treatment.In all cases, the treatment was performed in four ‘‘passes’’ at angles(with respect to the larger plate) of 45�, 30�, 60�, and 45�.
Fig. 2 shows the treatment tool and a specimen after over-treat-ment using the robotic arm. In the case of over-treatment to thisextent, significant flaking of the steel at the weld toe will be appar-ent afterwards, as can be seen in this figure. The presence of suchflaking can be used as a means of quality control, if a weld inspec-tor is present while the treatment is being performed.
Fig. 3 shows photos of weld toes that have been subjected tounder-, over-, and proper treatment. The under-treated Group BUIT-induced groove has a visible line at the center along the loca-tion of the original weld toe. The under-treated Group C groove hasindividual impact marks visible and ridges between the passes. Theover-treated Group D weld has significant evidence of flaking. Theproperly treated Group E and F welds are uniform, relativelysmooth, and centered on the weld toe. More blending of the passesis apparent for the manually treated weld (Group F).
Two stress history types were investigated: constant amplitude(CA) loading and constant amplitude loading with periodic under-load cycles (CA-UL). Compressive under-load cycles are known tobe particularly severe for welds improved using residual stress-based PWTs such as UIT [3]. For each specimen, cycling was contin-ued until failure or until a large number of cycles, N was reachedwithout failure, in which case the test was considered a ‘‘run-out’’.
All fatigue tests were carried out under axial loading at testingfrequencies below 23 Hz. For the CA loading, specimens weretested at stress ranges of 200, 225, and 250 MPa and a stress ratio(Smin/Smax) of R = 0.1. For the CA-UL loading, 1000 cycle blocks wererepeated throughout the test. Of these, the first ten were under-load cycles with stress ranges of 440, 500, or 556 MPa and a stressratio of R = �1. The other 990 cycles had stress ranges of 200, 225,or 250 MPa respectively and a stress ratio of R = 0.1, similarly to theCA loading history. For plotting the data for the CA-UL tests, anequivalent stress range was calculated using Miner’s sum and anS–N curve slope of m = 3.0.
The alternating Current Potential Drop (ACPD) technique wasused during the fatigue tests to monitor the crack sizing and crackgrowth. The ACPD system used in this research consisted of a cus-tom-made, magnetic two site ACPD array and TSC ACPD Mk IVinstrument [3,20].
3. Fatigue test results
Table 2 shows the number of cycles to failure, N, for each testedspecimen. The specimens that are underlined are ‘‘run-outs’’ anddid not experience fatigue failures. Stress–life (S–N) results for

Table 1Test matrix and specimen ID key.
Group Treatment Method Loading DS (MPa)a
200 225 250
A As-received (untreated) – CA A1 A2 A3CA-UL A4 A5 A6
B Under-treated (reduced intensity) Robotic CA B1 B2 B3CA-UL B4 B5 B6
C Under-treated (increased speed) Robotic CA C1 C2 C3CA-UL C4 C5 C6
D Over-treated Robotic CA D1 D2 D3CA-UL D4 D5 D6
E Properly treated Robotic CA E1 E2 E3CA-UL E4 E5 E6
F Properly treated Manual CA F1 F2 F3CA-UL F4 F5 F6
a Exact equivalent stress ranges for CA-UL tests = 206, 232, 258 MPa.
Fig. 1. Specimen geometry.
Fig. 2. Ultrasonic impact treatment.
R. Tehrani Yekta et al. / International Journal of Fatigue 55 (2013) 245–256 247

(a) Under-treated weld toe (Group B)(a) Under treated weld toe (Group B).
(b) Under-treated weld toe (Group C).
(c) Over-treated weld toe (Group D)(c) Over treated weld toe (Group D).
(d) Properly treated weld toe (Group E).
(e) Properly treated weld toe (Group F).
Fig. 3. Weld toes after proper, under-, and over-treatment.
248 R. Tehrani Yekta et al. / International Journal of Fatigue 55 (2013) 245–256
the various specimen groups are plotted in Fig. 4. In this figure, theuntreated specimens under CA and CA-UL loading are indicatedwith black and grey hollow symbols, respectively. The treatedspecimens under CA loading and CA-UL are shown with filled blackand grey symbols.
Fig. 4(a) shows the S–N data for Groups A, E, and F (as-receivedand properly treated specimens). The AASHTO/CSA Detail Category‘C’ design curve in this figure corresponds with a 97.7% survivalprobability [9,21]. It can be observed that all of the data pointsare above this curve. The fatigue lives of the as-received Group Aspecimens are closer to the Detail Category ‘C’ curve, whereasthe fatigue lives of the Group E and F specimens (proper roboticand manual treatment) are shifted considerably to the right. Theresults from Group E and F fall more-or-less on top of each other,suggesting that there is little difference between these groups fromthe point of view of fatigue performance.
Table 2Fatigue test results.
Specimen N Specimen N Specimen N
A1 248,383 B1 2,099,320 C1 1,537,837A2 166,821 B2 3,510,188 C2 8,210,202A3 105,487 B3 1,773,851 C3 3,031,499A4 202,874 B4 3,667,264 C4 3,564,413A5 185,887 B5 4,159,128 C5 4,796,216A6 94,746 B6 816,298 C6 460,835D1 3,436,785 E1 3,021,835 F1 7,692,074D2 1,932,685 E2 2,244,137 F2 4,207,209D3 450,647 E3 2,753,812 F3 1,175,500D4 2,649,012 E4 8,873,089 F4 3,141,363D5 876,309 E5 2,064,805 F5 1,938,919D6 485,965 E6 533,901 F6 561,878
Note: underline = run-out.
Fig. 4(b) shows the S–N data for Groups B, C, and D. For clarity,the data sets for Groups A and E/F have been replaced with curvescorresponding with 50% and 95% survival probabilities. Thesecurves were established using the methodology described in [22],which assumes that the data set follows a Gaussian log-normal dis-tribution. The positions of these curves are then established using aregression model where log(N) is the dependent variable. Accord-ing to [22], 10 or more data points should be used, if possible. Sincethe experimental program considered many variables and thus hadonly a few repetitions for each combination of variables, data setswere grouped together to increase the sample size, where possible.The statistical analysis for Group A therefore included the datapoints for CA and CA-UL loading, and the analysis for ‘‘properlytreated welds’’ included all data points from Groups E and F. Inthe statistical analysis, the S–N curve slope, m, was allowed to varyand run-out points were not included. As discussed in [19], the useof a fixed m or inclusion of the run-outs had little effect on the gen-eral trends observed by comparing the survival probability curves.
In Fig. 4(b), it can be seen that a significant fatigue life increaseresults from the UIT application, even for the under- and over-treated specimens. Looking at this figure, it is difficult to assessvisually whether the treatment level has a significant effect onthe fatigue performance.
In order to investigate this question further, survival probabilitycurves were established for two more data sets. The first was for alltreated specimens in Groups B, C, D, E, and F. The curves for thisdata set were thought to represent survival probabilities of weldssubjected to an unknown (or uncontrolled) treatment level. Thesecond was for Groups B, C, and D, or in other words for the spec-imens that were intentionally under- or over-treated. These curvesare plotted in Fig. 5(a) and defined in Table 3 where, m is the S–Ncurve slope and LOG(M) defines the vertical position, i.e.:
LOGðMÞ ¼ m � LOGðDSÞ þ LOGðNÞ ð1Þ
In Fig. 5(a), it can be seen that the curve ranking for either the50% or 95% survival probability is the same: the highest curve isfor the properly treated specimens (Groups E and F), the lowestis for the intentionally under- or over-treated specimens (GroupsB–D), and the curves for an unknown (or uncontrolled) treatmentlevel fall in between. Notably, the spread between the curves forthe treated specimens is small compared to the shift in the curveposition due to treatment at any level. In [17], test results for weldssubjected to UIT from a number of studies are analyzed and an S–Ncurve with a slope of m = 5.0 is recommended. In Table 3, it can beseen that the calculated S–N curves have this slope exactly whenall of the test results for the treated welds from the current studyare included. When only the properly treated welds are considered,the slope is somewhat flatter (m = 6.41).
Based on these observations, it can be concluded that qualitycontrol and treatment in accordance with the current ‘‘best prac-tice’’-based guidelines results in a higher fatigue performance.However, the treatment process is fairly robust in the sense thatunder- or over-treating within the investigated range of treatmentparameter variations still results in a significant fatigue lifeincrease.
Clearly, there would be value in conducting additional tests toincrease the sample size for each combination of test parameters.In addition, some caution should be exercised in drawing definitiveconclusions by comparing the curves for the treated welds inFig. 5(a), since one parameter that could not be easily isolatedwas the effect of manual versus robotic treatment. The manual re-sults are weighted more heavily in the statistical analysis of theproperly treated welds (Groups E and F). It is possible that the re-sults could therefore be biased, if the manual treatment was signif-icantly more effective than the robotic treatment. There is astrong possibility that this is the case, since one of the suspected

Fig. 4. Fatigue test results.
Fig. 5. Analysis of fatigue test results.
Table 3Statistical analysis of test results.
Group m Mean (50%) Design (95%)
LOG (M) DS(2 � 106) LOG (M) DS(2 � 106)
A 3.54 13.54 111.08 13.36 99.32B/C/D 4.63 17.11 217.16 16.42 153.56B/C/D/E/F 5.00 18.04 222.02 17.45 169.80E/F 6.41 21.43 229.88 20.83 185.31
R. Tehrani Yekta et al. / International Journal of Fatigue 55 (2013) 245–256 249
advantages of the manual treatment is that the human operator isbetter able to adjust to irregularities in the weld profile. It shouldbe recalled, however, that the reason for using the robotic arm totreat the specimens was not to improve the level of treatmentquality, but rather to reduce the bias when comparing the weldssubjected to proper, over-, and under-treatment.
Based on a previous study on needle peened welds [3], the CA-UL loading history was thought to be a particularly severe one forresidual stress-based post-weld treatments since, under certaincircumstances, compressive under-loads can reduce crack closureand cause compressive residual stresses to relax due to nonlinearmaterial effects. Fig. 5(b) shows a comparison of the S–N resultsfor all of the treated specimens, which allows the results for thetwo investigated loading histories to be easily distinguished. Look-ing at this figure, it can be seen that the fatigue performance of the
treated welds under CA-UL loading was systematically on the low-er end at the highest stress range tested (DS � 250 MPa). As thestress range decreases, however, this difference decreases, and atthe lowest stress level (DS � 200 MPa), there is no discernable dif-ference between the results for CA and CA-UL loading. One possibleexplanation for this observed trend is that the scatter in the test re-sults is expected to increase as the fatigue limit is approached, so itis possible that with the limited number of tests, the under-load ef-fects are masked by the scatter in the test results at the lowerstress ranges. Further testing would be needed, however, to con-firm this hypothesis.
Fig. 6 shows example crack growth curves, obtained using theACPD technique, for Specimens A6 (as-received) and F6 (proper,manual treatment). These are for the average of the two probe val-ues at the critical weld toe. The probes were 10 mm apart and cen-tered on the specimen [3]. As observed in [3], the effect of thetreatment appears to be a crack growth rate reduction at the shal-low depths (less than �0.3 mm). At greater depths, the growthrates are similar for both specimens.
4. Local geometric and metallurgical properties
Weld toe geometry measurements such as the toe angle and ra-dius before and after UIT application were obtained for each spec-

Fig. 6. Crack growth curves for Specimens A6 and F6.Fig. 7. Indent depth measurements.
250 R. Tehrani Yekta et al. / International Journal of Fatigue 55 (2013) 245–256
imen. Sliced silicon weld toe impressions, taken before fatigue test-ing, were placed under a low power microscope, and photo-graphed. Measurements of the geometric parameters were thenmade using AutoCAD. With the exception of the properly treated(Group E and F) weld toes, it was often difficult to define a singletoe radius due to the irregular shape of the weld toe. The radiusof the greatest indent depth on the base metal side was thereforerecorded when multiple radii were present. The indent depth mea-surements were taken with respect to a best fit line along the basemetal surface. This depth is similar to the one that weld inspectorsmeasure to check for undercuts, when assessing weld quality. Inaddition, a best fit line was drawn along the surface of the weld,and a second indent depth was measured perpendicular to thisline. The toe radius and indent depth measurements, obtained inthis manner, are summarized in Table 4.
In Fig. 7, three ways of quantifying indent depth are compared:(1) indent depth from the base metal side only, (2) the average ofthe base metal and weld side indent depths, and (3) the maximumof these two depths. The rectangular region in Fig. 7 denotes thetarget indent depth range for recommended in [15]. It should benoted that in [15] only measurements of the base metal indentdepth are discussed. In general, it was observed that for the robotictreatment, the tool was directed to a much higher degree towardsthe weld, rather than the base metal. Hence, the base metal indentdepths were lower than expected for the robotically treatedgroups. However, the manually treated specimens in Group F allfall within or close to the target range. Using the average indentdepth, based on measurements of a weld toe impression, it is easierto identify that the specimens in Group D are over-treated. On theother hand, while the average indent depths for the undertreatedspecimens fall below those for the specimens subjected to properrobotic treatment, the indent depths for the robotically undertreat-
Table 4Weld toe geometry measurements.
Group (mm) Radius Indent depth (base metal
�x (mm) s (mm) �x (mm) s (mm)
B 1.76 0.36 0.16 0.04C 2.09 0.18 0.16 0.06D 1.17 1.09 0.17 0.15E 1.69 0.27 0.36 0.40F 2.37 0.11 0.27 0.07
Note: �x = mean, s = standard deviation.
ed specimens are similar to those for the specimens subjected toproper manual treatment. A similar trend is seen in the maximumindent depth results. Interestingly, the scatter in the various met-rics is much smaller for the manually treated welds (Group F). Thisappears to support the hypothesis that it is easier to adjust forirregularities in the weld profile with manual treatment.
Vickers microhardness measurements were made in accor-dance with [23], using specimens cut and polished after fatiguetesting. Eleven indentations were made along the expected crackpath, starting at depth, b = 0.1 mm below the surface and thenevery 0.2 mm up to b = 2.1 mm. This process was repeated threetimes for each group. The resulting envelopes are presented inFig. 8.
The measurements for the untreated group (Group A) were uni-form with respect to depth below the surface and ranged from�190 to 275 HVN. The first measurement at b = 0.1 mm is normallythe highest in the treated specimens. Below this, the hardness de-creases with depth. In general, it can be seen that the surface hard-ness is greatest for the over-treated group (D), followed by theproperly treated groups (E and F). Under-treating by reducing thetreatment intensity (Group B), has little effect on the surface hard-ness. On the other hand, under-treating by increasing the treat-ment speed (Group C) does result in a decrease in the surfacehardness to a level similar to the untreated group (A).
Residual stress measurements were performed by Proto Manu-facturing, a laboratory specializing in X-ray diffraction. The resultsare summarized in Fig. 9. Measurements were taken on specimensafter testing, as well as on one untested specimen that had beenmanually treated with the other specimens in Group F, at depthsof b = 0.0, 0.15, 0.3, 0.6, and 1.2 mm. In general, the near surfacemeasurements were highly erratic [19] and did not follow anytrends of similar measurements reported by others. One possible
side) Indent depth (weld side)
Max. (mm) �x (mm) s (mm) Max. (mm)
0.19 0.51 0.28 0.790.22 0.37 0.16 0.610.39 1.10 0.27 1.431.10 0.53 0.38 0.920.37 0.25 0.14 0.51

Fig. 8. Microhardness measurements.
R. Tehrani Yekta et al. / International Journal of Fatigue 55 (2013) 245–256 251
explanation for this result is that the residual stresses relaxed orwere otherwise altered by the high applied cyclic stresses (possiblyexceeding the yield strength, ry) at the surface of the tested weldtoes. Residual stress relaxation for welds subjected to UIT followedby cyclical loading has been observed by others, as discussed in[13,24]. For this reason, the b = 0.0 and 0.15 mm measurementsin Fig. 9 are only plotted for the one specimen (F⁄) that was sub-jected to X-ray diffraction measurements without prior loading.Looking at all of the measurements for depths, b = 0.3 to 1.2 mmin Fig. 9, it can be seen that the residual stresses in the untreated(Group A) weld were slightly compressive. It is believed that thiswas likely not the case for all of the untreated welds, based on pre-vious measurements reported in [3] for the same weld procedureand specimen geometry. For the treated welds, the compressiveresidual stresses are highest in magnitude for the over-treated(Group D) specimens, followed by the properly treated (Groups Eand F) specimens. The residual stress levels for the Group B andE specimens are similar. The residual stress magnitudes are muchlower, however, for the Group C specimens, which were under-treated by increasing the treatment speed.
Several specimens of each type were sectioned, polished, andphotographed with a low power microscope, in order to observe
Fig. 9. Residual stress
the effects of UIT on the grain structure and look for surface defectsthat could serve as initiation points for fatigue cracks. Fig. 10shows example photographs taken from Specimens F2 and D2. InFig. 10(a) and (c) it can be seen that the plastically deformed grainsoccur within 0.1–0.2 mm from the weld toe surface. In Fig. 10(b)and (d), fatigue cracks growing from surface defects can be seen.In the case of Specimen F2, a large crack is seen growing from a de-fect that is around 0.15 mm in depth. In the case of Specimen D2,the defect is a much larger fold running roughly parallel to the sur-face, with a depth approaching 1.0 mm.
5. Finite element analysis
The finite element (FE) method was used to predict geometricstress concentration factors (SCFs) along the crack path for the var-ious treatment cases (disregarding residual stresses). In this con-text, the SCF is defined as the local elastic stress divided by thenominal, remotely applied stress, S. The nominal applied stress istaken as the applied load divided by the cross section area of theloaded plate. The ABAQUS CAE Version 6.11 software was used toperform the FE analysis. Sixteen specimens were chosen for mod-
measurements.

Fig. 10. Examples of weld to microstructure and surface defects.
252 R. Tehrani Yekta et al. / International Journal of Fatigue 55 (2013) 245–256
eling. To perform the FE analysis, a 2D plane strain model was cho-sen and the material properties were assumed to be homogenousand linear elastic. Nominal values of 200,000 MPa and 0.3 were as-signed as the elastic modulus (E) and Poisson’s ratio (l) respec-tively. A 1.0 mm node spacing was used in the regions of thespecimen far removed from the weld toe. At the weld toe, a muchsmaller node spacing of 0.02 mm was prescribed. The meshedmodel of Specimen F1 is shown in Fig. 11(a).
For each specimen type, three weld toe impressions were mod-eled. Sample SCF distributions are plotted in Fig. 11(b). Peak (sur-face) SCF values are given for each FE model in Table 5. The meanpeak SCF for the as-received welds was 2.99. Proper treatment re-duces the peak SCF to 2.09 (robotic, Group E) or 2.12 (manual,Group F). Under-treatment results in a similar or slightly greaterreduction in the SCF (2.02 for Group B, 2.03 for Group C), whileover-treatment results in a peak SCF that is almost as large asthe mean value for the as-received welds (2.82 for Group D).
6. Fracture mechanics analysis
While the test results appear to confirm the robustness of UITand the benefit of treatment and quality control in accordance withthe current ‘‘best practice’’-based guidelines, the small number ofsamples tested (for the number of variables studied) makes it dif-ficult to draw conclusions regarding the effects of local weld toeproperty variations on fatigue performance. For this reason, a pre-
viously-developed fracture mechanics model was validated andused to investigate these effects.
A full description of the employed strain-based fracturemechanics (SBFMs) model is given in [3]. The basis for the modelis the Paris–Erdogan crack growth law, commonly used for linearelastic fracture mechanics (LEFM) analysis, modified to considercrack closure effects and a threshold stress intensity factor (SIF)range, DKth, and integrated over a crack depth range, ai to ac:
N ¼Z ac
ai
da
C �MAX DKmeff � DKm
th;0� � ð2Þ
where C and m are material constants and DKeff is the effectivestress intensity factor range. The main difference between LEFMand SBFM is the calculation of the stress intensity factors (SIFs), K.In the latter, the following expression is used [25]:
K ¼ Y � E � e �ffiffiffiffiffiffiffiffiffiffip � ap
ð3Þ
where e is the local strain at crack depth, a, and Y is a correction fac-tor to account for the crack shape, free surface, and the finite thick-ness of the plate. For the analysis of treated welds, the SBFM modeloffers considerable advantages over LEFM in terms of its ability tomodel the evolution of the beneficial compressive residual stressesunder VA loading histories.
To calculate the stresses and strains, r and e, for each load cycle,a Ramberg–Osgood material model is used [26], which requires thecyclic material parameters: K0 and n0, i.e.:

Table 6Assumed SBFM input parameters.
Parameter Value Units Description
T 9.5 mm Nominal plate thicknessC 2.8 � 10�13 N, mm Paris law constant [3]m 3.0 – Paris law constantDKth 80.0 MPa
pmm SIF range threshold
l 0.002 – Crack closure parameter [25]ry 396.3 MPa Base metal yield strength [3]ru 574.3 MPa Base metal ultimate strength [3]E 201.6 GPa Elastic modulus [3]ac 0.5�T mm Critical crack depth
Fig. 11. FE analysis procedure and SCF distributions.
Table 5Peak stress concentration factors (SCFs).
Group As-received After treatment
Model 1 Model 2 Model 3 �x
A (A1) 2.76 – – – –B (B1) 2.73 (B1) 2.15 (B3) 1.96 (B5) 1.96 2.02C (C1) 2.37 (C1) 2.03 (C3) 1.87 (C5) 2.20 2.03D (D1) 2.67 (D1) 2.68 (D4) 2.86 (D6) 3.14 2.82E (E1) 3.49 (E1) 1.95 (E3) 2.06 (E6) 2.25 2.09F (F1) 3.89 (F1) 1.86 (F4) 2.29 (F6) 2.21 2.12
R. Tehrani Yekta et al. / International Journal of Fatigue 55 (2013) 245–256 253
De ¼ DrEþ 2 � Dr
2 � K 0� �1=n0
ð4Þ
Strain histories at various depths below the surface are deter-mined using Neuber’s rule [26]:
r � e ¼ r2el
Eð5Þ
where rel is the local elastic stress [3]. Crack closure is modeledusing formulas proposed by Newman [27]. These require as input:the maximum stress level, rmax, the stress ratio, R, the flow stress,r0 (i.e. the average of the yield and ultimate strength, ry and ru),and a plastic constraint factor, a.
As discussed in [3], the primary advantage of the employedSBFM model is its ability to predict two crack growth acceleratingmechanisms, which can be particularly severe for welds treatedwith residual stress-based PWTs, namely: (1) compressive under-loads can cause relaxation of the compressive residual stressesintroduced by the PWT if the total (applied + residual) compressivestress is sufficient to cause a nonlinear material response and (2)large compressive under-loads (or tensile over-loads) can havethe effect of reducing the crack opening stress level, and thusincreasing the effective portion of the applied stress cycle, for anumber of cycles following the extreme loading event.
Table 6 provides values for the input parameters, based on [3],which were assumed to be unaffected by the treatment and werenot varied in the sensitivity analysis. Regarding the other inputparameters required to implement the SBFM analysis, the follow-ing assumptions were made:
– In the initial validation, average SCF distributions for as-received and properly treated welds were assumed, based onthe FE results. In the sensitivity analysis, the SCF distributionwas varied from the upper bound for the over-treated weldsto the lower bound for the properly treated welds.
– In [3], the cyclic material parameters, K’ and n’ were measuredfor specimens fabricated out of the same base metal used in thecurrent study. One objective of the current study was to inves-tigate the effects of changes in the local material properties (andin particular the nonlinear material response) due to treatmentat the various levels. To do this, the local microhardness mea-surements were used to estimate K0 and n0 at each crack depth,using the following relationships from [28]:
K 0 � 1:65 � ru and n0 � 0:15 ð6Þru � 3:45 � Hardness ð7Þ
In [28], the Brinell hardness number (BHN) is used. However, this isapproximately equal to the Vickers hardness (HVN) over the rangeof interest in the current study. Similarly to the SCF, the initial mod-el validation was performed with average values assumed for as-re-ceived and properly treated welds. Linear interpolation was usedbetween measurement points.– Uniform or multi-linear residual stress distributions were
assumed in the analysis, based on a trial-and-error process.For the as-received welds, a uniform distribution with a magni-tude of zero was assumed. It is suspected that the actual distri-bution varies considerably, based on the measurementsobtained for the current study and in [3] for the same materialand specimen type. However, the overall distribution must beself-equilibrating, and the assumed distribution gives a goodprediction of the test results. The distribution assumed for theproperly treated weld is shown as a solid line in Fig. 9(b). Thisdistribution also led to close predictions of the test results. Itis more-or-less a lower bound of the measured values for prop-erly treated welds, with a distribution shape that agrees wellwith the measured distributions from other studies, where

254 R. Tehrani Yekta et al. / International Journal of Fatigue 55 (2013) 245–256
more measurements were obtained (e.g. [29]). The slope of thedistribution was established by fixing the depth at which a uni-form tensile distribution is reached at 2.0 mm, and then varyingthe magnitude of the tensile stress until a self-equilibratingstress distribution was achieved. When this distribution wasshifted to represent an average of the measurements for prop-erly treated welds, it tended to over-estimate the test results.One possible explanation for this result it that these compres-sive residual stresses also vary over a wide range, and so, fatiguefailures will be most likely to occur at locations where they arelowest in magnitude. Further investigation would be needed,however, to confirm this. To model the residual stress distribu-tions for under- and over-treated welds, the assumed distribu-tion was shifted as shown by the dashed lines in Fig. 9(b).
– For the validation, an initial defect depth, ai, of 0.15 mm wasassumed for as-received and treated welds. An initial crackshape or aspect ratio, (a/c)i, of 0.6 was then fixed and the ratio,a/c, was assumed to vary linearly between from 0.6 and to 0.0 ata crack depth of 1.0 mm, based on [3]. This depth and shapewere thought to be representative of a weld defect, whichwould not necessarily be removed by the treatment. Followingthe model validation, a sensitivity analysis was performedwhere the defect depth was varied. The goal of this analysiswas to study the effect of line defects, such as lack of fullremoval of the weld toe or surface flaking, resulting from thetreatment process itself. For this reason, a constant a/c ratio ofzero was assumed in this analysis.
The results of SBFM model validation are shown in Fig. 12. Inthis Fig. 12, it can be seen that the calculated S–N curves for theas-received welds are very close to the test data. The curve forthe CA-UL loading history falls slightly below the data, indicatingthat the SBFM model, with the values of K0 and n0 estimated basedon the local microhardness, slightly overestimates the negative ef-fect of the under-loads. A similar trend is seen when comparing themodel predictions for the properly treated welds. Based on theseresults, it was determined that the model provided reasonablygood predictions of the test data, and could therefore be used tocarry out the sensitivity analysis.
In Fig. 13, key results of this analysis are presented. Looking atFigs. 13(a)-(c), the effects of the measured variations in the localmicrohardness, SCF distribution, and residual stress distributioncan be seen and compared with the scatter observed in the testdata for the treated welds. In general, it can be seen that the effectof the hardness variations is negligible under CA loading, but muchgreater for CA-UL loading. When the upper bound of the hardnessenvelope for the over-treated welds is assumed, the predicted neg-ative effect of under-loads is reduced and appears more in line
Fig. 12. Fracture mechanics analysis results for as-received and properly treatedwelds.
with the experimental results. Varying the SCF over the investi-gated range has a larger effect on the S–N curve position. Howeverthe upper- and lower-bound curves seem plausible, given the de-gree of scatter observed in the test data. The greatest effect onthe S–N curve position is seen when the residual stresses are variedbetween the under- and over-treated distributions indicated by thedashed lines in Fig. 9(b). The resulting curves appear to signifi-cantly over-predict the degree of scatter observed in the test data.A possible explanation for this result is that there is in fact a highdegree of correlation between several of the input parameters. Inother words, the high residual stresses measured on the over-trea-ted welds cannot be achieved without also introducing a higherSCF and likely a much higher initial defect depth. Likewise, the
Fig. 13. Effect of quality control parameter variations.

Fig. 14. Effect of initial defect depth variations.
R. Tehrani Yekta et al. / International Journal of Fatigue 55 (2013) 245–256 255
SCFs are generally lower for the under-treated welds. It is also pos-sible that the higher residual stresses due to over-treatment have ahigher degree of scatter, meaning that the welds will fail at loca-tions where these stresses are lower in magnitude. The noticeablyhigher degree of scatter in the micro-hardness measurements forthe over-treated (Group D) specimens in Fig. 8 would appear tosupport this hypothesis.
In Fig. 14, the results of the initial defect depth study, for assess-ing the effects of line defects that may result from the treatmentprocess, are summarized. In this study, analyses were performedfor ai = 0.15, 0.40, 0.75, 1.25, and 2.0 mm. Looking at Fig. 14, itcan be seen that the S–N curves shift downwards as the initial de-fect depth increases. At the highest stress ranges analyzed, the re-sult is that a line defect with a depth as little as 0.4 mm can resultin a fatigue life after treatment that is no better than that of a nor-mal as-received weld. At the lower stress ranges, a fatigue life in-crease due to treatment is still seen, even with the larger defectdepths. When the defect depth reaches the depth of the compres-sive residual stress zone, however, there is a significant drop in theS–N curve, and the fatigue performance of the treated weld isworse than that of a normal as-received weld.
It should be noted that in all of the fracture mechanics analyses,it is assumed that the initial defect will be crack-like and orientedperpendicularly with respect to the loading direction. The largeflaking defects observed in the over-treated welds used in the cur-rent study (see Fig. 10), tended to be flat and oriented parallel tothe loading direction. While presumably somewhat less severe,further study would be needed to predict the effect of this defectgeometry analytically.
7. Conclusions
Based on the testing and analysis results presented herein, thefollowing conclusions are drawn:
– UIT significantly improved the fatigue lives of the weld speci-mens tested in the current study, regardless of the treatmentlevel or stress history type. Quality control and treatment inaccordance with the current guidelines results in a higher fati-gue performance. However, the treatment process is fairlyrobust in the sense that under- or over-treating within theinvestigated range of treatment parameter variations stillresults in a significant fatigue life increase.
– The current recommendations for quality control of welds trea-ted by UIT (e.g. [15]) would have likely been successful in iden-tifying the under- and over-treated weld specimens fabricated
for the current study. For identifying over-treatment, indentdepth measurements from both the weld and base metal sides,based on weld toe impressions, are recommended as a means offurther verifying treatment quality. Evidence of significant flak-ing as a result of the treatment is another practical means foridentifying over-treatment. For identifying under-treatment,indent depth measurements should be used in conjunction withinspection for traces of the original weld toe.
– Through-thickness microhardness and residual stress measure-ments are not practical for use on actual structures. However,strong correlations were seen between these parameters andthe level of treatment quality. On this basis, the use of thesemethods on sample specimens is recommended for the evalua-tion or pre-qualification of new UIT methods or procedures.
– The fracture mechanics analysis predicts the fatigue perfor-mance of the treated welds and finds it to be most sensitiveto variations in the residual stresses and initial defect depth.Microhardness and SCF variations are seen to have less of aneffect on fatigue performance.
– The possible negative effects of compressive under-loads on thefatigue performance of the treated welds are conservativelyover-predicted by the employed fracture mechanics model.
– An initial defect depth study shows that significant fatigue lifeincreases can still be achieved with a linear defect present asa result of the treatment. However, the treatment benefitdecreases with increasing defect depth, and can be completelynegated if the defect is sufficiently large.
Further testing, to increase the sample sizes and ranges of theparameter variations would be beneficial, in order to validate thefindings of this study and extend their domain of applicability(e.g. to more severe treatment defects, other weld geometries, lar-ger specimens, etc.). On the analytical side, the fracture mechanicsstudy was limited to model validation and deterministic sensitivityanalyses. A logical extension of this work would be to perform theanalysis probabilistically, so that the effects of variations in thequality control parameters on the design S–N curve can be seen.
Acknowledgements
The Ministry of Transportation of Ontario (MTO) is gratefullyacknowledged for providing financial support for this research.MTO engineers B. Tharmabala, C. Lam, and R. Mihaljevic arethanked for their technical input. Applied Ultrasonics is gratefullyacknowledged for providing specimen treatment. S. Abston at Ap-plied Ultrasonics is thanked in particular for his technical input. Atthe University of Waterloo, technical input and support was pro-vided by Prof. T. Topper, R. Morrison, D. Hirst, and R. Sluban, andassistance in the laboratory was provided by I. Chang and J.Raimbault.
References
[1] Maddox SJ. Improving the fatigue strength of welded joints by peening. MetalConstruct 1985;17:220–4.
[2] Bremen U. Amelioration du comportement à la fatigue d’assemblages soudés:étude et modelisation de l’effet de contraintes residuelles, École PolytechniqueFédérale de Lausanne thesis no. 787, 1989.
[3] Ghahremani K, Walbridge S. Fatigue testing and analysis of peened highwaybridge welds under in-service variable amplitude loading conditions. Int JFatigue 2011;33:300–12.
[4] Haagensen PJ, Maddox SJ. IIW recommendations on post weld fatigue lifeimprovement of steel and aluminium structures. Paris: International Instituteof Welding; 2011.
[5] American Welding Society (AWS). Structural welding code: AWS standardD1.1/D1.1M; 2004.
[6] Canadian Standards Association (CSA). Welded steel construction (metal arcwelding): CSA standard W59-03; 2003.
[7] Roy S, Fisher JW, Yen BT. Fatigue resistance of welded details enhanced byultrasonic impact treatment (UIT). Int J Fatigue 2003;25:1239–47.

256 R. Tehrani Yekta et al. / International Journal of Fatigue 55 (2013) 245–256
[8] Roy S. Experimental and analytical evaluation of enhancement in fatigueresistance of welded details subjected to post-weld ultrasonic impacttreatment. Doctoral thesis, Department of Civil and EnvironmentalEngineering, Lehigh University; 2006.
[9] American Association of State Highway and Transportation Officials (AASHTO).LFRD bridge design specifications, 4th ed., Washington (DC); 2008.
[10] Kuhlmann U, Durr A, Gunther H-P. Application of post-weld treatmentmethods to improve the fatigue strength of high strength steels in bridges.IABMAS-06, Porto; 2006.
[11] Huo L, Wang D, Zhang Y. Investigation of the fatigue behaviour of the weldedjoints treated by TIG dressing and ultrasonic peening under variable-amplitude load. Int J Fatigue 2005;27:95–101.
[12] Marquis G. Failure modes and fatigue strength of improved HSS welds. EngFract Mech 2010;77:2051–62.
[13] Yildirim HC, Marquis G. A round robin study of high-frequency mechanicalimpact (HFMI)-treated welded joints subjected to variable amplitude loading.Weld World 2013;57:437–47.
[14] Ummenhofer T, Weich I, Nitchke-Pagel T. Fatigue life improvement of existingsteel bridges. IABMAS-06, Porto; 2006.
[15] American Association of State Highway and Transportation Officials (AASHTO).LRFD bridge construction specifications: interim revisions. Washington (DC);2008.
[16] Yildirim HC, Marquis G. Fatigue strength improvement factors for highstrength steel welded joints treated by high frequency mechanical impact.Int J Fatigue 2012;44:168–76.
[17] Yildirim HC, Marquis G, Barsoum Z. Fatigue assessment of high frequencymechanical impact (HFMI)-improved fillet welds by local approaches. Int JFatigue 2013;52:57–67.
[18] Canadian Institute of Steel Construction (CISC). Handbook of steelconstruction, 9th ed., Toronto; 2006.
[19] Tehrani Yekta R. Acceptance criteria for ultrasonic impact treatment (UIT).M.A.Sc. Thesis, University of Waterloo; 2012.
[20] Lugg MC. TSC inspection systems; 2008.[21] Canadian Standards Association (CSA). Canadian highway bridge design code:
CAN/CSA-S6-06, 2006.[22] Hobbacher A. Recommendations for fatigue design of welded joints and
components. International Institute of Welding: Doc. XIII-1965-03/XV-1127-03; 2005.
[23] American Society for Testing and Materials (ASTM). Standard test method forknoop and vickers hardness of materials: ASTM E384-11; 2011.
[24] Weich I, Ummenhofer T, Nitschke-Pagel T, Dilger K, Eslami H. Fatiguebehaviour of welded high-strength steels after high frequency mechanicalpost-weld treatments. Weld World 2009;53:R322–32.
[25] Khalil M, Topper TH. Prediction of crack-opening stress levels for 1045 as-received steel under service loading spectra. Int J Fatigue 2003;25(2):149–57.
[26] Dowling NE. Mechanical behaviour of materials. Upper Saddle River, NewJersey: Pearson Education Inc.; 2007.
[27] Newman JC. A crack opening stress equation for fatigue crack growth. Int JFract 1994;24:R131–5.
[28] Baumel A, Seeger T. Materials data for cyclic loading – supplement 1. NewYork: Elsevier Science Publishing Company; 1990.
[29] Cheng X, Fisher JW, Prask HJ, Gnäupel-Herold T, Yen BT, Roy S.Residual stress modification by post-weld treatment and its beneficialeffect on fatigue strength of welded structures. Int J Fatigue 2003;25:1259–69.