Embed Size (px)
Citation preview

FATIGUE PERFORMANCE OF BRASS LIGHT POLE COUPLINGS
BY
JOSEPH T. RUDD
THESIS
Submitted in partial fulfillment of the requirements
for the degree of Master of Science in Civil Engineering
in the Graduate College of the
University of Illinois at Urbana-Champaign, 2010
Urbana, Illinois
Advisers:
Professor Leslie Struble
Grzegorz Banas
ii
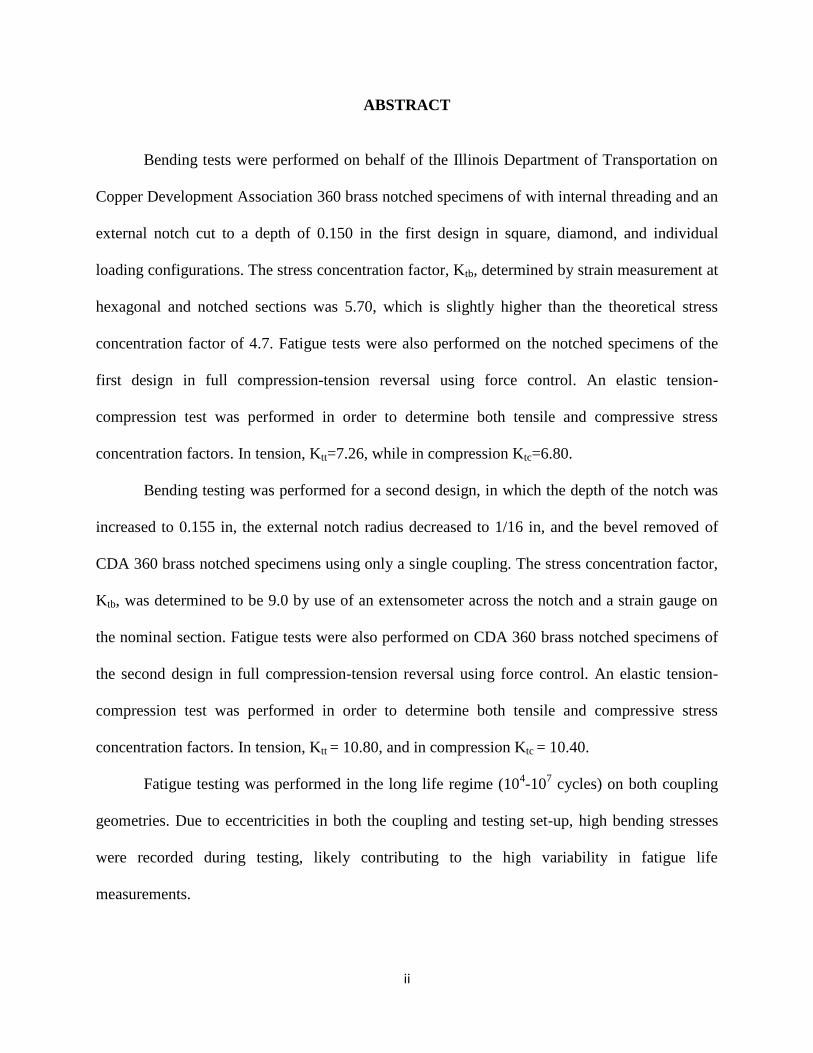
ABSTRACT
Bending tests were performed on behalf of the Illinois Department of Transportation on
Copper Development Association 360 brass notched specimens of with internal threading and an
external notch cut to a depth of 0.150 in the first design in square, diamond, and individual
loading configurations. The stress concentration factor, Ktb, determined by strain measurement at
hexagonal and notched sections was 5.70, which is slightly higher than the theoretical stress
concentration factor of 4.7. Fatigue tests were also performed on the notched specimens of the
first design in full compression-tension reversal using force control. An elastic tension-
compression test was performed in order to determine both tensile and compressive stress
concentration factors. In tension, Ktt=7.26, while in compression Ktc=6.80.
Bending testing was performed for a second design, in which the depth of the notch was
increased to 0.155 in, the external notch radius decreased to 1/16 in, and the bevel removed of
CDA 360 brass notched specimens using only a single coupling. The stress concentration factor,
Ktb, was determined to be 9.0 by use of an extensometer across the notch and a strain gauge on
the nominal section. Fatigue tests were also performed on CDA 360 brass notched specimens of
the second design in full compression-tension reversal using force control. An elastic tension-
compression test was performed in order to determine both tensile and compressive stress
concentration factors. In tension, Ktt = 10.80, and in compression Ktc = 10.40.
Fatigue testing was performed in the long life regime (104-10
7 cycles) on both coupling
geometries. Due to eccentricities in both the coupling and testing set-up, high bending stresses
were recorded during testing, likely contributing to the high variability in fatigue life
measurements.

iii
Finite element modeling of a two-dimensional cross-section of the coupling was
performed using ABAQUS®. A reduced cross-section was used to successfully run the model
and good agreement between modeling and experimental data was achieved for the complex
geometry.
iv
ACKNOWLEDGEMENTS
This project would not have been possible without the support of many people. Thanks to
my mentor Gregory Banas, who spent countless hours revising this thesis and other publications
during my studies. Thanks to Chris Hahin and the rest of the Illinois Department of
Transportation for the funding and input that made this project possible. Thank you to Leslie
Struble, who provided important advice concerning the thesis. Thank you to Hussam Mahmoud
for his assistance in use of finite element modeling. I would also like to thank Fred Lawrence and
Darrell Socie for their intellectual input.

v
Table of Contents
List of Tables……………………………………………………………………………………..vi
List of Figures……………………………………………………………………………………vii
Chapter 1. Introduction……………………………………………………………………………1
Chapter 2. Literature Review……………………………………………………………………...2
Chapter 3. Experimental Procedures………………………………………………………………5
Chapter 4. Results and Discussion……………………………………………………………….16
Chapter 5. Finite Element Analysis……………………………………………………………...41
Chapter 6. Conclusions…………………………………………………………………………..45
Chapter 7. Further Study………………………………………………………………………...48
References………………………………………………………………………………………..49
Appendix. Sample Calculations………………………………………………………………….51

vi
List of Tables
Table 1. Chemical Requirements for CDA 360………………………………………………….14
Table 2. Nominal Strain at Notch Strain of 724 µɛ……………………………………………...19
Table 3. Material Properties of CDA 360………………………………………………………..22
Table 4. Fatigue Results for Design 1 (Without Bending Stresses)……………………………..27
Table 5. Stress Concentration Factors for Design 1……………………………………………..28
Table 6. Eccentricity in Couplings……………………………………………………………….28
Table 7. Bending Stresses Under Fatigue for Design 2………………………………………….30
Table 8. Fatigue Results for Design 2 (Without Bending Stresses)…………………………….30
Table 9. Fatigue Performance of Couplings Subjected to Salt-Spray…………………………...31

vii
List of Figures
Figure 1. Coupling Design 1………………………………………………………………………1
Figure 2. Coupling Design 2………………………………………………………………………1
Figure 3. Strain Gauge Placement………………………………………………………………...5
Figure 4. Tensile Specimen Geometry…………………………………………………………….6
Figure 5. Loading Plate Design…………………………………………………………………...8
Figure 6. Concrete Block before Chipping………………………………………………………10
Figure 7. Concrete Block after Chipping………………………………………………………...10
Figure 8. Square Loading Configuration………………………………………………………...11
Figure 9. Diamond Loading Configuration……………………………………………………...11
Figure 10. Fatigue Grips Dimensions……………………………………………………………12
Figure 11. Theoretical vs. Recorded Strain in Diamond Configuration…………………………17
Figure 12. Theoretical vs. Recorded Strain in Square Configuration……………………………18
Figure 13. Theoretical vs. Recorded Strain Loading of Coupler 1………………………………18
Figure 14. Theoretical vs. Recorded Strain Loading of Coupler 2………………………………19
Figure 15. Eccentricity of Couplings Resulting from Testing Setup…………………………….20
Figure 16. CDA 360 ½ in. Round Tensile Specimen 1………………………………………….21
Figure 17. CDA 360 ½ in. Round Tensile Specimen 2………………………………………….21
Figure 18. CDA 360 ½ in. Round Tensile Specimen 3…………………………………………22
Figure 19. S-N Curve of Notched Brass Couplings (Without Bending Stresses)……………….25
Figure 20. S-N Curve of Notched Brass Couplings (With Bending Stresses)…………………...25
Figure 21. Coupling Eccentricity Measurement…………………………………………………26

viii
Figure 22. Comparison of Uniaxial and Rotating-Bending Fatigue of Polymer………………...26
Figure 23. Comparison of Uniaxial and Rotating-Bending Fatigue of CDA 365……………….27
Figure 24. S-N Curve of Notched Brass Couplings (With Bending Stresses)…………………31
Figure 25. Fracture Surface of Coupling 6……….……………………………………………...32
Figure 26. Fracture Surface of Coupling 7………….…………………………………………...33
Figure 27. Fracture Surface of Coupling 8……………………………………………................33
Figure 28. Fracture Surface of Coupling 9……….……………………………………………...34
Figure 29. Fracture Surface of Coupling 10……….…………………………………………….34
Figure 30. Fracture Surface of Coupling 0……………………………………………................35
Figure 31. Fracture Surface of Coupling 31……………………………………………………..35
Figure 32. Fracture Surface of Coupling 41…………………………………………………..…36
Figure 33. Fracture Surface of Coupling 42……………………………………………………..36
Figure 34. Fracture Surface of Coupling 43……………………………………………………..37
Figure 35. Fracture Surface of Coupling 44……………………………………………..............37
Figure 36. Fracture Surface of Coupling 45……………………………………………………..38
Figure 37. Fracture Surface of Coupling 46……………………………………………………..38
Figure 38. Fracture Surface of Coupling 51 (Failed in Tension)………………………………...39
Figure 39. Fracture Surface of Coupling 52……………………………………………………..39
Figure 40. Fracture Surface of Coupling 53……………………………………………………..40
Figure 41. Fracture Surface of Coupling 54……………………………………………………..40
Figure 42. 2-D Cross-section…………………………………………………………………….43
Figure 43. Minimal Section Analyzed with Loading Conditions………………………………..43

ix
Figure 44. Representative Element Density of Finite Element Model...………………………...44
Figure 45. Finite Element Results of Critical Notches...………………………………………...44

1
1. Introduction
Alloy steels and aluminum die castings have typically been used for coupling light pole
bases to anchor bolts which break away upon impact from a vehicle. The current replacement
coupling used in Illinois has a double hour glass configuration, and is produced by Transpo
Industries, Inc. of ETD 150 high strength steel1. In order to reduce the cost of replacing
couplings which have failed or are at the end of their useful life, CDA 360 brass was chosen as a
potential alternative material due to its uniform, higher fracture toughness over normal operating
temperatures, and its fatigue characteristics. The design of the notched coupling was determined
and refined using drop weight impact tests. The first notch design tested in this study is depicted
in Figure 1 (Design 1). The second design removes the bevel, decreases the notch radius to 1/16-
in, and increases the depth of the notch by 0.005 in as shown in Figure 2 (Design 2).
Figure 1. Coupling Design 1 Figure 2. Coupling Design 2
2
2. Literature Review
Design and testing of breakaway hardware for light poles began in the 1950s in England,
with significant research performed by Stoughten et al.5, Elmarakbi et al.
8, Walton et al.
7, and
Zegeer et al.6. Stoughten et al. researched aluminum breakaway couplings and slip bases with a
variety of light poles by impacting the assemblies with a 1979 Honda Civic5. The aluminum
breakaway couplings showed a maximum change in velocity of 12.4 ft/sec which was within the
limits of the 1985 AASHTO specifications, however were not recommended for use due to a
high level of porosity in the fracture surfaces and did not comply with tension or shear tests
specified by the California Department of Transportation5. The slip bases in the study performed
adequately5. Zegeer et al. created a user’s manual for considering the economic effects of
addressing utility pole accidents and provides a number of recommendations to reduce the
number of collisions with poles with examples from a thorough literature review6. Walton et al.
conducted further crash tests of light poles using frangible bases determining that the frangible
bases performed acceptably and would not pose any significant hazard by obstructing traffic7.
Elmarakbi et al. investigated finite element modeling of the impact of various types of light poles
with varying support systems including bolted connections, poles embedded in soil, and poles
embedded in sand. Elmarakbi et al. determining that the embedded poles absorbed significantly
more energy than poles attached to concrete bases, however concluded that the embedded poles
were preferential because the poles did not fall over8. No published literature was available for
the current Transpo® couplings used for fatigue. However, research performed by Azzam and
Menzemer on the residual stresses from the welding of supports for aluminum light poles, finite
element modeling and fatigue behavior showed that high residual stresses are present from the

3
welding process and that changing the plate thickness from 1 to 2 inches decreased the residual
stress by 24%, increasing the constant amplitude fatigue life (CAFL) 9, 10
.
No fatigue data was available for the Copper Development Association (CDA) 360 alloy
used for the couplings in this study but some fatigue performance for similar alloys, and metals
in general were available. Moore et al. analyzed pure copper, a brass alloy, and an aluminum
alloy in fatigue in shear11
. McAdam et al. had investigated the effect of cold working of metals
on their fatigue lives, and since the material used in the couplings is the half hard variant of CDA
360 and machined after being formed, the residual stresses from cold working can be as high as
the yield stress of the material12
. Since monotonic tests were performed, the ability to predict the
fatigue life using the stress vs. strain plot was considered using information presented by Ong et
al., and combined with estimates from Moore et al.’s research. Using this combined method of
prediction, observed fatigue life was similar to expected13
. Akyilidiz et al. also performed
research on the effects of external threading on fatigue behavior determining that machining
parameters have a complex relationship with fatigue life however cutting tool sharpness showed
the largest effect, followed by cutting velocity14
. The fatigue cracks on the externally threaded
specimens initiated in the root of the thread14
. Berger et al. had also studied the effect of notches
on fatigue life of aluminum alloys showing that notched specimens always displayed cracks
initiating from the surface while non-notched specimens could show crack initiations from
internal defects even for notches with relatively low stress concentrations (Kt = 1.8)15
. Mnif et al.
studied pre-strain and over-strain for their effects on fatigue behavior of brass alloys showing
that pre-strain may cause strain hardening and slip band formation which are often the point of
crack initiation, reducing fatigue life16
.

4
Finite element analysis of threaded specimens has been a limited area of thorough study
due to the complex geometry. Tanaka et al. performed some of the earliest work on modeling
realistic threads using finite element analysis software reaffirming that the distribution of stresses
across engaged threads is highly non-uniform with the first threads carrying significantly more
load than following threads17
. Fukuoka et al. showed that finite element modeling could
sufficiently simulate stresses induced during tightening even after yielding of the bolt had
occurred, showing that any plastic deformation redistributes the load18
. Fukuoka, et al. also
proposed a novel method for analyzing threads in a finite element model which can take into
effect contact pressure and circumferential variation19
. Aryassov et al. also studied the
distribution of stresses in bolt threads using mathematical approximations which closely match
finite element analysis performed in previous research20
. Finite element analysis of fatigue is
another novel area with research by Carlyle et al. showing that crack closure in fully reversed
fatigue loading can be modeled successfully21
. The literature found discussing the finite element
modeling of threads has focused on the bolt, which is usually the more critical element.

5
3. Experimental Procedures
3.1 Specimens. All CDA 360 brass notched specimens were provided by Mr. Christopher
Hahin of the Illinois Department of Transportation, designer of the device.
3.1.1 Bending Tests of Design 1. The notched surface and one flat exterior face of the
hexagonal brass couplings were prepared for mounting strain gauges by sanding the brass
surfaces with 180, 240, and 400 grit sandpaper. An acid etching solution was first applied
to the prepared surfaces on the brass couplers, and then de-ionized water was applied to
create an acceptable surface for mounting the strain gauges. A total of two strain gauges
(Vishay EA-13-031EC-120, EA-13-125BZ-350) were bonded onto each coupling. One
strain gauge was applied in the bottom of the notch and one on the flat surface of the
hexagonal bar (Figure 3).
Figure 3. Strain Gauge Placement

6
3.1.2 Monotonic Tests. Tensile specimens were fabricated from 1-in hexagonal CDA
360 brass obtained from McMaster-Carr Supply Company. Machining and polishing
were performed by Wagner Machine Co. of Champaign, IL. A small sample of the
hexagonal bar ordered from McMaster-Carr was sent to Chicago Spectro Services Lab of
Chicago, IL for chemical analysis to ensure the material was within the specifications for
free cutting brass set by ASTM Standard B16-1022
. Dimensions for the tensile specimens
are illustrated in Figure 4. The chemical composition of the sample is shown in Table 3.
3.1.3 Fatigue Tests of Design 1. The notched surface and one of the flat faces of the
hexagonal brass couplings were prepared for strain gauges by sanding with 180, 240, and
400 grit sandpaper. An acid etching solution was applied to the prepared surfaces on the
brass coupler, and then de-ionized water was applied to neutralize the acid. A total of two
Figure 4. Tensile Specimen Geometry (in)
7
strain gauges (Vishay® EA-13-031EC-350, EA-13-125BZ-350) were attached onto each
coupling. One was attached on the flat surface and the other in the root of the bottom of
the notch (Figure 3). Two strain gauges were used for the first five tests performed,
during which the effect of bending stresses were noted. Afterwards six gauges were
applied to the two remaining couplings in order to determine bending stresses induced
by the testing parameters.
3.1.4 Bending Tests of Design 2. Three of the flat faces of the hexagonal brass
couplings were prepared for strain gauges by sanding with 180, 240, and 400 grit
sandpaper. An acid etching solution was applied to the prepared surfaces on the brass
coupler, and then de-ionized water applied to neutralize the acid. A total of six strain
gauges (Vishay®
EA-13-125AC-350) were attached onto each coupler, one on each of the
prepared flat surfaces.
3.1.5 Fatigue Tests of Design 2. The same method of strain gauge preparation was used
as for the bending tests of Design 2.
3.1.6 Fatigue Testing of Design 2 with Salt Spray. A set of four couplings of Design 2
were subjected to a salt spray bath for 1000 hours prior to testing. The salt and corrosion
products were removed with a power sander then the same method of preparation was
used as for 1.4.

8
3.2 Testing Setup.
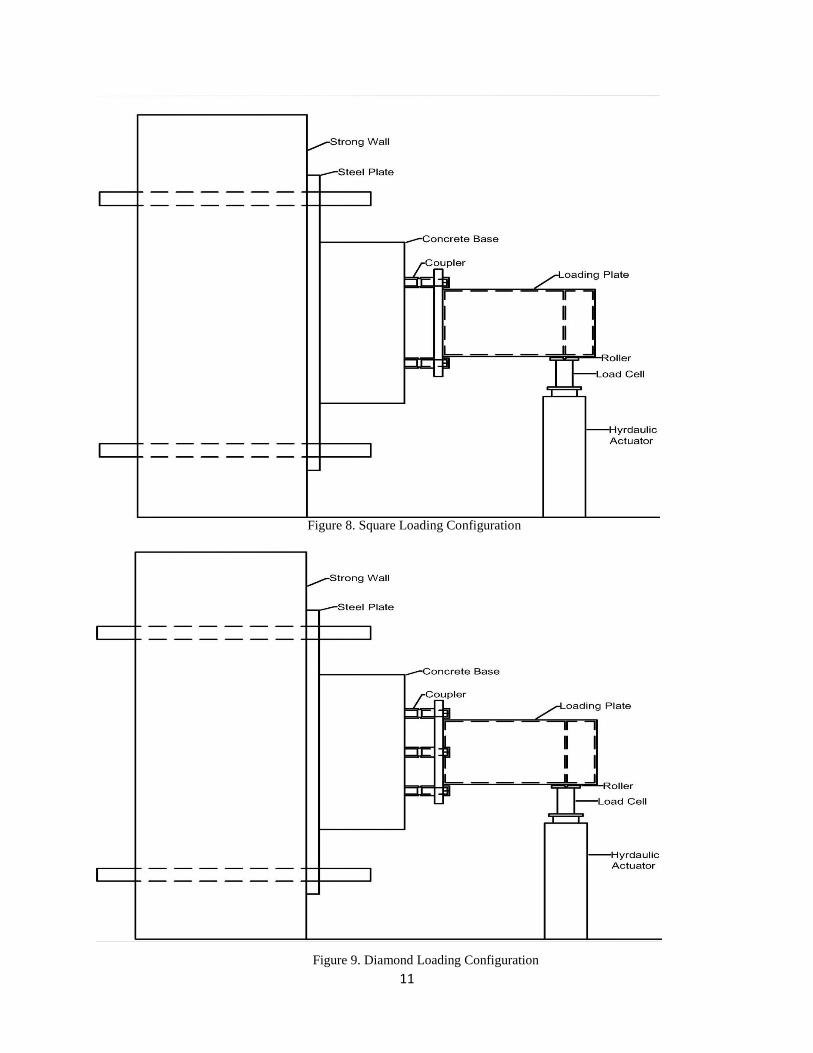
3.2.1 Bending Tests Design 1.Prior to assembly of the testing system, it was noted that
the concrete base provided had to be altered to allow fitting of testing equipment. The
concrete base was attached to a concrete testing wall using a specially made steel plate
(Figure 5).
A small amount of concrete was chipped off the base around one of the protruding studs
in order to allow placement of a locking nut (Figures 6 and 7). A specially fabricated
steel plate was made for this test and was attached to the strong wall on the east end of
the Newmark Structural Engineering Laboratory as shown in Figures 8 and 9. Four steel
rods were screwed into the tapped holes on the steel plate. The concrete foundation block
was positioned onto the steel rods and clamped down to the steel plate using steel
washers and nuts. A steel nut was screwed onto each of the four steel rods cast into the
concrete foundation block. The hexagonal brass couplings were then screwed onto the
Figure 5. Loading Plate Design

9
same rods as the steel nuts to a nominal depth of 1.5 inches, aligning the strain gauges to
form a vertical plane, and made parallel with the direction of loading. The steel nuts and
hexagonal brass couplings were tightened to a nominal torque of 50 ft-lbs. against each
other. The steel loading tube was placed onto the exposed stainless steel rods from the
hexagonal brass couplings. A stainless steel nut was fastened onto each remaining
stainless steel threaded rod which is thread-locked to each hexagonal brass coupling, and
then torqued to 50 ft-lbs.
A Simplex RK1001A 100 ton hydraulic actuator, equipped with Moog Model 72-
234C servo-valve, a ±5-in linear variable differential transformer (LVDT), and a
calibrated 60-kip load cell, was placed underneath the loading tube, with a loading plate
between the top of the actuator and the load cell. A roller pin was placed between the
loading plate and the loading tube (Figure 7 and 8). An MTS Hydraulic Service Manifold
was attached between actuator and MTS Hydraulic Power Supply. Both hydraulic units,
actuator and HSM, were driven by an INSTRON® 8500 Plus controller.
Brass couplings were tested in three different configurations: diamond, square and
individually loaded.
For the Square Orientation, refer to Figure 8.
For the Diamond Orientation, refer to Figure 9.
For the Individually Loaded Orientation, refer to the results section.

10
Figure 6. Concrete Block before Chipping
Figure 7. Concrete Block after Chipping
11
Figure 8. Square Loading Configuration
Figure 9. Diamond Loading Configuration
12
3.2.2 Monotonic Tests. An MTS 50-kip testing frame driven by an Instron® 8500 Plus
controller was used. Tension testing was performed using the mechanical grips of the
testing frame only.
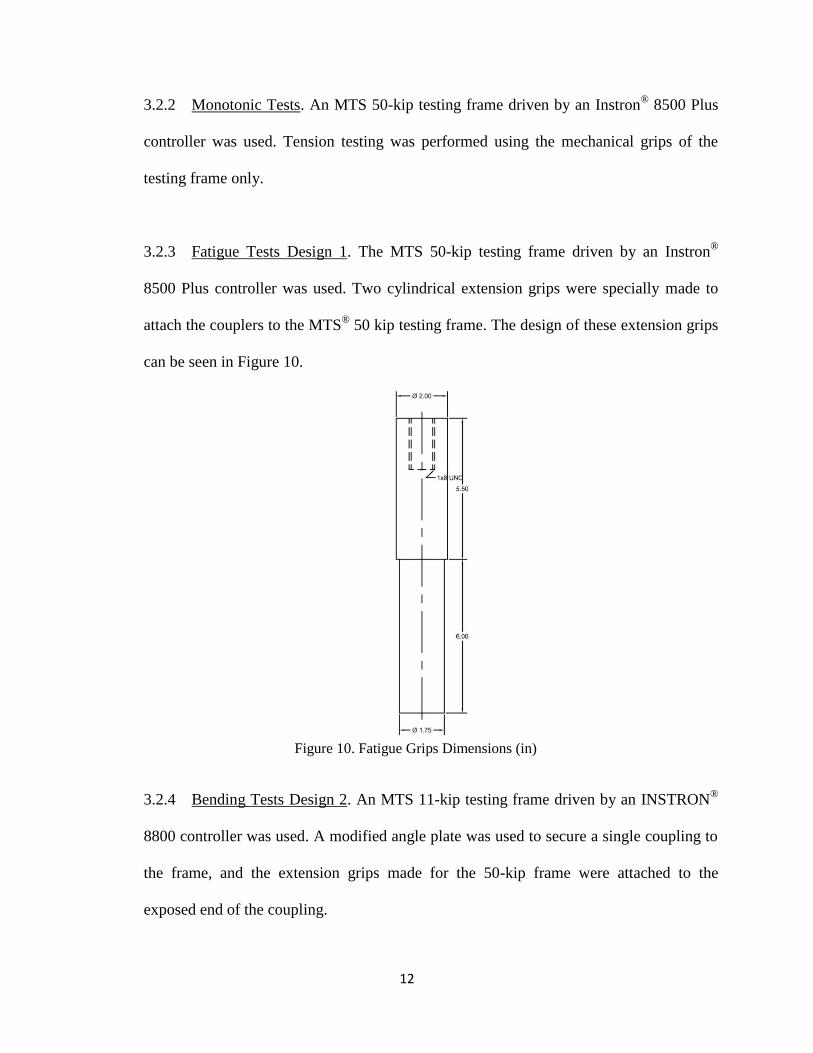
3.2.3 Fatigue Tests Design 1. The MTS 50-kip testing frame driven by an Instron®
8500 Plus controller was used. Two cylindrical extension grips were specially made to
attach the couplers to the MTS® 50 kip testing frame. The design of these extension grips
can be seen in Figure 10.
3.2.4 Bending Tests Design 2. An MTS 11-kip testing frame driven by an INSTRON®
8800 controller was used. A modified angle plate was used to secure a single coupling to
the frame, and the extension grips made for the 50-kip frame were attached to the
exposed end of the coupling.
Figure 10. Fatigue Grips Dimensions (in)

13
3.2.5 Fatigue Tests Design 2. The testing setup used was identical to the fatigue tests of
Design 1.
3.2.6 Fatigue Tests Design 2 Salt Spray. The testing setup used was identical to fatigue
tests of Design 1.
3.3 Testing Process. All testing was performed under laboratory conditions. The
temperature was 72ᵒ F with a controlled relative humidity of 30%.
3.3.1 Bending Tests Design 1. Specimens in each orientation were tested in the elastic
range up to a maximum strain of 724 µ, which was measured at the root of the notch.
Tests were carried out in force-control-mode using a single ramp function at a rate of 1
kip/min. A LabView®-based data logger was used to monitor each test.
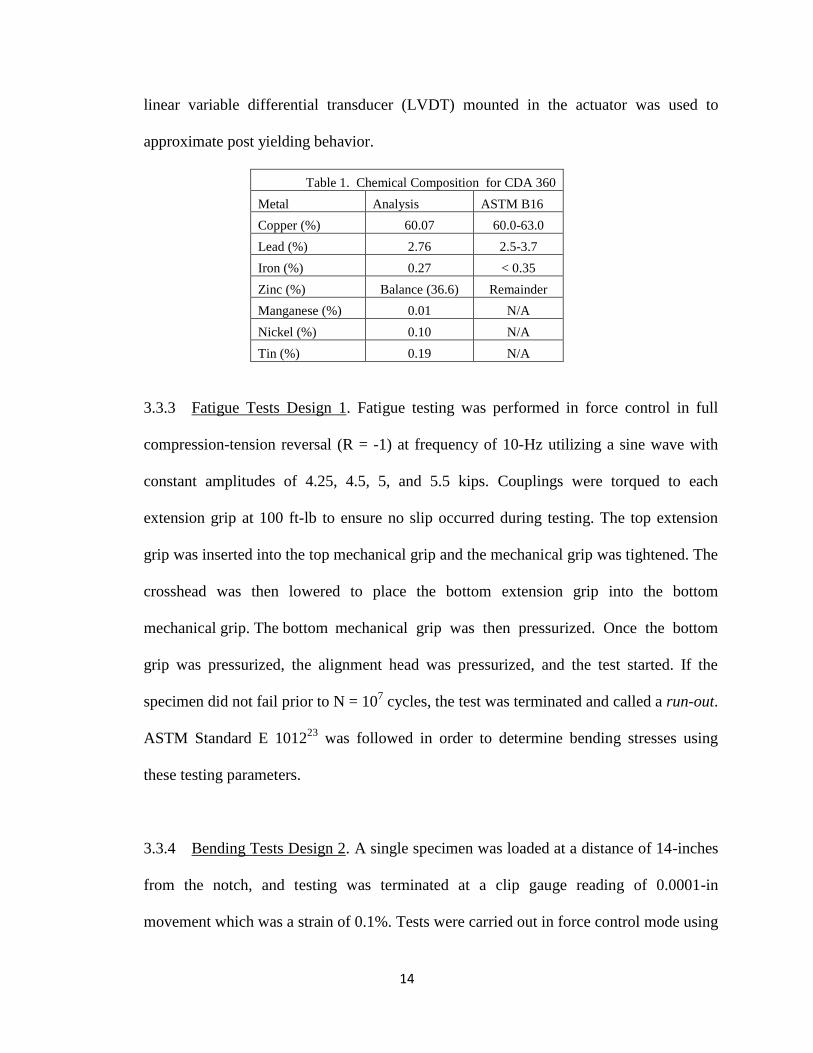
3.3.2 Monotonic Tests. Chemical analysis of the hexagonal brass specimen confirmed
that the material conformed to ASTM Standard B16 for the chemical composition of
CDA 360 free cutting brass, and the results of the chemical analysis are compared to the
accepted ASTM values in Table 1. The tensile specimens were pulled to fracture in
tension under displacement control at 0.1 in/min prior to yielding and 1 in/min after
yielding. Each specimen was inserted into the top mechanical grip which was tightened.
The lower end of the specimen was then inserted into the lower mechanical grip which
was tightened. The alignment head was then tightened. The attached Instron® 2-in
extensometer was removed near its maximum effective range, and the data from the
14
linear variable differential transducer (LVDT) mounted in the actuator was used to
approximate post yielding behavior.
Table 1. Chemical Composition for CDA 360
Metal Analysis ASTM B16
Copper (%) 60.07 60.0-63.0
Lead (%) 2.76 2.5-3.7
Iron (%) 0.27 < 0.35
Zinc (%) Balance (36.6) Remainder
Manganese (%) 0.01 N/A
Nickel (%) 0.10 N/A
Tin (%) 0.19 N/A
3.3.3 Fatigue Tests Design 1. Fatigue testing was performed in force control in full
compression-tension reversal (R = -1) at frequency of 10-Hz utilizing a sine wave with
constant amplitudes of 4.25, 4.5, 5, and 5.5 kips. Couplings were torqued to each
extension grip at 100 ft-lb to ensure no slip occurred during testing. The top extension
grip was inserted into the top mechanical grip and the mechanical grip was tightened. The
crosshead was then lowered to place the bottom extension grip into the bottom
mechanical grip. The bottom mechanical grip was then pressurized. Once the bottom
grip was pressurized, the alignment head was pressurized, and the test started. If the
specimen did not fail prior to N = 107 cycles, the test was terminated and called a run-out.
ASTM Standard E 101223
was followed in order to determine bending stresses using
these testing parameters.
3.3.4 Bending Tests Design 2. A single specimen was loaded at a distance of 14-inches
from the notch, and testing was terminated at a clip gauge reading of 0.0001-in
movement which was a strain of 0.1%. Tests were carried out in force control mode using
15
a single ramp function at a rate of 1 kip/min. A LabView®-based data logger was used to
monitor each test.
3.3.5 Fatigue Tests Design 2. Fatigue testing was performed in force control in full
compression-tension reversal (R = -1) at frequency of 10 Hz utilizing a sine wave, with
constant amplitudes of 5.0, 5.5 and 5.7 kips. The remainder of the procedure was the
same as for fatigue testing of Design 1.
3.3.6 Fatigue Tests Design 2 Salt Spray. Testing was performed under the same
conditions as in the fatigue tests of Design 2 with loads of 5.0 and 3.75 kip.
16
4. Results and Discussion
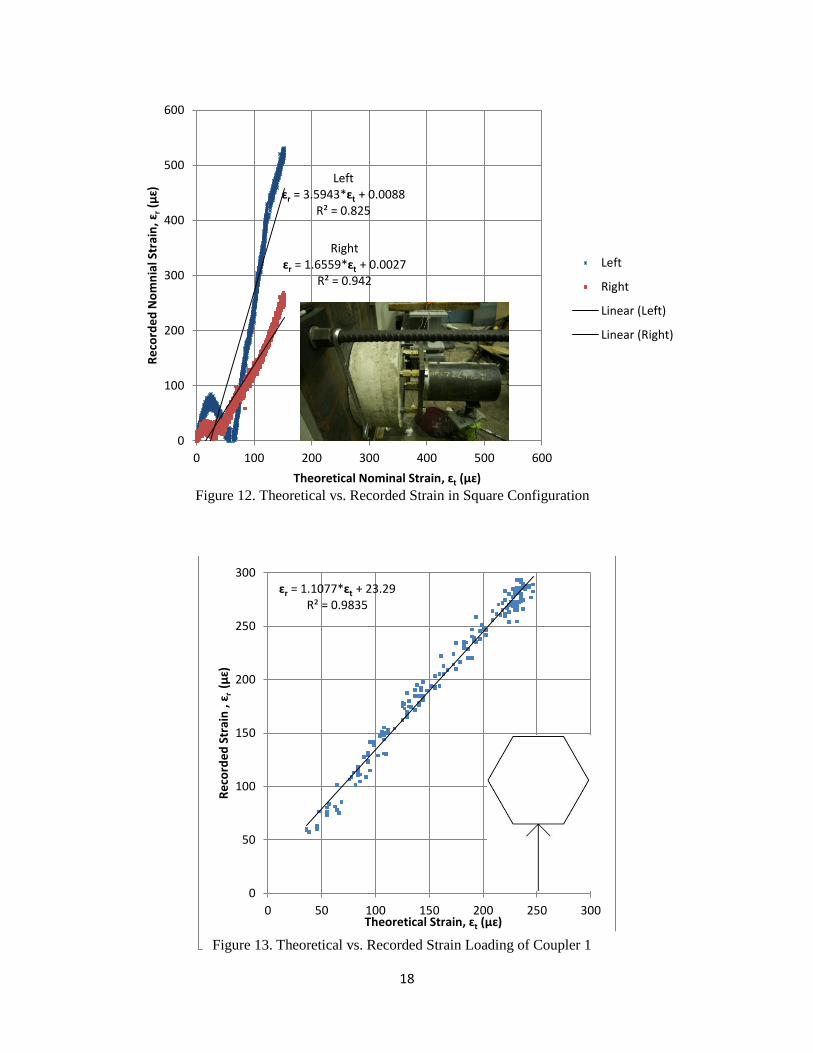
4.1 Bending Tests Design 1. The measured strain was plotted against the calculated
theoretical strain for the square, diamond, and individual loading cases, which can be seen in
Figures 11, 12, 13, and 14. In Figures 11 and 12, strain in the notch area and on the side of the
hexagonal section was determined by loading the four couplings in a pole base configuration. In
Figures 13 and 14, the nominal strains on the side of the hexagonal section were compared with
the notch strains when individual couplings were loaded in a test machine. Theoretical strain was
determined from the moment of inertia and the parallel axis theorem for the full hexagonal
section. Measured and calculated values of strain on the nominal section were recorded for a load
that generated 724 µε at the notch for all configurations (Table 2). An eccentricity was noticed
following testing because the couplings were not equidistant from the loading wall due to
irregularities in the concrete base. In any future second test, these couplings must be offset by an
equal distance from the load frame wall by use of leveling nuts. Figure 15 indicates the amount
of eccentricity induced by the offset.
As can be seen in figures depicting the response of strain gauges for the diamond and
square configurations, the relationship between applied load and recorded strain was not linear.
The behavior is most clearly evidenced by the square configuration, in which the strain on the
bottom left coupling began in tension, transitioned to compression, and back to tension at a very
high rate of strain increase. This unexpected non-linearity is most likely due to the eccentricity in
the couplings noted above.
Using data obtained during testing, the point at which the strain at the notch reached a
value of 724 µe was determined, and data recorded for values of strain and force on the nominal

17
section. The calculated strain, derived from the moment of inertia and the parallel axis theorem,
and the recorded strains on the nominal section are similar for the square and diamond
configurations. The lower observed value for the diamond configuration is likely due to the
observed compression in the side coupling due to the eccentricity in the loading setup. Loading
of individual couplings separately did not agree well with calculated values derived from the
moment of inertia (a 24% difference), and the difference is most likely due to the high noise
levels from the load cell present at such low force loadings.
The stress concentration factor Kt was defined as the ratio of the strain at recorded at the
notch and the full section, and was determined to be 5.7. The theoretical stress concentration
factor of 4.7 derived from the work of Petersen2
is slightly lower than the recorded value.
ɛr = 0.9732*ɛt - 16.996 R² = 0.9299
ɛr = -6.3341*ɛt - 15.967 R² = 0.7636
-80
-60
-40
-20
0
20
40
60
80
100
0 20 40 60 80 100
Re
cord
ed
No
min
al S
trai
n, ɛ
r (µɛ)
Theoretical Nominal Strain, ɛt (µɛ)
Bottom
Side
Linear (Bottom)
Linear (Side)
Figure 11. Theoretical vs. Recorded Strain in Diamond Configuration
18
Left ɛr = 3.5943*ɛt + 0.0088
R² = 0.825
Right ɛr = 1.6559*ɛt + 0.0027
R² = 0.942
0
100
200
300
400
500
600
0 100 200 300 400 500 600
Re
cord
ed
No
mn
ial S
trai
n, ɛ
r (µ
ɛ)
Theoretical Nominal Strain, ɛt (µɛ)
Left
Right
Linear (Left)
Linear (Right)
ɛr = 1.1077*ɛt + 23.29 R² = 0.9835
0
50
100
150
200
250
300
0 50 100 150 200 250 300
Re
cord
ed
Str
ain
, ɛ r
(µ
ɛ)
Theoretical Strain, ɛt (µɛ)
Figure 12. Theoretical vs. Recorded Strain in Square Configuration
Figure 13. Theoretical vs. Recorded Strain Loading of Coupler 1

19
Table 2. Nominal Strain at Notch Strain of 724 µɛ
Configuration
Force
(kip)
Moment (in-
kip)
Calculated Strain
(µ𝝐)
Recorded Strain
(µ𝝐)
Square 2.11 37.24 65.2 62.55
Diamond 1.98 35.7 86.5 77.16
Single 1 0.031 0.36 73.1 126
Single 2 0.038 0.446 78.7 106.2
ɛr = 1.4928*ɛt + 11.356 R² = 0.984
0
50
100
150
200
250
300
350
400
0 100 200 300 400
Re
cord
ed
Str
ain
, ɛ r
(µɛ)
Theoretical Strain, ɛt (µɛ) Figure 14. Theoretical vs. Recorded Strain Loading of Coupler 2

20
4.2 Monotonic Tests. Tension testing was performed in order to ensure accurate selection of
fatigue testing stress levels and verify material properties. The yield stress was determined at
0.5% strain in accordance with ASTM Standard B1622
. Data obtained from tensile testing is
presented graphically in Figures 16, 17, and 18 as well as in Table 3. The average yield strength
was 36,850 psi and the average ultimate tensile strength was 57,100 psi. The non-linear shape of
the stress-strain diagram coupled with limited fatigue data for similar brass alloys led to the
chosen loading cases for the fatigue study. Fracture surfaces of the tension specimens were also
compared to the fracture surface of the fatigue specimens in order to more easily identify the
ductile failure in comparison to fatigue fracture zones.
Figure 15. Eccentricity of Couplings Resulting from Testing Setup

21
0
10
20
30
40
50
60
0 5 10 15 20 25 30 35 40
Stre
ss, S
(ks
I)
Strain, e (%) Figure 16. CDA 360 1/2 in. Round Tensile Specimen 1
Extensometer
LVDT
Sy = 38.55 ksi
Su = 57.55 ksi
0
10
20
30
40
50
60
0 5 10 15 20 25 30 35 40
Stre
ss, S
(ks
i)
Strain, e (%) Figure 17. CDA 360 1/2 in. Round Tensile Specimen 2
Extensometer
LVDT
Sy = 36.68 ksi
Su = 56.86 ksi

22
Table 3. Material Properties of CDA 360
Specimen 1 2 3 Avg ASTM B16
Yield Stress (ksi) 35.88 36.68 38 36.85 > 25
Ultimate Stress (ksi) 57.55 56.86 56.88 57.10 > 55
Elongation (%) 35.6 37.9 33.6 35.7 > 10
Young's Modulus (ksi) 13,836 11,925 14,372 13,378 N/A
4.3 Fatigue Tests Design 1. Fatigue testing showed a high amount of scatter as is evidenced
by the relatively low coefficient of correlation (R = 0.556, R2 = 0.309). The least squares power
regression line and data points are displayed on a stress vs. number of cycles (S-N) diagram in
Figure 18 and Table 4. The notch strain range was calculated from the applied force, cross-
sectional area, and stress concentration factor (see Equation 16 in Appendix A).
Moore’s data for a similar copper alloy was used in our study as an approximate shape of
the S-N curve in tension-compression for the CDA 360 alloy and was used to choose stress
0
10
20
30
40
50
60
0 5 10 15 20 25 30 35
Stre
ss, S
(ks
i)
Strain, e (%) Figure 18. CDA 1/2 in. Round Tensile Specimen 3
Extensometer
LVDT
Sy @ e = 0.5% = 38.00 ksi
Su = 56.88 ksi

23
levels and therefore testing loads11
. The effect of pre-strain as studied by Mnif et al. may have
played a factor in the fatigue results due to the high torque applied resulting in pre-strain to the
couplings to ensure no slip occurred between the face of the couplings and the grip16
. The level
of pre-strain applied to the hexagonal section, however, was not recorded as the cracking always
occurred in the notch, which was believed to have not been influenced by the pre-strain applied
to the extremities of the couplings.
Initial fatigue testing of the notch was performed utilizing only two strain gauges per
specimen. After noticing the large variance in cycles to failure, the possibility of high bending
induced by the testing setup was realized. In order to capture the resulting bending stresses,
ASTM Standard E 101223
for circular specimens was followed with three strain gauges applied
equidistant around the cross-section. A total of six strain gauges were applied to each of the last
two specimens 120o apart from each other in the notches and on the corresponding flat faces on
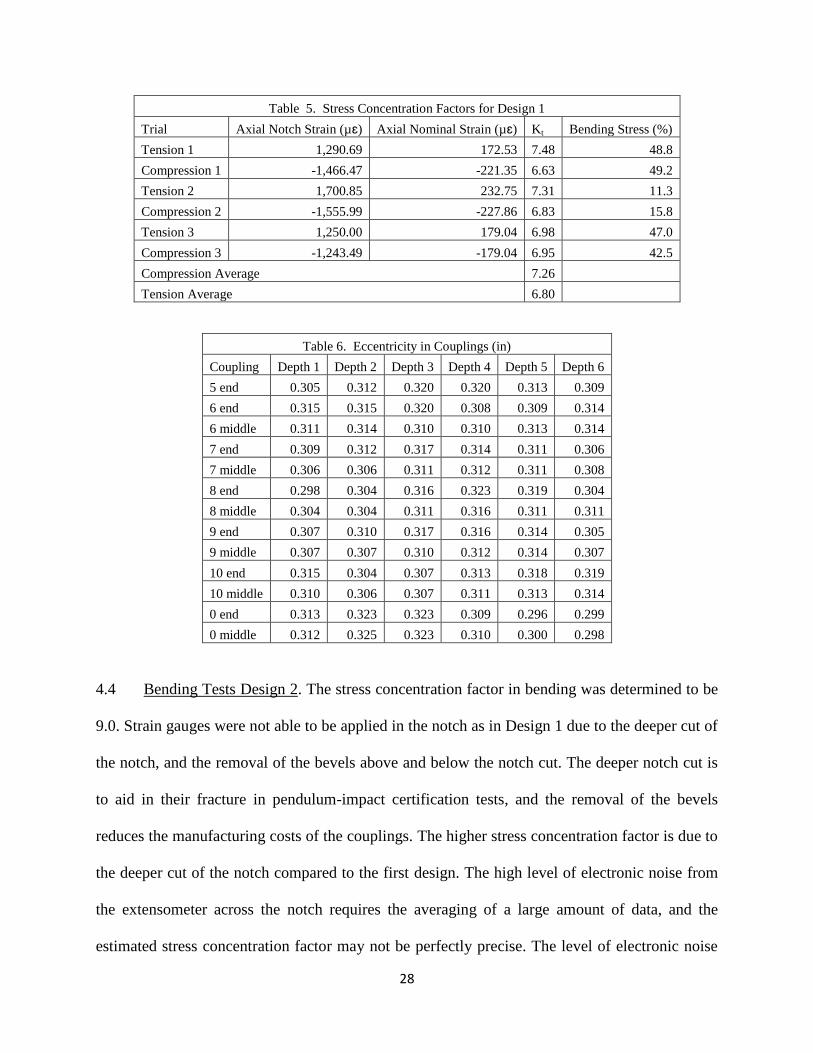
the hexagonal bar. Experimental Ktt and Ktc results and averages are shown in Table 4.
Bending stresses of nearly 50% were recorded for two of the three cases, indicating that
bending stresses were sufficiently high enough to affect fatigue performance. Due to the late
notice of the bending stresses, the relationship of the bending stresses for the first five tests
cannot be precisely determined, which is why a calculated stress range was used in place of
recorded strain gauge data. In Figure 19, the bending stresses for the first design were assumed to
be the average of the bending stresses recorded from all testing of 37%, which is an estimated
depiction of actual testing conditions for each individual coupling.
In order to determine a cause for the high bending stresses, the frame, grips, and
couplings were all examined. The brass couplings were not drilled and tapped perfectly parallel
with respect to the central longitudinal axis of the hexagonal bar (Figure 21 and Table 6). The

24
eccentricity in drilling meant that the top and bottom faces of the coupler would have to be
deformed in order to seat the couplings flush with the testing grips. The applied 100 ft-lb of
torque may have been sufficient to deform the faces and apply unintentional stresses to the
couplers, but the effect of the applied torques was not determined experimentally. The
eccentricity encountered also affects the reduced section. An uneven amount of material is
present axially relative to the notch, and in the presence of bending stresses the uneven cross-
section, would have led to an uneven distribution of stresses. The different levels of bending
stress noticed while performing the elastic bending test confirm that uneven amounts of material
in the notch effects fatigue performance, as significantly different bending stresses occurred
depending upon the rotation of the coupler. The thread locked studs protruding from the
couplings may also be canted due to the possible incidence of non-parallelism with respect to the
central axis of the hexagon bar stock. Measurements to verify this assumption were insufficient.
Compared to the change in wall thickness at the notched section due to the drilling eccentricity,
canting of the stainless stud would have only minor effects on the induction of bending stresses.
Due to limitations in testing equipment, tension-compression fatigue testing was
performed in place of rotating-bending testing. The correlation between uniaxial and rotating-
bending testing is related to both applied stresses and specimen size, but is not a linear relation3,
4. No published data were available to directly correlate the concentration of stresses associated
with notched hollow cylinders to the geometry or material of the couplings in this testing
program. There is a common pattern in published literature that uniaxial testing causes more
fatigue damage than rotating bending testing (Figures 22, and 23)3,4
.

25
ΔS = 100.6N-0.074
R² = 0.309
ΔS = 335.79N-0.156
R² = 0.9516
10.00
100.00
10000 100000 1000000 10000000
Ca
lcu
late
d N
otc
h
Str
ess
Ra
ng
e, Δ
S (
ksI
)
Fatigue Life, N (cycles)
Figure 19. S-N Curve of Notched Brass Couplings (Without Bending Stresses)
ΔS = 432.77N-0.153
R² = 0.7921
10.00
100.00
1000.00
10000 100000 1000000 10000000
Ca
lcu
late
d N
otc
h
Str
ess
Ra
ng
e, Δ
S (
ksI
)
Fatigue Life, N (cycles)
Figure 20. S-N Curve of Notched Brass Couplings (With Bending Stresses)
Testing was performed in laboratory conditions where T = 72ᵒF,
RH = 30%. A MTS 50 kip frame was controlled by an Instron®
8500 Plus. Testing was performed at 10 Hz under load control
under full reversal (R=-1)
Testing was performed in laboratory conditions where T = 72ᵒF,
RH = 30%. A MTS 50 kip frame was controlled by an Instron®
8500 Plus. Testing was performed at 10 Hz under load control
under full reversal (R=-1)
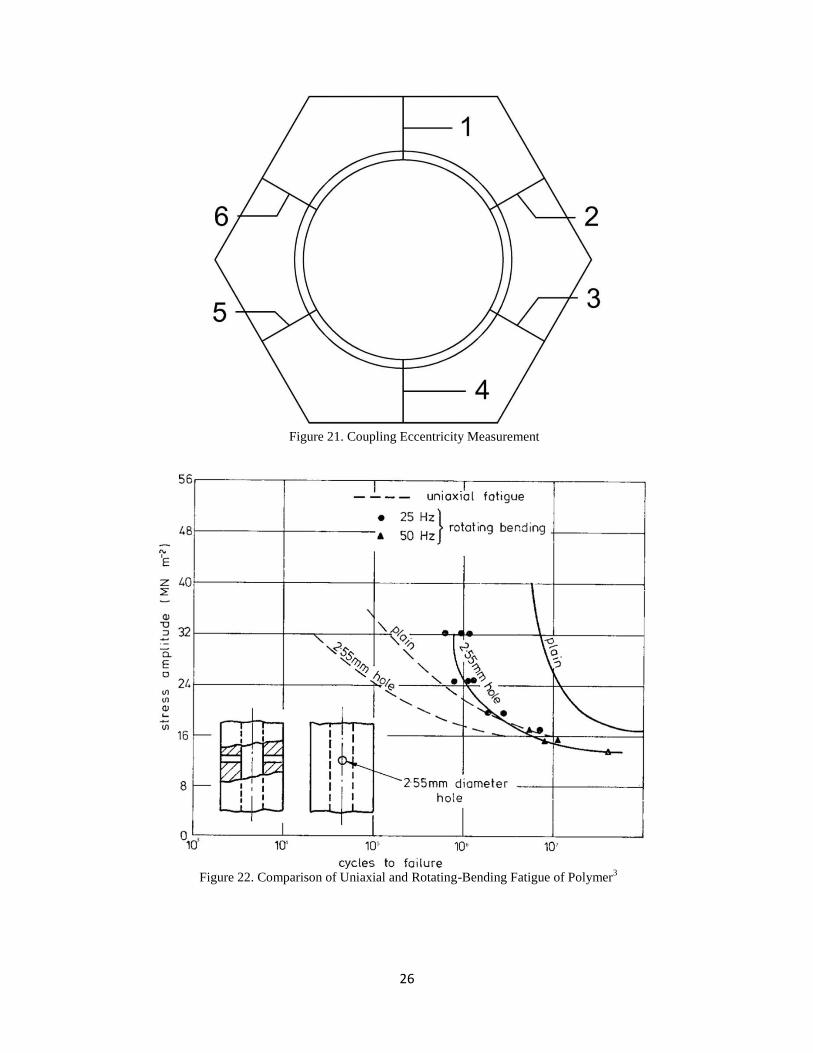
26
Figure 21. Coupling Eccentricity Measurement
Figure 22. Comparison of Uniaxial and Rotating-Bending Fatigue of Polymer3

27
1000000 1E7 1E8
10
100
1000
FA
TIG
UE
ST
RE
NG
TH
, M
Pa
NUMBER OF CYCLES TO FAILURE
Fatigue in Rotating Bending for Muntz Metal
Fatigue in Tension for Muntz Metal
Linear Fit for Rotating Bending
Linear Fit for Tension
Figure 23. Comparison of Uniaxial and Rotating-Bending Fatigue of CDA 365 (Muntz Metal) 4.
Table 4. Fatigue Results for Design 1 (Without Bending Stresses)
Coupling Load (kip) Nominal Stress (ksi) Notch Stress (ksi) Number of Cycles Failure # of Gauges
5 4.25 4.36 31.19 9,999,982 N 2
6 5 5.13 36.69 3,374,143 Y 6
7 4.25 4.36 31.19 2,693,060 Y 2
8 4.25 4.36 31.19 1,787,125 Y 2
9 5 5.13 36.69 621,184 Y 2
10 4.5 4.62 33.03 4,391,223 Y 2
0 5.5 5.65 40.36 832,542 Y 6
1E6
28
Table 5. Stress Concentration Factors for Design 1
Trial Axial Notch Strain (µɛ) Axial Nominal Strain (µɛ) Kt Bending Stress (%)
Tension 1 1,290.69 172.53 7.48 48.8
Compression 1 -1,466.47 -221.35 6.63 49.2
Tension 2 1,700.85 232.75 7.31 11.3
Compression 2 -1,555.99 -227.86 6.83 15.8
Tension 3 1,250.00 179.04 6.98 47.0
Compression 3 -1,243.49 -179.04 6.95 42.5
Compression Average 7.26
Tension Average 6.80
Table 6. Eccentricity in Couplings (in)
Coupling Depth 1 Depth 2 Depth 3 Depth 4 Depth 5 Depth 6
5 end 0.305 0.312 0.320 0.320 0.313 0.309
6 end 0.315 0.315 0.320 0.308 0.309 0.314
6 middle 0.311 0.314 0.310 0.310 0.313 0.314
7 end 0.309 0.312 0.317 0.314 0.311 0.306
7 middle 0.306 0.306 0.311 0.312 0.311 0.308
8 end 0.298 0.304 0.316 0.323 0.319 0.304
8 middle 0.304 0.304 0.311 0.316 0.311 0.311
9 end 0.307 0.310 0.317 0.316 0.314 0.305
9 middle 0.307 0.307 0.310 0.312 0.314 0.307
10 end 0.315 0.304 0.307 0.313 0.318 0.319
10 middle 0.310 0.306 0.307 0.311 0.313 0.314
0 end 0.313 0.323 0.323 0.309 0.296 0.299
0 middle 0.312 0.325 0.323 0.310 0.300 0.298
4.4 Bending Tests Design 2. The stress concentration factor in bending was determined to be
9.0. Strain gauges were not able to be applied in the notch as in Design 1 due to the deeper cut of
the notch, and the removal of the bevels above and below the notch cut. The deeper notch cut is
to aid in their fracture in pendulum-impact certification tests, and the removal of the bevels
reduces the manufacturing costs of the couplings. The higher stress concentration factor is due to
the deeper cut of the notch compared to the first design. The high level of electronic noise from
the extensometer across the notch requires the averaging of a large amount of data, and the
estimated stress concentration factor may not be perfectly precise. The level of electronic noise

29
was noticeably higher using the 11 kip test frame compared to the 50 kip test frame, but the
electronic noise was not resolvable during testing.
4.5 Fatigue Tests Design 2. Due to the bending stresses induced by drilling and tapping the
central hole of the hexagonal bar observed from fatigue testing of Design 1, the specimens had
six gauges attached to each of them to accurately determine bending stress levels. The tensile and
compressive stress concentration factors were determined by use of the attached strain gauges on
the nominal section and an extensometer across the notch. The ratio of strains recorded by the
extensometer to the strain measured by strain gauges was used to determine the tensile and
compressive stress concentration factors. The tensile Ktt was 10.40, and the compressive Ktc was
10.80. The bending stress levels for each coupling tested are shown in Table 7, and the fatigue
performance is shown in Table 8 and in Figures 19 and 20. A lower fatigue life testing range was
used for the second design due to both time and cost constraints. The fatigue behavior observed
with the lower fatigue life range may not be directly comparable to the higher fatigue testing
range, but an insufficient number of couplings were tested for certainty in the compatibility of
the two data sets. The results for the first and second designs are aggregated in Figure 20 with
the addition of bending stresses recorded for Design 2 and the average of recorded bending
stresses used for Design 1. The high correlation indicates that the combination of the two sets of
data is valid, and that the notch stress is likely the controlling variable in fatigue life. The second
design shows a higher sensitivity to applied stress range than does the first design, as is
evidenced by the larger exponent value (-0.156 vs. -0.074). The higher sensitivity to the applied
stress range may be an artifact inherent error in fatigue testing, or a difference due to the thinner
walls of the notched sections and the respective acuity of the notch. Extrapolation to higher cycle

30
ranges as studied in the fatigue behavior of the first design shows similar allowable stress levels
for the same fatigue life, which is to be expected of a very similar design with only a marginally
deeper notch. The two designs have been combined in a single graph representing fatigue life by
use of the peak calculated notch stress range (Figure 19). The applied force was divided by the
nominal cross-sectional area and multiplied by the stress concentration factor and then by the
percent of bending stresses determined from strain gauge measurements (Table 7).
Table 7. Bending Stresses Under Fatigue for Design 2
Coupling Load Bending Stresses (% of Loading)
41 5.50 78
42 5.00 15
43 5.70 50
44 5.70 34
45 5.00 30
46 5.50 15
Average 37
Table 8. Fatigue Results for Design 2 (Without Bending Stresses)
Coupling Load (kip) Nominal Stress (ksi) Notch Stress (ksi) Number of Cycles Failure
41 5.50 5.65 59.84 71200 Y
42 5.00 5.13 54.40 114289 Y
43 5.70 5.85 62.02 51985 Y
44 5.70 5.85 62.02 46514 Y
45 5.00 5.13 54.40 106665 Y
46 5.50 5.65 59.84 57178 Y
4.6 Fatigue Tests Design 2 Salt Spray. Four of the brass couplings of Design 2 were
subjected to 1000 hours of a salt spray bath and then tested in fatigue. The extent of corrosion
was minimal, which more salt solids accumulated than corrosion products. The first coupling
failed prematurely due to an equipment fault caused by a momentary loss of power. The failure
occurred at 15,649 lbs. The remaining three specimens showed no significant difference in
fatigue life from those not subjected to a salt bath. No clear indications of crack initiation sites

31
were found on these three specimens. Fatigue results for the couplings subjected to salt spray
testing are shown in Figure 24 and Table 9.
Table 9. Fatigue Performance of Couplings Subjected to Salt-Spray
Coupling Load (kip) Nominal Stress (ksi) Notch Stress (ksi) Number of Cycles Failure Bending (%)
52 5.00 6.39 67.73 32,535 Y 24.5
53 5.00 7.32 77.58 43,265 Y 42.6
54 3.75 5.95 63.08 571,163 Y 54.6
4.7 Fracture Surface Analysis. Macroscopic examination of the fracture surfaces was
performed for all fatigue specimens. Low magnification pictures of the fracture surfaces can be
seen in in Figures 25 through 41. All cracks appear to have originated from the internal threads
of the couplings, and from a single location area, which is indicated by the use of zoomed in
section with arrows in proposed crack initiation sites. Cracks initiated from the internal threads
10.00
100.00
1000.00
10000 100000 1000000 10000000
Ca
lcu
late
d N
otc
h
Str
ess
Ra
ng
e, Δ
S (
ksI
)
Fatigue Life, N (cycles)
Figure 24. S-N Curve of Notched Brass Couplings (With Bending Stresses)
Salt-Spray ΔS = 118.15N-0.047 R² = 0.4931
Non-Salt-Spray ΔS = 432.77N-0.153 R² = 0.7921
Testing was performed in laboratory conditions where T = 72ᵒF,
RH = 30%. A MTS 50 kip frame was controlled by an Instron®
8500 Plus. Testing was performed at 10 Hz under load control
under full reversal (R = -1)

32
due to the sharper notch compared to the external notch and is expected because of the higher
theoretical Kt of 102. The typical beach marks of fatigue specimens are not well developed in the
photographs of the fracture surface due to the limited depth of field of the camera equipment
used, but are present on the actual couplings. The fatigue crack zone is roughly one-quarter to
one-third of the total surface, and the area of initiation occurs at defect zones in the internal
threading.
Figure 25. Fracture Surface of Coupling 6

33
Figure 26. Fracture Surface of Coupling 7
Figure 27. Fracture Surface of Coupling 8

34
Figure 28. Fracture Surface of Coupling 9
Figure 29. Fracture Surface of Coupling 10

35
Figure 30. Fracture Surface of Coupling 0
Figure 31. Fracture Surface of Coupling 31

36
Figure 32. Fracture Surface of Coupling 41
Figure 33. Fracture Surface of Coupling 42

37
Figure 34. Fracture Surface of Coupling 43
Figure 35. Fracture Surface of Coupling 44

38
Figure 37. Fracture Surface of Coupling 46
Figure 36. Fracture Surface of Coupling 45

39
Figure 38. Fracture Surface of Coupling Coupling 51 (Failed in Tension)
Figure 39. Fracture Surface of Coupling 52

40
Figure 40. Fracture Surface of Coupling 53
Figure 41. Fracture Surface of Coupling 54

41
5. Finite Element Analysis
The purpose of Finite Element Analysis (FEA) was to develop a tool for calculating the
stress concentration factor (Kt) for circular members with internal and external notches in tension
and compression. A simplified, two-dimension model was selected (Figure 42), which would
serve the purpose to calculate the Kt, and the model was verified using the experimental data
generated earlier. Finite element modeling was performed with ABAQUS®
using a isotropic
planar model. The CDA 360 properties determined during the monotonic testing of tensile
specimens were used as the material characteristics for the model. Only the linear response of the
coupling model was considered due to the expected low service stresses remaining in the elastic
portion of the material stress vs. strain curve.
Multiple element sizes were considered, with smaller elements giving results closer to
experimental values. The two-dimensional model results showed an approximate agreement with
experimental data when the number of element edge length was set to 0.0001-in or less. Due to
the required small element size, and therefore resulting high computing power required to run the
model, only a minimal section of the coupling was considered. The central 0.5-in of the coupling
was accurately modeled in two dimensions to maximize element density with respect to
maximum element size with the given computing limitations (Figure 43). Utilizing only the
central 0.5-in of the coupling and an element edge length of 0.0001-in, a mesh was created using
the sweeping front option in ABAQUS®
resulting in a total number of elements of 143,321
(Figure 44). The loading condition which produced results most similar to experimental
measurements was a uniform loading applied to the top and bottom edges of the model (Figure
43). Using ABAQUS Viewer® to extract maximum in-plane stresses of selected elements, stress
42
concentrations for both the internal and external notches were determined to be 13.1 and 12.8
respectively. Both of the stress concentration factors were higher than observed in experimental
measurements, perhaps because the stress concentration produced by the model was highly
influenced by the element density and loading conditions. A two-dimensional model of only the
center section also does not likely capture the realistic boundary conditions of the coupling, but
has been shown to be useful in determining the stress concentration of a complex geometry
consisting of both internal and external notches.

43
Figure 43. Minimal Section Analyzed with Loading Conditions
Figure 42. 2-D Cross Section

44
Figure 44. Representative Element Density of Finite Element Model
Figure 45. Finite Element Results of Critical Notches

45
6. Conclusions
Bending testing of the first design of couplings while affixed to a supplied concrete base,
which was attached to a specially made steel plate and attached to the strong wall of the
Newmark Structural Engineering Laboratory. Bending testing showed that exact placement of
the couplings is difficult to achieve and that small deviations result in highly non-linear stress
response of the couplings. Loading of individual couplings showed linear, repeatable results,
while the diamond and square configurations showed highly non-linear, non-repeatable behavior.
The erratic behavior of the resulting stresses in the square and diamond configurations showed
that very small changes in the testing setup had profound effects on the induced stresses, due to
eccentricities in the testing setup as well as the design of the couplings and concrete base. The
testing setup for the bending testing was less rigid than that used for other testing performed for
this project, and the testing setup may have contributed to the inconsistencies.
When individual couplings of Design 1 were loaded in bending, they showed
significantly higher differences in strain between the nominal and reduced sections than when
loaded in a pole-base configuration. A stress concentration factor of Kt= 5.7 was determined
from individual couplings of Design 1 loaded in bending. Design 1 showed a very low sensitivity
to applied stress range to fatigue life. Bending testing of Design 2 showed a higher stress
concentration factor of Kt= 9.0 compared to Design 1 due to the deeper notch cut. The fatigue
life of Design 2 was more sensitive to the applied stress level, principally due to the eccentricity
effects of drilling and tapping, and the depth and decreased wall thickness of the notched area.
The 50 % reliability fatigue strength at 106 cycles is 38 ksi. At 90 mph winds, the couplings have
an average fatigue life of 6x10⁴ cycles with no rain, snow or ice loading. For a light pole with a

46
fundamental frequency of 1 Hz, this equates to 16.7 hours of exposure to winds at a constant 90
mph velocity with no additional loads applied.
Fatigue testing was performed on the first design, and more erratic behavior ensued. Due
to the eccentricity of the center hole of the coupling and possible eccentricities of the testing
frame, high levels of bending stresses developed. The bending stresses were not noticed until the
fatigue testing of the fifth coupling, at which point more gauges were applied to measure the
severity of the bending stresses. A high amount of scatter accompanied the bending stresses, and
no direct connection between the levels of bending stresses recorded was able to be associated
with any other testing variable.
Addition designs of couplings were presented by IDOT. The second and third designs
were abandoned within one month of receiving them, and a fourth design was chosen to be the
final design based on tension and impact testing. One coupling each of the second and third
couplings was tested in fatigue; however, one coupling is insufficient for analysis.
The fourth design was tested in bending using only a single coupling, allowing the use of
a more rigid testing setup. An additional hole was drilled in an existing angle plate, and the plate
was attached to a rigid testing frame. The designed notch decreased the radius of the external
notch by 1/16-in and removed the bevel to each side of the notch, which did not allow for the
placement of strain gauges, so an extensometer had to be used. Using the more rigid testing
frame, repeatable, expected results were obtained.
Fatigue testing of the fourth design was performed in the same testing setup as for the
other designs, and each coupling had 3 gauges placed 120o
degrees apart to measure bending
stresses. Stress levels were increased to reduce the fatigue lives due to time constraints, so the
ranges of fatigue lives do not overlap with previous testing. Bending stresses ranged from 15 %

47
to 78 % of the applied axial stresses, with an average of 37 %. Utilizing the bending stresses led
to an even larger scatter than was evident in the first design. When bending stresses were
removed from the results, the scatter of the fatigue data became significantly reduced, possibly
indicating that plastic deformation was occurring at the higher stress levels applied.
Finite element modeling results were similar to those achieved in experimental testing.
The stress concentration determined from the minimal central two-dimensional section was
within 20% of that experimentally determined. The two-dimensional model was found to be
useful in helping to determine the stress concentration of the member with internal and external
notches.

48
7. Further Study
The effect of the bending stresses on the reduced section may be more complex than first
envisioned possibly due to a possible interaction of the external notch and the internal threads.
The stress concentration factors proposed by Peterson2 are significantly lower than those
observed indicating a possible interaction of the internal and external surfaces, or may simply be
an artifact of the bending stresses. In order to find a definitive answer, experimental work is
recommended in order to study the effects of bending stresses more thoroughly and verify finite
element analysis results. With several data points for applied stresses and corresponding fatigue
life, results from finite element modeling can be factored appropriately, and fatigue behavior
over a broader range of bending and applied stresses is able to be estimated, however physical
testing should be performed to verify the finite element results. The finite element analysis
performed in this study is likely insufficient to model realistic loading behavior due to the
minimized height analyzed and the two-dimensional boundary conditions. The effect of differing
geometry is also a concern as the two tested designs have differing cross-sections at the notch,
and the bevel of the first design has been removed, which may affect the stress-stain behavior
beyond adjusting the stress concentration factor. While this effect is assumed to be negligible in
this study, experimental results may show a significant difference if performed. Further
experimental work will hopefully help answer some of the questions raised during the testing of
these couplings.

49
References
1. Transpo Industries Inc. "Pole-Safe® Omni-Directional Breakaway Pole Support Systems from
Transpo." New Technology for Transportation Safety from Transpo Industries, Inc. Web. 16
Aug. 2010. <http://www.transpo.com/pole-safe1.htm>.
2. Petersen, R. E., Stress Concentration Factors, Wiley, New York, 1974, p70.
3. Crawford, R. J. "A Comparison of Uniaxial and Rotating Bending Fatigue Tests on an Acetal
Co-polymer." Journal of Materials Science 9.8 (1974): 1297-304.
4. Grover, H. J., Gordon, S. A. and Jackson, L. R., NAVWEPS Report 00-25-534, Dept. of the
Navy, June 1960, p 376.
5. Stoughton, R. L., Abghari, Abbas, Dusel, J. P., Hedgecock, J. L., Glauz, D. L. ―Vehicle impact
testing of lightweight lighting standards.‖ Transportation Research Record 1233 (1989): 51-64.
Ebsco. Web. Sep. 23 2010.
6. Zegeer, C. V., Cynecki, M. J. ―Selection of Cost-Effective Countermeasures for Utility Pole
Accidents—User’s Manual.‖ Federal Highway Administration Report FHWA FHWA-IP-86-9,
US Department of Transportation, Dec. 1986.
7. Walton, N. E., Hirsch, T. J., Rowan, N. J. ―Evaluation of Breakaway Light Poles for Use in
Highway Medians.‖ Highway Research Record 460 (1973): 123-136.
8. Elmarakbi, A., Sennah, K., Samaan, M., Siriya, P. ―Crashworthiness of Motor Vehicle and
Traffic Light Pole in Frontal Collisions.‖ Journal of Transportation Engineering 132.9 (2006):
722-734.
9. Azzam, D., Menzemer, C. C. ―Fatigue Behavior of Welded Aluminum Light Pole Support
Details.‖ Journal of Structural Engineering 132.12 (2006): 1919-1927.
10. Azzam, D., Menzemer, C. C. ―Residual Stress Measurement of Welded Aluminum Light
Pole Supports.‖ Journal of Structural Engineering 132.10 (2006): 1603-1610.
11. Moore, H. F., Lewis, R. E. ―Fatigue Tests in Shear of Three Non-Ferrous Metals.‖ ASTM
Proceedings 37 (1931): 236-242.
12. McAdam, D. J. "Endurance Properties of the Alloys of Nickel and Copper", American
Society of Steel Treaters Transactions 8 (1925): 54-81.
13. Ong, J. H. ―An Improved Technique for the Prediction of Axial Fatigue Life from Tensile
Data.‖ International Journal of Fatigue 15.3 (1993): 213-219.

50
14. Akyilidz, H. K., Livatyali, H. ―Effects of Machining Parameters on Fatigue Behavior of
Machined Threaded Specimens.‖ Materials and Design31 (2010): 1015-1022.
15. Berger, C., Pyttel, B., Trossmann, T. ―Very High Cycle Fatigue Tests With Smooth and
Notched Specimens and Screws Made of Light Metal Alloys.‖ Internal Journal of Fatigue
28(2006): 1640-1646.
16. Mnif, R., Elleuch, R., Halouani, F. ―Effects of Cyclic Torsional Prestraining and Overstrain
on Fatigue Life and Damage Behavior of Brass Alloy.‖ Materials and Design 31 (2010): 3742-
3747.
17. Tanaka, M., Miyazawa, H., Asaba, E., Hongo, K. ―Application of the Finite Element Method
to Bolt-Nut Joints – Fundamental Studies on Analysis of Bolt-Nut Joints Using the Finite
Element Method.‖ Bulletin of the JSME 24.192 (1981): 192-223.
18. Fukuoka, T., Takaki, T. ―Elastic Plastic Finite Element Analysis of Bolted Joint During
Tightening Process.‖ Journal of Mechanical Design 125 (2003): 823-830.
19. Fukuoka, T., Nomura, M. ―Proposition of Helical Thread Modeling With Accurate Geometry
and Finite Element Analysis.‖ Journal of Pressure Vessel Technology 130 (2008).
20. Aryassov, G., Petritshenko, A. ―Analysis of Stress Distribution in Roots of Bolt Threads.‖
Proceedings of the 19th
International DAAAM Symposium (2008): 35-36.
21. Carlyle, A. G., Dodds, R. H. ―Three-Dimensional Effects on Fatigue Crack Closure under
Fully-Reversed Loading.‖ Engineering Fracture Mechanics 74 (2007): 457-466.
22. ―Standard Specification for Free-Cutting Brass Rod, Bar and Shapes for Use in Screw
Machines,‖ ASTM B16, American Society for Testing and Materials, 2010.
23. ―Standard Practice for Verification of Test Frame and Specimen Alignment Under Tensile
and Compressive Axial Force,‖ ASTM E1012, American Society for Testing and Materials,
2005.

51
Appendix: Sample Calculations.
P = 0.00256*V2*Cd*CH (1)
Where: P = pressure against tube (psi)
V = wind velocity (mph)
Cd = drag coefficient = 0.45
CH = height coefficient = 1.1
When V = 90 mph, P = 0.00256*0.45*1.1*90.002 = 10.26 lb/ft
2
S = 8/12*H = 26.60 ft2
(2)
Where: S = section modulus (ft2)
H = height (ft) = 40.00 ft
D = diameter (in) = 10.00 in
M = P*H*S/2 (3)
Where: M = moment (ft-lb)
M = 10.26*40*26.6/2 = 5,460.6 ft-lb = 65,530 in-lb
IH = 0.3038 in4 (4)
Where IH = Moment of inertia of hexagonal section (in4)
AH = 1.9485 in2 (5)
Where: AH = Area of hexagonal section (in2)
IN = π/64*(Do4-Di
4) = 0.0911 in
4 (6)
Where: I= Moment of Inertia of notched section (in4)
Do = outer section diameter (in) = 1.300
Di = inner section diameter (in) = 1.000
IN = π/64*(1.3004-1.000
4) = 0.0911 in
4
AN =π*(Do2-Di
2) (7)
Where: AN = Area of notched section (in2)

52
AN =π*(1.3002-1.000
2) = 0.5419 in
2
INS = (IN + AN*Ds2)*XS (8)
Where: INS = Moment of inertia of notched sections in square configuration (in4)
DS = Distance from centroid of arrangement to centroid of coupler (in) = 5.30 in
Xs = Number of couplings in square arrangement = 4
INS = (0.0911+0.5419*5.302)*4 = 61.26 in
4
IND = (IN + AN*DD2)*XD1 + IN*XD2 (9)
Where: IND = Moment of inertia of notched sections in diamond configuration (in4)
DD = Distance from centroid of arrangement to centroid of coupler (in) = 7.50 in
XD1 = number of couplers at far points in diamond configuration = 2
XD2 = number of couplers at centroid of diamond configuration = 2
IND = (0.0911+0.5419*7.5^2)*2+0.0911*2 = 61.33 in4
IHS = (IH + AH*DD2)*Xs (10)
Where: IHS = Moment of inertia of hexagonal section in square configuration (in4)
IHS = (0.3038+1.949*5.32)*4 = 220.2 in
4
IHD = (IH + AH*DD2)*XD1 + IH*XD2 (11)
Where: IHD = Moment of inertia of hexagonal section in diamond configuration (in4)
IHD = (0.3038+1.949*7.52)*2+0.30*2 = 220.4 in
4
σNomS = M*DS/(INS*XS2) (12)
Where: σHS = Hexagonal section stress for V = 90 mph in square configuration (psi)
XS2 = Number of couplers taking force at extreme = 2
σHS = 65530*5.3/220.2/2 = 788.8 psi
σNS = σHS*Kt (13)
Where: σNS = Notched section stress for V = 90 mph in square configuration (psi)
Kt = Stress concentration factor

53
σNS = 788.8*7.15 = 5,640 psi
σHD = M*DD/(IND*XD3) (14)
Where: σHD = Hexagonal section stress for V = 90 mph in diamond configuration (psi)
σHD = 65,530*7.5/220.4 = 2,229.62 psi
σND = σHD*Kt (15)
Where: σND = Notched section stress for V = 90 mph in diamond configuration (psi)
σND = 2,229.62*7.15 = 15,940 psi
ΔS = (F/AH*Kt)*2 (16)
Where: F = Applied force (kip)
ΔS = (4.25/1.9485*7.15)*2 = 31.19 ksi