Embed Size (px)
Citation preview

DOI: 10.4018/IJBAN.288512
International Journal of Business AnalyticsVolume 9 • Issue 1
This article published as an Open Access article distributed under the terms of the Creative Commons Attribution License(http://creativecommons.org/licenses/by/4.0/) which permits unrestricted use, distribution, and production in any medium,
provided the author of the original work and original publication source are properly credited.
*Corresponding Author
1
Volatility in Indian Stock Markets During COVID-19:An Analysis of Equity Investment StrategiesKhushboo Gupta, Amity University, Noida, India
Seshanwita Das, Christ University (Deemed), India
https://orcid.org/0000-0002-0011-7685
Kanishka Gupta, Symbiosis International University (Deemed), India
https://orcid.org/0000-0001-7211-7652
ABSTRACT
The aim of the paper is to evaluate the impact of novel COVID-19 on the returns and volatility of Indian stock markets with special reference to equity investment strategies of the Bombay Stock Exchange. For the purpose of evaluating the impact, the study has applied GARCH. The research has considered a time frame from March 2015 to January 2021. Prior to implementing GARCH model, pre-estimation tests (i.e., augmented Dickey-Fuller and ARCH-Lagrange multiplier) were conducted. Outcomes clearly indicate that the returns during the crisis for all the strategy indices have been negative, which means that the COVID-19 outbreak resulted in massive losses. Additionally, ‘during crisis’ period showed an increase in volatility for all the strategy indices depicting that the pandemic has a long-lasting effect and will take time to fade off. This research will help the investors in the investment decision process by giving them insights about the different strategies.
KEywORDSBSE, COVID-19, Equity Investment Strategies, GARCH, India, Indian Stock Market Performance
INTRODUCTION
COVID-19 has weakened the global economy and is considered to be a ‘Black Swan’ event for the world. Since the start of COVID-19 in late 2019, globally more than 88 million people have been affected by this virus and almost 2 million have succumbed to death. India is currently the 2nd most affected country as per the number of cases (as on 25th January 2021, as per WHO data available at: https://covid19.who.int/table). Naturally, the global economy took a serious hit and shrank by 4.3 percent in the last year. The world economy faced such a severe recession in 2020 that only the recessions caused by the two World Wars and the Great Depression could be termed as more serious than this one. Year 2020 can be termed as the 4th largest recession in last 150 years. In year 2021, the recovery path is still very uncertain with resurgence of cases and difficulties in vaccine distribution (The World Bank, 2021). The economic impact is affecting every country, but it’s even graver for the developing economies. The pandemic has caused such widespread unemployment that millions of people have been tipped into poverty. Indian economy too has suffered extremely. India officially went into lockdown from 25th March, 2020 which brought with it a lot of chaos for
International Journal of Business AnalyticsVolume 9 • Issue 1
2
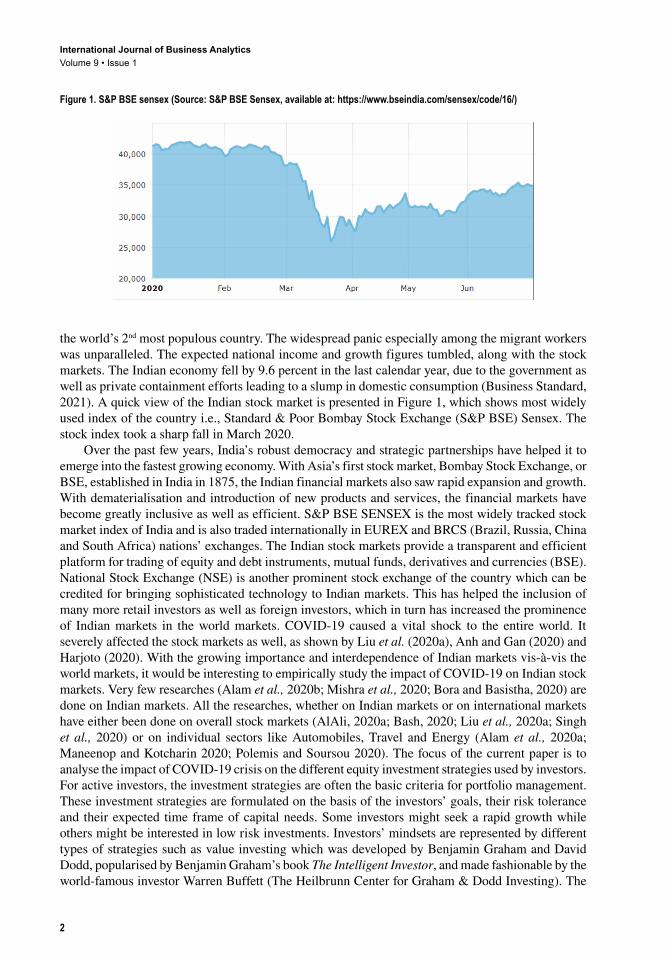
the world’s 2nd most populous country. The widespread panic especially among the migrant workers was unparalleled. The expected national income and growth figures tumbled, along with the stock markets. The Indian economy fell by 9.6 percent in the last calendar year, due to the government as well as private containment efforts leading to a slump in domestic consumption (Business Standard, 2021). A quick view of the Indian stock market is presented in Figure 1, which shows most widely used index of the country i.e., Standard & Poor Bombay Stock Exchange (S&P BSE) Sensex. The stock index took a sharp fall in March 2020.
Over the past few years, India’s robust democracy and strategic partnerships have helped it to emerge into the fastest growing economy. With Asia’s first stock market, Bombay Stock Exchange, or BSE, established in India in 1875, the Indian financial markets also saw rapid expansion and growth. With dematerialisation and introduction of new products and services, the financial markets have become greatly inclusive as well as efficient. S&P BSE SENSEX is the most widely tracked stock market index of India and is also traded internationally in EUREX and BRCS (Brazil, Russia, China and South Africa) nations’ exchanges. The Indian stock markets provide a transparent and efficient platform for trading of equity and debt instruments, mutual funds, derivatives and currencies (BSE). National Stock Exchange (NSE) is another prominent stock exchange of the country which can be credited for bringing sophisticated technology to Indian markets. This has helped the inclusion of many more retail investors as well as foreign investors, which in turn has increased the prominence of Indian markets in the world markets. COVID-19 caused a vital shock to the entire world. It severely affected the stock markets as well, as shown by Liu et al. (2020a), Anh and Gan (2020) and Harjoto (2020). With the growing importance and interdependence of Indian markets vis-à-vis the world markets, it would be interesting to empirically study the impact of COVID-19 on Indian stock markets. Very few researches (Alam et al., 2020b; Mishra et al., 2020; Bora and Basistha, 2020) are done on Indian markets. All the researches, whether on Indian markets or on international markets have either been done on overall stock markets (AlAli, 2020a; Bash, 2020; Liu et al., 2020a; Singh et al., 2020) or on individual sectors like Automobiles, Travel and Energy (Alam et al., 2020a; Maneenop and Kotcharin 2020; Polemis and Soursou 2020). The focus of the current paper is to analyse the impact of COVID-19 crisis on the different equity investment strategies used by investors. For active investors, the investment strategies are often the basic criteria for portfolio management. These investment strategies are formulated on the basis of the investors’ goals, their risk tolerance and their expected time frame of capital needs. Some investors might seek a rapid growth while others might be interested in low risk investments. Investors’ mindsets are represented by different types of strategies such as value investing which was developed by Benjamin Graham and David Dodd, popularised by Benjamin Graham’s book The Intelligent Investor, and made fashionable by the world-famous investor Warren Buffett (The Heilbrunn Center for Graham & Dodd Investing). The
Figure 1. S&P BSE sensex (Source: S&P BSE Sensex, available at: https://www.bseindia.com/sensex/code/16/)

International Journal of Business AnalyticsVolume 9 • Issue 1
3
Indian stock markets have designed some “Strategy Indices”, to chart the performance of a number of companies, on the basis of investment strategies. The present study evaluates various investment strategies to test which of them proved to be more stable in the highly unstable time of COVID-19. In other words, the objective of the paper is to empirically analyse the impact of COVID-19 on returns and volatility of different equity investment strategies for Indian stock markets.
The remainder of the paper is structured as follows: Section 2 discusses the review of literature; Section 3 explains the sample and statistical techniques used for empirical analysis; Section 4 discusses the findings of the analysis; Section 5 concludes the study and gives out the implications; and Section 6 details the limitations and future scope of the study.
REVIEw OF LITERATURE
Previous studies have reported a strong relationship between pandemic outbreaks and the stock markets. Park et al., (2008) and Pendell and Cho (2013) studied the reactions of the stock markets because of outbreak of animal diseases. Chen et al., (2007) and Chen et al. (2009) investigated the stock markets for SARS outbreak. Ichev and Marinč (2018) examined stock market reactions to Ebola outbreak. After the outbreak of COVID-19 pandemic, researches have been done within past 1 year to explore the impact of crisis on stock markets. These researches have been reviewed and classified on the basis of the markets they analyse. Firstly, the researches on international markets are discussed, followed by researches done on sectoral basis and then the researches specific to the Indian markets.
Impacts of Pandemic on world Stock MarketsLargely, the impact of COVID-19 on international stock markets has been negative. AlAli (2020b) analysed 5 largest Asian stock markets and confirmed the negative effect on stock market returns. Similar results were reported by Singh et al. (2020) who based their study on G-20 countries. A study of top 30 countries, in number of COVID-19 cases, also revealed downward trend of stock market and negative returns (Bash, 2020). Study of Chinese and Asian stock markets also showed decline in stock markets (Liu et al., 2020b). Studies by Ashraf (2020) and Lee et al., (2020) confirmed these findings. By March 2020, the Chinese stock markets had stabilised, while the world markets took a free fall. Not only the stock markets, even the commodities which were erstwhile considered safe, like oil, gold and bitcoin, took a plunge (Ali et al., 2020). Before April 2020, the negative effect of COVID-19 was on emerging economies; after April, it was on developed countries (Harjoto et al., 2020). Romanian financial market is an interesting case in this regard as it did not experience any significant impact of COVID-19. In fact, the Romanian government bonds showed more sensitivity to the news of this pandemic (Gherghina et al., 2020). Some studies have also tested for the impact on volatility and liquidity. Baig et al. (2020) investigated this for US stock markets and reported that volatility has increased and liquidity has decreased because of this pandemic. Haroon and Rizvi (2020) supported this result for 23 emerging markets of the world. Zhang et al., (2020) also found that the pandemic has led to increased uncertainty and risk in financial markets.
Impacts of Pandemic on Different SectorsYan et al. (2020) proposed investment strategies to make profits even in the current pandemic situation. In May 2020, they suggested shorting the stocks in travel related industry and buying later as they expected travel industry stocks to fall further. For technology sector, they recommended shorting till late May or early June and buying back then. For entertainment industry, they suggested buying in the long run only when the sales start to increase. Gold should be used as hedging strategy and should be bought and held till it reaches its peak. Other studies have evaluated different sectors in light of the pandemic and most have shown the negative impact on every sector that has been evaluated (Göker et al., 2020; He et al., 2020; Liew, 2020; Maneenop and Kotcharin, 2020; Polemis and Soursou, 2020). Göker et al., (2020) showed all that the losses were highest in tourism, sports and transportation

International Journal of Business AnalyticsVolume 9 • Issue 1
4
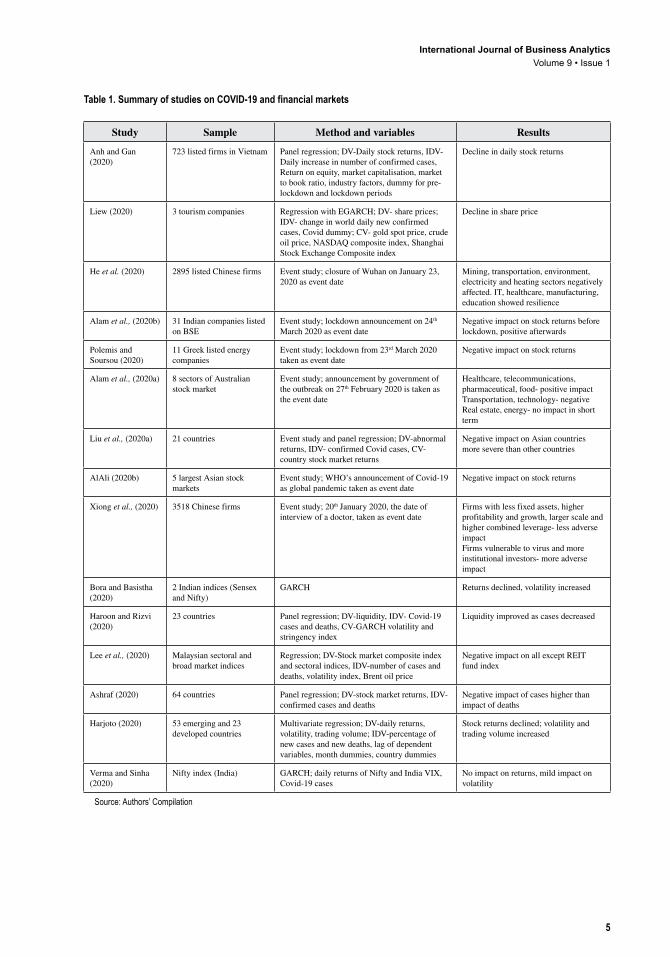
sectors. In Australia, when the announcement of the outbreak was made, transportation industry noted severe losses but food, healthcare, telecommunications and pharmaceuticals showed impressive performance (Alam et al., 2020a). In China, while other sectors faced adverse impact, education, IT, healthcare and manufacturing showed quick rebound and resilience (He et al., 2020). A summary of the studies that analysed the impact of COVID-19 on financial markets is presented in Table 1.
Impacts of Pandemic on Indian Stock MarketsA few researchers have investigated the Indian market as well. Alam et al., (2020b) conducted a study on the Indian stock markets using a random sample of 31 companies listed on BSE. Authors studied the market response during the lockdown period using event study methodology. It was concluded that the stock markets yielded positive returns after imposition of lockdown, but negative returns before it. With the panic spreading all over the world from January itself, the Indian stock markets duly responded by taking a fall and the investors welcomed the lockdown imposed by the government as depicted by positive returns. Mishra et al., (2020) showed negative growth of Indian stock market during the pandemic phase, by using Markov switching vector autoregression. Analysis done on different indices showed the same results except for healthcare sector. Even consumer goods sector was comparatively less affected than other sectors such as metal, realty, banking and automobiles. They further compared the results with two past events, GST implementation and Demonetisation, and found that none of them had such severe impact on the stock markets. Bora and Basistha’s (2020) study also revealed a negative impact of COVID-19 on returns. Further, using data from both BSE and NSE, they showed increased volatility in the stock markets after the 1st COVID-19 case was reported. Similar results were reported by Rajamohan et al., (2020) as they analysed the stock price volatility of the Indian automobile sector. Verma and Sinha (2020) showed that COVID-19 cases affected the volatility of the Indian stock markets mildly and did not affect the returns. These results could be such because of the timing of the study, as it was conducted in the initial phase of spread of Coronavirus in India (in May 2020).
Research GapAfter exhaustive review of literature, it was found that there are some studies which have analysed the immediate impact of the COVID-19 crisis on the overall stock markets (AlAli, 2020a; Bash, 2020; Liu et al., 2020a; Singh et al., 2020). On the other hand, some studies have focused on the impact of pandemic on different sectors of the economy like Automobiles, Travel, Technology and Energy (Alam et al., 2020a; Maneenop and Kotcharin, 2020; and Polemis and Soursou, 2020). The present study uses the strategy indices given by BSE to analyse the impact of COVID-19 on these equity investment strategies. This will help the investors in the investment decision process by giving them insights about the different strategies. By understanding the impact of COVID-19 on different investment strategies, they would know which strategies are sustainable even in events of such shocks to the economy. As per the authors’ knowledge, no such study has been done so far. Further, the research conducted on Indian markets is limited and the present study will contribute to the existing literature. Also, the time period taken by this study is larger than the previous studies, as most of the studies evaluated the immediate impact of COVID-19 on stock market performance.
RESEARCH METHODOLOGy
The present study analyses the volatility for different equity investment strategies. For this purpose, the strategy indices formulated by the BSE of India are considered. BSE Ltd. is Asia’s first and largest stock exchange with an overall market capitalisation of US$ 2.57 trillion as in January, 2021. It is deemed to be “World’s fastest exchange with a speed of 6 microseconds” (Company Overview, BSE, 2021). This section of the paper discusses the data sources, sample size, time frame and research
International Journal of Business AnalyticsVolume 9 • Issue 1
5
Table 1. Summary of studies on COVID-19 and financial markets
Study Sample Method and variables Results
Anh and Gan (2020)
723 listed firms in Vietnam Panel regression; DV-Daily stock returns, IDV-Daily increase in number of confirmed cases, Return on equity, market capitalisation, market to book ratio, industry factors, dummy for pre-lockdown and lockdown periods
Decline in daily stock returns
Liew (2020) 3 tourism companies Regression with EGARCH; DV- share prices; IDV- change in world daily new confirmed cases, Covid dummy; CV- gold spot price, crude oil price, NASDAQ composite index, Shanghai Stock Exchange Composite index
Decline in share price
He et al. (2020) 2895 listed Chinese firms Event study; closure of Wuhan on January 23, 2020 as event date
Mining, transportation, environment, electricity and heating sectors negatively affected. IT, healthcare, manufacturing, education showed resilience
Alam et al., (2020b) 31 Indian companies listed on BSE
Event study; lockdown announcement on 24th March 2020 as event date
Negative impact on stock returns before lockdown, positive afterwards
Polemis and Soursou (2020)
11 Greek listed energy companies
Event study; lockdown from 23rd March 2020 taken as event date
Negative impact on stock returns
Alam et al., (2020a) 8 sectors of Australian stock market
Event study; announcement by government of the outbreak on 27th February 2020 is taken as the event date
Healthcare, telecommunications, pharmaceutical, food- positive impact Transportation, technology- negative Real estate, energy- no impact in short term
Liu et al., (2020a) 21 countries Event study and panel regression; DV-abnormal returns, IDV- confirmed Covid cases, CV-country stock market returns
Negative impact on Asian countries more severe than other countries
AlAli (2020b) 5 largest Asian stock markets
Event study; WHO’s announcement of Covid-19 as global pandemic taken as event date
Negative impact on stock returns
Xiong et al., (2020) 3518 Chinese firms Event study; 20th January 2020, the date of interview of a doctor, taken as event date
Firms with less fixed assets, higher profitability and growth, larger scale and higher combined leverage- less adverse impact Firms vulnerable to virus and more institutional investors- more adverse impact
Bora and Basistha (2020)
2 Indian indices (Sensex and Nifty)
GARCH Returns declined, volatility increased
Haroon and Rizvi (2020)
23 countries Panel regression; DV-liquidity, IDV- Covid-19 cases and deaths, CV-GARCH volatility and stringency index
Liquidity improved as cases decreased
Lee et al., (2020) Malaysian sectoral and broad market indices
Regression; DV-Stock market composite index and sectoral indices, IDV-number of cases and deaths, volatility index, Brent oil price
Negative impact on all except REIT fund index
Ashraf (2020) 64 countries Panel regression; DV-stock market returns, IDV-confirmed cases and deaths
Negative impact of cases higher than impact of deaths
Harjoto (2020) 53 emerging and 23 developed countries
Multivariate regression; DV-daily returns, volatility, trading volume; IDV-percentage of new cases and new deaths, lag of dependent variables, month dummies, country dummies
Stock returns declined; volatility and trading volume increased
Verma and Sinha (2020)
Nifty index (India) GARCH; daily returns of Nifty and India VIX, Covid-19 cases
No impact on returns, mild impact on volatility
Source: Authors’ Compilation

International Journal of Business AnalyticsVolume 9 • Issue 1
6
techniques used to examine the impact of COVID-19 crisis on stock return and volatility of various equity investment strategies.
Data and Sample SizeWith a view to study the impact of COVID-19 on the stock returns and volatility, the present work has extracted the daily values of various strategy indices namely (Asia Index Pvt Ltd):
• S&P BSE IPO Index: This index tracks the performance of companies after their IPOs.• S&P BSE SME IPO Index: This index measures the performance of SMEs (Small and Medium
Enterprises) after their IPOs.• S&P BSE Dividend Stability Index: This index measures the performance of companies which
follow increasing or stable dividend policy.• S&P BSE Enhanced Value Index: Value investing strategy suggests investors to identify
undervalued firms on the basis of their intrinsic value and invest in them. This index identifies 30 high valued companies on the basis of earnings to price ratio, book value to price ratio and sales to price ratio.
• S&P BSE Quality Index: This index charts the performance of high quality companies identified by their quality scores, which is computed on the basis of financial leverage ratio, accruals ratio and return on equity.
• S&P BSE Low Volatility Index: This index tracks the performance of companies with lowest volatilities, which is measured by standard deviation.
• S&P BSE Momentum Index: This index charts the performance of high momentum stocks, identified by their risk adjusted price momentum score.
These seven indices are formulated by BSE to provide one value which shows the aggregate performance of companies on the basis of equity investment strategies. The data considered for the research has been collected from the official website of BSE. The time frame of examination is from March 2015 to January 2021 including the before and during time period of COVID-19 crisis. On 30th January, 2020, the Director-General of World Health Organization (WHO) announced “novel coronavirus outbreak as public health emergency” (WHO, timeline COVID-19, 2020). An emergency declaration like this intended to attract the interest of various stakeholders. Also, India reported its first confirmed positive case on the same date. Therefore, the time frame before this date is assessed as the pre-crisis and after this date as during-crisis period.
Research TechniquesFor the purpose of analysis, the study has incorporated Generalized Autoregressive Conditional Heteroscedasticity (GARCH). The financial literature highly supports the use of ARCH group of models to determine the volatility (Chaudhary et al., 2020). GARCH is an extended version of ARCH model propounded by Engle (1982). The GARCH model assists the “change in time dependent volatility” i.e., increase and decrease in the same series. The returns of all the equity investment strategy indices have been calculate by taking the natural log difference of index prices:
RP
Pxt
x t
=
−ln
, 1
where, R is return of index; Pxt is the price of index x at t day; Px, t-1 is the price of index x at t-1 day.

International Journal of Business AnalyticsVolume 9 • Issue 1
7
Unit-Root TestBefore performing time series analysis, it is vital to conduct unit root test in order to check for stationarity of the data. In time series data, if the movement of time does not cause change in the shape of distribution then the dataset is said to be stationary. To check stationarity, the study has used Augmented Dicker-Fuller (ADF) test where the null hypothesis is assumed as there exists unit root i.e., data is not stationary. The ADF is built on the following regression estimates:
∆ ∆y a y yt t
i
p
i t i t= + + +−
=−∑0 1 1
1
γ β ε
where, y is time series, α is constant, p is the optimum number of lags, ε is the error term; when γ=0 that means the series contains unit root i.e., series is not stationary.
ARCH Effect TestAnother diagnostic test before carrying out GARCH modelling is to conduct test for heteroscedasticity and presence of ARCH/GARCH effect (Engle, 1982). For this purpose, Autoregressive Conditional Heteroscedasticity-Lagrange Multiplier test (ARCH-LM) has been implemented. The null hypothesis is assumed as No ARCH effects. The ARCH-LM of order q, the following auxiliary regression model has been applied:
u u u u vt t t q t q t2
0 1 12
2 22 2= + + +…+ +− − −� �γ γ γ γ
where “u” is the square residual computed by the primary regression model; “q” lags are included in the secondary regression model; “γ0” is the constant term; “γ1, γ2…γq” are unknown coefficients with q as order; “v” is the composite error term.
GARCH ModelGARCH is the generalised type of ARCH model used to overcome the limitations of ARCH model. In order to examine the volatility, ARCH model requires large number of parameters; however, GARCH model provides more robust results with limited number of parameters. GARCH process, established by Bollerslev (1986), offers a deeper understanding of market volatility as it is dependent on the lag of today’s volatility and shocks. The widely used GARCH model is GARCH (1, 1) model, typically identified as “plain vanilla” GARCH (Karmakar, 2005). The GARCH (p, q) model can be illustrated as follows:
ut
i
q
i t ii
p
i t i2
1
2
1
2= + +=
−=
−∑ ∑� �γ α ε β λ
where “u” is the conditional variance; “γ” is the constant term; “p and q” are lags of conditional variance terms; “α and β” are coefficients of ARCH and GARCH terms; “εt-i” is the lag of squared residual (ARCH term) from previous year; “λt-i” is the variance from previous year (GARCH term). Larger the value of α, higher the responsiveness to new information, whereas higher the beta, more is the time for the shock to fade off. (α + β) indicates the consistency of the time series and greater the value of (α + β), greater is the persistence in volatility.
Financial time series often exhibit continued periods of calm followed by periods of wide swings; this is called volatility clustering. The ARCH and GARCH models have been developed by
International Journal of Business AnalyticsVolume 9 • Issue 1
8
econometricians for the purpose of dealing with volatility clustering, by accounting for correlations in error variance. In the times of crises, like the pandemic situation considered in the present study, this clustering is evidently reflected in the data. In such cases ARCH/GARCH models are considered to be appropriate to capture the volatility evolution (Gujarati & Porter, 2009; Predescu & Stancu, 2011).
RESULTS AND DISCUSSION
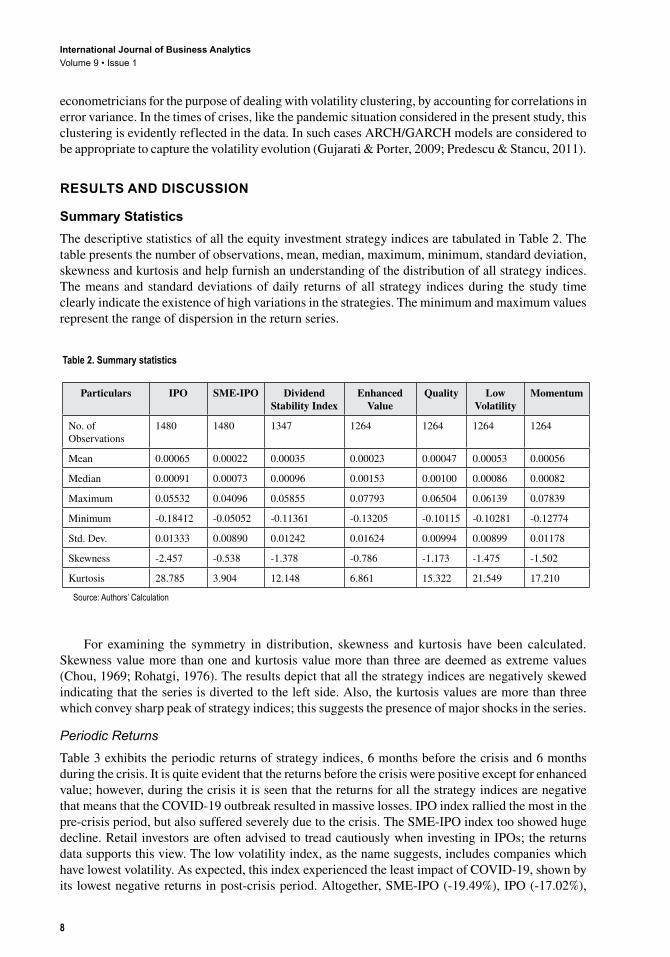
Summary StatisticsThe descriptive statistics of all the equity investment strategy indices are tabulated in Table 2. The table presents the number of observations, mean, median, maximum, minimum, standard deviation, skewness and kurtosis and help furnish an understanding of the distribution of all strategy indices. The means and standard deviations of daily returns of all strategy indices during the study time clearly indicate the existence of high variations in the strategies. The minimum and maximum values represent the range of dispersion in the return series.
For examining the symmetry in distribution, skewness and kurtosis have been calculated. Skewness value more than one and kurtosis value more than three are deemed as extreme values (Chou, 1969; Rohatgi, 1976). The results depict that all the strategy indices are negatively skewed indicating that the series is diverted to the left side. Also, the kurtosis values are more than three which convey sharp peak of strategy indices; this suggests the presence of major shocks in the series.
Periodic ReturnsTable 3 exhibits the periodic returns of strategy indices, 6 months before the crisis and 6 months during the crisis. It is quite evident that the returns before the crisis were positive except for enhanced value; however, during the crisis it is seen that the returns for all the strategy indices are negative that means that the COVID-19 outbreak resulted in massive losses. IPO index rallied the most in the pre-crisis period, but also suffered severely due to the crisis. The SME-IPO index too showed huge decline. Retail investors are often advised to tread cautiously when investing in IPOs; the returns data supports this view. The low volatility index, as the name suggests, includes companies which have lowest volatility. As expected, this index experienced the least impact of COVID-19, shown by its lowest negative returns in post-crisis period. Altogether, SME-IPO (-19.49%), IPO (-17.02%),
Table 2. Summary statistics
Particulars IPO SME-IPO Dividend Stability Index
Enhanced Value
Quality Low Volatility
Momentum
No. of Observations
1480 1480 1347 1264 1264 1264 1264
Mean 0.00065 0.00022 0.00035 0.00023 0.00047 0.00053 0.00056
Median 0.00091 0.00073 0.00096 0.00153 0.00100 0.00086 0.00082
Maximum 0.05532 0.04096 0.05855 0.07793 0.06504 0.06139 0.07839
Minimum -0.18412 -0.05052 -0.11361 -0.13205 -0.10115 -0.10281 -0.12774
Std. Dev. 0.01333 0.00890 0.01242 0.01624 0.00994 0.00899 0.01178
Skewness -2.457 -0.538 -1.378 -0.786 -1.173 -1.475 -1.502
Kurtosis 28.785 3.904 12.148 6.861 15.322 21.549 17.210
Source: Authors’ Calculation

International Journal of Business AnalyticsVolume 9 • Issue 1
9
enhanced value (-16.69%) and dividend stability index (-15.04%) were extremely affected compared to momentum (-7.37%), quality (-4.60%) and low volatility (-2.55%).
Volatility ClusteringFigure 2 represents the daily returns of all the equity investment strategy indices from March, 2015 to January, 2021. The graphs portray high volatility during the time-period for all strategies. Additionally, it is observed that all the strategy indices display volatility clustering that means volatility of today will affect the volatility of future time period.
Diagnostic TestsBefore applying GARCH (1,1) model, it is vital to conduct two diagnostic tests i.e., test of stationarity and ARCH effects. To test the stationarity of the series Augmented Dicker-Fuller (ADF) test has been performed and for checking the ARCH effect- Lagrange Multiplier test (ARCH-LM) has been implemented. Table 4 exhibits the results of the diagnostic tests. Outcomes of ADF test reveals that t-statistics for all the strategy indices are significant at 5 percent significance level which leads to rejection of null hypothesis and conclusion for absence of unit roots i.e., the series is stationary at level can be drawn. Further, results of ARCH-LM test indicates that LM statistics is significant at 5 percent significance level, therefore, null hypothesis is rejected and inference for presence of ARCH effect in the series can be drawn. Thus, pre-conditions, i.e., presence of volatility clustering, series being stationary and presence of ARCH effects, are fulfilled before applying standard GARCH (1,1) model.
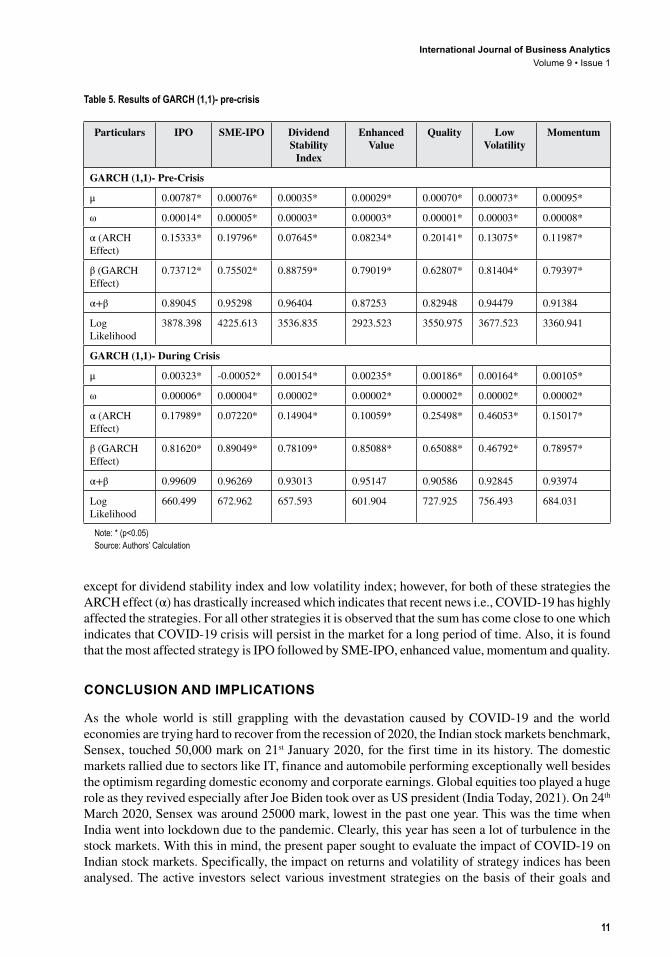
GARCH (1,1) Model EstimationFindings of GARCH (1,1) model for pre and during crisis are tabulated in Table 5. The results indicate that conditional mean coefficient of all the equity investment strategy indices are positive and significant. For variance equation, the coefficient of constant, ARCH and GARCH terms are positive and significant for both pre and during crisis period. The ARCH and GARCH coefficient are associated with the effect of news. ARCH (α) coefficient indicates the recent news and GARCH (β) represents the old news and time for the shock to fade off. Their statistically significance shows that new and old news has had an effect on stock price volatility. High GARCH (β) coefficient suggest that old news is taking long time to fade off and that “volatility is persistent”.
The summation of ARCH (α) and GARCH (β) coefficient i.e., (α+β) is around one. The closer the sum is to one, the longer the shock will take time to fade off. Higher value of “α+β” signifies “long memory” and that the disturbance may show a “permanent change in future” stock prices. As can be seen in Table 5, the sum (α+β) has increased in during crisis period for almost all the strategy indices
Table 3. Periodic returns
Strategy Indices Periodic Returns (%)
6 Months- Before the Crisis 6 months- During the Crisis
IPO 34.53 -17.02
SME-IPO 5.25 -19.49
Dividend Stability Index 1.85 -15.04
Enhanced Value -1.45 -16.69
Quality 10.35 -4.60
Low Volatility 9.02 -2.55
Momentum 15.57 -7.37
Source: Authors’ Calculation

International Journal of Business AnalyticsVolume 9 • Issue 1
10
Figure 2. Daily returns of all equity investment strategy indices (Source: Authors’ Compilation)
Table 4. Diagnostic tests
Tests IPO SME-IPO
Dividend Stability Index
Enhanced Value
Quality Low Volatility
Momentum
ADF in Level t-statistics
-8.5353* -8.1501* -9.3909* -8.945* -10.087* -9.9461* -9.886*
ARCH-LM
135.85* 102.19* 338.31* 209.36* 323.46* 320.81* 305.4*
Note: * (p<0.05)Source: Authors’ Calculation
International Journal of Business AnalyticsVolume 9 • Issue 1
11
except for dividend stability index and low volatility index; however, for both of these strategies the ARCH effect (α) has drastically increased which indicates that recent news i.e., COVID-19 has highly affected the strategies. For all other strategies it is observed that the sum has come close to one which indicates that COVID-19 crisis will persist in the market for a long period of time. Also, it is found that the most affected strategy is IPO followed by SME-IPO, enhanced value, momentum and quality.
CONCLUSION AND IMPLICATIONS
As the whole world is still grappling with the devastation caused by COVID-19 and the world economies are trying hard to recover from the recession of 2020, the Indian stock markets benchmark, Sensex, touched 50,000 mark on 21st January 2020, for the first time in its history. The domestic markets rallied due to sectors like IT, finance and automobile performing exceptionally well besides the optimism regarding domestic economy and corporate earnings. Global equities too played a huge role as they revived especially after Joe Biden took over as US president (India Today, 2021). On 24th March 2020, Sensex was around 25000 mark, lowest in the past one year. This was the time when India went into lockdown due to the pandemic. Clearly, this year has seen a lot of turbulence in the stock markets. With this in mind, the present paper sought to evaluate the impact of COVID-19 on Indian stock markets. Specifically, the impact on returns and volatility of strategy indices has been analysed. The active investors select various investment strategies on the basis of their goals and
Table 5. Results of GARCH (1,1)- pre-crisis
Particulars IPO SME-IPO Dividend Stability
Index
Enhanced Value
Quality Low Volatility
Momentum
GARCH (1,1)- Pre-Crisis
μ 0.00787* 0.00076* 0.00035* 0.00029* 0.00070* 0.00073* 0.00095*
ω 0.00014* 0.00005* 0.00003* 0.00003* 0.00001* 0.00003* 0.00008*
α (ARCH Effect)
0.15333* 0.19796* 0.07645* 0.08234* 0.20141* 0.13075* 0.11987*
β (GARCH Effect)
0.73712* 0.75502* 0.88759* 0.79019* 0.62807* 0.81404* 0.79397*
α+β 0.89045 0.95298 0.96404 0.87253 0.82948 0.94479 0.91384
Log Likelihood
3878.398 4225.613 3536.835 2923.523 3550.975 3677.523 3360.941
GARCH (1,1)- During Crisis
μ 0.00323* -0.00052* 0.00154* 0.00235* 0.00186* 0.00164* 0.00105*
ω 0.00006* 0.00004* 0.00002* 0.00002* 0.00002* 0.00002* 0.00002*
α (ARCH Effect)
0.17989* 0.07220* 0.14904* 0.10059* 0.25498* 0.46053* 0.15017*
β (GARCH Effect)
0.81620* 0.89049* 0.78109* 0.85088* 0.65088* 0.46792* 0.78957*
α+β 0.99609 0.96269 0.93013 0.95147 0.90586 0.92845 0.93974
Log Likelihood
660.499 672.962 657.593 601.904 727.925 756.493 684.031
Note: * (p<0.05)Source: Authors’ Calculation

International Journal of Business AnalyticsVolume 9 • Issue 1
12
risk preference. The strategy indices show the aggregate performance of companies clubbed together in accordance with the investment strategies. The present research is conducted taking seven BSE strategy indices as the sample, viz. S&P BSE IPO, S&P BSE SME IPO, S&P BSE Dividend Stability, S&P BSE Enhance Value, S&P BSE Quality, S&P BSE Low Volatility and S&P BSE Momentum indices. The period of the study was considered from March 2015 to January 2021, divided into two phases: pre-crisis, before 30th January 2020 and during crisis, 30th January 2020 onwards. Periodic returns for 6 months before and 6 months during the crisis showed the negative impact of COVID-19 on every investment strategy. SME-IPO and IPO firms lost the most because of the pandemic while low volatility firms were least affected. Even quality and momentum indices did not get much affected. IPOs are usually considered riskier investments, as is proved by the results of this study. The low volatility index, consisting of companies with lowest volatilities, showed least negative returns during the crisis period, as is expected of them. To study the volatility of different strategies, GARCH model was used. The results showed that total volatility has increased for all the strategies, except dividend stability and low volatility indices, during the crisis period. Investors following the strategies of IPO, SME-IPO, enhanced value, quality and momentum must be even more prepared for the uncertainties in the market. IPO is the most affected by COVID-19. Investors investing in IPOs must be most cautious.
The present study has direct implications for the investors as it can guide them in the investment decision process by giving them insights about the different strategies. By understanding the impact of COVID-19 on different investment strategies, they would know which strategies are sustainable even in events of such shocks to the economy. The periodic returns from different strategies showed that IPO and SME IPO fell the most among all the strategies studied. Generally, IPOs are considered to be riskier than the previously listed companies due to lack of publicly available information and disclosures about them. Retail investors are often advised to tread cautiously when investing in IPOs; the returns data supports this view. Only if the investors have the appetite for risk, they should invest in IPOs and SME IPOs. Undoubtedly, the investors are rewarded handsomely for the risk they take. IPO yielded the maximum positive return in the pre-crisis period among all the strategies. The results also revealed that volatility increased for all the strategies except dividend stability and low volatility during crisis. So, investors should not be lured by the bullish trend in stock markets, they must be aware that the volatility, representing risk, has increased simultaneously. This calls for even more caution from their side. Further, the sum of ARCH and GARCH effects is less than one, showing the mean reverting behaviour of the markets. This means investors can predict the market movements from past data. Also, higher volatility shows greater chances of bearish market and lower volatility shows higher chances of bullish markets (Chaudhary et al., 2020). This might mean that soon the markets may correct themselves.
Limitations and Future Scope of StudyDespite the contributions made by the present study, it suffers from some limitations which open doors for future study. The study is limited to Indian economy and equity investment strategies developed

International Journal of Business AnalyticsVolume 9 • Issue 1
13
by BSE. However, a sectoral or overall market analysis might be more comprehensive, giving insights about volatility of each sector during the pandemic. Similarly, cross-country analysis can be conducted in order to understand which country’s stock market is the most affected.

International Journal of Business AnalyticsVolume 9 • Issue 1
14
REFERENCES
AlAli, M. S. (2020a). The effect of WHO COVID-19 announcement on Asian Stock Markets returns: An event study analysis. Journal of Economics and Business, 3(3). Advance online publication. doi:10.31014/aior.1992.03.03.261
AlAli, M. S. (2020b). Risk Velocity and Financial Markets Performance: Measuring the Early Effect of COVID-19 Pandemic on Major Stock Markets Performance. International Journal of Economics and Financial Research, 6(4), 76–81. doi:10.32861/ijefr.64.76.81
Alam, M. M., Wei, H., & Wahid, A. N. (2020a). COVID‐19 outbreak and sectoral performance of the Australian stock market: An event study analysis. Australian Economic Papers, 12215. PMID:33349733
Alam, M. N., Alam, M. S., & Chavali, K. (2020b). Stock market response during COVID-19 lockdown period in India: An event study. The Journal of Asian Finance, Economics, and Business, 7(7), 131–137. doi:10.13106/jafeb.2020.vol7.no7.131
Ali, M., Alam, N., & Rizvi, S. A. R. (2020). Coronavirus (COVID-19)–An epidemic or pandemic for financial markets. Journal of Behavioral and Experimental Finance, 27, 100341. doi:10.1016/j.jbef.2020.100341 PMID:32427215
Ashraf, B. N. (2020). Stock markets’ reaction to COVID-19: Cases or fatalities? Research in International Business and Finance, 54, 101249. doi:10.1016/j.ribaf.2020.101249 PMID:34170989
Asia Index Pvt Ltd. (n.d.). S&P BSE momentum Index. Asia Index Pvt Ltd.
Baig, A., Hassan, A. B., Haroon, O., & Rizvi, S. A. R. (2020). Deaths, Panic, Lockdowns and US Equity Markets: The Case of COVID-19 Pandemic. Available at: https://www.ssrn.com/abstract=3584947
Ball, R., & Brown, P. (1968). An Empirical Evaluation of Accounting Income Numbers. Journal of Accounting Research, 6(2), 159–178. doi:10.2307/2490232
Bash, A. (2020). International evidence of COVID-19 and stock market returns: An event study analysis. International Journal of Economics and Financial Issues, 10(4), 34–38. doi:10.32479/ijefi.9941
Bollerslev, T. (1986). Generalized autoregressive conditional heteroskedasticity. Journal of Econometrics, 31(3), 307–327. doi:10.1016/0304-4076(86)90063-1
Bora, D., & Basistha, D. (2020). The outbreak of COVID-19 pandemic and its impact on stock market volatility: Evidence from a worst-affected economy. Available at: https://www.researchsquare.com/article/rs-57471/v1.pdf
BSE Company Overview. (2021). Bombay Stock Exchange. Retrieved from https://www.bseindia.com/static/about/Company_Overview.html
Chaudhary, R., Bakhshi, P., & Gupta, H. (2020). Volatility in International Stock Markets: An Empirical Study during COVID-19. Journal of Risk and Financial Management, 13(9), 208. doi:10.3390/jrfm13090208
Chen, C. D., Chen, C. C., Tang, W. W., & Huang, B. Y. (2009). The positive and negative impacts of the SARS outbreak: A case of the Taiwan industries. Journal of Developing Areas, 43(1), 281–293. doi:10.1353/jda.0.0041
Chen, M. H., Jang, S. S., & Kim, W. G. (2007). The impact of the SARS outbreak on Taiwanese hotel stock performance: An event-study approach. International Journal of Hospitality Management, 26(1), 200–212. doi:10.1016/j.ijhm.2005.11.004 PMID:32287849
Chou, Y. L. (1969). Statistical Analysts. Holt Rinehart and Winston.
Engle, R. F. (1982). Autoregressive conditional heteroscedasticity with estimates of the variance of United Kingdom inflation. Econometrica, 50(4), 987–1007. doi:10.2307/1912773
Fama, E., Fisher, L., Jensen, M. C., & Roll, R. (1969). The Adjustment of Stock Prices to New Information. International Economic Review, 10(1), 1–21. doi:10.2307/2525569
Gherghina, Ș. C., Armeanu, D. Ș., & Joldeș, C. C. (2020). Stock market reactions to Covid-19 pandemic outbreak: Quantitative evidence from ARDL bounds tests and Granger causality analysis. International Journal of Environmental Research and Public Health, 17(18), 6729. doi:10.3390/ijerph17186729 PMID:32942766

International Journal of Business AnalyticsVolume 9 • Issue 1
15
Göker, İ. E. K., Eren, B. S., & Karaca, S. S. (2020). The Impact of the COVID-19 (Coronavirus) on The Borsa Istanbul Sector Index Returns: An Event Study. Gaziantep Üniversitesi Sosyal Bilimler Dergisi, 19, 14-41.
Gujarati, D. N., & Porter, D. (2009). Basic econometrics (International Edition). McGraw-Hill.
Harjoto, M. A., Rossi, F., Lee, R., & Sergi, B. S. (2020). How do equity markets react to COVID-19? Evidence from emerging and developed countries. Journal of Economics and Business, 105966. PMID:33518845
Haroon, O., & Rizvi, S. A. R. (2020). Flatten the curve and stock market liquidity–an inquiry into emerging economies. Emerging Markets Finance & Trade, 56(10), 2151–2161. doi:10.1080/1540496X.2020.1784716
He, P., Sun, Y., Zhang, Y., & Li, T. (2020). COVID–19’s impact on stock prices across different sectors—An event study based on the Chinese stock market. Emerging Markets Finance & Trade, 56(10), 2198–2212. doi:10.1080/1540496X.2020.1785865
Ichev, R., & Marinč, M. (2018). Stock prices and geographic proximity of information: Evidence from the Ebola outbreak. International Review of Financial Analysis, 56, 153–166. doi:10.1016/j.irfa.2017.12.004
Karmakar, M. (2005). Modeling conditional volatility of the Indian stock markets. Vikalpa, 30(3), 21–38. doi:10.1177/0256090920050303
Lee, K. Y. M., Jais, M., & Chan, C. W. (2020). Impact of covid-19: Evidence from malaysian stock market. International Journal of Business and Society, 21(2), 607–628. doi:10.33736/ijbs.3274.2020
Liew, V. K. S. (2020). The effect of novel coronavirus pandemic on tourism share prices. Journal of Tourism Futures.
Liu, H., Manzoor, A., Wang, C., Zhang, L., & Manzoor, Z. (2020a). The COVID-19 outbreak and affected countries stock markets response. International Journal of Environmental Research and Public Health, 17(8), 2800. doi:10.3390/ijerph17082800 PMID:32325710
Liu, H., Wang, Y., He, D., & Wang, C. (2020b). Short term response of Chinese stock markets to the outbreak of COVID-19. Applied Economics, 52(53), 5859–5872. doi:10.1080/00036846.2020.1776837
Maneenop, S., & Kotcharin, S. (2020). The impacts of COVID-19 on the global airline industry: An event study approach. Journal of Air Transport Management, 89, 101920. doi:10.1016/j.jairtraman.2020.101920 PMID:32874021
Mishra, A. K., Rath, B. N., & Dash, A. K. (2020). Does the Indian Financial Market Nosedive because of the COVID-19 Outbreak, in Comparison to after Demonetisation and the GST? Emerging Markets Finance & Trade, 56(10), 2162–2180. doi:10.1080/1540496X.2020.1785425
Park, M., Jin, Y., & Bessler, D. (2008). The impacts of animal disease crises on the Korean meat market. Agricultural Economics, 39(2), 183–195. doi:10.1111/j.1574-0862.2008.00325.x
Pendell, D., & Cho, C. (2013). Stock market reactions to contagious animal disease outbreaks: An event study in Korean foot‐and‐mouth disease outbreaks. Agribusiness: An International Journal, 29(4), 455–468. doi:10.1002/agr.21346
Polemis, M., & Soursou, S. (2020). Assessing the impact of the COVID-19 pandemic on the Greek energy firms: An event study analysis. Energy Research Letters, 1(3), 17238. doi:10.46557/001c.17238
Predescu, O. M., & Stancu, S. (2011). Portfolio Risk Analysis using ARCH and GARCH Models in the Context of the Global Financial Crisis. Theoretical & Applied Economics, 18(2).
Rajamohan, S., Sathish, A., & Rahman, A. (2020). Impact of COVID-19 on stock price of NSE in automobile sector. Int. J. Adv. Multidiscip. Res, 7(7), 24–29.
Rohatgi, V. K. (1976). An Introduction to Probability Theory and Mathematical Statistics. J, Wiley & Sons.
Standard, B. (2021). UN expects India’s economy to recover by 7.3% post-Covid-19 impact. Business Standard. https://www.business-standard.com/article/economy-policy/un-expects-india-s-economy-to-recover-by-7-3-post-covid-19-impact-121012600144_1.html#:~:text=%C2%ABBack-,UN%20expects%20India’s%20economy%20to%20recover,%25%20post%2DCovid%2D19%20impact&text=The%20United%20Nations%20sees%20the,9.6%20per%20cent%20last%20year

International Journal of Business AnalyticsVolume 9 • Issue 1
16
Khushboo Gupta is currently a PhD scholar at Amity College of Commerce and Finance, Amity University, Noida, UP, India. She is also an Assistant Professor at Shaheed Bhagat Singh Evening College, University of Delhi. She has a teaching experience of more than 6 years. Her area of specialization is Finance.
Seshanwita Das is currently working as Associate Professor in School of Commerce, Finance and Accountancy, CHRIST (Deemed to be University), Delhi NCR. She has more than nineteen years of experience in teaching, research, academic administration and Industry. She has been extensively involved in various research activities including supervising PHD Scholars and at present has 6 scholars under her supervision. Dr. Das earned her PhD in Commerce from University of Rajasthan on the topic “FDI and Economic Development in the post Reform Era: A Case Study on Roads in Bridges Development”, M.Com from University of Rajasthan and M.Sc in Economics from University of Calcutta. She has published research papers in journals of national and international repute and has columned various news items on Doha Round on WTO. She has also conducted few webinars and FDPs on Statistical Methods and Operations Research.
Kanishka Gupta is an Assistant Professor at Symbiosis Centre for Management Studies, Noida. She has been awarded her Ph.D. in the field of Intellectual Capital from Amity University, Noida. She has taught as Guest faculty at University of Delhi. She has earned a gold medal for her exceptional academic performance during her Masters at Amity University, Noida. She obtained her bachelors with distinction from University of Delhi. Her areas of interest are corporate accounting and financial accounting. She has her research work published in esteemed journals indexed in Web of Science, Scopus and ABDC.
The Heilbrunn Center for Graham & Dodd Investing. (n.d.). Benjamin Graham Value Investing History Columbia Business School. Accessed on 12th January 2021, from: https://www8.gsb.columbia.edu/valueinvesting/about/history
The World Bank. (2021). A Subdued Recovery, with Damage to Undo. https://www.worldbank.org/en/news/feature/2021/01/05/global-economic-prospects
Today, I. (2021). Sensex at 50,000: 5 reasons that helped benchmark index cross milestone. India Today. https://www.indiatoday.in/business/story/sensex-at-50-000-5-reasons-behind-the-strong-market-rally-1761280-2021-01-21
Verma, D., & Sinha, P. K. (2020). Has COVID 19 Infected Indian Stock Market Volatility? Evidence from NSE. AAYAM: AKGIM Journal of Management, 10(1), 25–35.
WHO Timeline COVID-19. (2020). Available at: www.who.int/news-room/detail/27-04-2020-who-timeline–covid-19?gclid=Cj0KCQjw3Nv3BRC8ARIsAPh8hgIREXPpGQUjB3mxgIf3h4BvGxvY8Z7Q9SIasyf0_AHA7ItJdVkJf5waAoGxEALw_wcB
Xiong, H., Wu, Z., Hou, F., & Zhang, J. (2020). Which firm-specific characteristics affect the market reaction of Chinese listed companies to the COVID-19 pandemic? Emerging Markets Finance & Trade, 56(10), 2231–2242. doi:10.1080/1540496X.2020.1787151
YanB.StuartL.TuA.ZhangT. (2020). Analysis of the Effect of COVID-19 on the Stock Market and Investing Strategies. Available at SSRN 3563380.
Zhang, D., Hu, M., & Ji, Q. (2020). Financial markets under the global pandemic of COVID-19. Finance Research Letters, 101528, 2020. Advance online publication. doi:10.1016/j.frl.2020.101528 PMID:32837360