Embed Size (px)
Citation preview
International Journal of Agriculture and Environmental Research
ISSN: 2455-6939
Volume:03, Issue:03 "May-June 2017"
www.ijaer.in Copyright © IJAER 2017, All right reserved Page 3155
THE EFFECTS OF N FERTILIZER AND CROPPING SYSTEM WITH VARIATION OF SEED PLACEMENT ON GROWTH AND N UPTAKE OF
SUGARCANE AT ULTISOLS TULANG BAWANG, LAMPUNG, INDONESIA
Tavip Priyono1, Sri Nuryani Hidayah Utami2*, Makruf Nurudin3
1Postgraduate Program, Faculty of Agriculture, University of Gadjah Mada, Yogyakarta, Indonesia
2,3Faculty of Agriculture, University of Gadjah Mada, Indonesia
*Corresponding Author
ABSTRACT
In recent years, the national sugar demand has always been lower than the national sugar production. The imbalance is caused by sub-optimal cultivation and inefficiency of sugarcane fertilization. Efforts that can be done to improve the conditions are meeting the nutrients needs of sugar cane by N-fertilization according to the effective and efficient dosage, use high quality seeds, and planting the seeds with the appropriate systems. This study aimed to determine the effect of N fertilizer and cropping systems with some of seed placement to soil chemical properties, growth, and N uptake by sugarcane at ultisols in Tulang Bawang.The experiment was conducted in November 2015 - May 2016 at PT Sweet Indolampung, Tulang Bawang, Lampung. It was arranged in randomized complete block design (RCBD) two factors with three blocks as replication. The first factor was urea dosage consisting of 4 levels, i.e. without urea (U0), 165 kg/ha (U1), 329 kg/ha or standard fertilization of SGC (U2), and 494 kg/ha (U3). The second factor was cropping system with some of seed placement consisting of 6 levels, i.e. double row overlap of 25% (S1), double row overlap of 50% or standard use of SGC (S2), double row overlap 100% (S3), single row overlap 25% (S4), single row overlap of 50% (S5), single row overlap 100% (S6). The observations were done on several properties of soil chemical, nutrient uptake, and the plant growth variables. Data were analyzed using analysis of variance (ANOVA) at 5 % level, and continued with Duncan's Multiple Range Test (DMRT) at 5% level of significance. The results showed that there was no interaction between N fertilizing and cropping systems with variation of seed placement to all parameters (soil chemical properties, N uptake, growth, and production of sugarcane). Application of N fertilizer at ultisols in Tulang Bawang
International Journal of Agriculture and Environmental Research
ISSN: 2455-6939
Volume:03, Issue:03 "May-June 2017"
www.ijaer.in Copyright © IJAER 2017, All right reserved Page 3156
could not significantly affect soil pH, N-total, C-organic, and C/N ratio, but could significantly affect N uptake, efficiency of N uptake, plant height, leaf area, dry weight, and production of sugarcane aged 6 MAP. Meanwhile, cropping system with variation of seed placement could significantly affect soil pH, N-total, C/N ratio, N uptake, efficiency of N uptake, germination aged 40 DAP, population, plant height, leaf area, dry weight, and production of sugarcane aged 6 MAP. Application of 329 tons/ha of urea with cropping system of double row overlap 25% at ultisols in Tulang Bawang was the most effective and economic combination in improving soil fertility and stimulating growth and production of sugarcane aged 6 MAP.
Keywords: ultisols, urea, seed placement, double row, single row
INTRODUCTION
Sugar is one of the special commodities in agriculture declared by Indonesia in the World Trade Organization forum, together with rice, corn, and soy (Arifin, 2008). The sugar used for industrial raw material, a major commodity of Indonesia and widely cultivated, is (Saccharum officinarum L.), widely known as sugarcane. As reported by Dirjenbun (2013), the total national demand for sugar in 2014 was 5.7 million tons, with 2.96 million tons of the demand for direct consumption of the population and 2.74 million tons for industrial raw material. Meanwhile, the national production of sugar in 2014 was only 2.5 million tons, far less than the targeted production capacity of 2.96 million tons (Wijianti, 2014).
There are several issues which cause problems in the national sugar industry. The cultivation of sugarcane, which the has yet to be done fully professionally, and the global climate change anomaly, which affects negatively on the quality of crop harvest and yield, are contributing factors. The inefficiency of fertilization in sugarcane crops are also an important aspect affecting sugarcane productivity (Sutardjo, 1994).
Land owned by PT. Sweet Indolampung is identified as dry ultisols. According to Subandi (2007), Ultisols generally have a low pH levels, poor in essential macro-nutrients such as N, P, K, Ca, and Mg, poor in essential micro-nutrients including Zn, Mo, Cu, and B, and poor in organic material.
Ultisols (podzolic) also have low Cation Exchange Capacity (CEC), meaning that it is less capable of holding nutrients and therefore the nutrients are easily leached. Regarding the problems faced by ultisols, fertilization is an important means to improve soil fertility in order to increase agricultural products.
International Journal of Agriculture and Environmental Research
ISSN: 2455-6939
Volume:03, Issue:03 "May-June 2017"
www.ijaer.in Copyright © IJAER 2017, All right reserved Page 3157
One of the nutrients needed by crops in large quantities, especially sugarcane, is Nitrogen (N). The use of N-fertilizer aims to stimulate and increase vegetative growth. It is vital for low organic matter soils to be give N-fertilizer for the N nutrient for the crop is enough to sustain productivity. High content of nitrogen (45 – 46%) with high solubility in water can be extracted from urea. However, N-fertilizer is easily oxidized so that it rapidly evaporates and leached away before the crop can absorb it wholly (Hairiah et al., 2000).
Apart from the fertilization factor, the selection of the type, shape, varieties, age, location and number of buds of the seedlings, and the cropping systems are also important factors. According to Setyamidjaja and Azharni (1992), seedlings are the first and foremost factor in the success of sugarcane cultivation. Generally, sugarcane can be cultivated in single row and double row cropping systems (Srijantr,1988). Meanwhile, seed placement can be done end to end and overlapping ((Directorate of Technology, PT RNI, 2005). If the seedlings are of good quality and planted with the appropriate cropping systems and seed placement in nutrient-rich soil, then good growth of sugarcane will be expected. Regarding this matter, this research is conducted with the hope to identify the optimum urea dosage and cropping system with various seed placement for good growth of sugarcane in ultisol soil in Tulang Bawang.
MATERIALS AND METHODS
This research was done from November 2015 – May 2016 at land owned by PT Sweet Indolampung in Tulang Bawang Regency, Lampung Province. Sugarcane seedlings of TC-15 variety, urea fertilizer (specified to treatment), TSP fertilizer and stillage (specified to SGC standards), and water were used for this research. Equipment used was tractors and implements to cultivate land, tools for soil analysis, stationaries, a stopwatch, a measuring tape, and an oven. This research was conducted with Randomized Complete Block Design (RCBD) with 2 factors. The first factor was urea dosage with 4 levels of dosage: without urea (U0), 165 kg/ha (U1), 329 kg/ha which is standard SGC fertilization (U2), and 494 kg/ha (U3). The second factor was cropping system with 6 different seed placements, which were double row overlap 25% (S1), double row overlap 50% or standard SGC placement (S2), double row overlap 100% (S3), single row overlap 25% (S4), single row overlap 50% (S5), single row overlap 100% (S6). In total, there were 24 treatment combinations with 3 blocks of replication.
Application of urea fertilizer was done twice as basic fertilization (46 kg/ha or SGC standard) and supplementary fertilization (total dosage according to treatment minus basic fertilization dosage). Sugarcane seedlings were then planted according to cropping systems with various seed placement at the planting stage.

International Journal of Agriculture and Environmental Research
ISSN: 2455-6939
Volume:03, Issue:03 "May-June 2017"
www.ijaer.in Copyright © IJAER 2017, All right reserved Page 3158
In this research, observations of chemical properties of soil included pH, N-total, C-organic, and C/N ratio. Observation of the crops included N Uptake, efficiency of N uptake, germination, plant height, leaf area, dry weight, and sugarcane production. The data was analyzed with Analysis of Variance (ANOVA) at 5% level and then continued with Duncan Multiple Range Test (DMRT) at 5% level if there were significant differences between treatments. Optimum urea dosage was determined by regression analysis method, while the relationships between variables were determined by correlation analysis.
RESULT AND DISCUSSION
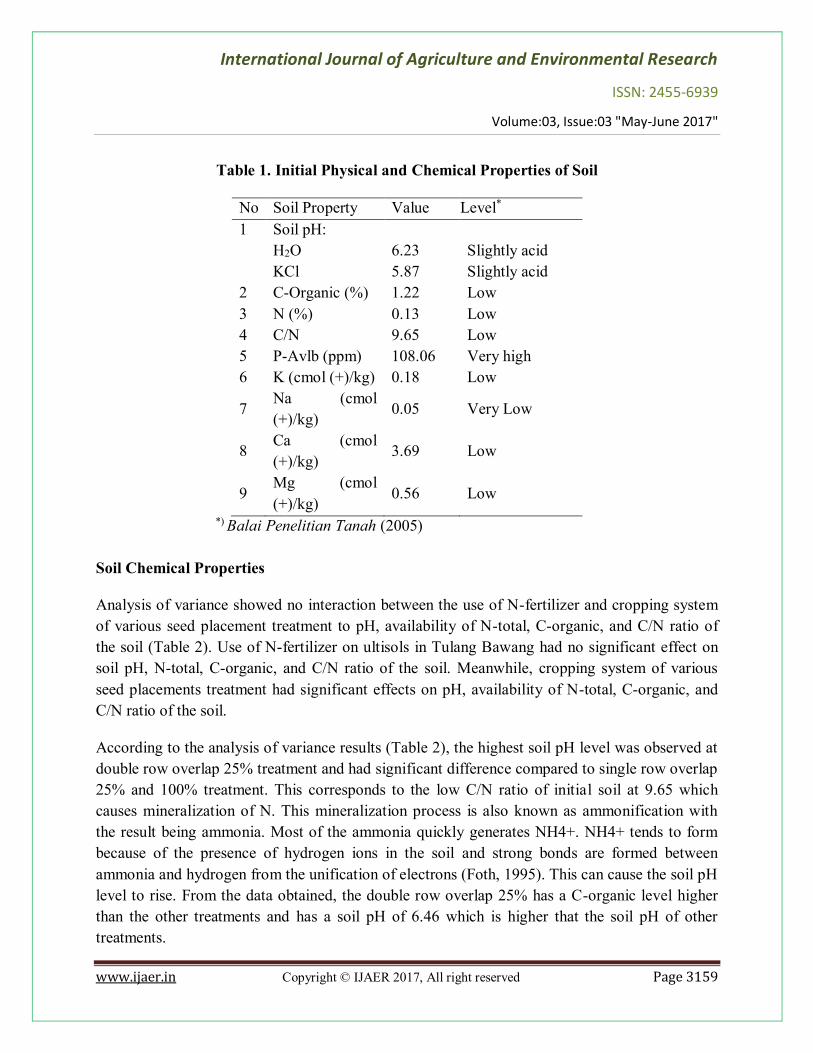
Initial soil analysis results show that the initial soil acidity level (pH) was acid (6.23). The soil acidity level (pH) greatly affects nutrient availability for the plant. At a slightly acidic level, the availability of nutrients indicated by the amount of nutrients and the soil nutrient balance were low with Ca and Mg levels at around 0.05 and 3.69. The high level of P was also caused by reside from previous fertilizers. Ultisols in general responded well to phosphate fertilizing. Low C-organic conditions (1.22) were caused by rapid decomposition and partly due to erosion. Initial soil analysis showed low levels of N (0.13%). According to Nyakpa et al. (1988), agricultural topsoil only contained 0.02 – 0.40% N. Nitrogen is needed by plant in large quantities and it is generally a limiting factor in unfertilized soils. Initial soil analysis data further shows C/N ratio at 9.65, indicating low carbon to nitrogen ratio. A C/N ratio lower than 20 indicates a mineralization process of N. Soil analysis shows K at 0.18, indicating low levels of K at the research site. This was caused by several factors, including annual loss of K from soil greater than loss of N and P. Another factor was that the nutrient K is more easily leached compared to P.
International Journal of Agriculture and Environmental Research
ISSN: 2455-6939
Volume:03, Issue:03 "May-June 2017"
www.ijaer.in Copyright © IJAER 2017, All right reserved Page 3159
Table 1. Initial Physical and Chemical Properties of Soil
No Soil Property Value Level* 1 Soil pH: H2O 6.23 Slightly acid
KCl 5.87 Slightly acid 2 C-Organic (%) 1.22 Low 3 N (%) 0.13 Low 4 C/N 9.65 Low 5 P-Avlb (ppm) 108.06 Very high 6 K (cmol (+)/kg) 0.18 Low
7 Na (cmol (+)/kg) 0.05 Very Low
8 Ca (cmol (+)/kg) 3.69 Low
9 Mg (cmol (+)/kg) 0.56 Low
*) Balai Penelitian Tanah (2005) Soil Chemical Properties
Analysis of variance showed no interaction between the use of N-fertilizer and cropping system of various seed placement treatment to pH, availability of N-total, C-organic, and C/N ratio of the soil (Table 2). Use of N-fertilizer on ultisols in Tulang Bawang had no significant effect on soil pH, N-total, C-organic, and C/N ratio of the soil. Meanwhile, cropping system of various seed placements treatment had significant effects on pH, availability of N-total, C-organic, and C/N ratio of the soil.
According to the analysis of variance results (Table 2), the highest soil pH level was observed at double row overlap 25% treatment and had significant difference compared to single row overlap 25% and 100% treatment. This corresponds to the low C/N ratio of initial soil at 9.65 which causes mineralization of N. This mineralization process is also known as ammonification with the result being ammonia. Most of the ammonia quickly generates NH4+. NH4+ tends to form because of the presence of hydrogen ions in the soil and strong bonds are formed between ammonia and hydrogen from the unification of electrons (Foth, 1995). This can cause the soil pH level to rise. From the data obtained, the double row overlap 25% has a C-organic level higher than the other treatments and has a soil pH of 6.46 which is higher that the soil pH of other treatments.
International Journal of Agriculture and Environmental Research
ISSN: 2455-6939
Volume:03, Issue:03 "May-June 2017"
www.ijaer.in Copyright © IJAER 2017, All right reserved Page 3160
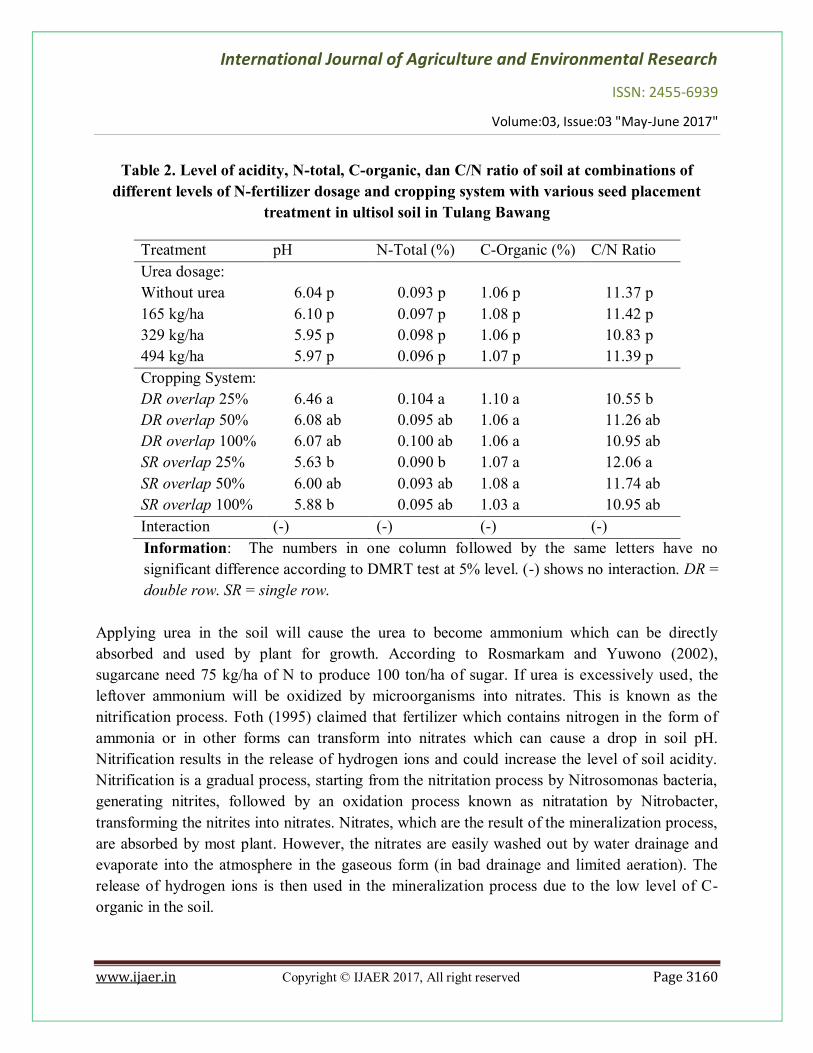
Table 2. Level of acidity, N-total, C-organic, dan C/N ratio of soil at combinations of different levels of N-fertilizer dosage and cropping system with various seed placement
treatment in ultisol soil in Tulang Bawang
Treatment pH N-Total (%) C-Organic (%) C/N Ratio Urea dosage: Without urea 6.04 p 0.093 p 1.06 p 11.37 p 165 kg/ha 6.10 p 0.097 p 1.08 p 11.42 p 329 kg/ha 5.95 p 0.098 p 1.06 p 10.83 p 494 kg/ha 5.97 p 0.096 p 1.07 p 11.39 p Cropping System: DR overlap 25% 6.46 a 0.104 a 1.10 a 10.55 b DR overlap 50% 6.08 ab 0.095 ab 1.06 a 11.26 ab DR overlap 100% 6.07 ab 0.100 ab 1.06 a 10.95 ab SR overlap 25% 5.63 b 0.090 b 1.07 a 12.06 a SR overlap 50% 6.00 ab 0.093 ab 1.08 a 11.74 ab SR overlap 100% 5.88 b 0.095 ab 1.03 a 10.95 ab Interaction (-) (-) (-) (-) Information: The numbers in one column followed by the same letters have no significant difference according to DMRT test at 5% level. (-) shows no interaction. DR = double row. SR = single row.
Applying urea in the soil will cause the urea to become ammonium which can be directly absorbed and used by plant for growth. According to Rosmarkam and Yuwono (2002), sugarcane need 75 kg/ha of N to produce 100 ton/ha of sugar. If urea is excessively used, the leftover ammonium will be oxidized by microorganisms into nitrates. This is known as the nitrification process. Foth (1995) claimed that fertilizer which contains nitrogen in the form of ammonia or in other forms can transform into nitrates which can cause a drop in soil pH. Nitrification results in the release of hydrogen ions and could increase the level of soil acidity. Nitrification is a gradual process, starting from the nitritation process by Nitrosomonas bacteria, generating nitrites, followed by an oxidation process known as nitratation by Nitrobacter, transforming the nitrites into nitrates. Nitrates, which are the result of the mineralization process, are absorbed by most plant. However, the nitrates are easily washed out by water drainage and evaporate into the atmosphere in the gaseous form (in bad drainage and limited aeration). The release of hydrogen ions is then used in the mineralization process due to the low level of C-organic in the soil.
International Journal of Agriculture and Environmental Research
ISSN: 2455-6939
Volume:03, Issue:03 "May-June 2017"
www.ijaer.in Copyright © IJAER 2017, All right reserved Page 3161
The soil N-total of the double row overlap 25% treatment shows significant differences with the single row overlap 25%. Double row overlap 25% had a soil pH higher than the other treatments at 0.104%. This caused a higher amount of NH4
+, which was not easily leached. Nitrogen is absorbed by the roots in the inorganic form of NH4
+ (ammonium) and NO3- (nitrate). The amount
of ammonium and nitrate formed is dependent on soil conditions. Nitrates are more plentiful in warm, moist soil with good aeration. A higher rate of NH4
+ uptake occurs when soil pH is greater than 5.5, while the same event for NO3
- occurs at soil pH lower than 5.5. NO3- generally
moves towards the roots due to flow of mass whereas NH4+ is immobile and movement of the
compound is generally due to diffusion and flow of mass (Sanchez, 1993).
Low initial soil N-total renders the use of N-fertilizer to have no significant effect on soil N-total. As seen in Table 2, as the dosage of N-fertilizer used increases, the soil N-total experienced minimal increases and therefore deemed insignificant. The use of urea had no significant effect on soil C-organic. Ultisol fertility is often determined solely by organic matter contents in the topsoil. If the topsoil is eroded, the soil becomes poor in organic matter and in essential nutrients (Prasetyo dan Suriadikarta, 2006).
Soil C/N ratio of the double row overlap 25% treatment is significantly lower than of the single row overlap 25% treatment. This is caused by the difference in the amount of C-organic which is higher at the double row overlap 25% treatment and leads to higher mineralization by microorganisms that convert organic nitrogen (proteins and amino compounds) into inorganic forms (NH4
+ and NO3-). The inorganic compounds are then available for the plant to absorb. The
increase in the amount of nitrogen at the double row overlap 25% treatment leads to a drop of C/N ratio to 10.55.
N Uptake
N uptake is the amount of N that can effectively be absorbed by plant tissue. The efficiency of N uptake is the percentage of the accumulation of N nutrient that is absorbed and/or used by plants from the amount of N-fertilizer used. Based on the result of analysis of variance (Table 3), there are no interactions between the use of N-fertilizer and the cropping system with various seed placement treatment to both N uptake and N uptake efficiency. The different levels of urea dosage and/or the cropping system with various seed placement treatment had significant effects on both N uptake and N uptake efficiency.
International Journal of Agriculture and Environmental Research
ISSN: 2455-6939
Volume:03, Issue:03 "May-June 2017"
www.ijaer.in Copyright © IJAER 2017, All right reserved Page 3162
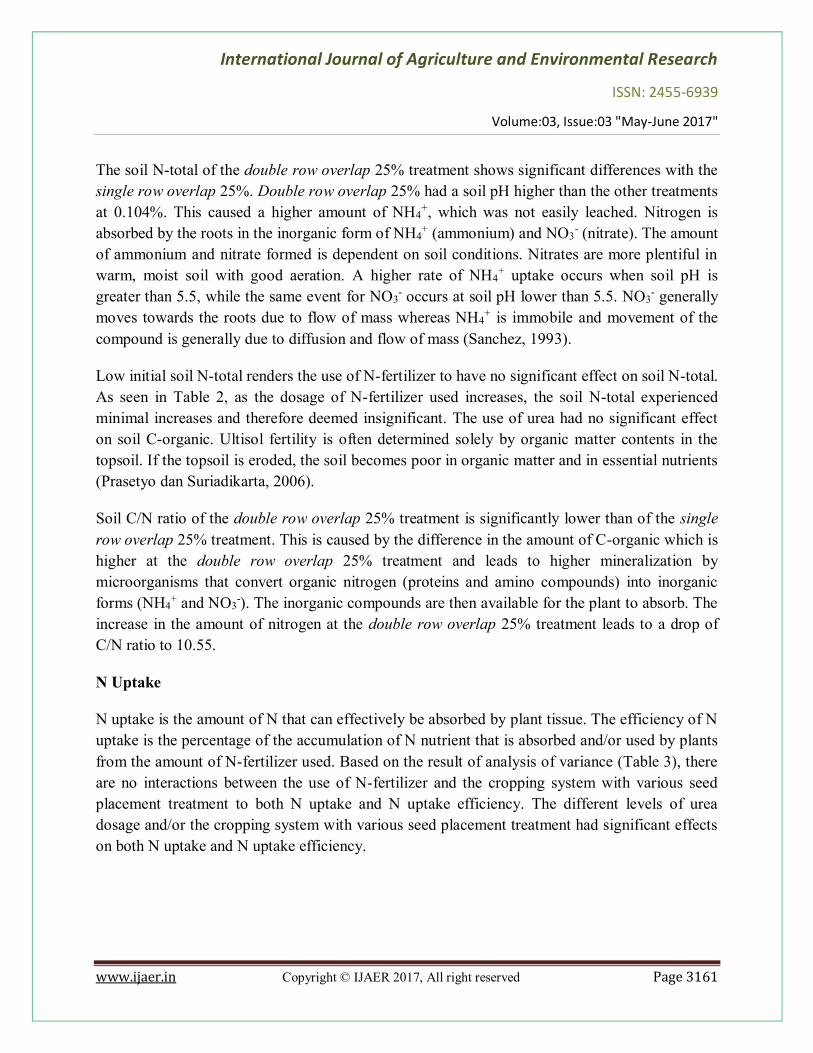
Table 3. N uptake and N uptake efficiency at combinations of different levels of N-fertilizer dosage and cropping system with various seed placement treatment in ultisol soil in Tulang
Bawang
Treatment N Uptake (kg/ha) N Uptake Efficiency (%) Urea dosage: Without urea 10.07 r 0.68 r 165 kg/ha 11.65 q 2.71 q 329 kg/ha 13.10 p 5.57 p 494 kg/ha 12.15 q 3.59 q Cropping System: DR overlap 25% 10.55 c 0.98 c DR overlap 50% 11.31 bc 2.48 bc DR overlap 100% 10.41 c 1.05 c SR overlap 25% 12.46 b 4.07 b SR overlap 50% 13.68 a 6.63 a SR overlap 100% 12.04 b 3.62 b Interaction (-) (-) Information: The numbers in one column followed by the same letters have no significant difference according to DMRT test at 5% level. (-) shows no interaction. DR = double row. SR = single row.
The use of 329 kg/ha of urea was able to produce the highest N uptake (13.10 kg/ha) and significantly different compared to other treatments. This is presumably due to a supply of N provided along with great N2 fixation rate and favorable photosynthetic rate of plant (Keyser and Fudi, 1992). The lowest N uptake (10.07 kg/ha) was obtained at the treatment with no urea applied. This is presumed due to the absence of N. From the cropping system treatments, the single row overlap 50% has the highest N uptake (13.68 kg/ha) and significantly different compared to other treatments. The double row overlap 25% (10.55 kg/ha) and 100% (10.41 kg/ha) resulted in the lowest N uptakes. It is also had no significant difference with double row overlap 50% (11.31 kg/ha) treatment. At all double row treatments, spacing between crops are less than all single row treatments. According to Suryono et al. (2012), crop spacing plays a role in the increase of N uptake of crops due to a wider space and area. This provides less competition for nutrient uptake between crops.
The 329 kg/ha urea dosage treatment show the highest N uptake efficiency (5.57%) and has significant difference compared to other treatments. The lowest N uptake efficiency (0.68%) is obtained from the treatment with no urea applied. From the cropping system treatments, the

International Journal of Agriculture and Environmental Research
ISSN: 2455-6939
Volume:03, Issue:03 "May-June 2017"
www.ijaer.in Copyright © IJAER 2017, All right reserved Page 3163
single row overlap 50% has the highest N uptake efficiency (6.63%) and has significant difference compared to other treatments. The lowest N uptake efficiency was experienced in row overlap 25% (0.98%) and 100% (1.05%), which had no significant difference with double row overlap 50% (2.48%). According to Baltibang (2002), excessive use of fertilizer can lower fertilizing efficiency and environmental quality. Besides the excessive use of fertilizer, fertilizing efficiency is also determined by the leaf distribution pattern and the capability of the plants to absorb and harness nutrients and water from the soil (Gonggo et al., 2006).
Picture 1. Curve showing the relation between urea dosage and N uptake of sugarcane ageing 6 MAP at various cropping system with various seed placement treatment.
Picture 1 shows the N uptake efficiency is unable to increase. Rather, it decreases even though higher dosage of urea is applied. The optimum N uptake of single row is also higher than double row treatments. According to (Gonggo et al., 2006), excessive use of N-fertilizer on crops with the hope of increased production will not guarantee maximum results. In this case, it is suspected that the fertilizer could not be fully absorbed and utilized by the crops. This si caused by the low level of synchronization between the time when supply of nutrients are available in the soil and the time when crops demand the supply of nutrients.
Growth and Production
The result from analysis of variance show that there are no interactions between the use of N-fertilizer with cropping system with various seed placement treatments on germinations ageing
International Journal of Agriculture and Environmental Research
ISSN: 2455-6939
Volume:03, Issue:03 "May-June 2017"
www.ijaer.in Copyright © IJAER 2017, All right reserved Page 3164
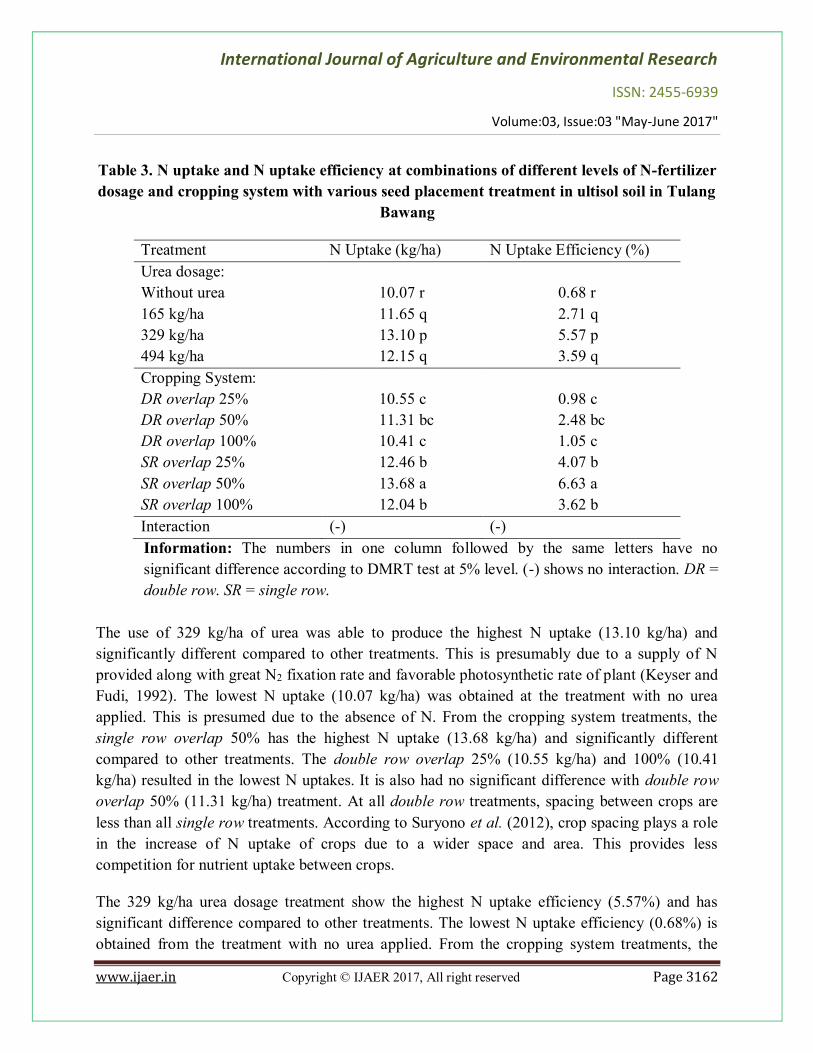
40 DAP population, crop height, leaf area, total dry weight, and on the production of sugarcane ageing 6 MAP (Table 4 and 5).
The cropping system with various seed placement treatments had significant effect on the germination percentage on sugarcane aged 40 DAP. Significant difference was observed on double row overlap 100% (99.40%) which was higher compared to other treatments except single row overlap 100% (98.75%). The high percentage of germination is presumably due to the high density of seed placement which caused the higher number of buds to be in ideal conditions, greatly increasing the chance of good growth.
The urea dosage treatment had no significant effect on the percentage of germination on sugarcane aged 40 DAP. This is caused by the same dosage of basic fertilization applied on all treatments. Strengthened by the statement of Soedhono (2009) that the growth phase of crops at the germination process is highly dependent on water and food supply in the seedling.
Significant difference on the population of sugarcane ageing 6 MAP was only observed at cropping system treatments. The highest population was observed at double row overlap 50% (134099) which had no significant difference with double row overlap 25% (131802) and 100% (131689). The lowest population was obtained from single row overlap 25% (80135) which had no significant difference with single row overlap 50% (84820). The low population at row overlap 25% is caused by a low number of buds due to low density of seed placements and higher distance of spacing between seeds.
Both the different levels of N dosage and cropping system with various seed placements treatment had significant effects on crop height. The highest crop at 6 MAP can clearly be observed at the 329 kg/ha urea dosage treatment (244.78 cm). This is slightly higher than the 494 kg/ha urea dosage treatment (240.67 cm). The shortest crop can be observed at the treatment with no urea applied (234.06 cm) which is slightly shorter than the 165 kg/ha urea dosage treatment (235.00 cm).

International Journal of Agriculture and Environmental Research
ISSN: 2455-6939
Volume:03, Issue:03 "May-June 2017"
www.ijaer.in Copyright © IJAER 2017, All right reserved Page 3165
Table 4. Germination age 40 DAP, population, height, and leaf area of sugarcane age 6 MAP at combinations of different levels of N-fertilizer dosage and cropping system with
various seed placement treatment in ultisol soil in Tulang Bawang
Treatment Germination (%) Population Height (cm) Leaf Area
(cm2) Urea Dosage: Without urea 97.38 p 106426 p 234.06 q 486.32 q 165 kg/ha 96.70 p 105991 p 235.00 q 520.42 p 329 kg/ha 97.52 p 111126 p 244.78 p 514.24 p 494 kg/ha 97.28 p 110150 p 240.67 p 519.90 p Cropping System: DR overlap 25% 96.97 c 131802 a 242.00 a 503.75 b DR overlap 50% 98.09 bc 134099 a 233.25 b 495.73 b DR overlap 100% 99.40 a 131689 a 235.83 ab 455.73 c SR overlap 25% 93.07 d 80135 c 239.67 a 551.04 a SR overlap 50% 97.03 c 84820 bc 241.25 a 530.73 ab SR overlap 100% 98.75 ab 87996 b 239.75 a 524.33 ab Interaction (-) (-) (-) (-) Information: The numbers in one column followed by the same letters have no significant difference according to DMRT test at 5% level. (-) shows no interaction. DR = double row. SR = single row.
Based on the cropping system treatments, significant effect can be seen on the tallest crop of the double row overlap 25% (242.00 cm) which is slightly taller than single row overlap 25% (239.67 cm), 50% (241.25 cm), 100% (239.75 cm), and double row overlap 100% (235.83 cm). Meanwhile, the shortest plant can be observed of double row overlap 50% (233.25 cm) which is slightly shorter than double row overlap 100% (235.83 cm).
The cropping system with various seed placement treatments in this research is closely linked with crop spacing. The lowest values obtained are suspected to be caused by competition between crops. Density of the crops become a limiting factor on crop growth and decreases the growth rate of the crop.
The different levels of urea dosage and cropping system with various seed placements treatments generate significant differences in values of leaf area. On the different levels of urea dosage treatments, the largest leaf area was observed at the 165 kg/ha urea dosage treatment (520.42 cm2) which was slightly larger than the 329 kg/ha urea dosage treatment (514.24 cm2).
International Journal of Agriculture and Environmental Research
ISSN: 2455-6939
Volume:03, Issue:03 "May-June 2017"
www.ijaer.in Copyright © IJAER 2017, All right reserved Page 3166
Meanwhile, the smallest leaf area was observed at the treatment with no urea applied (486.32 cm2).
Sufficient N-fertilization increases the leaves are of sugarcane which leads to a higher light interception. This increases photosynthesis (Soemarno, 2009).
Based on the cropping system treatments, the largest leaf area was observed from single row overlap 25% (551.04 cm2) which was slightly larger than single row overlap 50% (530.73 cm2) and 100% (524.33 cm2). The smallest leaf area was observed from double row overlap 100% (455.73 cm2). This result is supported by Gardner et al. (1991) which states that a higher density of crops would affect negatively on growth, rate of photosynthesis, and leaf development.
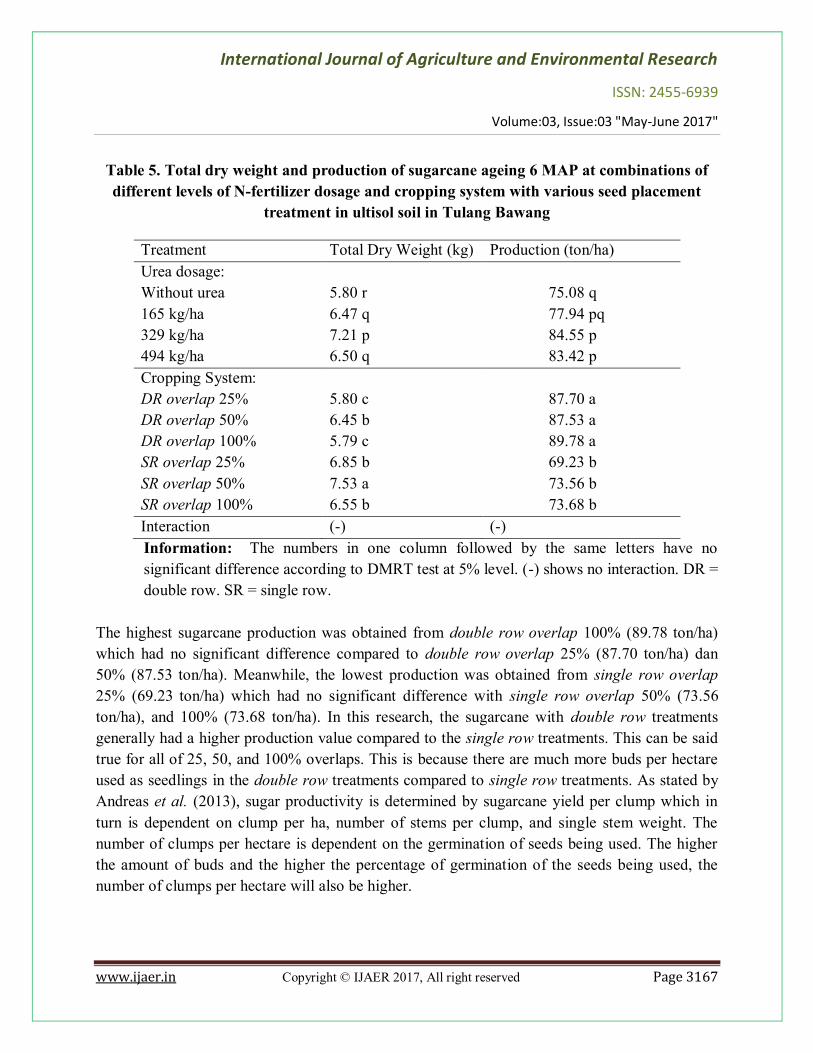
Table 5 shows that the different levels of urea dosage and cropping system treatments both have significant effects on the total dry weight of sugarcane ageing 6 MAP. The highest percentage of sugarcane growth was obtained from the 329 kg/ha urea dosage treatment (7.21 kg), which also had significant difference compared to other treatments. Meanwhile, the treatment with no urea applied (5.80 kg) showed the lowest growth percentage.
Based on the cropping system treatments, the highest total dry weight of sugarcane can be obtained from single row overlap 25% (7.53 kg), which also had significant difference compared to other treatments. The lowest total dry weight was obtained from double row overlap 25% (5.80 kg), which had no significant difference with the double row overlap 100% (5.79 kg). According to Kartasapoetra (1989), greater distances between crop spacing could result in higher stover dry weight compared to smaller distances between crop spacing. Smaller distances in crop spacing lead to competition of sunlight abosrbtion, further effecting nutrient, water, and air absorbption of the crops.
Both the different levels of urea dosage and cropping system with various seed placements have significant effects on sugarcane production ageing 6 MAP. The application of 329 kg/ha urea dosage treatmennt resulted in the highest production of sugarcane (84.55 ton/ha), but it is only slightly higher than the 494 kg/ha urea dosage treatment (83.42 ton/ha) and 165 kg/ha urea dosage treatment (77.94 ton/ha). The treatment with no urea applied resulted in th lowest production of sugarcane (75.08 ton/ha), which is also only slightly less than 165 kg/ha urea dosage treatment (77.94 ton/ha). According to Sundara (1998), nitrogen is an essential nutrient which affects the quality of sugarcane. This essential nutrient is required for vegetative growth. Vegetative growth in turn is directly linked with sugarcane production, which means that nitrogen is essential to increase sugarcane production.
International Journal of Agriculture and Environmental Research
ISSN: 2455-6939
Volume:03, Issue:03 "May-June 2017"
www.ijaer.in Copyright © IJAER 2017, All right reserved Page 3167
Table 5. Total dry weight and production of sugarcane ageing 6 MAP at combinations of different levels of N-fertilizer dosage and cropping system with various seed placement
treatment in ultisol soil in Tulang Bawang
Treatment Total Dry Weight (kg) Production (ton/ha) Urea dosage: Without urea 5.80 r 75.08 q 165 kg/ha 6.47 q 77.94 pq 329 kg/ha 7.21 p 84.55 p 494 kg/ha 6.50 q 83.42 p Cropping System: DR overlap 25% 5.80 c 87.70 a DR overlap 50% 6.45 b 87.53 a DR overlap 100% 5.79 c 89.78 a SR overlap 25% 6.85 b 69.23 b SR overlap 50% 7.53 a 73.56 b SR overlap 100% 6.55 b 73.68 b Interaction (-) (-) Information: The numbers in one column followed by the same letters have no significant difference according to DMRT test at 5% level. (-) shows no interaction. DR = double row. SR = single row.
The highest sugarcane production was obtained from double row overlap 100% (89.78 ton/ha) which had no significant difference compared to double row overlap 25% (87.70 ton/ha) dan 50% (87.53 ton/ha). Meanwhile, the lowest production was obtained from single row overlap 25% (69.23 ton/ha) which had no significant difference with single row overlap 50% (73.56 ton/ha), and 100% (73.68 ton/ha). In this research, the sugarcane with double row treatments generally had a higher production value compared to the single row treatments. This can be said true for all of 25, 50, and 100% overlaps. This is because there are much more buds per hectare used as seedlings in the double row treatments compared to single row treatments. As stated by Andreas et al. (2013), sugar productivity is determined by sugarcane yield per clump which in turn is dependent on clump per ha, number of stems per clump, and single stem weight. The number of clumps per hectare is dependent on the germination of seeds being used. The higher the amount of buds and the higher the percentage of germination of the seeds being used, the number of clumps per hectare will also be higher.
International Journal of Agriculture and Environmental Research
ISSN: 2455-6939
Volume:03, Issue:03 "May-June 2017"
www.ijaer.in Copyright © IJAER 2017, All right reserved Page 3168
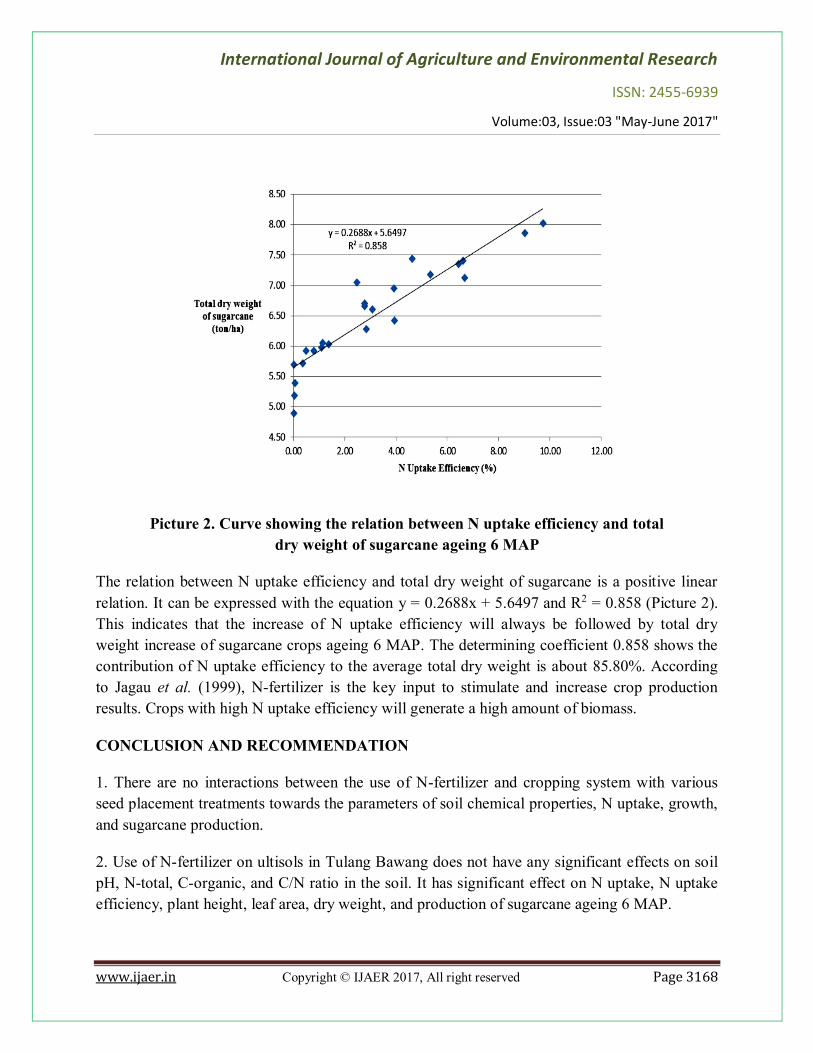
Picture 2. Curve showing the relation between N uptake efficiency and total dry weight of sugarcane ageing 6 MAP
The relation between N uptake efficiency and total dry weight of sugarcane is a positive linear relation. It can be expressed with the equation y = 0.2688x + 5.6497 and R2 = 0.858 (Picture 2). This indicates that the increase of N uptake efficiency will always be followed by total dry weight increase of sugarcane crops ageing 6 MAP. The determining coefficient 0.858 shows the contribution of N uptake efficiency to the average total dry weight is about 85.80%. According to Jagau et al. (1999), N-fertilizer is the key input to stimulate and increase crop production results. Crops with high N uptake efficiency will generate a high amount of biomass.
CONCLUSION AND RECOMMENDATION
1. There are no interactions between the use of N-fertilizer and cropping system with various seed placement treatments towards the parameters of soil chemical properties, N uptake, growth, and sugarcane production.
2. Use of N-fertilizer on ultisols in Tulang Bawang does not have any significant effects on soil pH, N-total, C-organic, and C/N ratio in the soil. It has significant effect on N uptake, N uptake efficiency, plant height, leaf area, dry weight, and production of sugarcane ageing 6 MAP.
International Journal of Agriculture and Environmental Research
ISSN: 2455-6939
Volume:03, Issue:03 "May-June 2017"
www.ijaer.in Copyright © IJAER 2017, All right reserved Page 3169
3. Cropping system with various seed placement treatments have significant effects on soil pH, N-total, C/N ratio, N uptake, N uptake efficiency, germination, population, plant height, leaf area, dry weight, and production of sugarcane ageing 6 MAP.
4. The 329 ton/ha N dosage and double row overlap 25% in ultisol in Tanah Bawang is the most effective and economical combination in improving soil fertility and stimulating growth and production of sugarcane ageing 6 MAP.
5. Further research is required to understand a more detailed effect of urea dosage and cropping system with various seed placement treatments on sugarcane ageing more than 6 MAP.
ACKNOWLEDGEMENT
The authors would like to express the gratitude to Dr. Purwaty Lee Cauhoult as the vice president director of Sugar Group Companies.. The authors would also like to thank the employee and staff of PT Sweet Indolampung which has helped and facilitated the authors in conducting the research thesis.
REFERENCES
Andreas, Q., P. Yudono, and R. Rogomulyo. 2013. Pengaruh macam bibit dan posisi penanaman terhadap pertunasan dan pertumbuhan awal bibit tebu (Saccharum officinarum L.). Vegetalika 4 (2): 55-62.
Arifin, B. 2008. Ekonomi Swasembada Gula Indonesia. Economic Review.
Balitbang. 2002. Uji tanah untuk pemupukan berimbang spesiik lokasi. Jurnal Penelitian dan Pengembangan Pertanian 24 (2): 1-2.
Direktorat Teknologi PT RNI. 2005. Budidaya Tebu di Lahan Sawah dan Tegalan. Direktorat Teknologi PT RNI. Jakarta.
Dirjenbun. 2013. Kebutuhan Gula Nasional Mencapai 5,700 Juta Ton Tahun 2014. <http://ditjenbun.pertanian.go.id/setditjenbun/berita-172-dirjenbun--kebutuhan-gula-nasional-mencapai-5700-juta-ton-tahun-2014.html>. Accessed on February 17th 2017.
Foth, H. D. 1995. Fundamentals of soil science, Translation of Purbayanti, E. D., Lukiwati, and Trimulatsih. Gadjah Mada University Press. Yogyakarta.

International Journal of Agriculture and Environmental Research
ISSN: 2455-6939
Volume:03, Issue:03 "May-June 2017"
www.ijaer.in Copyright © IJAER 2017, All right reserved Page 3170
Gardner, F. P., R. B. Pearce, and R. L. Mitchell. 1991. Fisiologi Tanaman Budidaya. Universitas Indonesia Press. Jakarta.
Gonggo, B., M. Hasanudin, and Y. Indriani. 2006. Peran pupuk nitrogen dan pospor terhadap serapan nitrogen, efisiensi nitrogen, dan hasil tanaman jahe di bawah tegakkan tanaman karet. Jurnal Ilmu Pertanian Indonesia 8: 61-68.
Hairiah K., Widianto, S. R. Otami, D. Suprayogo, Sunaryo, S. M. Sitompul, B. Lusiama, R. Mulia, M. V. Noordnizk and G. Cadish. 2000. Pengelolaan Tanah Masam secara Biologi. Universitas Lampung. Lampung.
Jagau, Y., H. Aswidinoor, S. H. Sutjahjo, and A. Makmur. 1999. Aksi gen dan heratibilitas efisiensi nitrogen dalam cekaman aluminium pada dua persilangan padi Gogo. Zuriat 10.
Kartasapoetra, A. G. 1989. Teknologi Penanganan Pasca Panen. Rineka Cipta. Jakarta.
Keyser, H. Harold and Li Fudi, 1992. Potential for increasing biological nitrogen fixation in soybean. Plant and Soil 141: 119-135.
Nyakpa, Y. 1988. Kesuburan Tanah. Universitas Lampung (UNILA). Lampung.
Prasetyo, B. H. and D. A. Suriadikarta. 2006. Karakteristik, potensi, dan teknologi pengelolaan tanah ultisol untuk pengembangan pertanian lahan kering di Indonesia. Jurnal Litbang Pertanian 25 (2).
Rosmarkam, A. and N. W. Yuwono. 2002. Ilmu Kesuburan Tanah. Kanisius. Yogyakarta.
Sanchez, P. A. 1993. Sifat and Pengelolaan Tanah Tropika. Institut Teknologi Bandung. Bandung.
Setyamidjaja, D. and H. Azharni. 1992. Tebu Bercocok Tanam dan Pasca Panen. CV. Yasaguna. Jakarta.
Srijantr, T., F. Molle, C. Chompadist. 1988. Profitability and yield gap of sugar cane cultivation in the Mae Klong region. Thai Agricultural Economic Journal, Vol.18 No.1, pp. 53–69
Soedhono. 2009. Faktor yang Berpengaruh terhadap Pola Tanaman Tebu. <http ://www.disbunjatim.co.id>. Accessed on March 30th 2017.
Soemarno. 2009. Pentingnya hara dan pupuk untuk meningkatkan rendemen tebu. Bahan Kajian dalam Mata Kuliah Pupuk dan Pemupukan. Universitas Brawijaya. Malang.
International Journal of Agriculture and Environmental Research
ISSN: 2455-6939
Volume:03, Issue:03 "May-June 2017"
www.ijaer.in Copyright © IJAER 2017, All right reserved Page 3171
Subandi. 2007. Teknologi Produksi dan Strategi Pengembangan Kedelai pada Lahan Kering Masam. Iptek Tanaman Pangan 1 : 1-25.
Sundara, B. 1998. Sugarcane Cultivation. First Edition. Vikas Publishing House Pvt Ltd, New Delhi.
Suryono, J. Syamsiyah, and D. Sulistyaningrum. 2012. Pengaruh jarak tanam dan dosis pupuk ZA terhadap ketersediaan dan serapan N, S dengan indikator tanaman kacang tanah (Arachis hypogaea L.) di alfisols Karanganyar. Jurnal Ilmu Tanah dan Agroklimatologi 9 (2): 138-146.
Sutardjo, R. M. E. 1994. Budidaya Tanaman Tebu. PT Bumi Aksara. Jakarta.
Wijianti, 2014. Produksi Gula Hanya 2,5 Juta Ton. <http://agroindonesia.co.id/2014/07/ 23/produksi-gula-hanya-25-juta-ton/>. Accessed on February 17th 2015.