Embed Size (px)
Citation preview
International Food Commodity Prices and
Missing Dis(Inflation) in the Euro Area
Gert Peersman
UGent

• Surprisingly little is known about macroeconomic effects of disruptions in global
food commodity markets (e.g. no quantitative evidence for advanced economies)
– E.g. 17% of US household expenditures are food related, of which (in turn) 14%
raw commodities: this corresponds to ±900 USD food commodity
expenditures per capita per year (compared to e.g. ±750 USD crude oil)
• Climate change: there will be a rise in variability and frequency of extreme
weather events in major agricultural producing regions (IPCC, 2019)
– E.g. extreme droughts in Russia and Eastern Europe in summer 2010 raised
global real food commodity prices by almost 30%
• Needed to analyze effects of policies that may influence food prices: public food
security programs, agricultural trade policies, ethanol subsidies, …
Motivation of research agenda

• Relevance of fluctuations in international food commodity prices for euro area
inflation dynamics: there have been substantial price swings, while food
commodities are critical input factor in food production function
This paper
0
20
40
60
80
100
120
140
160
1999 2002 2005 2008 2011 2014 2017
Real international food commodity price index (USD, pps) - left axis
+46%-68%
+70%
-50%

• Food related items have, in turn, very large share in Harmonized Index of
Consumer Prices
• Are even more important for formation of inflation expectations of households
– Survey of Norges Bank: 61% of households consider “prices of food” as factor
that influences inflation expectations most
This paper
HICP – Food related items 27.4%
Processed food 12.1%
Unprocessed food 7.5%
Catering services 7.8%
HICP – Industrial goods excluding Energy 26.3%
HICP – Energy 9.7%
HICP – Services excluding catering 36.6%
HICP – Overall index 100.0%
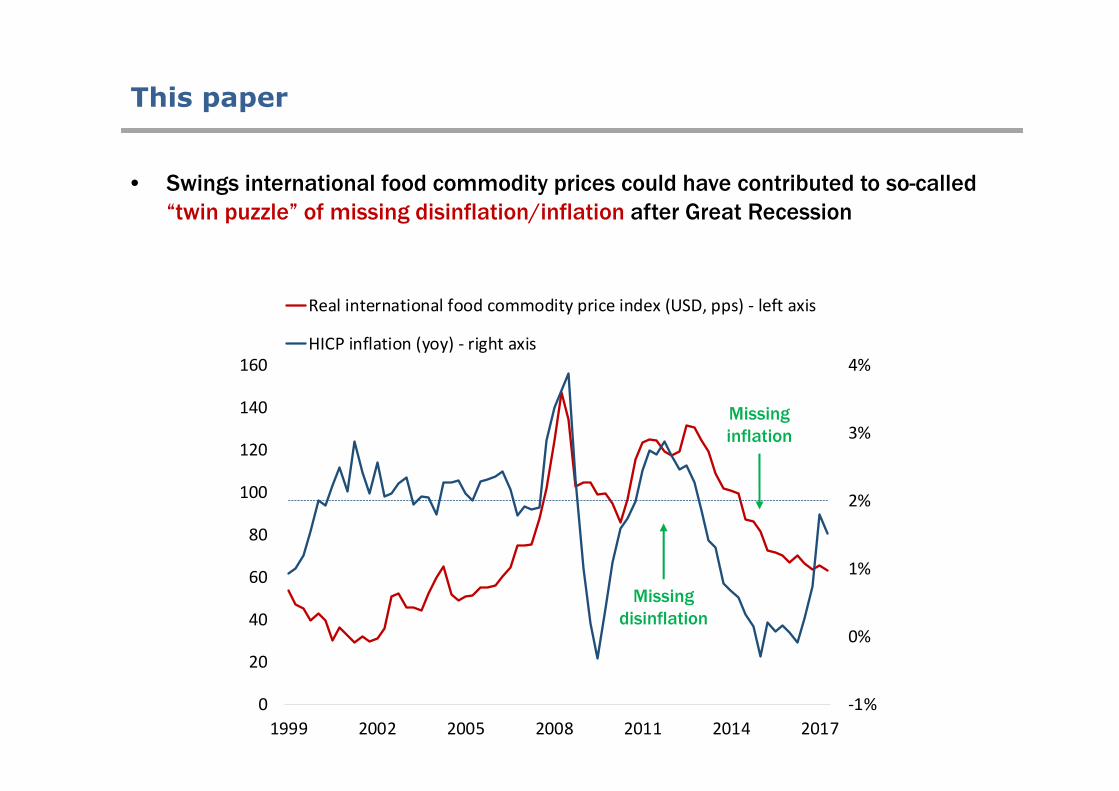
• Swings international food commodity prices could have contributed to so-called
“twin puzzle” of missing disinflation/inflation after Great Recession
This paper
-1%
0%
1%
2%
3%
4%
0
20
40
60
80
100
120
140
160
1999 2002 2005 2008 2011 2014 2017
Real international food commodity price index (USD, pps) - left axis
HICP inflation (yoy) - right axis
Missing
disinflation
Missing
inflation

• E.g. Fed, ECB, IMF: reduced-form time series models that only explore
unconditional co-movement in data: pricing chain assumption
– In essence, these studies regress changes in consumer prices on
contemporaneous and lagged changes in food commodity prices
– Can be informative about signaling role (correlation) of food commodity prices
for future inflation, but cannot be given causal interpretation
Existing studies
Food commodity prices Consumer prices
Aggregate demand, oil price
or other shocks
?

• Estimation of causal effects of shifts in international food commodity prices on
euro area inflation dynamics for period 1970Q1–2016Q4
– Methodology: Structural Vector Autoregressive (SVAR) models with external
instruments in spirit of Stock and Watson (2012), Mertens and Ravn (2014)
• Unanticipated harvest shocks are used as an external instrument to
identify exogenous food commodity price shocks
– Examination of contribution to “twin puzzle” of missing deflation/inflation and
relevance for inflation fluctuations
– Analysis of pass-through
Contribution of this paper
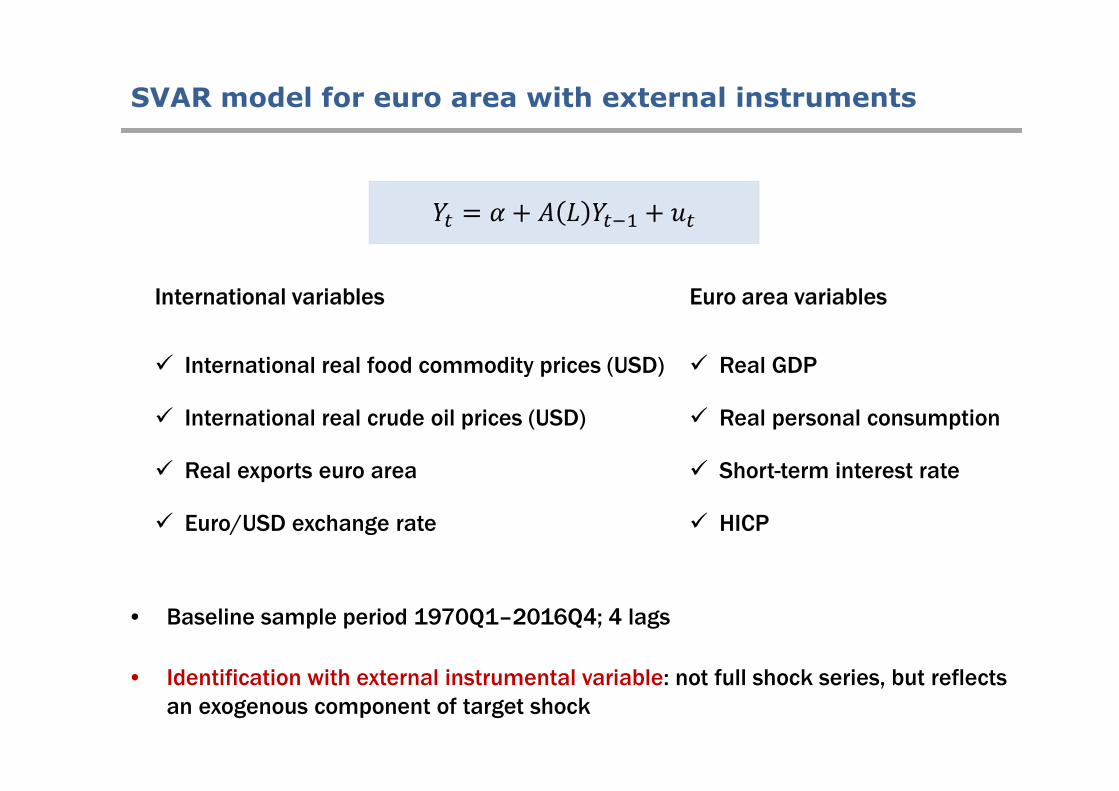
SVAR model for euro area with external instruments
International variables
International real food commodity prices (USD)
International real crude oil prices (USD)
Real exports euro area
Euro/USD exchange rate
Euro area variables
Real GDP
Real personal consumption
Short-term interest rate
HICP
• Baseline sample period 1970Q1–2016Q4; 4 lags
• Identification with external instrumental variable: not full shock series, but reflects
an exogenous component of target shock

• Explore fact that harvests cannot respond within quarter to economic shocks due
to time lag of 3-10 months between planting and harvest of cereal commodities
– While actual harvests are subject to unanticipated autonomous shocks: e.g.
caused by weather variation, pests or diseases
• FAO publishes annual harvest data of four most important staples (corn, wheat,
rice and soybeans) for 192 countries since early 1960s
– De Winne and Peersman (2016): combine annual harvest data with crop
calendars of each country to construct quarterly harvest volumes
Unanticipated harvest shocks
J F M A M J J A S O N D
Kazakhstan Wheat
Planting Harvesting
Country CropMonth
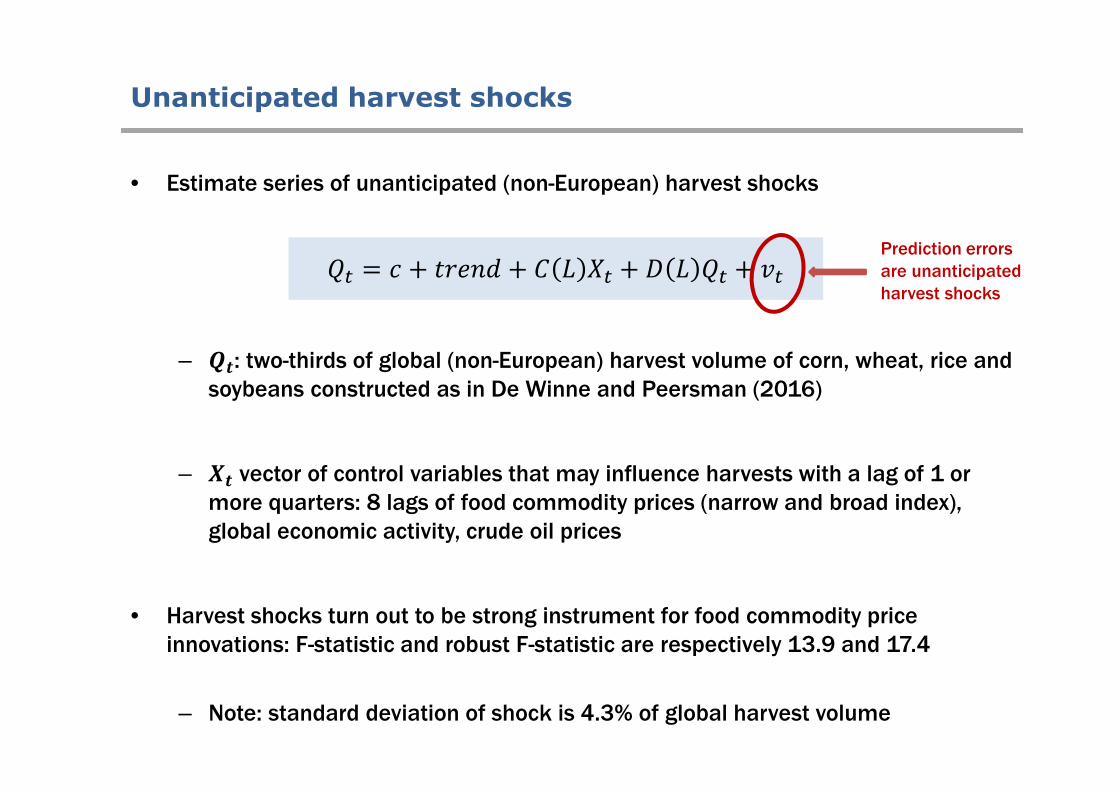
• Estimate series of unanticipated (non-European) harvest shocks
– ��: two-thirds of global (non-European) harvest volume of corn, wheat, rice and
soybeans constructed as in De Winne and Peersman (2016)
– �� vector of control variables that may influence harvests with a lag of 1 or
more quarters: 8 lags of food commodity prices (narrow and broad index),
global economic activity, crude oil prices
• Harvest shocks turn out to be strong instrument for food commodity price
innovations: F-statistic and robust F-statistic are respectively 13.9 and 17.4
– Note: standard deviation of shock is 4.3% of global harvest volume
Unanticipated harvest shocks
�� = � + �� + � � �� + � � �� + ��Prediction errors
are unanticipated
harvest shocks
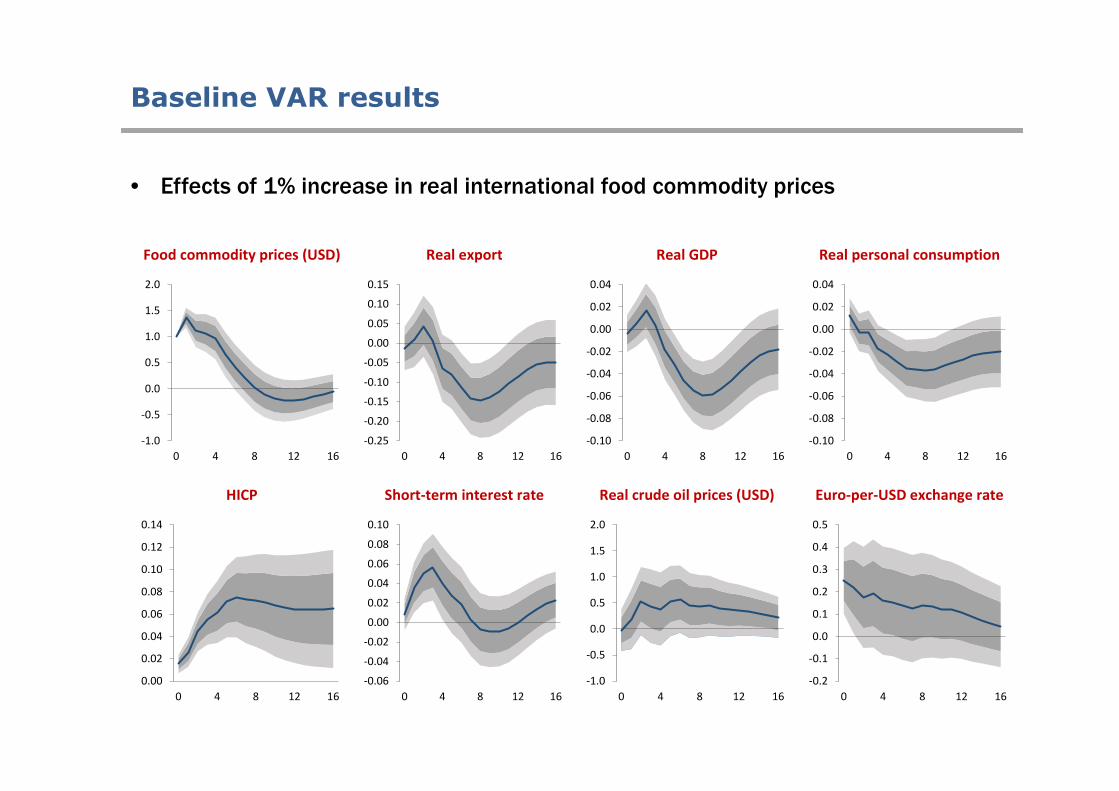
Baseline VAR results
• Effects of 1% increase in real international food commodity prices
Food commodity prices (USD) Real export Real GDP
HICP Real crude oil prices (USD) Euro-per-USD exchange rate
Real personal consumption
Short-term interest rate
-1.0
-0.5
0.0
0.5
1.0
1.5
2.0
0 4 8 12 16
-0.25
-0.20
-0.15
-0.10
-0.05
0.00
0.05
0.10
0.15
0 4 8 12 16
0.00
0.02
0.04
0.06
0.08
0.10
0.12
0.14
0 4 8 12 16
-1.0
-0.5
0.0
0.5
1.0
1.5
2.0
0 4 8 12 16
-0.2
-0.1
0.0
0.1
0.2
0.3
0.4
0.5
0 4 8 12 16
-0.10
-0.08
-0.06
-0.04
-0.02
0.00
0.02
0.04
0 4 8 12 16
-0.06
-0.04
-0.02
0.00
0.02
0.04
0.06
0.08
0.10
0 4 8 12 16
-0.10
-0.08
-0.06
-0.04
-0.02
0.00
0.02
0.04
0 4 8 12 16
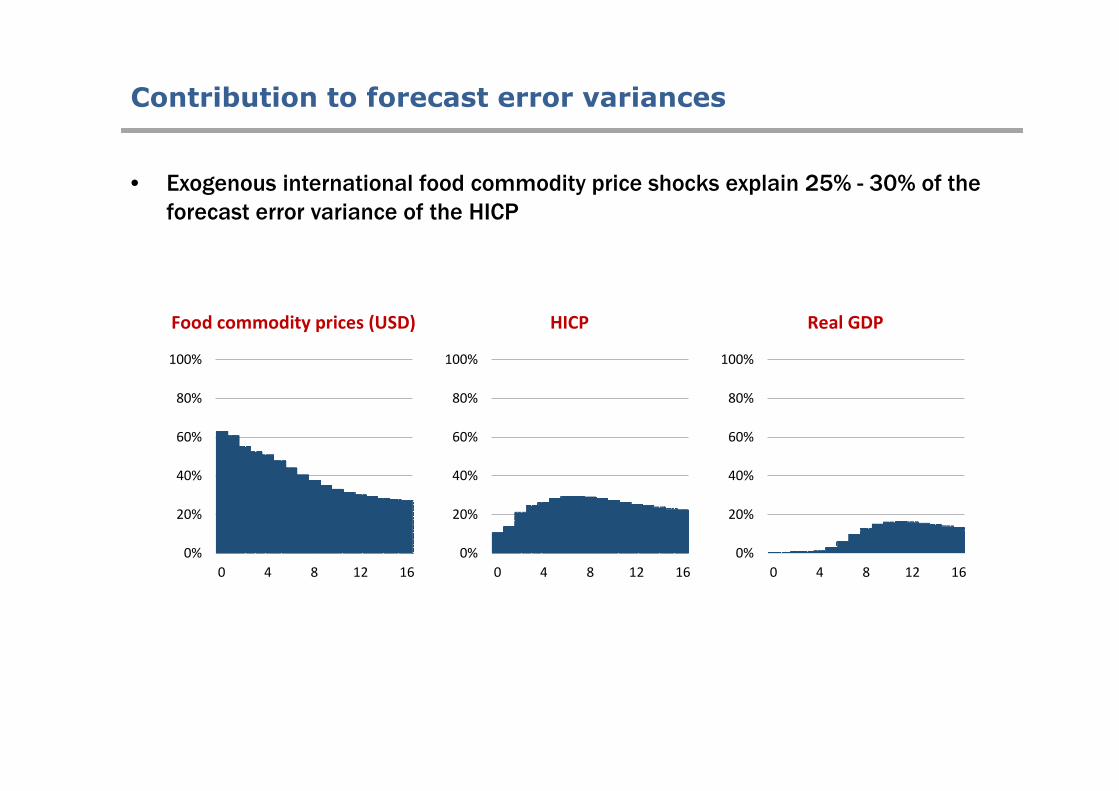
• Exogenous international food commodity price shocks explain 25% - 30% of the
forecast error variance of the HICP
Contribution to forecast error variances
Food commodity prices (USD) Real GDPHICP
0%
20%
40%
60%
80%
100%
0 4 8 12 16
0%
20%
40%
60%
80%
100%
0 4 8 12 16
0%
20%
40%
60%
80%
100%
0 4 8 12 16

Impact on food commodity prices: counterfactual analysis
0
40
80
120
160
2000 2004 2008 2012 2016
counterfactual without food commodity price shocks
baseline evolution VAR
actual evolution18% 12%
26%

Impact on annual HICP inflation: counterfactual analysis
-1
0
1
2
3
4
2000 2004 2008 2012 2016
counterfactual without food commodity price shocks
baseline evolution VAR
actual evolution
inflation target0.2% - 0.8%
0.5% - 1.0%

• Construction of (sub)indexes for EU farm-gate and internal market prices
– Not only a rise of international food commodity prices (=import prices), also a
(less than proportional) rise of EU internal market and farm-gate prices
• Note: large fraction of cereal commodities are used to feed animals,
which augments production costs of meat and dairy products
Effects through the food production chain
EU cereal commodity prices EU meat commodity prices EU dairy commodity prices EU fruit commodity prices
-0.8
-0.4
0.0
0.4
0.8
1.2
1.6
0 4 8 12 16
-0.8
-0.4
0.0
0.4
0.8
1.2
1.6
0 4 8 12 16
-0.8
-0.4
0.0
0.4
0.8
1.2
1.6
0 4 8 12 16
-0.8
-0.4
0.0
0.4
0.8
1.2
1.6
0 4 8 12 16

Effects through the food production chain
• Significant (less than proportional) pass-through to retail prices of food in HICP
Response of HICP excluding food and energy
Meat Fish Fruit Vegetables
Bread and cereals Milk, cheese and eggs Oils and fats Sugar products
-0.1
0.0
0.1
0.2
0.3
0 4 8 12 16
-0.1
0.0
0.1
0.2
0.3
0 4 8 12 16
-0.1
0.0
0.1
0.2
0.3
0 4 8 12 16
-0.1
0.0
0.1
0.2
0.3
0 4 8 12 16
-0.1
0.0
0.1
0.2
0.3
0 4 8 12 16
-0.1
0.0
0.1
0.2
0.3
0 4 8 12 16
-0.1
0.0
0.1
0.2
0.3
0 4 8 12 16
-0.1
0.0
0.1
0.2
0.3
0 4 8 12 16

Effects through the food production chain
• Impact on food services is, however, not larger than impact on non-food products
Response of HICP excluding food and energy
Catering services Restaurants, cafes, … Canteens
-0.1
0.0
0.1
0.2
0.3
0 4 8 12 16
-0.1
0.0
0.1
0.2
0.3
0 4 8 12 16
-0.1
0.0
0.1
0.2
0.3
0 4 8 12 16

Indirect effects of international food price shocks
• There is also significant increase of HICP excluding food and energy, as well as
HICP energy…
HICP - excl energy and food HICP - energy
HICP - processed foodHICP - unprocessed food
-0.1
0.0
0.1
0.2
0.3
0 4 8 12 16
-0.1
0.0
0.1
0.2
0.3
0 4 8 12 16
-0.1
0.0
0.1
0.2
0.3
0 4 8 12 16
-0.1
0.0
0.1
0.2
0.3
0 4 8 12 16

Indirect effects of international food price shocks
• Can be explained by depreciation of euro (higher import prices, including oil prices
in euro’s) and second-round effects via rising inflation expectations and wages
Nominal wagesPrice expectations (EC survey)
Nominal effective exchange rate Import deflator
Inflation expectations (SPF)
Real crude oil prices (USD)
-0.1
0.0
0.1
0.2
0.3
0.4
0 4 8 12 16
-0.1
0.0
0.1
0.2
0.3
0.4
0 4 8 12 16
-0.04
-0.03
-0.02
-0.01
0.00
0.01
0.02
0.03
0 4 8 12 16
-0.3
-0.2
-0.1
0.0
0.1
0.2
0.3
0.4
0.5
0.6
0.7
0 4 8 12 16
-0.1
0.0
0.1
0.2
0 4 8 12 16
-1.0
-0.5
0.0
0.5
1.0
1.5
2.0
0 4 8 12 16

Post-1990 sample period
• There appears to be smaller and less persistent impact on HICP in more recent
sample period (1990Q1–2016Q4)
– Does not matter for variance decomposition and contribution to twin puzzle
after Great Recession
Baseline VAR Post 1990 sample period
Impact on HICP Variance decomposition HICP Historical contribution to HICP
-0.02
-0.01
0.00
0.01
0.02
0.03
0.04
0.05
0.06
0.07
0.08
0 4 8 12 16
0%
20%
40%
60%
80%
100%
0 4 8 12 16
-1.0
-0.5
0.0
0.5
1.0
2000 2004 2008 2012 2016

Post-1990 sample period
• Effects through food production chain are quite similar in post-1990 sample
• Indirect effects on HICP excluding energy and food have changed: more subdued
depreciation and much less second-round effects via rising wages
• On other hand: there have been spillover effects of food commodity price shocks
on oil prices in recent sample period, resulting in stronger impact on HICP energy
– Peersman et al. (2019): NOT because of biofuels, but spillovers between
commodity prices as a consequence of price discovery in more globalized and
financialized commodity markets in the presence of informational frictions

• Fluctuations in food commodity prices matter for euro area inflation dynamics
– Relatively strong impact on HICP, explaining 25%-30% of forecast variance
– Economic relevant influence on both missing deflation and inflation in
aftermath Great Recession
• Direct transmission channel through the food production chain, but also indirect
effects via depreciation of euro and second-round effects of rising wages
• There appears to be time-variation in the pass-through: smaller and less persistent
effects due to reduction of the indirect effects
Conclusions