Embed Size (px)
Citation preview

“International Finance and Payments”
Lecture V
“Cost of International Capital”
Lect. Cristian PĂUNLect. Cristian PĂUN
Email: Email: [email protected]
URL: http://www.finint.ase.roURL: http://www.finint.ase.ro
Academy of Economic Studies
Faculty of International Business and Economics

Course 2: International Financial Markets and Institutions 2
International portfolio theory - review
• the difference between certainty, risk and uncertainty in international financing;
• investment decision is based on risk and return profile;
• investors expectations in terms of return are based on their risk assessment (direct relationship);
• investors associate an utility function to their expected returns;
• we have different risk attitudes;
• modern portfolio theory:
• Markovitz – efficient frontier
• CAPM (W. Sharpe) – beta and market portfolio
• APT (S. Ross) – arbitrage and market equilibrium
• active and passive portfolio management.

Course 2: International Financial Markets and Institutions 3
Interest rate and market equilibrium• interest rate = compensation required by the investors because they lend money for a determined period of time;
• interest rate = market equilibrium between demand and supply of money;
Supply curveDemand curve950 $ 5.3%
900 $ 11.1%
i=RET=(FV-P)/P
Quantity of bonds
750 $ 33 %
100 bil. 500 bil.
850 $ 17.6%E
300 bil.
Interest rateSecurity price

Course 2: International Financial Markets and Institutions 4
Shifts in the demand for bonds• Wealth;
• Expected returns on bonds relative to alternative assets;
• Expected inflation
• Risk of bonds relative to alternative assets;
• Liquidity of bonds relative to alternative assets.
Shifts in the supply for bonds• Expected profitability of investment opportunities (increase);
• Expected inflation (real cost of financing is falling down);
• Government activities (public deficits).
Fisher effect: when expected inflation rises, interest rates will rise
Liquidity preference framework: BD+MD=BS+MS (Keynes)(no real assets)
Course 2: International Financial Markets and Institutions 5
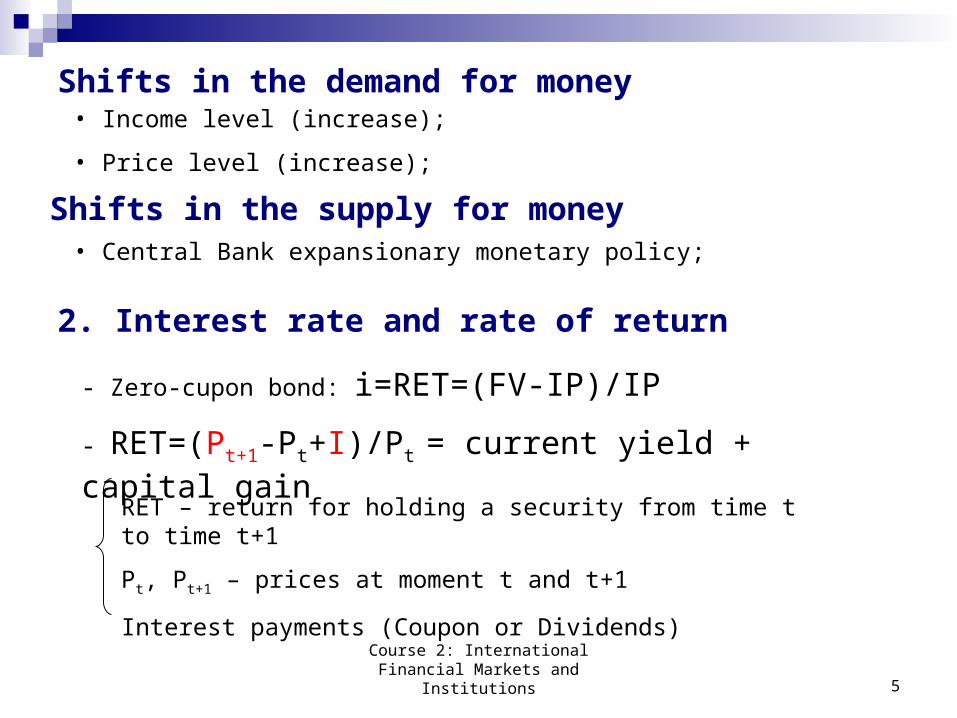
Shifts in the demand for money• Income level (increase);
• Price level (increase);
Shifts in the supply for money• Central Bank expansionary monetary policy;
2. Interest rate and rate of return
- Zero-cupon bond: i=RET=(FV-IP)/IP
- RET=(Pt+1-Pt+I)/Pt = current yield + capital gain
RET – return for holding a security from time t to time t+1
Pt, Pt+1 – prices at moment t and t+1
Interest payments (Coupon or Dividends)

Course 2: International Financial Markets and Institutions 6
Real and Nominal Interest Rate
Simple and Compounded Interest Rate
Risk Free Interest Rate
Inominal=Ireal+Inflation
(1+Inominal)=(1+Ireal)x(1+p) - Fisher Effect
RFR=(FVT-Bills-IPT-Bills)/IPT-Bills
100 USD = IP 110 USD = FV
1)Per
D(1D Persimple
compounded

Course 2: International Financial Markets and Institutions 7
Risk Structure of Interest Rate
- Default risk = the chance that the issuer of the bond will be unable to make interest payments or pay off the face value at the maturity;
Aaa Baa Caa (Moody’s)
AAA BBB CCC D (S&P)
Ex:
B Companies: Mariott, Revlon
AA Companies: McDonalds, Mobil Oil
AAA Companies: General Electric, Wisconsin Bell
- Liquidity = the capacity of a security to be cheaply and quickly converted into cash
- Income Tax Consideration: in case of Municipal Bonds vs. T-Bonds

Course 2: International Financial Markets and Institutions 8
Term Structure of Interest Rate
- Securities with identical risk, liquidity and income tax characteristics may have different interest rates because the maturity is different
- Yield Curve plots the yields on bonds with different terms to maturity but identical risk, liquidity and tax characteristics
US Treasury Yield Curve / November 2004Date 1 mo 3 mo 6 mo 1 yr 2 yr 3 yr 5 yr 7 yr 10 yr 20 yr
11/01/04 1.79 1.99 2.20 2.34 2.61 2.89 3.36 3.76 4.11 4.84
11/02/04 1.86 1.97 2.19 2.33 2.60 2.86 3.34 3.75 4.10 4.84
11/03/04 1.83 1.96 2.18 2.32 2.60 2.85 3.35 3.74 4.09 4.83
Maturity
Yield
Yield CurveSecurities with longer maturities usually have a higher yield. If short term securities offer a higher yield, then the curve is said to be inverted.

Course 2: International Financial Markets and Institutions 9
Cost of International Capital
International Financing Plan
Credit Years Payoffs Interest An RemainKValue 200000 euro 1 0 0 0 220000Interest Rate 10% 2 0 0 0 242000Maturity 5 years 3 80667 24200 104867 161333Reimboursement equally 4 80667 16133 96800 80667
5 80667 8067 88733 0290400
Current Yield = period
1
C
CA
0
0n
Current Yield = 9.04%
Step 1: Determine the proportions of each source to be raised as capital.
Step 2: Determine the marginal cost of each source.
Step 3: Calculate the weighted average cost of capital.

Course 2: International Financial Markets and Institutions 10
Cost of International Capital – Time Value of Money
- Translating a value back in time
-- referred to as discounting --
requires determining what a
future amount or cash flow is
worth today.
A1A2 A3 A4 A5
Financing Decision Moment
EX: 1000 USD 1100 USD after 1 y
Inflation rate of 20%
1100 USD = 1100 / (1+p) = 916.6.
USD in present

Course 2: International Financial Markets and Institutions 11
Present Value, Net Present Value, Internal Rate of Return
(4) k)(1
CFPV
nn
M
1nn
nfinancing
M
1nn
ninvestment
)k1(
ACNPV
)k1(
AINPV
IRR = k NPV = 0
• Inflation rate
• Interest rate
• Estimated profit for an investment project
Discounted rate
Expectations in terms of

Course 2: International Financial Markets and Institutions 12
Present Value, Net Present Value, Internal Rate of ReturnBonds
Value 500000 euroInterest Rate 10% 10%Maturity 5 years 9%Reimboursement equally 8.89%Face Value 10 euro 551234Issuing Price 9 euro -51234Maturity Price 11 euro 17.80%Number of Bonds 50000
Years Nb NV Cupons P An Krem Drate Disc An1 10000 100000 50000 10000 160000 400000 0.9174 1467892 10000 100000 40000 10000 150000 300000 0.8417 1262523 10000 100000 30000 10000 140000 200000 0.7722 1081064 10000 100000 20000 10000 130000 100000 0.7084 920955 10000 100000 10000 10000 120000 0 0.6499 77992
700000 551234
Net present valueIRR
Interest rateDiscount RateCurrent YieldPresent Value
Conclusion 1:
Internal Rate of Return is the best measure for the marginal cost of international financing (real cost is 17.80 instead 10% or 8.89%)

Course 2: International Financial Markets and Institutions 13
Comparing credits in different currencies using NPV€ USD 9.0% 7.0%
Year An An €/USD k(euro) k(USD)1 160000 160000 1.2 0.91743 0.9345792 150000 150000 1.3 0.84168 0.8734393 140000 140000 1.4 0.77218 0.8162984 130000 130000 1.5 0.70843 0.7628955 120000 120000 1.6 0.64993 0.712986
TOTAL 700000 700000 1.4
Method I:
- Estimating k(euro)
- Estimating k(USD)
- NPVeuro x spot0 = NPVeuroUSD
€ USD10% 10%7% 8%
579565 565109-129565 -115109
Present ValueNet present value
Interest rateDiscount Rate

Course 2: International Financial Markets and Institutions 14
Comparing credits in different currencies using NPV€ USD 9.0% 7.0%
Year An An €/USD k(euro) k(USD)1 160000 160000 1.2 0.91743 0.9345792 150000 150000 1.3 0.84168 0.8734393 140000 140000 1.4 0.77218 0.8162984 130000 130000 1.5 0.70843 0.7628955 120000 120000 1.6 0.64993 0.712986
TOTAL 700000 700000 1.4
Method II:
- Estimating k(euro)
- Estimating exchange rate
- Transforming An from USD in €
- Comparing NPV
10% 10%7% 8%
579565 510088-129565 -60088
Discount RatePresent ValueNet present value
Interest rate

Course 2: International Financial Markets and Institutions 15
Comparing credits in different currencies using NPV€ USD 9.0% 7.0%
Year An An €/USD k(euro) k(USD)1 160000 160000 1.2 0.91743 0.9345792 150000 150000 1.3 0.84168 0.8734393 140000 140000 1.4 0.77218 0.8162984 130000 130000 1.5 0.70843 0.7628955 120000 120000 1.6 0.64993 0.712986
TOTAL 700000 700000 1.4
Method III (best accuracy):
- Estimating k(euro)
- Estimating k(USD)
- Estimating an average FX rate
- Transforming NPV from USD in €
- Comparing NPV
€ USD10% 10%7% 8%
579565 565109-129565 -100375Net present value
Interest rateDiscount RatePresent Value

Course 2: International Financial Markets and Institutions 16
Comparing credits in different currencies using IRR
€ USDAn An €/USD
160000 144000 0.9150000 142500 0.95140000 121800 0.87130000 107900 0.83120000 97200 0.81700000 613400 0.872
€ USDYear An An €/USD
1 160000 160000 0.92 150000 150000 0.953 140000 140000 0.874 130000 130000 0.835 120000 120000 0.81
TOTAL 700000 700000 0.872
Method I: Comparing IRR obtained on initial An expressed in different currencies
Method II: Transforming An from USD to Euro and calculating IRR
We have the same IRR (= 17.8%)
We have different IRR:
€ USDIRR 17.80% 12.25%NPV -129565 -100375

Course 2: International Financial Markets and Institutions 17
NPV Criteria in International Financing
- Easier to be calculated than IRR
- It is difficult to estimate different discount rates for different financial markets;
- We should take into consideration the exchange rate when we compare different NPVs;
- NPV encourage big investment projects and discourage big financing projects.
IRR Criteria in International Financing
• Independent from FX rate;
• It is quite complicated to be estimated;
• In some cases we can’t calculate it (symmetric annuities, positive annuities).
CONCLUSION 2: When compare different financing alternatives we should use both two criteria: NPV and IRR

Course 2: International Financial Markets and Institutions 18
Cost of Equity
M
1nM
Mn
n
)k1(
NP
)k1(
DivNNIPNPV
Scenario A:
- Buy – back of stocks after 5 years:
NPV = 0 Kstocks
Scenario B: no buy - back
1n
nn
)k1(
DivNNIPNPV
Kstocks = (D0/IP)+g (Gordon – Shapiro Model)

Course 2: International Financial Markets and Institutions 19
International Financing Plan - summary
Capital Structure Value Weight CostCredit 200000 20% 10%Bonds 500000 50% 17.80%Stocks 300000 30% 11.53%
EquityEquityDEBTDebt kWk)T1(WWACC
WACC = 13.27%

Course 2: International Financial Markets and Institutions 20
Global CAPM and WACC
Rf
Rm
Ei
Betaβi=1
Risk premium
Securities with a higher risk than market risk
Securities with a lower risk than market risk
2M
iMi
)r,R(Cov
Note: the company has the same risk as the global market has
WACC
Rm

Course 2: International Financial Markets and Institutions 21
Capital Structure Optimization
• trying to find new financing resources with a lower cost according to the risk level of the borrower
• modifying the credit condition in terms of reimbursement,
• renouncing to the no – payment periods;
• modifying the capital structure;
• different maturities;
• diversifying international your financing;
• search to issue more fixed income instruments.