Embed Size (px)
Citation preview
Higher Education in the USA, Student fees, financial aid and access
International Comparators ofWidening Participation inHigher Education – Policy and Practice
Further information
If you want to know more please get in touch with the authors whose contact details can be found onthe action on access website.
www.actiononaccess.org
Liz Allen, Lucy Solomon, John Storan and Liz Thomas
Series Editor: Mary Stuart
Higher Education in the USA, Student fees, financial aid and access
1
Contents
Higher Education in the USA, Student fees, financial aid and access
1. Series Summary - the research project 2
2. Introduction 5
The Action on Access study visit to the USA - Illinois, De Paul and the University of Illinois, Urbana-Champaign
Key questions - access, fees and financial aid
3. The US context 6
HE institutions
Student profile and trends in participation and retention
4. Encouraging equitable access to HE 8
Support at federal, state and institutional level
Financial aid
Outreach - the TRIO programme
Institutional drivers
5. The trend towards increasing debt 12
Tuition fees
The shift from grants to loans
Financial assistance in Illinois
6. Access and choice 16
Who goes where -variations in state and institutional support
Community college transfers
Part-time learning, and a flexible conception of full-time study
7. The institutional balancing act: strategic enrolment management 18
What is SEM?
A private university - De Paul
A public university - University of Illinois Urbana-Champaign
8. Implications for England 22
Key points
Useful examples
Straws in the wind?
International Comparators of Widening Participation in Higher Education – Policy and Practice
2
ContextWidening participation in higher education remains a Government priority in the UK. Eachcountry in the UK has taken a slightly different approach; Scotland particularly focusingon progression, Wales specifically on community engagement, and England especially onyoung people’s access to HE. Widening participation in higher education is therefore adiverse field with many different issues to be addressed. When international comparatorsare examined the field becomes even more diverse.
Action on Access is the national co-ordinating team for widening participation for theHigher Education Funding Council for England (HEFCE), the Department for Educationand Skills (DfES) and the Learning and Skills Council (LSC). The team comprises adispersed team of researchers and practitioners in the field of widening participation inEngland. As part of our contract with the HEFCE, the team planned to undertakeinternational comparator research into widening participation practice.
The purpose of this research is to inform policy and practice in England by learning fromother similar situations (e.g. OECD countries1 ) so as to build the research capacity ofpractitioners in the field of widening participation (WP) so that they can understand theirpractice context in relation to other practice contexts and to develop a broader base ofresearch material for future use in the field.
Rationale - globalisation, widening participation and learning from othersSince the 1960s, inclusion in HE learning has been highlighted by different policyinitiatives, most of which were concerned about equality of opportunity, whether that beequality for Black students as in the USA and South Africa, or greater equality for workingclasses as in the UK. The global imperative to create more qualified workforces grows outof a concern for economic competitiveness. High-modernity or late- or post-modernitymeans that the industrial heartlands of countries such as the UK and USA have beendevastated and, in order to compete in an increasingly tough global market, knowledgeand professional skill development are important to the future of our societies. Jobs aremore uncertain and individuals take risks as they move through their employment career.Higher education is seen to be one element of insurance and protection against risk(Beck, 1992). Globalisation impacts on countries but more importantly on the peoplewithin countries and it affects their experience differently. What is certain is that thepoorest face the most risks in our society. In the UK, attempts to ensure social equity inhigher education have not been very successful. Despite the Robbins Report (Committeeon Higher Education, 1963) creating a new form of HE, the Polytechnics, and the rapidexpansion of HE numbers in the 1980s, the proportion of people from lower socio-economic groups has not increased. This means that they remain at a higher risk ofunemployment, of a less secure lifestyle and of having less favourable life chances thantheir graduate peers, and their position in society remains focused on need rather thantheir ability to contribute. In England, a range of initiatives has been put in place in HE,
1. Series Summary – the research project
1 Although there are similarities between countries, there is no direct comparator, and it is important to take'lessons learnt' with a degree of scepticism. It is not always applicable to transfer practice from one setting toanother, though it is possible with caution to gain a better understanding of process, especially wherecountries have concerns about widening access.
Higher Education in the USA, Student fees, financial aid and access
3
from the Universities Funding Council in 1991 providing funding for work with‘educationally-disadvantaged groups of adult returners’, through to the current funding forAimhigher for school-age young people and Lifelong Learning Networks focusing onvocational routes into and through HE. Many of these ideas have been tried in other partsof the world and, while it is always difficult to make comparisons, it is worth investigatinghow others have tackled issues of equality in higher education. This research projectattempts to do just that; to explore competitor countries’ approaches to widening accessand participation, their successes and their challenges. We hope that the reports willprovide cautionary tales, suggestions and inspiration to try to develop policy and practicethat can provide answers for the future.
Research methodologyThe project is led by Mary Stuart, Associate Director: Research and Curriculum for Actionon Access. The project methodology consists of a series of research visits to comparatorcountries to examine practice in relation to the areas outlined above. Each visit had ateam of researchers from Action on Access and each team took a specific area of interestto widening participation policy or practice, while keeping an overview of all areas of thestudent lifecycle.
The research questions that were examined were based on a typology drawing on currentUK government policy for widening participation using the student lifecycle model (Actionon Access, 2003), which highlights stages of widening participation practice such as:
1. Pre-HE interventions policy/practice
2. HE experience
3. Post-HE employment/development/lifelong learning.
At all times the central focus was on what can be learned from other countries’experiences. Five visits are being undertaken2 and the teams are as follows:
* South Africa: Chris Duke, Bill Jones
* Australia: Geoff Layer, Mary Stuart, Rhiannon Evans
* Canada: Sue Hatt, Phil Harley
* Sweden: John Harvey, Beth Scott, Pat Rayfield
* USA: John Storan, Liz Allen, Lucy Solomon, Liz Thomas.
All teams named a visit leader who was responsible for ensuring that the visit wassuccessful and that the report was written. The visit plan was agreed between MaryStuart and the visit team to ensure consistency and assure the quality of the research.Key contacts were identified in each country to ensure that appropriate interviewees were identified.
Each visit consisted of semi-structured interviews with key policy makers andpractitioners involved in WP activities and visits and observations of WP work. Each teamgathered data from the country concerned including policy documents, mission
2 The chosen countries and the number of visits is based on comparability in relation to UK HE systems andapproaches. These vary but all have a desire to widen access as well as to address practical matters such astime, affordability etc and therefore there is sufficient connection to the UK system to make comparisonappropriate.
International Comparators of Widening Participation in Higher Education – Policy and Practice
4
statements and relevant statistics, all of which were used in producing their reports.
After each visit teams were required to complete a report on the visit and participate in aseminar to share their learning from the visit. This report forms the first of theseinternational comparisons; further reports will follow later in 2005 and early 2006.
Mary Stuart, 2005
ReferencesAction on Access (2003) Student Success in Higher Education. University of Bradford,Action on Access.
Beck, U, (1992) The Risk Society - Towards a New Modernity. London. Sage.
Committee on Higher Education (1963) Higher Education Report of the Committeeappointed by the Prime Minister under the Chairmanship of Lord Robbins 1961-1963.London. HMSO.
AbstractIn 2006 the English higher education system will be facing the introduction of variable -albeit capped - tuition fees, alongside a new system of government financial support forstudents and a market in institutional bursaries and scholarships. Concerns about thepotential impact on different groups of students, and on efforts to widen participation inHE have led to the requirement for institutions to make Access agreements and to committo certain levels of bursary and outreach support. This report of a study trip conducted inJune 2005 looks at the US experience of fees, student support, student debt and theimplications for access and admissions. It sets out the federal context then reports fromthe Illinois Student Financial Aid Commission, and two Illinois universities - one private(De Paul University in Chicago) and one public (University of Illinois, Urbana-Champaign).The US has always had a fee culture and a market driven economy in higher education,that includes private universities. The report describes current trends in rising fees, theshift from grants to loans and long-term student debt in the US, and the implications foraccess and admissions policies - including sophisticated modelling of student academicprofile and financial circumstances of the kind that English institutions may have toconsider adopting. The report draws out lessons for England and identifies some keyissues facing those working to widen access in both the US and England -including thedifferent expectations of equitable treatment in the two countries, the implications oflong-term student debt accrued at increasingly high levels and the need to consider whatpolicy and finance levers are appropriate in directing institutional policy towards accessand widening participation.
Higher Education in the USA, Student fees, financial aid and access
5
The Action on Access study visit to the USA - Illinois, De Paul andthe University of Illinois, Urbana-ChampaignThis paper is an account of a study visit to the state of Illinois which was undertaken aspart of a series of international visits organised by Action on Access. These visits wereintended to assist in developing an international understanding of the ways in whichwidening participation and equity are dealt with by the countries involved. In the contextof the impending introduction of variable fees in England, the team wanted to explore theUS experience, at state and institutional level, of issues in terms of student finance - fees,financial aid and debt - and how these impact on access and widening participation.
The team consisted of John Storan, Liz Allen and Lucy Solomon from Action on Accessand Liz Thomas from the Higher Education Academy. The US has a federal system ofhigher education and each state has different approaches and different types and levelsof funding for HE, although there is federal funding across the states. This visit wasconducted in Illinois and focused upon two institutions, one public and one private, DePaul University and the University of Illinois at Urbana-Champaign. The team also visitedthe Illinois Student Assistance Commission in Springfield, Illinois. The visits focused oneliciting information about finance and financial aid; however, information was alsocollected on issues to do with institutional outreach, continuing education, minorityprogrammes and community college transfer. All of these helped to inform and providecontext for our understanding of the financial and financial aid systems in the US as wellas the interplay between financial aid and other equity issues.
Key questions - access, fees and financial aidThe report aims to give a flavour of the debate we had over fees, aid, access andinstitutional management of enrolments overall, and to use this to reflect upon some ofthe challenges facing English HEIs as they gear up for the era of variable fees and amarket in student financial aid. The key questions that we explored were:
• what are the drivers for institutions in the US in considering access and equity?
• in a climate of rising fees, reducing state budgets and rising student debt, how do USHEIs respond in their management of fees, financial aid and enrolments, and what is theimpact on access for under-represented groups?
• what have the trends been in student financial aid and what has been their impact onaccess and institutional choice?
The visit would not have been possible without the help of many people, primarilycolleagues at the University of De Paul in Chicago, the University of Illinois, Urbana-Champaign, and the Illinois Student Assistance Commission. Particular thanks are due toBrian Spittle at De Paul for organizing our visits, providing valuable context, and reflectionand feedback on our observations.
2. Introduction
International Comparators of Widening Participation in Higher Education – Policy and Practice
6
HE institutionsThere are currently 4,200 degree-awarding institutions in the US. These differ in terms oftype, size, quality and mission. Indeed just over half of these lead to a bachelor’s degreeor beyond, with the others being two-year colleges awarding up to associate degree level -commonly thought of as comparable to further education colleges in the UK. Threequarters of the ‘four-year’ colleges3 are publicly financed, while the remaining quarter areprivate, though not for profit. While private colleges and universities account for about60% of total degree-granting institutions in the United States, over 75% of Americancollege students attend publicly financed colleges and universities.
As in the UK higher education system, the US system is keenly sensitive to league tables,the most prominent being those published by US News and World Report, which offer anarray of rankings of institutions by type (national, grad-school, best colleges, liberal arts,geographical location etc) and by a wealth of indicators. Institutional differentiation hasbeen long accepted in the United States and it is commonly understood that a degreefrom Harvard or Johns Hopkins is not the same as one from Trinity Christian College orNorthwestern Oklahoma State University, despite the fact that they all offer baccalaureatedegrees.
Student profile and trends in participation and retentionOverall the level of participation in US higher education is high, and aspiration to highereducation is near-universal amongst those who complete high school - 97% of high-schoolgraduates plan to enter post-secondary education at some point, and 71% aspire to abachelor’s degree. Numbers have increased steadily over the last 20 years, rising from50% of high-school graduates entering HE up to 65%. However, as in the UK andelsewhere, these figures conceal significant gaps between the participation of differentgroups, and it appears that inequality in US higher education has not only failed to reducebut is actually increasing - for more details see: the Forgotten Half Revisited (1998),Access Denied: Restoring the Nation’s Commitment to Equal Opportunity (2001), andEmpty Promises: the Myth of College Access in America (2002).
To look at it in terms of economic groups, where there is of course a close link withparticipation by minority groups such as Hispanics and African Americans, in initialparticipation the gap between the participation of students from high-income families andthose from low-income families has remained constant for 30 years, at 32% points. Andeven at this initial point low-income students are far more likely to enter HE at a two-yearcommunity college, rather than going straight to a four-year programme, and to end theirhigher education after achieving a two-year associate degree rather than transferring ontoa bachelor’s programme.
Furthermore, the overall gap in degree attainment has not remained constant - it haswidened significantly over the last 25 years. Whereas in 1975 around 7% of all those fromthe bottom income quartile gained a baccalaureate degree by age 24, compared with 40%of those in the top quartile, in 2000 the percentage for the low-income quartile hadremained constant whilst that for the top quartile had risen above 60%.
3. The US context
3 Honours degrees in the US are traditionally 4-year courses unlike the UK wehere they are typically 3-year courses.
Higher Education in the USA, Student fees, financial aid and access
7
Although a factor in the debate may be to do with issues of academic preparedness, evenwell-prepared low-income students are less likely to participate in HE. Indeed the best-prepared low-income students go to higher education at the same rate as the worst-prepared richer students (around 78%), whereas the worst-prepared low-income studentsare only entering HE at a rate of around 36%,
College access and completion are also strongly stratified by race and ethnicity. Asian-Americans have the highest college completion rate followed by Whites, Blacks andHispanics. According to the Department of Education, six-year graduation rates byrace/ethnicity for BA-seeking students starting at a four-year university are: Asian/Pacific-Islander: 70.5% White, Non-Hispanic: 66.8% Hispanic: 47.3% Black, Non-Hispanic: 45.7%(2002, Dept. of Education)
One major difference with the English higher education system is the level of bothmobility and flexibility in terms of pattern of attendance and overall length of study in theUS, where the time taken to complete a degree is another significant variable. Whilst thepoorer you are, the longer you are likely to take to graduate, arguably this flexibility doesnonetheless allow opportunities for degree-attainment that are less available in our morerigid system. In the US a level of mobility between institutions is possible through a well-established credit system, and greater compatibility between programme contents atdifferent institutions during the first two years of HE. As in the UK, credit transfer is oftenvariably interpreted on an institutional basis, with more selective institutions adoptingmore restrictive credit transfer policies, but in the US there are accepted conventions fortransfer of credit. Department of Education figures show that typically a student willattend more than one institution to earn a degree (2002, Dept. of education). Alongsidethis potential mobility, innovative curriculum design and flexible forms of delivery have ledto some disadvantaged groups such as part-time students and working adults raisingtheir numbers and profile within HE in the US.

International Comparators of Widening Participation in Higher Education – Policy and Practice
8
Support at federal, state and institutional levelThe US approach to equitable access to higher education can be characterised as one thatseeks to enable individual students to go to college, primarily by ensuring that thefinancial barriers are not unduly high. Although there has been a vigorous debate aboutaffirmative action in terms of race, and to a lesser extent, gender and class, the mainfocus is on assistance to the individual student rather than a requirement for institutionalaction or change. It appears that the debate over access for low-income students is notframed in terms of social class, in the way it is in England, and that the emphasis remainson economic capital rather than also examining the impact of lack of social capital andbarriers relating to the perceived benefits of He and the knowledge and capacity toaccess it. There is a federal outreach programme (see “TRIO” below), and outreachactivity at the institutional level, but the major focus of endeavour is on financial support.There is less focus on subsequent attainment and student success in terms of equity perse, although issues of retention for students across the board have latterly begun to driveinstitutional policies and planning as finances have got tighter.
Financial aidIn the US, HE student financial support is composed of:
• Family contribution
• Federal assistance including means-tested Pell Grants, loans and education tax credits
• State financial aid, which may include need-based grants, merit-based scholarships,loans and/or subsidised provision
• Institutional financial aid, which may include need-based and merit-based support in the form of grants or loans, discounted fees, and other forms of support such ascampus employment
• Private sector loans and other forms of private borrowing such as credit-card debt.
Federal supportThe principal grant targeted to low-income students is the federal Pell Grant This is ameans-tested grant for students from families with an annual income below $25,000. The Higher Education Act of 1965 targeted the Basic Educational Opportunity Grants(BEOG), later renamed Pell Grants, at students, particularly low-income students, ratherthan institutions. By doing this Congress went some way toward ensuring that cost as a barrier to HE4 should be minimised, and that there should be some degree of choicebetween public and private institutions. The maximum funded Pell Grant currently stands at just over $4,000 per annum.
Increasingly, however, the bulk of federal support is provided through loans, bothsubsidized and unsubsidized, and through tax credits, which are available to middle-income, as well as to low-income, families. The Pell Grants also are available to middle-income families and funding is generally widely and thinly spread across income groupsrather than targeted towards lower socio-economic groups.
Each student intending to study in HE must complete a Federal Needs Analysis form eachyear. This is used to determine the level of expected family contribution and eligibility fora federal Pell Grant. The same information is used by states and institutions to inform the
4. Encouraging equitable access to HE
Higher Education in the USA, Student fees, financial aid and access
9
financial aid packages that each will offer to individual students. Any shortfall betweenthe cost of HE4 and financial aid and what the family can contribute is made up by privatesector borrowing by the family and the student.
State supportAlmost all states in the US have means-tested financial assistance programs. For example,in Illinois the state grant is called the Monetary Award Program (MAP); this has amaximum award of about $4,500 per annum. However, state financial aid schemes varywidely. It is instructive to note that today 80% of the total volume of state financial aidcomes from five states: Illinois, Pennsylvania, New York, New Jersey and California; thusstudents’ access to state financial aid is highly dependent on where they live.Furthermore, states can select the type of aid they wish to provide and thus prioritisewhich students they support. This tends to be influenced by a range of factors includinghistory, politics and current economic needs. States with large conurbations have agreater need for graduates than rural states, and thus tend to provide higher levels offinancial support aimed at increasing the total number of graduates, rather thansubsidising those who would go to university irrespective of state financial aid. In general,rural states offer lower levels of financial aid, and this is more likely to be merit-based aid.
A recent survey of governor’s education policy advisors found that few states had clearphilosophies or driving goals for higher education: “Too often, these issues are dealt withas separate and discrete questions rather than reflecting the interrelated nature of bothhigher education financial aid and finance policies, as well as the interconnected natureof state and federal efforts in these areas (Conklin and Wellner, 2004). Not surprisingly,college participation rates vary widely by region and state. In particular, low-incomecollege participation rates range from a high of over 40% in states such as Minnesota,New Hampshire and New Jersey, to lows of under 20% in Alabama, Arizona, Arkansas andNew Mexico (Conklin and Wellner, 2004).
Institutional supportUnlike the UK, institutions in the US have the freedom to set their fees and makeautonomous decisions about aid. Judgements can be made institutionally about incomeand financial aid as well as the academic and diversity profile of students, and institutionsallocate grant aid from their own operating or endowment budgets. This variessignificantly, according to type of institution and its market position. Some institutionsmay discount their tuition by as much as 30% to attract specific students desirable totheir institution. It is worth noting , after receiving federal, state and institutional aidpackages, the ‘net price’ to the student or family, i.e. the out-of-pocket cost, may be farless than the published tuition rate. The average net price at public four-year colleges anduniversities in 2003, for instance, was $1,800; at private universities, it was just over$10,000 (College Board, 2003, Trends in College Pricing).
Once the need of a student has been calculated, the financial aid office at the student’sinstitution prepares a financial aid package to meet as much of this need as possible,through federal grants and loans (if eligible) plus work-study and institutional grants.Currently about 70% of American college students receive some sort of financial aid inthis manner, a proportion that has increased over time as college costs have risen.
4 tuition and fees – the former is the academic costs the latter is non-academic costs, including payments toinstitutions for services
International Comparators of Widening Participation in Higher Education – Policy and Practice
10
Expectations of equityNot only does the amount and form of available state support vary very significantly, butindividual students may negotiate very different support packages from, and within,different institutions. Other than the Pell Grant there appears to be no expectation thatthere will be equitable and transparent support arrangements in place for all students.
Outreach - the TRIO programmeFinance aside, work to widen participation in higher education is largely undertaken at theinstitutional level, where financial aid systems may be complemented by outreach work toencourage aspiration and access, and work to support retention and student success. Atthe national level there is funding to support some of this activity via TRIO - a set ofprogrammes designed to complement federal financial aid. By law, the programmes aretargeted to low-income and first generation students, where low-income is defined as150% of poverty level (poverty level is currently about $28,000 in net taxable income for afamily of four), and where first generation is defined as neither parent having completed abachelor’s degree. The original three TRIO programmes, set up in the 1960s, were focusedon improving access, facilitating the transition to higher education, and increasingcollege-based retention activity designed to foster baccalaureate completion. Today thereare eight TRIO programs serving over 850,000 low-income students across the country, sixof which are targeted directly at students and would-be students, and two of which dealwith training for TRIO staff and dissemination of successful programmes to institutionsand agencies that do not have TRIO grants.
There are parallels to be drawn with the Aimhigher programme in England, in that this is national funding for outreach (and, in this case, retention) projects, designed to complement initiatives to provide financial support to students. However, the TRIOprogrammes have some interesting differences - for instance one of the six fundingstreams directly targeted at students is the McNair Program, which is aimed at supportingand encouraging students from disadvantaged backgrounds in continuing at universityinto doctoral studies, whereas the Aimhigher initiative does not intervene beyond accessto undergraduate study.
Although most of the strands are open to public and private agencies, as well as to HEinstitutions, TRIO funds are awarded to institutions through competitive grant funding.There is not the same partnership approach as in the English Aimhigher programme,which focuses on encouraging partnership-working between institutions across theeducational spectrum, together with employers, community groups and parents.
TRIO’s longer history means that there has been more opportunity to evaluate its impactthan available for similar initiatives under Aimhigher. For instance, studies have shownthat students in the Upward Bound program are four times more likely to earn anundergraduate degree than those students from similar backgrounds who did notparticipate in TRIO; and nearly 20 percent of all Black and Hispanic freshmen who entered college in 1981 received assistance through the TRIO Talent Search or theEducational Opportunity Centers.
However, only one in four American colleges and universities house a TRIO program, and the Council For Opportunity in Education (the professional organization for TRIO staff) estimates that the programs reach only 7% of the low-income Americans eligible to be served.
Higher Education in the USA, Student fees, financial aid and access
11
Another interesting comparison with nationally-funded initiatives for wideningparticipation in England is that staff in the TRIO programmes not only have their own professional organization (the COE, see above) but they use it to lobby hard forcontinuation of funding. TRIO programs have enjoyed widespread bi-partisan support andto date have been successful in overcoming a number of attempts to reduce their scopeand funding. However, the Bush administration has targeted some of the TRIO programs -particularly those at the pre-college level - for elimination, claiming that they are eitherineffective or duplicate provisions in the No Child Left Behind legislation, the president’smajor educational initiative to improve quality and accountability in secondary education.The evidence to support such claims is either contentious, as in the case of programeffectiveness, or non-existent, as in the case of program duplication. Lobbying by the COE has recently intensified to ensure that the TRIO funding continues.
Institutional driversIn much the same way as the pressure on TRIO, state and federal financial assistance isalso subject to political pressure and controversy. Clearly national and state politiciansrespond to different pressures and pressure groups in determining levels and forms ofassistance for HE students, and where to target them. In the following section onincreasing debt we describe how changing aid policies have, in recent years, shifted theburden from institutions and onto individual students, and the ways in which differentforms of financial aid help different student and income populations,
Given the reduction in state education budgets, the increasing pressure on institutions to raise their fee income, and the lack of actual - or desired - national/state leverage over institutional behaviour in relation to access (other than compliance with a legislative framework), we were interested to explore what might drive the institutional access agenda.
There are certainly very different participation profiles in different institutions, as onemight expect, reflecting the complex interplay of cost, academic selectivity, recruitmentpool and efforts to achieve equity and diversity. Institutional financial aid in itself is only alimited part of the picture - despite very generous financial support for individual studentsat some very expensive and prestigious institutions these are still mainly situated at thebottom for economic diversity (see the US News and World Report rankings of economicdiversity amongst national universities).
In looking at the growth of Strategic Enrolment Management (SEM - see below) a numberof questions are raised about what drives institutions in their enrolment decisions. USinstitutions don’t have restrictions on enrolment numbers the way English institutions do,and there has been a debate, absent from the English scene, about the relative merits ofhigh enrolment coupled with relatively low retention, and the restriction of enrolment.There are fears that restricting enrolments and improving retention amongst middle-income students militates against access - in effect institutions going for “safer” studentsand more secure income. Opportunities for low-income and other non-traditional studentsmay then become restricted - for instance it was intimated that some public universitiesnow admit fewer transfer students from community colleges because their retentionamongst four-year students is improving.
International Comparators of Widening Participation in Higher Education – Policy and Practice
12
Education has become a primary engine for economic development in today’s knowledgeeconomy, but according to the Advisory Committee on Student Financial Assistance, over400,000 qualified students a year in the US are currently unable to attend a ‘four-year’college or university, primarily due to financial barriers. Nearly half of these potentialstudents are not attending any college at all. State and federal money for aid hasflattened out and there is more pressure on institutions to provide aid at the same time asall institutions are raising their tuition fees.
Tuition FeesPublic universities are funded by the state and offer a lower tuition fee rate to studentsfrom within the state. This approach offers a subsidy to all students from within the state,irrespective of family income; over 75% of American college students attend publicinstitutions. In some states there is currently a move towards reducing the subsidy topublic institutions, as it is less visible, and replacing it with individual support.Consequently the tuition costs at public institutions are increasing, and in some cases areon a par with private institutions. During the decade from 1983/4 to 1993/4 inflation-adjusted tuition and fees rose 54% at public four-year institutions and 50% at private four-year institutions. In the decade since then growth in fees has continued, albeit at aslightly slower pace - 44% in the public sector and 35% in the private sector. Between1980 and 2004 the average public university tuition rose from less than $2,000 a year toalmost $5000, while private university tuition rose from about $8,000 to nearly $20,000(The College Board, 2003, Trends in College Pricing)
Although savage cuts in some state education budgets have seen dramatic rises in somestate institutions there are acute financial pressures on a wide range of institutions. It ispredicted that deficits in operating expenses for the nation’s colleges and universities willquadruple by 2015. Even assuming that tuition increases no more than inflation theshortfall is estimated at $38 billion. If tuition were to rise at the current rates this wouldmean that around 50% of those who wish to pursue HE would not be able to do so.
The shift from grants to loansThe sheer numbers of students requiring financial assistance of some kind has alsomassively increased - partly due to rising enrolments overall and partly to economicpressures in general and rising tuition fees in particular, which have meant that evenmiddle-income families are now struggling to afford college. At the same time, the shiftfrom grants to loans documented below has led to increased pressure on family income.In the US loans have become the principal tool for access. In many states low-incomestudents in particular have to borrow sizeable amounts to meet the costs of HE.“Increased reliance on borrowing to fund a college education appears to be influencingthe discipline areas that are being studied. In the US, the average lifetime earnings of aHE graduate, as opposed to a high school graduate, are $1million greater. Students aretherefore opting to study subjects that are most likely to reap high rewards in the labourmarket” (Spittle, 2005).
The federal Pell Grant itself has declined very significantly in its purchasing power overthe last three decades. Estimates suggest that in the mid 1970s it represented 84% ofpublic college tuition, as against 37% today. Overall slower growth in grant aid in 2002-
5. The trend towards increasing debt
Higher Education in the USA, Student fees, financial aid and access
13
03 and 2003-04 has caused students to rely more heavily on loans. Last academic year,loans constituted 56% of aid, grants 38 %, work 1 %, and education tax benefits 5 %. 70 %of federal aid now takes the form of loans. These may be subsidised with capped interestrates, or be private and unsubsidised. Student loans are normally not repaid until aftergraduation but parents may also take out low-interest Parent Loans (PLU) payable 60 daysafter beginning the loan. In addition, market-based loans have skyrocketed. Non-federalborrowing is now at over $11 billion, nearly 40% up in real terms over the previous year.Recent research also shows that as many as 25% of college students may be relying onhigh-interest credit cards to finance their college education (The College Board, 2004).The average debt of graduates from public institutions has nearly doubled over the pastdecade to $15,000. Debt levels of private college graduates are a good deal higher. Lower-income and upper-income students have similar debt levels, though they representsignificantly different proportions of family income (Boushey, 2003).
If we switch attention to the situation at the state level we find a similar overall trendtowards reducing support for both state institutions and also indirectly to private colleges.The value of state-funded grants to individuals has consistently decreased and becomeincreasingly merit-based rather than needs-based.
The federal policy shifted yet further more recently with the move to tax credits foressentially middle-income families. Commentators and analysts argue that recent shifts inaid have resulted in more help for middle-income families and less for low-incomefamilies. For instance the College Board reports on Trends in Colleges Pricing (2003) andTrends in Student Aid (2004) note that the average net price for college educationconceals significant differences among students. In recent years, changes in thedistribution of state and institutional grant aid, as well as the introduction of educationtax benefits and the tuition and fee deductions, have benefited middle- and upper-incomestudents more than lower-income students. This is borne out by tables showing thepercentage of family income needed to fund a college education where by far the highestpercentage is borne by the lowest income groups.
Interestingly some colleagues in Illinois voiced their perception that students most at riskof financial exclusion were those from the income groups just above the poorest - wherecosts were very high as a proportion of family income and where less grant (as opposedto loan) aid was available. This echoes concerns expressed in England about the impactof high fees and maintenance costs on those students falling just outside the financialsupport available for the poorest groups.
Meanwhile the changes to federal, state and institutional practice have not always beenmade systematically and inter-dependently, leading to further pressures on individualstudents. For instance the practice of administering financial aid as fee waivers may makerecipients ineligible for tax credits; not integrating the federal Pell Grants into state needsanalysis formulas distorts estimates of need and decisions to discount fees.
Financial assistance in IllinoisThe State of Illinois here serves as an example of how one of the five major providers ofstate financial aid organises and implements its student assistance program. Illinois is inthe northwest of the US; Chicago, in the north of the state, represents its large urban area,supplying a large number of HE places and with a high demand for graduates. The city is
International Comparators of Widening Participation in Higher Education – Policy and Practice
14
surrounded by an extensive, flat rural hinterland that constitutes the rest of the State,whose main industry is agriculture. In Chicago alone there is the University of Chicago,DePaul University, University of Illinois at Chicago, the Art Institute of Chicago, theVandercook College of Music, the John Marshall Law School, the Moody Bible Institute,the Adler School of Professional Psychology and the City Colleges of Chicago.
There are 9 public universities in Illinois, whose tuition fees currently range from $3330 to$7312 a year. Illinois is one of the top five states with regard to the provision of studentfinancial aid; it spends in excess of $335 million in grants per year. Financial aid supportis a combination of need-based grants, some merit based scholarships and subsidizedloans and support for public HEIs. In concert with trends in the rest of the US, thefinancial aid budget has not grown in line with inflation and student demand, thus therehas been a decrease in the total amount of aid available to individual students andgreater reliance on loans.
Whilst the state wanted, and used to be able, to promote institutional choice for studentsand to make bigger grants available to those accepted at private institutions, they havenow to restrict themselves to providing access at a flat rate. Even on this basis, threeyears ago an average student going to a state university in Illinois would have their tuitionand fees covered by state financial aid, but now only 65% of those costs are covered. Thisfigure is lower in more expensive institutions, such as the University of Illinois Urbana-Champaign, and the University of Illinois, Chicago. Both of these are public universities,funded in part by the State of Illinois, but, as proportional subsidies to public institutionshave declined, so fees payable by students have increased.
In Illinois, student financial aid is still sufficiently generous that a low-income student canget through college without resorting to borrowing in the private sector, but, this wouldnecessitate studying for the first two years at a community college, and then transferringto a low-cost state university. It should be noted however that community colleges havehigh rates of withdrawal and low rates of transfer to four-year institutions. Furthermore, inIllinois they have observed that low-income and Hispanic students are the most unwillingto borrow money to fund HE. The State has therefore created a low-interest loan schemetargeted at specific student groups in certain HEIs to help overcome this problem. Thisscheme is heavily subsidised, so although the State is offering a loan, rather than a grant,it still has implications for the State’s overall financial aid budget.
In addition to managing student support, the Illinois Student Assistance Commission(ISAC) conducts long-term research into issues of financial aid and debt. Much of thisdemonstrates linkage between college participation and retention, and financial barriers.For instance in their publication “Are Cost Barriers Keeping Qualified Students fromCollege?” (2003) they report that:
“The Illinois Student Assistance Commission (ISAC) has tracked and evaluated low-income students closely for years through its administration of Illinois’ Monetary AwardProgram (MAP) program. While preparation is undeniably important for college admissionand retention, the lower college attendance rates of low-income students (when comparedto students from more affluent families) historically have had a strong income component.These students have been surveyed many times and a constant refrain is that without theMAP grant, which can cover up to 100 percent of college tuition and fees, they could nothave attended college. Yet not all MAP-eligible students claim their awards and not all
Higher Education in the USA, Student fees, financial aid and access
15
low-income students even apply for the grant. It is suspected that even with the financialaid offered in Illinois, through a grant program very generous by state standards, there arestudents who are college-ready yet do not undertake post-secondary education forfinancial or other reasons” (ISAC, 2003).
These research findings were strongly supported in discussions with colleagues in DePaul University and the University of Illinois Urbana-Champaign - particularly from theuniversities’ TRIO programmes. The view was categorical that rising costs are deterringthe very students that they are seeking to encourage into HE.
Further ISAC research looked at the impact of long-term debt on college students andconcluded that:
“14 years after high school, or ten years after college, many college graduates are seeingessentially no economic returns to their degrees. Their “after-debt” 14 years medianincomes are about the same, or even less, than those who did not attend college at all”.
The same report comments that:
“Although some students could afford to pay back greater debt and increasing student loanlimits may be a viable option for them, other students could face excessive debt burdenand repayment difficulties upon graduation if loan limits were increased”.(ISAC, 2002)
International Comparators of Widening Participation in Higher Education – Policy and Practice
16
Who goes where – variations in state and institutional supportBefore looking at the institutional response to rising costs and fees, enrolment andaccess, it is worth commenting briefly on discussions we had with colleagues in Illinoisabout patterns of attendance and institutional choice. Access to higher education isclearly a matter of more than whether students attend, it is also a matter of where, whatand how. We have already commented on the fact that rising costs have impacted on thechoice of institution and course of study, and that US league tables - just like the Englishones - show a sharp divergence in student profile depending on institutional reputation,academic selectivity and other factors.
Community college transfersThe lower cost of state institutions for students who study in-state is a powerful incentivefor poorer students to study locally. Community colleges provide an even more local, andeven cheaper, alternative. They provide the option for students to do the first two years oftheir bachelor’s degree at a community college and then to transfer into a four-yearprogramme. Community colleges have many similar characteristics to FE colleges inEngland - they serve local communities, with diverse offerings including remedialeducation, high school diplomas for those who failed to complete, vocational education,and “end point” two-year Associate Degrees. They also offer two-year programmes thatfacilitate transfer to university. Their students are more likely to be low-income andminority ethnic - and their courses are cheaper.
However community college transfer as a successful access tool depends on carefulstate-by-state articulation of programmes and credits, and on the enthusiasm of thereceiving institutions. Although significant numbers of community college graduates dotransfer into four-year degree programmes it is clear that the four-year schools themselvesmay regard these students as a lever to make up the numbers where and when required:
“Retention or graduation rates do not really matter, as long as the enrolment target isbeing met. Dropouts are OK if they can be readily replaced, and the number of transferstudents is a lever that can be adjusted for this.” (state budget official quoted in Weko,2004)
This view was reinforced by colleagues in Illinois who told us that as retention ratesimprove in some public universities the numbers of transfer students they accept hasfallen. The full-time high-school graduate remains the “norm” - and indeed the aspiration -in terms of much higher education recruitment.
At De Paul University however, commitment to using close relationships with communitycolleges as a means of encouraging access for non-traditional students is being pursuedin some programme areas, such as computing, in terms of a new system of dualadmissions, where the initial registration is with De Paul but the first two years arestudied within a community college. De Paul has a 40% rate of transfer students, of whom60% come from community colleges (and the other 40% from other four-yearprogrammes). Overall their transfer students have a higher rate of completion andattainment than their “freshmen” (those who enter as four-year students).
6. Access and choice
Higher Education in the USA, Student fees, financial aid and access
17
Part-time learning, and a flexible conception of full-time studyAnother option that is more readily available than in England is to vary the length of timeit takes to get a degree. Most HE institutions will charge according to the number ofcredits and courses being taken, with a fluid definition of what is full-and part-time:
“US universities do not typically offer separate full-time or part-time programmes of studyfor a course. While in rare instances programmes will insist upon a certain rate of work(i.e. students must enrol full-time), students typically choose the rate of work they wish toundertake each semester, ranging from one module to five (or, more, if they choose).Students will vary their rate of work over the course of their career, as circumstanceswarrant. If students in receipt of financial aid opt to enrol on a part-time basis, theycontinue to receive funding from federal and state government aid programmes, on a pro-rated basis. Students view part and fulltime study as a continuum of activity, and neitheremployers nor postgraduate programmes view spells of part-time study with particulardisfavour” (Weko, 2004).
There is significant variation in terms of the time taken to complete a degree, byinstitution type - reflecting the students within the institutions. On average 67% ofstudents at private institutions complete their degree within four years, while only 24% ofstudents at public institutions do so (Weko, 2004) Those students studying part-time, orcombining full- and part-time study, are more likely to be mature, to have dependents andto be first generation HE students. Whilst part-time study may make completion a slowerprocess, and may increase the likelihood of drop-out, it also facilitates HE participation forthose who might otherwise never access it.
International Comparators of Widening Participation in Higher Education – Policy and Practice
18
What is SEM?The challenge facing US universities, and the one that HE institutions in England are nowgearing up for, is that of not only setting fees, but deciding who to enrol, how much tosupport them financially through grants, loans, employment and also through discountedfees (much is made of the gap between the “sticker price” and what most studentsactually pay for tuition in the US). The key factors that have to be balanced are money,academic standards or selectivity, and diversity. A session advertised for a recent nationalconference on strategic enrolment management described it thus:
“The challenge facing enrolment management is really quite tall. From the applicant pool, the college or university must decide how many and which students to accept and how muchfinancial aid to offer each student. These decisions are made in the context of all kinds ofconstraints - current market position, financial aid budget, program capacity and other.
After the institutional decisions have been made and the acceptance and award letters go out, the students who choose to enrol then determine some of the key outcomes onwhich the “success” of the cycle is based: academic profile, diversity, program sizes and discount rate.”
Assessing your institution’s market position is an analytic exercise at the core of strategicenrolment planning.” (Programme for the Second Annual Data-driven StrategicManagement Enrolment Conference - Colorado, US June 2005)
Increasingly institutions have linked financial aid to their strategy for enrolling studentsoverall. Strategic enrolment management, which developed as a way of managingadmissions, became increasingly concerned with maximising net tuition revenue, andinstitutional aid became a potential tool to shape enrolment goals - not simply to supportneedy and/or bright students. In a prestige-driven and financially pressurised environmentmany colleges are said to allocate an increasing portion of the institutional aid budget tohigh performance students in order to boost the profile of the entering class and therebyattract more “top” students and improve reputation, and possibly rankings. From anaccess perspective the criticism levied at SEM is that it militates against access by actingas a sophisticated tuition discounting mechanism used to attract middle- and upper-income students:
“Over the last ten to fifteen years colleges and universities ... have responded tointensified competition for students by adopting an instrumental view of aid as part of anenrollment management strategy. Rather than seeking to eliminate price as a factor incollege choice, which is the official ideology in “meeting need”, schools are turning thenet price to their advantage in the competitive struggle. The Ivy League schools arelatecomers to the use of financial aid as a competitive strategy, The rest of the industry iswell ahead in using merit aid, preferential and differential packaging, idiosyncraticmeasurement of need, and other techniques to make their aid dollars serve institutionalself-interest” (David Kalsbeek, De Paul University, “SEM and the Challenge of Access:Truth or Dare?” Keynote presentation at AACRAO’s 2005 annual conference).
However in principle SEM provides a set of tools that can be used to achieve a variety ofenrolment objectives. Another session at the Data-driven Strategic ManagementEnrollment Conference mentioned above set out what these objectives are for in aparticular institution:
“During the past several years, the Ohio State University has built a geodemographicinfrastructure to conduct market analysis and research and support planning, execution,tracking and evaluation of new freshmen recruitment strategies. UndergraduateAdmissions has been challenged to achieve goals set forth by the University’sadministration. These goals involve three general areas: quantity (number of students to be matriculated), quality (based on academic ability), and diversity(race/ethnicity, geographic, by academic areas, gender, etc)”.
7. The institutional balancing act:strategic enrolment management(SEM)
Higher Education in the USA, Student fees, financial aid and access
19
A private university - DePaul University DePaul University was founded in 1898 and is now the country’s largest Catholicuniversity and eighth largest private not-for-profit university. With an enrolment of morethan 23,000 students (more than 14,000 undergraduates and 9,000 graduate andprofessional students) the university’s mission emphasises academic excellence but alsoequity and access.
The university has grown significantly in size and stature over the past twenty years,fuelled particularly by dramatic enrolment growth. At the same time, the university hasmaintained its commitment to access, with over a third of its freshmen coming from firstgeneration college families, almost 25% of undergraduates transferring from communitycolleges and close to a third qualifying for the federal Pell Grant. Just over 22% offreshmen at the university are African-American or Hispanic, with a total of 36% in allbeing minority ethnic students.
De Paul is an interesting institution in that it is private, high cost, and reasonablyacademically selective, and yet its proportion of first generation, minority ethnic and low-income students is high when compared to institutions that are otherwise similar inprofile. We have already commented on its commitment to work with community colleges- one way in which its access mission is manifest - and we were also interested in theways in which it used enrolment management tools.
As previously illustrated, the university finds itself confronting a federal and state contextin which the value of financial aid and the conditions under which it is provided haveproduced not only an affordability gap but a real challenge to its access mission. Part ofDe Paul’s response has been to seek to put its Strategic Enrolment Management (SEM) at the centre of its access mission.
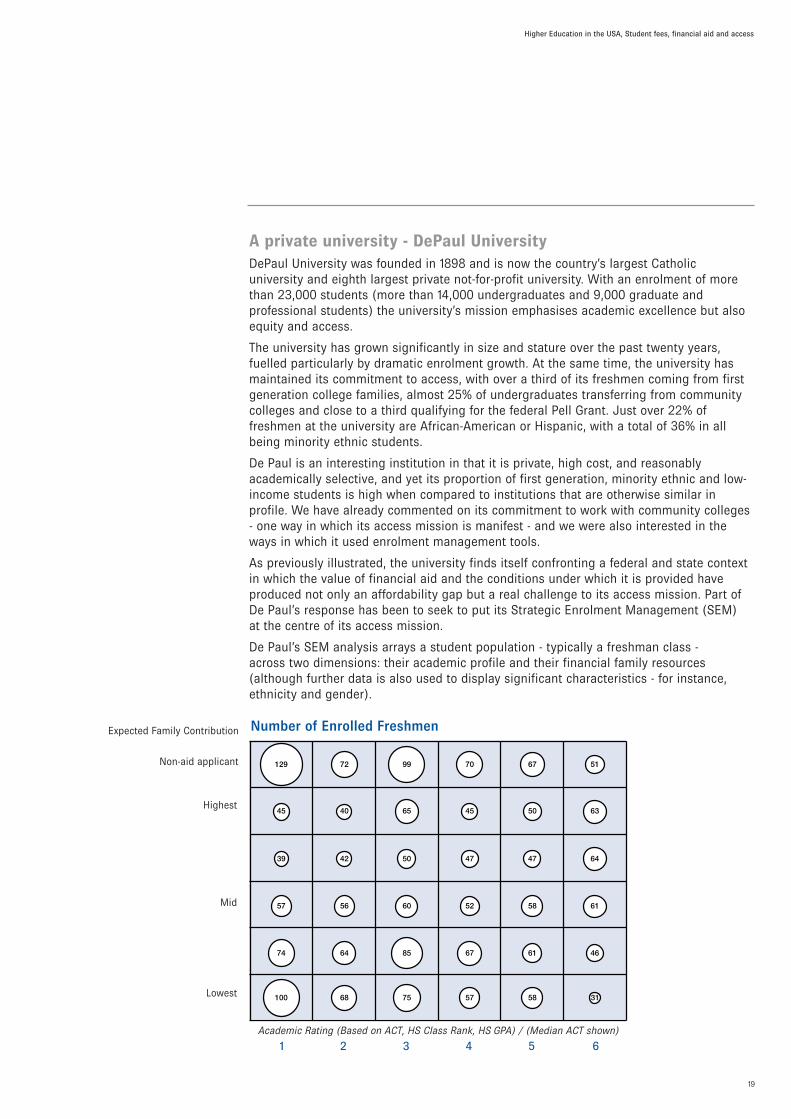
De Paul’s SEM analysis arrays a student population - typically a freshman class - across two dimensions: their academic profile and their financial family resources(although further data is also used to display significant characteristics - for instance,ethnicity and gender).
Expected Family Contribution
Academic Rating (Based on ACT, HS Class Rank, HS GPA) / (Median ACT shown)
1 2 3 4 5 6
Number of Enrolled Freshmen
Non-aid applicant
Highest
Mid
Lowest
International Comparators of Widening Participation in Higher Education – Policy and Practice
20
When this analysis is applied to the pool of “admitted students” (those who, in Englishterms, have been made offers but not actually taken up places) it can be used to try andmaximise the actual take-up of places, in part by deciding what levels of financial aid willbe needed to stimulate take-up. Large discounts on fees may be needed to encouragetake-up from poorer students, but large discounts may also be needed to encourage take-up from the brightest students (who may also be wealthy) who have more opportunitiesavailable to them. When financial aid has been allocated to a freshman class the resultingnet revenue to the institution can be arrayed on a grid that demonstrates which studentsare generating what amounts of income.
The management of the mix that the institution both aims for and achieves - how manypoor but bright students, how many wealthy but less able students, how many poor butless well-prepared students, and so on - is the territory on which the tensions betweenvarious interests are played out. Faculty members, for instance, may want to seeacademic profile as high as possible, whilst finance officers and the University Board maybe looking for the maximum net revenue. While all institutions will have some individualslooking to maximise the enrolment of students who are both under-represented (in termsof ethnicity or income for instance) and financially needy, in De Paul the strong accessfocus of the university’s mission means that this lobby is relatively strong.
The argument for the benefits of SEM in an access context is that it is a tool that helpsframe the debate about access in a meaningful and measurable way. Outcomes areexposed, and if they are incompatible with espoused equity and diversity values then thattoo is exposed. If the institution is committed to achieving certain access goals then thecosts of those goals, and the enrolment, aid and revenue balancing act necessary toachieve them, is more explicit.
A public university - University of Illinois, Urbana-Champaign There are three institutions making up the University of Illinois: Urbana-Champaign,Chicago and Springfield. However, they are in effect separate institutions, each chargingtheir own fees and having their own course mix and enrolment policy. Until fairly recentlyIllinois was a low-tuition and high-aid state - however fees are now going up as they are inso many other states. Where the state at one time provided two thirds of university coststo state institutions, it now sits at 30%. Urbana-Champaign is a good example of a stateuniversity with a selective academic profile that has steadily charged higher and higherfees - indeed, of the nine public universities in Illinois, Urbana charges the highest fees.
Their fees may be high for a state university, but of course are still relatively low whencompared to many private institutions. Nonetheless it is clear that fees alone - certainlythe sticker-price fees - do not determine enrolment. Whereas the private De Paul, withsticker price tuition fees of nearly $16,950, has 30% of its students in receipt of thefederal Pell Grant (a commonly used measure of low-income students), Urbana has in-state fees of just over $8,452 but only 17% of its students are Pell Grant recipients. Ofthose that are, nearly all are either African American or Latino - 93% of all its Pell Grantstudents. However, although the lowest-income students may not be present in largenumbers, there are many others who still need help with tuition, fees and maintenance -currently 42% of their freshmen get some kind of needs-based financial assistance,although at De Paul this stands at 67%. At Urbana aid takes multiple forms - including
Higher Education in the USA, Student fees, financial aid and access
21
grants, scholarships, loans and fee waivers - but one of the key forms of aid at Urbana isin the form of campus employment, which has been found to be more supportive of, andcompatible with, study than employment off-campus.
It should also be noted that Urbana is more selective in terms of its intake - it onlyaccepts 60% of its applicants, of whom 49% take up places, whereas De Paul accepts78% of applicants but only sees 32% enrol. (Source for percentage and figurecomparisons - College Admissions US, website www.collegeapps.about.com)
In terms of enrolment trends, Urbana is seeing a slow increase in low-income andminority students (largely the same people, as demonstrated above) coupled with anincrease in well-off students. The group that is diminishing is lower-middle incomestudents. The view is that the least well-off students are relatively well-supported by theinstitution, which is presumably possible, in part, because there are relatively fewer ofthem. There is less aid available for lower-middle income students - those from familiesearning $50,000 - $60,000 per year.
One interesting question is to what extent the differences in the student profiles of thetwo institutions reflects mission (in particular De Paul’s genesis as a Catholic Institutiondedicated to serving poor communities) or their different financial circumstances, and thedifferent enrolment mixes that pitch fee levels against available financial aid.
International Comparators of Widening Participation in Higher Education – Policy and Practice
22
The nature of our visit meant that discussions with colleagues in the US threw upquestions and points of comparison with England as well as providing valuableinformation. Rather than attempt to draw hard and fast conclusions it is perhaps moreuseful to share the following: the particular issues that struck us in terms of theirdifference to England, examples that might be useful and instructive for policy-makinghere, and some factors that we might consider as straws in the wind, as the English HEsector and HE institutions gear up for changes in fees and student finance. It should benoted, however, that these points arise from the experience of one state, albeit set in a USfederal context.
Key pointsWe were struck:
• That access is approached via the individual student - there are apparently no, or few, levers in relation to institutional behaviour (other than the market - for instanceinstitutions recruiting locally from poor/ethnically diverse populations must seek toserve them). For high-prestige and wealthy institutions to reach out in access termsappears to be a matter of mission and/or leadership commitment.
• That rising fees and increased debt do appear to be impacting on lower-income groups – contrary to some rhetoric – particularly in terms of retention, choice ofinstitution (i.e. community college rather four-year university) and in the time taken to complete a degree.
• That flexibility, in terms of mode of study, time taken to complete and choice of coursesand combinations of courses, is more real than in England and is an important factor inmaking HE accessible to poorer students – although part-time study is still not “thenorm” and is still the less-preferred route.
• That the politics of who to support and how to market that support is critical at bothfederal and state level. Conservative pressures towards forms of financial aid benefit themiddle classes - tax credits, loans, merit-based aid, funding direct to individual studentsand away from institutions.
• That there is not the same expectation of equity of treatment across the country as wehave in England.
• That financial pressures do appear to be leading some institutions to play safe and gofor retaining middle-income students - with good academic preparedness - rather thanrecruiting “access” students.
8. Implications for England

Higher Education in the USA, Student fees, financial aid and access
23
Useful examplesThere is much for us to learn from the US system. Whilst those working on access andwidening participation issues in England might most straightforwardly wish to seeemulated the aspirations almost all high-school graduates have to continue with theireducation, we also identified more specific and detailed matters from which the Englishsystem and institutions might learn - notably:
• The level of institutional understanding - data collection and tracking - of the interplay offees, academic selectivity, financial support and student profile.
• The collection of longitudinal information at state level such as that collected by ISAC.
• The awareness in some institutions of how to use such information andmonitoring/analytic tools to pursue access goals.
• Certain specific forms of student support, such as campus-based employment.
• The increased amount of flexibility for students in choosing when and how to study -and a move away from judging institutions by three-year degree completion towardsmore sophisticated forms of retention analysis.
Straws in the wind?Perhaps, more than anything, we can learn from the fact that the experience of the UShigher education system in managing rising fees and student debt is several years aheadof ours. We need to look across to the experiences of countries such as the US inanticipating the trends and challenges ahead. The following features of the US systemstruck us as particularly germane to the debate in front of English higher education:
• The trends towards rising fees, and political pressures that have led to cuts (andregressive changes) in federal and state aid.
• The increasing levels of student debt - to the extent that the time-honoured concept of“working your way through college” is no longer feasible - and its long term implicationsfor other markets such as the housing market.
• The individualisation of financial aid and fee packages and the lack of transparency insupport arrangements.
• The lack of leverage over institutions - left to themselves institutions tend to movetowards financial and enrolment strategies to secure their market position, make money,and keep selectivity up.
• The lack of correlation between generous individual packages and impact on overallenrolments - as evidenced by the position of some of the most prestigious and generousinstitutions at the bottom of the economic diversity rankings.
• The lack of focus on institutional practices to support student success, but rather acompensatory culture of supplementary instruction.
International Comparators of Widening Participation in Higher Education – Policy and Practice
24
References
Advisory Commision on Student Financial Assistance, 2001, Access Denied: Restoring theNation’s Commitment to Equal Opportunity, Washington D.C.
Advisory Commision on Student Financial Assistance, 2002, Empty Promises: the Myth ofCollege Access in America, Washington D.C.
Boushey, H., 2003, The Debt Explosion Among College Graduates, Center for Economicand POlicy Research.
College Board, 2004, Trends in Student Aid.
College Board, 2003, Trends in College Pricing.
Conklin, K., & Wellner, J., 2004, Linking Tuition and Financial Aid Policy: The Gubernatorialperspective, WICHE.
Dept. of Education, 2002, Beginning Postsecondary Students Longitudinal Study, 1996-2001 Data Analysis System, Washington, D.C.: U.S. National Center for EducationStatistics.
Halperin, S., 1998, The Forgotten Half Revisited, American Youth Policy Forum,Washington DC.
Illinois Student Assistance Commission, 2003, Are Cost Barriers Keeping QualifiedStudents from College.
Illinois Student Assistance Commission, 2002, Increasing college access or just increasingdebt?
Programme for the second annual data driven strategic management enrolmentconference, June 2005, USA
Spittle B., 2005, USA report, DePaul University.
Weko, T., 2004, Old dogs and New tricks: What can the UK teach the US about UniversityEducation?, Higher Education Policy Institute.
Higher Education in the USA, Student fees, financial aid and access
International Comparators ofWidening Participation inHigher Education – Policy and Practice
Further information
If you want to know more please get in touch with the authors whose contact details can be found onthe action on access website.
www.actiononaccess.org
Liz Allen, Lucy Solomon, John Storan and Liz Thomas
Series Editor: Mary Stuart