Embed Size (px)
Citation preview

Internal vs. External On-Premise Sign Lighting: Visibility and Safety in the Real World Prepared for United States Sign Council Foundation
FINAL REPORT February 2009 Prepared by Philip M. Garvey, Martin T. Pietrucha, Steve Damin and Damian Deptuch
PENNSTATE
The Thomas D. Larson The Pennsylvania State University Pennsylvania Transportation Institute Transportation Research Building
University Park, PA 16802-4710 (814) 865-1891 www.pti.psu.edu

Technical Report Documentation Page Form DOT F 1700.7 (8-72) Reproduction of completed page authorized
1. Report No. PSU-2008-02 2. Government Accession No. 3. Recipient’s Catalog No. 4. Title and Subtitle Internal vs. External On-Premise Sign Lighting: Visibility and Safety in the Real World
5. Report Date February 2009
6. Performing Organization Code
7. Author(s) Philip M. Garvey, Martin T. Pietrucha, Steve Damin and Damian Deptuch
8. Performing Organization Report No. PTI 2008-22
9. Performing Organization Name and Address The Thomas D. Larson Pennsylvania Transportation Institute The Pennsylvania State University 201 Transportation Research Building University Park, PA 16802
10. Work Unit No. (TRAIS)
11. Contract or Grant No. IUCRA 105569 DTRT07-G-0003
12. Sponsoring Agency Name and Address United States Sign Council 211 Radcliffe Street Bristol, PA 19007 U.S. Department of Transportation Research and Innovative Technology Administration 3rd Fl, East Bldg E33-461 1200 New Jersey Ave, SE Washington, DC 20590
13. Type of Report and Period Covered Final Report 7/1/2008 – 2/28/2009
14. Sponsoring Agency Code
15. Supplementary Notes COTR: Andrew Bertucci, 215-785-1922, [email protected]
16. Abstract Poorly visible on-premise commercial signs have been associated with reduced safety, as drivers trying to locate and make sense of these signs may drive slower than the rest of traffic and perform erratic, last-second maneuvers. One of the main reasons for reduced sign visibility is poor sign lighting. In addressing this issue, past research sponsored by the United States Sign Council Foundation demonstrated that internally illuminated on-premise signs have 40 to 60 percent greater visibility than externally illuminated signs in a controlled test track environment. Even so, an ever-increasing number of jurisdictions are implementing sign ordinances that prohibit the use of internally illuminated on-premise signs, mainly for aesthetic reasons. The objective of this research was to expand on the earlier test track research by evaluating the relative visibility of internally and externally illuminated signs on open roads in the real world. The results of this research clearly demonstrate the superiority of internally illuminated signs across a wide variety of driving conditions, sign offsets, sign sizes, shapes, colors, external lighting designs and quality levels. 17. Key Words Internally illuminated, externally illuminated, sign, lighting design, visibility
18. Distribution Statement No restrictions. This document is available from the National Technical Information Service, Springfield, VA 22161
19. Security Classif. (of this report) Unclassified
20. Security Classif. (of this page) Unclassified
21. No. of Pages 15
22. Price
3
TABLE OF CONTENTS
Background and Objectives ....................................................................................... 1
Methodology .............................................................................................................. 1
Variables .............................................................................................................. 1
Location ............................................................................................................... 2
Externally Illuminated Signs................................................................................ 2
Internally Illuminated Signs ................................................................................. 5
Photometric Characteristics ................................................................................. 8
Subjects ................................................................................................................ 9
Procedure ............................................................................................................. 9
Analysis and Results ..................................................................................................10
Conclusions ................................................................................................................14

1
Background and Objectives Poorly visible on-premise commercial signs have been associated with reduced safety,
as drivers trying to locate and make sense of these signs may drive slower than the rest
of traffic and perform erratic, last-second maneuvers (IESNA, 2001). One of the main
reasons for reduced sign visibility is poor sign lighting (Garvey and Kuhn, 2004). In
addressing this issue, past research sponsored by the United States Sign Council
Foundation (USSCF) demonstrated that internally illuminated on-premise signs have 40
to 60 percent greater visibility than externally illuminated signs in a controlled test track
environment (Garvey, et al., 2004). Even so, an ever-increasing number of jurisdictions
are implementing sign ordinances that prohibit the use of internally illuminated on-
premise signs, mainly for aesthetic reasons. The objective of this research was to
expand on the earlier test track research by evaluating the relative visibility of internally
and externally illuminated signs on open roads in the real world.
Methodology The study was an older-and-younger-driver, gender-balanced, human factors evaluation
of the nighttime sign visibility and safety effects of commercial on-premise sign lighting
design. The general methodology was an open field, or “real world,” study wherein a
representative sample of the driving population was asked to find and read internally
and externally illuminated signs on actual storefront properties while operating a vehicle
on in-use roadways.
Variables
The critical independent variable was on-premise sign lighting design (internal versus
external illumination). Additional variables included driver age, gender, visual acuity,
and driving speed.
The dependent variable (or measure of effectiveness) was a real-world
combination of detection and legibility distance used effectively in earlier research
(Zineddin, et al., 2005).

2
Location
The six signs were located on sections of US 26 and US 322 Business in State College,
PA (Figure 1; A and D are the start and end points, B and C are the two furthest signs).
At four of the six sign locations, both US 322 and US 26 are major arterials that are
comprised of five-lane (one turn lane), two way cross sections with curbing. At two of
the sign locations on Rt. 26 (Summit and Fine Line), the cross section drops to three-
lanes (one turn lane), two way. The posted speed limit on the approach to the Animal
Medical Hospital and Viet Thai Restaurant signs was 35 mph; the posted speed for the
approaches to the remaining four signs was 45 mph.
Figure 1. Test route.
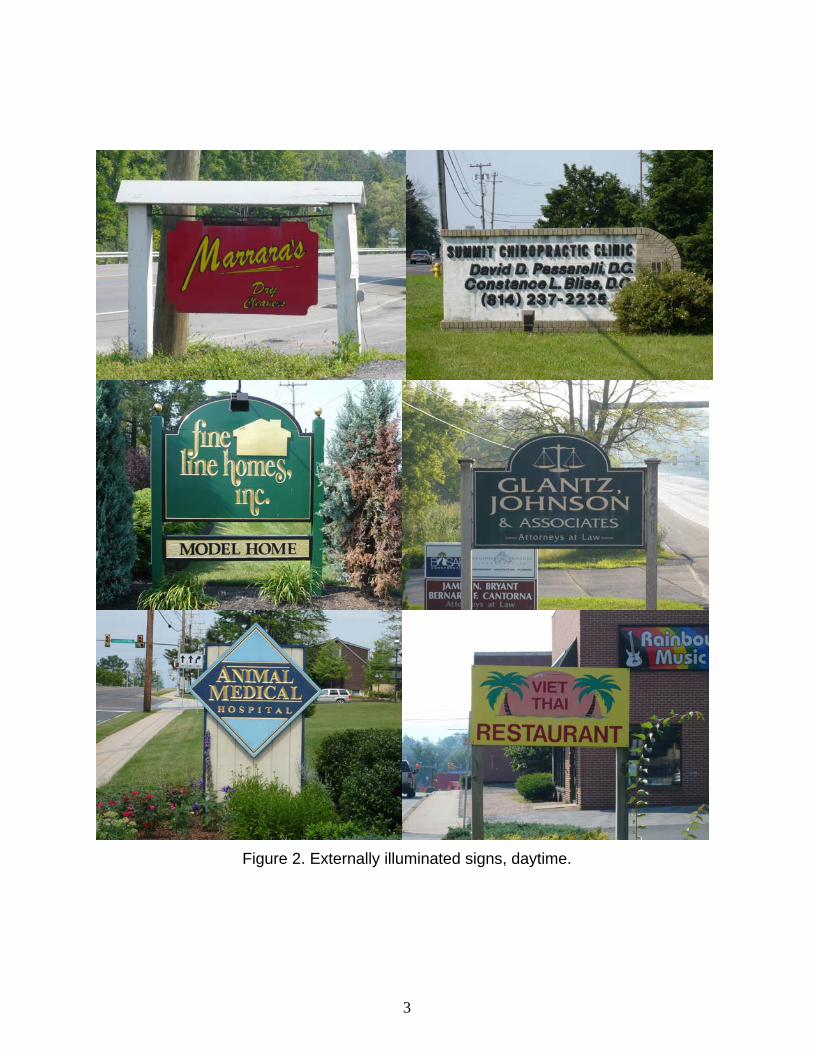
Externally Illuminated Signs
With advice from the USSC, the researchers selected six existing, in use, externally
illuminated signs for this study (Figure 2), narrowed down from a field of 25 candidate
signs identified by the research team. In the previous research evaluating the relative
readability of internally and externally illuminated signs, Garvey and his colleagues
(2004) optimized external sign illumination with the use of clean, new, flood lamps
aimed with precision at the signs, ensuring a high level of uniform illumination
throughout the evaluation. The externally illuminated signs selected for the current
study better reflect what drivers are exposed to in the real world in that they varied in
lighting quality and brightness level from poor to excellent (Figure 3; Table 1).
3
Figure 2. Externally illuminated signs, daytime.

4
Figure 3. Externally illuminated signs, nighttime.

5
Table 1. Description of external lighting equipment and placement.
Sign Distance of Lamps to Sign
Number of Lamps
Type of Bulb
Wattage of Bulb
Marrara’s
5 ft 2 Halogen 300 W
Summit
4 ft 1 Mercury 100 W
Fine Line
3 ft 1 Metal Halide 50 W
Glantz Johnson
6.5 ft 1 Fluorescent
Reflector Lamp
26 W
Animal Medical Hospital
8 ft 1 Halogen 100 W
Viet Thai 6 ft 1 Halogen
Unmarked bulb
Between 100 and 200 W
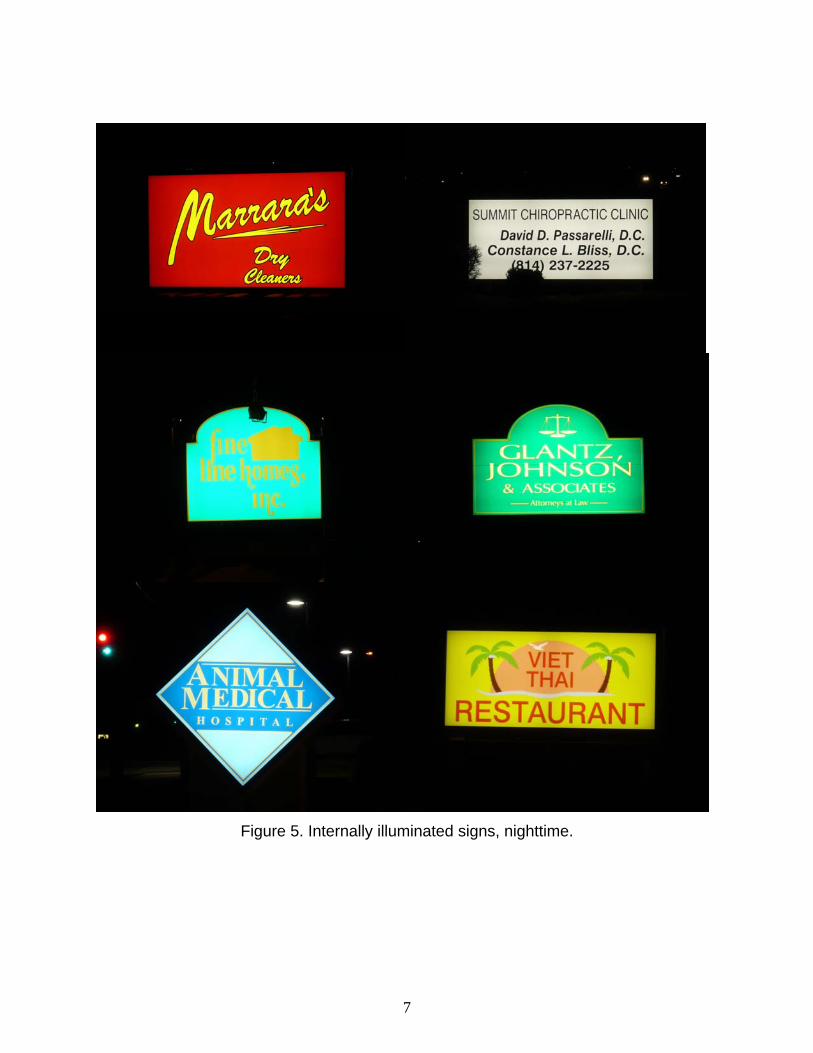
Internally Illuminated Signs A set of internally illuminated signs identical to the six existing, externally illuminated
signs in copy (e.g., message, letter height, font, and spacing), sign shape, color,
contrast orientation, and size were designed and fabricated by volunteer USSC
members (Figures 4 and 5; See Appendix A for sign specification sheets). The
nighttime lighting levels and design were based on sign industry standards that have
been found to be optimal for these signs in earlier research (Garvey, et al., 2009).

6
Figure 4. Internally illuminated signs, daytime.
7
Figure 5. Internally illuminated signs, nighttime.

8
Photometric Characteristics
The experimenters documented the luminance (brightness) of the internally and existing
externally illuminated signs using a Minolta LS-110 luminance meter (Table 2) and
techniques successfully developed in earlier research (Garvey, 2005; Garvey, et al.,
2009).
Table 2. Nighttime sign luminance (cd/m2)
Sign Color Internal Illumination External Illumination
Red 15 13
Yellow 150 60
White 700 15
Green 60 1.0
Gold (inlay letters) 80 10
Green 30 0.5
White 180 2.9
Dark Blue 20 0.25
Light Blue 130 1.25
Gold (inlay letters) 130 1.5
Brown 40 0.5
Red 110 2.5
Green 187 1.25
Pink 260 5.0
Yellow 325 8.0
9
Five of the signs fell within recommended levels to avoid glare effects for rural,
suburban, and urban environmental lighting (i.e., Environmental Zones E2, E3, and E4)
under both internal and external illumination, with the sixth (Summit Chiropractic Clinic)
accommodating lighting zones E3 and E4 when internally illuminated and Zones E2, E3,
and E4 when externally illuminated (Garvey, 2005).
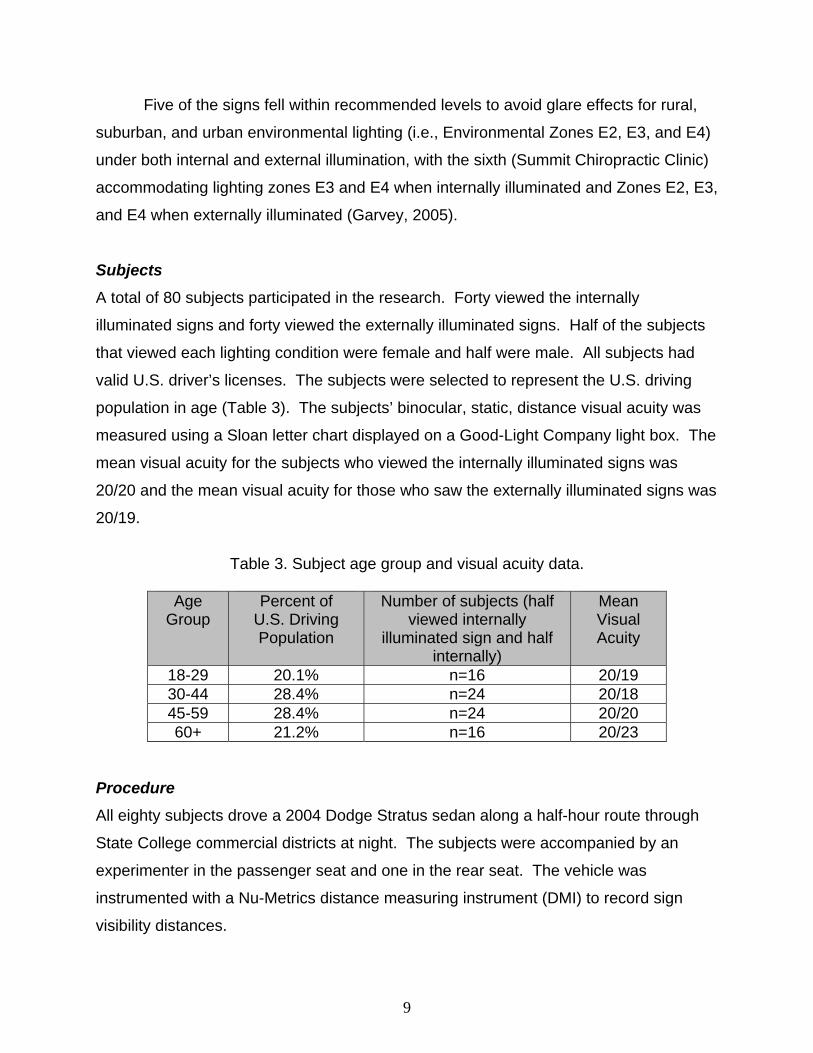
Subjects
A total of 80 subjects participated in the research. Forty viewed the internally
illuminated signs and forty viewed the externally illuminated signs. Half of the subjects
that viewed each lighting condition were female and half were male. All subjects had
valid U.S. driver’s licenses. The subjects were selected to represent the U.S. driving
population in age (Table 3). The subjects’ binocular, static, distance visual acuity was
measured using a Sloan letter chart displayed on a Good-Light Company light box. The
mean visual acuity for the subjects who viewed the internally illuminated signs was
20/20 and the mean visual acuity for those who saw the externally illuminated signs was
20/19.
Table 3. Subject age group and visual acuity data.
Age
Group Percent of
U.S. Driving Population
Number of subjects (half viewed internally
illuminated sign and half internally)
Mean Visual Acuity
18-29 20.1% n=16 20/19 30-44 28.4% n=24 20/18 45-59 28.4% n=24 20/20 60+ 21.2% n=16 20/23
Procedure
All eighty subjects drove a 2004 Dodge Stratus sedan along a half-hour route through
State College commercial districts at night. The subjects were accompanied by an
experimenter in the passenger seat and one in the rear seat. The vehicle was
instrumented with a Nu-Metrics distance measuring instrument (DMI) to record sign
visibility distances.
10
The subjects were given simple route directions to follow and were instructed to
drive “as they normally would” while emphasizing safety and maintaining the posted
speed. To simulate the common experience drivers have when they know what
business establishment they are looking for, but do not know its location, the subjects
were told the name of the establishment and were asked to read the sign aloud as soon
as they could. The moment the subjects read the signs correctly, the experimenter in
the passenger seat pressed a button on the DMI. The button was pressed a second
time when the vehicle was alongside the signs. The DMI calculated the distance
between the two button presses and recorded the result as the visibility distance for that
condition.
The internally illuminated signs were placed in front of and blocking the externally
illuminated signs while the first half of the subjects participated. The internally
illuminated signs were then removed and the second half of the subjects viewed the
externally illuminated signs using the same procedures.
Analyses and Results Gender and Age
Forty males and 40 females participated in the study. On average, the males read the
signs at 233 ft and the females at 225 ft. An analysis of variance (ANOVA) was
conducted and, not surprisingly, this was not a statistically significant difference
(F=0.28; p = .60). Another ANOVA showed that there was also no statistically
significant age group effect (F=1.58; p=.20), with the youngest age group reading the
signs at, on average, 213 ft, the two middle groups at 249 and 236 ft, and the oldest
group at 202 ft.
Visual Acuity, Familiarity, Weather
Three separate ANOVAs were conducted on these variables. There were no
statistically significant effects as a function of subject static visual acuity (F=1.72;
p=.16). Although visual acuity is often found to be a good predictor of sign legibility, this
was not the case for the small range in visual acuity combined with the complex task of
finding and reading signs in the real world while driving in live traffic at night.

11
A portion of the subjects were from the local State College area and knew the
location of some of the business establishments where the six test signs were mounted.
The statistical analysis showed slight improvement (254 ft versus 221 ft) in the distance
at which the signs were found and read as a function of sign familiarity (F=4.55; p=.04).
Some of the data were collected during light rain or light snow, or when the roads
were wet. An analysis of the data showed that this did not significantly affect sign
detection and reading distances (F=0.59; p=.63).
Speed
Two separate statistical analyses were conducted on the two lighting conditions to
determine whether there was a significant correlation between speed and sign reading
distance in this study. The hypothesis was that when drivers have difficulty reading a
sign, they will slow down, which presents potential traffic safety concerns. While the R2
values were small (hovering around .10), they were statistically significant (t=4.93;
p<.0001 for externally illuminated signs and t=4.83; p<.0001 for internally illuminated
signs), revealing that the drivers in this study did indeed drive more slowly around less
visible signs (Figure 6).
Figure 6. Scatterplot of sign visibility distance in feet by speed in mph.
External Internal
60
0
100
200
300
400
500
600
700
Speed (mph)10 20 30 40 50
Mea
n Vi
sibi
lity
Dis
tanc
e (ft
)
12
Sign
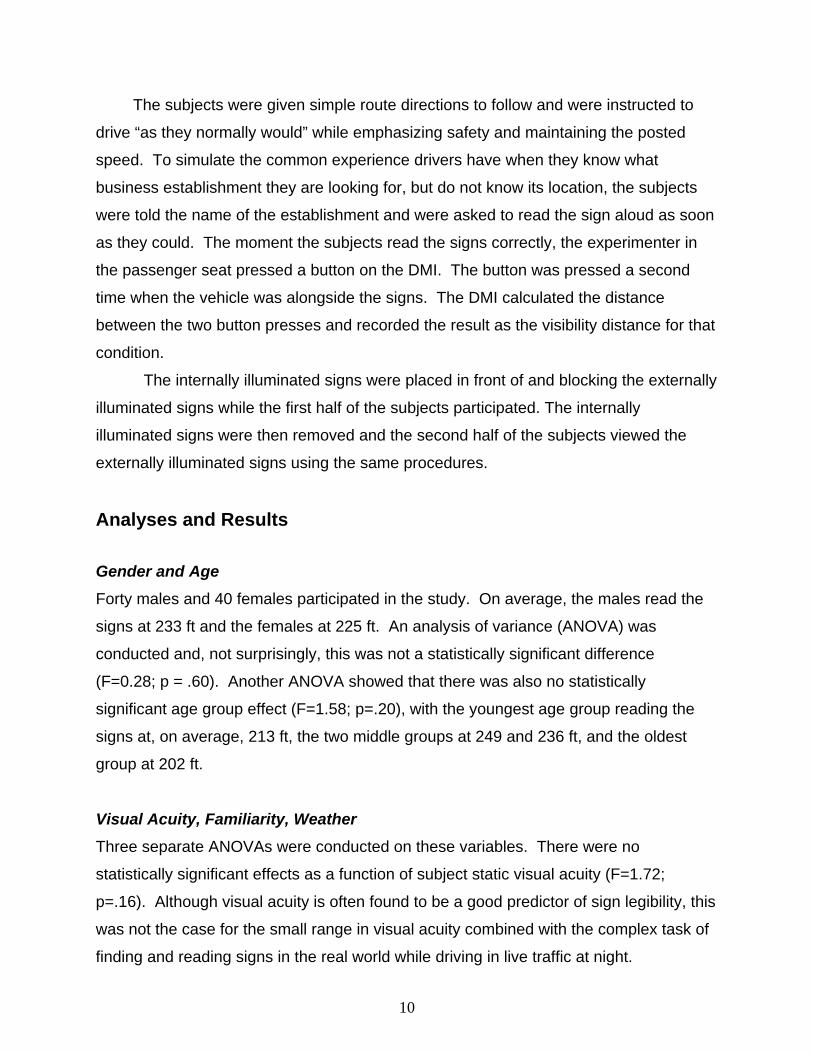
Sign visibility differed across the six signs (Figure 7, the numbers in the bars indicate
the number of subjects who drove past the sign without ever seeing it). The average
reading distances of the six signs varied due to differences in: location, including
placement on the left (Summit) or right side of the road (all the others); lateral and
vertical sign offset; roadway characteristics (e.g., number of lanes of traffic and
curvature); and characteristics of the signs themselves, perhaps most importantly size,
color, and shape.
The statistical Glimmix Procedure was used to determine which of the signs were
significantly affected by lighting design. The result was that all of the signs performed
statistically significantly better with internal illumination. The biggest improvement was
with the Animal Medical Hospital sign, which was read on average 2.36 times further
away with internal illumination. This was a 196-ft mean difference, giving drivers almost
4 extra seconds at 35 mph. Furthermore, this sign was completely missed by two
drivers when it was externally illuminated. Even the most modest increase (Marrara’s
Dry Cleaner) resulted in almost 1.35 extra seconds of driver reaction time and this was
a sign that was maximally externally illuminated with two 300 watt halogen lamps.
0
100
200
300
400
Viet Thai Summit GlantzJohnson
Marrara's AnimalMedical
Fine Line
Mea
n V
isib
ility
Dis
tanc
e (ft
)
External Illumination Internal Illumination
Figure 7. Effect of illumination type on individual sign visibility.
2 2 3 1
1
3
1
1

13
Internal versus External Illumination
The Tukey-Kramer statistical test was used to evaluate the combined visibility of all six
signs tested. The test showed a statistically significant improvement in sign visibility
when internally illuminated (t=-10.19; p<.0001). Overall, the internally illuminated signs
were visible on average 68 percent further away than the externally illuminated signs
(291 versus 173 feet; Figure 8). This is a 118-foot difference, which at 35 mph means
that drivers have an additional 2.3 seconds to read and react to the externally
illuminated signs (1.8 seconds at 45 mph).
0
50
100
150
200
250
300
350
External Illumination Internal Illumination
Sign Illumination
Mea
n V
isib
ility
Dis
tanc
e (ft
)
Figure 8. Effect of illumination type on overall sign visibility.
Conclusions The primary objective of this research project was to conduct a one-to-one comparison
between internally and externally illuminated, on-premise signs on open roadways,
using real drivers, and actual in-use signs. To fairly evaluate the differences in
nighttime visibility between signs that are internally illuminated and signs that are
externally illuminated, the signs must be identical in all aspects other than lighting
design. This was accomplished by fabricating exact internally illuminated replicas of the
existing externally illuminated signs and placing them in front of the existing signs, so
that not just the signs, but the locations and offsets (and therefore the visual surround
and roadway characteristics) were identical.

14
The results of this research clearly demonstrate the superiority of internally
illuminated signs across a wide variety of driving conditions, sign offsets, sign sizes,
shapes, colors, and external lighting designs and quality levels. The overwhelmingly
positive response from the participating establishments and their patrons, as well as the
visual evidence from Figures 2-5, also demonstrate the fallacy that internally illuminated
signs are inherently less esthetically pleasing than externally illuminated signs.
Furthermore, internal sign illumination avoids some of the intractable problems
with external illumination, illustrated in Figure 3, such as: difficulty in maintaining the
directionality of the light source over time, which often results in non-uniform light
distribution (e.g., Viet Thai); “hot spots,” especially on metallic inlay signs (e.g., Fine
Line Homes, where the luminance on the house reached over 3,000 cd/m2); and light
trespass, both onto other properties and into the eyes of oncoming drivers (e.g.,
Marrara’s and Glantz, Johnson).
Although on-premise signs are a critical wayfinding device for drivers, poorly
visible on-premise signs negatively impact road user safety by causing drivers to slow
down in traffic (demonstrated in this research) or make erratic maneuvers. Internally
illuminated on-premise signs have been shown to significantly increase the distance at
which these signs can be read over externally illuminated signs. This was first
demonstrated in a test track study where 40 to 60 percent improvements were found.
The present study showed that even greater improvements (almost 70 percent on
average and 240 percent in the best case) can be made when actual in-use, externally
illuminated signs are upgraded to ones that use internal illumination.
In this study, internally illuminated signs gave drivers on average about 2
seconds (and in extreme cases almost 4 seconds) more time than externally illuminated
signs to read the signs and maneuver their vehicles (known as Viewer Reaction Time or
VRT), which could transfer to a tremendous safety benefit.
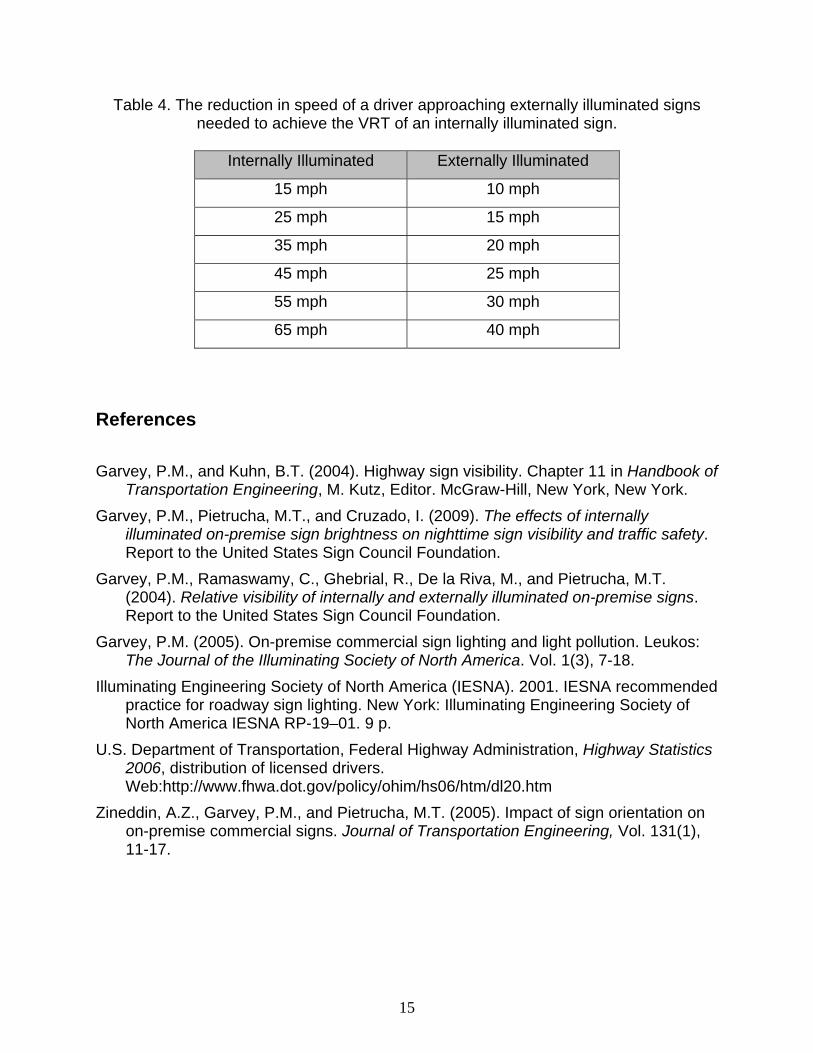
Another way to look at it is that to get the same VRT for an externally illuminated
sign that you get with an internally illuminated sign of exactly the same size, design,
color, placement, etc., the driving speed would need to be reduced by approximately 40
percent. For example, to equal the VRT of an internally illuminated sign at 25 mph, a
driver would need to approach an externally illuminated sign at about 15 mph (see
Table 4 for more examples).
15
Table 4. The reduction in speed of a driver approaching externally illuminated signs needed to achieve the VRT of an internally illuminated sign.
Internally Illuminated Externally Illuminated
15 mph 10 mph
25 mph 15 mph
35 mph 20 mph
45 mph 25 mph
55 mph 30 mph
65 mph 40 mph
References Garvey, P.M., and Kuhn, B.T. (2004). Highway sign visibility. Chapter 11 in Handbook of
Transportation Engineering, M. Kutz, Editor. McGraw-Hill, New York, New York. Garvey, P.M., Pietrucha, M.T., and Cruzado, I. (2009). The effects of internally
illuminated on-premise sign brightness on nighttime sign visibility and traffic safety. Report to the United States Sign Council Foundation.
Garvey, P.M., Ramaswamy, C., Ghebrial, R., De la Riva, M., and Pietrucha, M.T. (2004). Relative visibility of internally and externally illuminated on-premise signs. Report to the United States Sign Council Foundation.
Garvey, P.M. (2005). On-premise commercial sign lighting and light pollution. Leukos: The Journal of the Illuminating Society of North America. Vol. 1(3), 7-18.
Illuminating Engineering Society of North America (IESNA). 2001. IESNA recommended practice for roadway sign lighting. New York: Illuminating Engineering Society of North America IESNA RP-19–01. 9 p.
U.S. Department of Transportation, Federal Highway Administration, Highway Statistics 2006, distribution of licensed drivers. Web:http://www.fhwa.dot.gov/policy/ohim/hs06/htm/dl20.htm
Zineddin, A.Z., Garvey, P.M., and Pietrucha, M.T. (2005). Impact of sign orientation on on-premise commercial signs. Journal of Transportation Engineering, Vol. 131(1), 11-17.

16
APPENDIX A
Internally Illuminated Sign Specification Sheets