Embed Size (px)
Citation preview

lable at ScienceDirect
Journal of Power Sources 252 (2014) 8e13
Contents lists avai
Journal of Power Sources
journal homepage: www.elsevier .com/locate/ jpowsour
Short communication
Internal resistance matching for parallel-connected lithium-ion cellsand impacts on battery pack cycle life
Radu Gogoana a, Matthew B. Pinson b,*, Martin Z. Bazant c,d, Sanjay E. Sarma a
aDepartment of Mechanical Engineering, Massachusetts Institute of Technology, 77 Massachusetts Avenue, Cambridge, MA 02139, USAbDepartment of Physics, Massachusetts Institute of Technology, 77 Massachusetts Avenue, Cambridge, MA 02139, USAcDepartment of Chemical Engineering, Massachusetts Institute of Technology, 77 Massachusetts Avenue, Cambridge, MA 02139, USAdDepartment of Mathematics, Massachusetts Institute of Technology, 77 Massachusetts Avenue, Cambridge, MA 02139, USA
h i g h l i g h t s
* Corresponding author. Tel.: þ1 617 253 3178; faxE-mail address: [email protected] (M.B. Pinson).
0378-7753/$ e see front matter � 2013 Elsevier B.V.http://dx.doi.org/10.1016/j.jpowsour.2013.11.101
g r a p h i c a l a b s t r a c t
� We demonstrate the importance ofresistance matching in battery packs.
� At 4.5C charge and discharge, 20%resistance mismatch reduces lifetimeby 40%.
� We quantitatively explain experi-mental results using a model of SEIformation.
� Resistance mismatch causes unevencurrent sharing.
� Uneven current results in high oper-ating temperatures, decreasinglifetime.
a r t i c l e i n f o
Article history:Received 3 July 2013Received in revised form25 November 2013Accepted 26 November 2013Available online 10 December 2013
Keywords:LithiumBatteryPackLifetimeResistanceTemperature
a b s t r a c t
When assembling lithium-ion cells into functional battery packs, it is common to connect multiple cellsin parallel. Here we present experimental and modeling results demonstrating that, when lithium ioncells are connected in parallel and cycled at high rate, matching of internal resistance is important inensuring long cycle life of the battery pack. Specifically, a 20% difference in cell internal resistance be-tween two cells cycled in parallel can lead to approximately 40% reduction in cycle life when comparedto two cells parallel-connected with very similar internal resistance. We show that an internal resistancemismatch leads to high current into each cell during part of the charging cycle. Since capacity fading isstrongly dependent on temperature, and hence on charging rate when this rate is sufficiently high, thehigh current leads to substantially accelerated capacity fade in both cells. A model, based on the for-mation of a solid-electrolyte interphase, is able to explain the dependence of lifetime on resistancemismatch, and also identifies the importance of random sudden capacity losses.
� 2013 Elsevier B.V. All rights reserved.
1. Introduction
In this paper, we present experimental results showing theimpact of internal resistance mismatch on cycle life, and outline amodel to explain this effect.
: þ1 617 258 5766.
All rights reserved.
Internal resistance mismatch becomes an important problemfor applications where the battery pack is subjected to high C rates,and required to have a long cycle life (many hundreds to tens ofthousands of cycles). Example applications include hybrid vehicleand power tool battery packs.
The detrimental effect of internal resistance mismatch betweenparallel-connected cells arises because differences in internalresistance lead to uneven current distribution within the cells; the

List of symbols
A surface area onwhich solid-electrolyte interphase (SEI)can form, m2
c concentration of S at the graphite surface, MD diffusivity of S through SEI, m2 s�1
D0 diffusivity of S through SEI when charging current isnegligible, m2 s�1
E activation energy for the diffusion of S through SEI, JI maximum charging C rate to which a cell is subjected
in a particular cyclek rate constant of the reaction forming SEI, s�1 m�2 M�1
m molecular mass of SEI, kgQ capacity of a cell, Ah
Q0 capacity of a cell when uncycled, AhQ1 capacity of the more resistive cell in a cell group, AhQ2 capacity of the less resistive cell in a cell group, AhQx excess capacity of themore resistive cell in a cell group,
AhR1 resistance of the more resistive cell in a cell group, UR2 resistance of the less resistive cell in a cell group, US the species that reacts with Li to form SEIs thickness of the SEI, mT temperature, Kt time, sa parameter quantifying the dependence of D on currentD internal resistance mismatchr density of SEI, kg m�3
Fig. 1. Internal resistance distribution of cells tested.
R. Gogoana et al. / Journal of Power Sources 252 (2014) 8e13 9
resulting unexpectedly high currents decrease battery pack life.Current distribution within parallel-connected cells is typically notmonitored in commercial battery packs in order to reduce batterymanagement system complexity and cost. This means that the ef-fect of internal resistance mismatch must be quantified in order toassess the importance of this consideration in battery packassembly.
In this paper we quantify the relationship between internalresistance mismatch and battery degradation, combining experi-mental data with a simple model of capacity fade. This model as-sumes that the growth of a solid electrolyte interphase is theprimary cause of capacity fade [1,2], though the conclusionsregarding the importance of internal resistance mismatch do notrely on the details of the fade mechanism.
2. Experimental setup
2.1. Cell characterization
The cells used in this study were commercially available 2.2 Ahcylindrical LiFePO4 cathode, graphite anode cells, designed for usein high-C-rate applications.
The internal resistance of 72 cells was tested. Internal resistancewas measured at 50% state of charge (SOC) with a 15 s DC pulse of40 A (17C). While there is no commonly accepted standard formeasuring the internal resistance of lithium-ion batteries, we chosethis current and time profile because it is relevant to the duty cycleseen by these cells in hybrid vehicles and power tools. A comparisonof several methods for the internal resistance of lithium-ion cells isprovided by Schweiger et al. [3]. The 15 s current pulse allows theeffects of the mass-transfer limited reaction to show. Longer delaytimes can lead to significant self-heating of the cell which affects themeasured internal resistance. This 17C discharge rate is within thespecified rating for thishigh-powercell, of 32Ccontinuousdischargeand 55C for 10-s peaks. The characterization testswere done on barecells in a background room temperature of 25 �C.
The resistance difference between the most and least resistivecells was 24.7%. The maximum difference in capacity in this samebatch of cells (one full discharge cycle at 17C continuous dischargecurrent) was 3.6%. For the purposes of this experiment, the differ-ences in initial capacity were considered to be negligible comparedto the differences in internal resistance (Fig. 1).
2.2. Lifetime cycling setup
Six battery packs (each containing two cells connected in par-allel, as depicted in Fig. 5) were tested using the method described
below. For further reference within this paper, two parallel-connected cells are called a “cell group”. The current to each celland the temperature of each cell were recorded. A photo of theexperimental cell groups is seen in Fig. 2. The cell group assemblywas designed to thermally decouple the two cells: each cell had itsown 8 cm wire lead and the cells were physically separated withplastic spacers so that the casings were 8 mm apart.
The cycling tests were carried out with the followingparameters:
� Constant current charging of 20A to 3.65 V per cell group (4.5C)� Constant voltage held at 3.65 V with termination current of 1 A� 1 min rest period between charge and discharge� Constant current discharge of 20 A to 2.40 V (4.5C)� 1 min rest period between discharge and charge.
Cycling tests were done at a loosely controlled background roomtemperature that varied between 24 �C and 31 �C, and the tem-perature of each cell’s aluminum casing was monitored continu-ously. The background temperature profile was the same for allcells. Data collection was done using an Agilent 34980A multi-function switch/measure mainframe with a 34921A multiplexercard. Charging, discharging and current control automation wasdone using 6 FMA Direct PowerLab 6 bidirectional chargers,running on a regulated 24 V DC bus.
3. Results
Fig. 3 plots cycle life, defined as the number of cycles for the cellgroup to reach 75% of the initial capacity, vs. internal resistancemismatch, defined by

Fig. 2. Lifetime cycling setup.
Fig. 4. Cycle life vs. initial resistance, showing little dependence of cycle life on anindividual cell’s initial resistance.
R. Gogoana et al. / Journal of Power Sources 252 (2014) 8e1310
D ¼ R1 � R2R
; (1)
2where R1 is the resistance of the more resistive cell and R2 that ofthe less resistive. The data show that higher internal resistancemismatch results in shorter lifetime.
In order to show that the difference in internal resistance be-tween cells in a parallel-connected group determines lifetime, andnot the initial resistance of the individual cells, cell lifetime isplotted against the initial resistance of each cell in Fig. 4. There is noclear dependence of lifetime on the internal resistance of an indi-vidual cell: in particular, considering all cells together and groupingcells according to internal resistance difference would give oppo-site signs of such dependence. Thus, if the internal resistance of anindividual cell has any effect on lifetime, it is much smaller than theeffect of the internal resistance mismatch between cells connectedin parallel. Of course, such an effect might be of scientific interestand could be studied further, but the larger effect is of more engi-neering importance.
4. Discussion
Previous work [1,4] has identified the growth of the solid-electrolyte interphase layer (SEI) on the graphite particles in the
Fig. 3. Cycle life vs. initial resistance mismatch, showing lower cycle life at highermismatch.
negative electrode as the primary mechanism of capacity fade inlithium ion batteries subjected to typical cycling conditions. Afterthe first few cycles, SEI growth is limited by the rate at whichreacting molecules from the electrolyte are transported throughthe existing SEI to the graphite surface, at which they react withlithium to form SEI. Experimental results show that the capacityfade rate does not strongly depend on current, provided that thecurrent is small, but increasing temperature greatly hastens ca-pacity fade [5,6]. In the case of the cells that we tested, the 4.5Ccharge and discharge currents were large enough to impact thecapacity fade rate, likely by increasing the cells’ operatingtemperature.
When two cells with different internal resistance are charged inparallel, the current experienced by each cell is not constant. Earlyin the charging process, the less resistive cell experiences a highercurrent. This may cause it to approach a fully charged state soonerthan the more resistive cell, resulting in an increase in current tothe more resistive cell towards the end of charging. A large differ-ence in internal resistance thus results in high maximum chargingcurrent to both cells in the cell group, which is shown in Fig. 6. Theless resistive cell 2 has higher current early in discharge and charge;the later increase in current to cell 1 is more apparent on dischargethan on charge.
It is important to note that the shape of the current distributioncurve in Fig. 4 is linked to shape of the voltage vs. capacity curve of
Fig. 5. A circuit diagram of the cell group arrangement tested in this work.
R. Gogoana et al. / Journal of Power Sources 252 (2014) 8e13 11
LiFePO4 cells, which is relatively flat between approximately 10%and 90% SOC. For other Li-ion cell chemistries that have moresloped voltage vs. capacity curves (LiMn2O4, LiCoO2, etc), we expecta “balancing-out” effect to occur throughout the charge anddischarge cycles. We only tested LiFePO4 cells. Because capacity andvoltage are more closely related for those chemistries, we expectthat both cells in a parallel-connected configurationwill reach end-of-discharge more evenly without a large difference in currentbetween the two cells toward the end of the cycle.
The experimental results presented here show that a highermaximum current increases the capacity fade rate, even whenaverage current is fixed. This could arise because resistive heatingcauses an increase in temperature, which exponentially increasesthe rate of capacity fade [1]. Although the temperature of all cellsincreased during cycling, there was no significant correlation be-tween the temperature of an individual cell and either current orthe rate of capacity fade. Thus, if the dependence of capacity fadingon current is due to a temperature increase, this temperature in-crease must be highly localized inside the cell. Alternatively, theaccelerating effect of very high current on capacity fade may beseparate from any temperature effect.
The difference in temperature between individual cells within acell group remained low. For example, a 11% difference in currentled to a 0.7 �C difference in temperature between cells. The tem-perature difference within the cells was most likely localized nearthe center of the spiral-wound electrode, which was difficult tomeasure practically in our experiment. Only the temperature of thecell casing, which was exposed to cooling airflow, was measured.The impact of temperature on the cycle life of lithium-ion cells hasbeen studied by several groups [1,2,7,8].
5. Analysis
5.1. Dependence of fade rate on current
Two of the present authors presented a model of capacity fadethat shows good agreement with experimental results [4]. Ac-cording to this model, capacity fade is due to the formation of agradually thickening SEI on the surface of graphite particles: thethickness s of this SEI layer is described by the differential equation
dsdt
¼ kcDmrðDþ ksÞ : (2)
Here k is the rate constant of the reaction forming SEI, m is themolecular mass and r the density of the SEI formed, c is the
Fig. 6. Current distribution within two parallel-connected cells upon cycling (initialresistance difference of 18%).
concentration in the electrolyte of the species that reacts withlithium to form SEI and D is the diffusivity of this species throughthe SEI. The capacity loss is proportional to SEI thickness, so
dQdt
¼ � kcDA2r
rDAþ kmðQ0 � QÞ; (3)
where Q is the remaining capacity, Q0 is the initial capacity and A isthe surface area on which SEI can form [4].
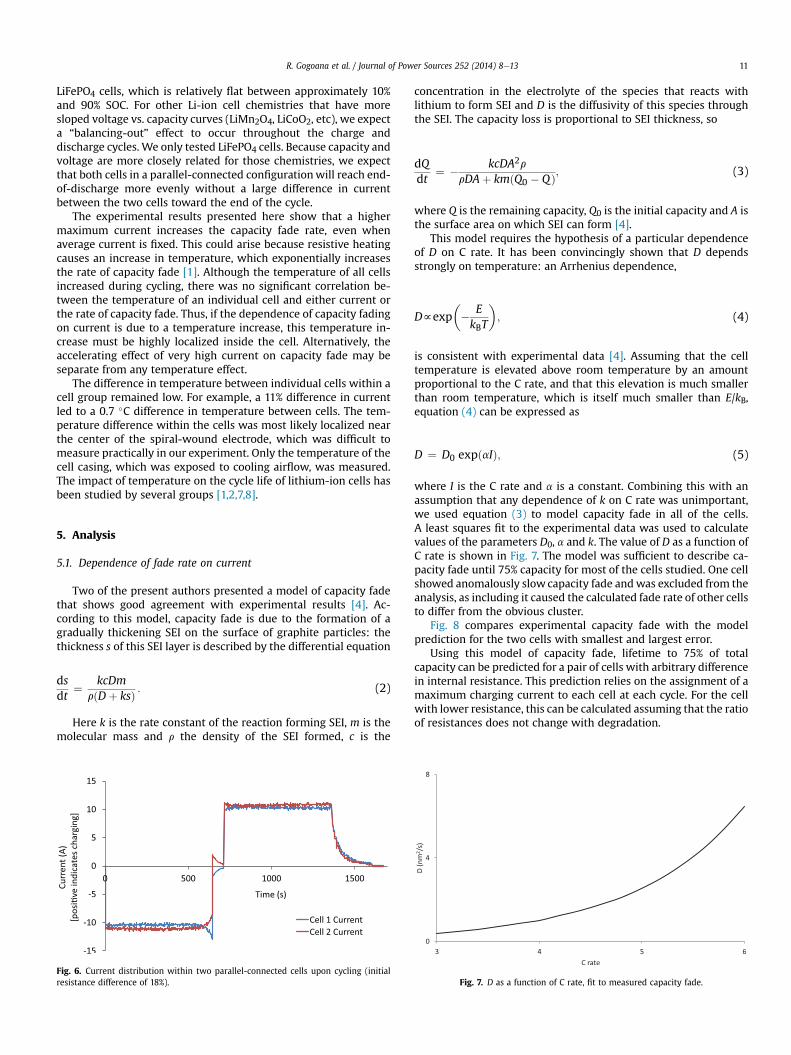
This model requires the hypothesis of a particular dependenceof D on C rate. It has been convincingly shown that D dependsstrongly on temperature: an Arrhenius dependence,
Dfexp�� EkBT
�; (4)
is consistent with experimental data [4]. Assuming that the celltemperature is elevated above room temperature by an amountproportional to the C rate, and that this elevation is much smallerthan room temperature, which is itself much smaller than E/kB,equation (4) can be expressed as
D ¼ D0 expðaIÞ; (5)
where I is the C rate and a is a constant. Combining this with anassumption that any dependence of k on C rate was unimportant,we used equation (3) to model capacity fade in all of the cells.A least squares fit to the experimental data was used to calculatevalues of the parameters D0, a and k. The value of D as a function ofC rate is shown in Fig. 7. The model was sufficient to describe ca-pacity fade until 75% capacity for most of the cells studied. One cellshowed anomalously slow capacity fade andwas excluded from theanalysis, as including it caused the calculated fade rate of other cellsto differ from the obvious cluster.
Fig. 8 compares experimental capacity fade with the modelprediction for the two cells with smallest and largest error.
Using this model of capacity fade, lifetime to 75% of totalcapacity can be predicted for a pair of cells with arbitrary differencein internal resistance. This prediction relies on the assignment of amaximum charging current to each cell at each cycle. For the cellwith lower resistance, this can be calculated assuming that the ratioof resistances does not change with degradation.
Fig. 7. D as a function of C rate, fit to measured capacity fade.

Fig. 8. Experimental and model capacity fade for two cells.
R. Gogoana et al. / Journal of Power Sources 252 (2014) 8e1312
The maximum charging current to the cell with higher resis-tance will come at the end of charging, when the other cell nears afully-charged state. It was observed that the maximum chargingcurrent measured experimentally for the more resistive cell in apair was linearly related to the “excess capacity” Qx, defined by
Qx ¼ Q1 �Q2R2R
(6)
1where Q1 and R1 are the capacity and resistance of the moreresistive cell and Q2 and R2 the capacity and resistance of the lessresistive cell. The excess capacity is thus the charging capacityremaining in the more resistive cell when the less resistive cell hasfinished charging, assuming that the charging rates remain con-stant. The observed linear relationship, shown in Fig. 9, was used asan input into the model-based prediction.
This increase in maximum charging current from 9.5 A to 12 A(4.3Ce5.5C) can be a significant factor in the capacity fading of thecell. Observed data byWang et al. [6] on the same LiFePO4 cells thatwe tested, showed an exponential increase in capacity fade with C-rate. The curve-fitted model that they obtained from their experi-mental data is shown in Fig. 10. Although they only tested theimpact of higher discharge currents (their charge current in testingwas a constant 2C), it is possible that a similar relationship exists oncharging C-rate, and that the jump from 4.3C to 5.5C on chargingwas responsible for this difference in capacity fade.
Previous work [4] has presented a model that explains exper-imental data with a degradation rate that is independent of cur-rent. In fact, since the model identifies time rather than chargethroughput as the determinant of capacity fade, cells exposed tohigher C rates are expected to have a longer cycle life. The modeldoes display a strong dependence of degradation rate on tem-perature, and it is likely that the importance of fast charging isthat it increases temperature through resistive heating within thecell. In the experiments presented here, there was no apparentrelationship between the measured temperature at the outside ofthe cell and fade rate, so if heating is indeed the cause of increasedcapacity fade, it must be somewhat localized within the spiral-wound electrode. This localized temperature rise can be esti-mated by comparing the change in the rate of capacity fade due toa C-rate increase, with that due to an increase in ambient airtemperature. According to the SEI formation model [4], a 10 �Cincrease in temperature increases the capacity fade rate byapproximately 40%, due to a doubling of the diffusivity of elec-trolyte molecules through the SEI. The same increases were foundin the model applied to the present work, when maximumcharging current was increased by 0.7C. In other words, a 10 �Cincrease in background temperature or a 0.7C increase inmaximum charging rate apply approximately equal stress to thebattery in terms of capacity fade rate.
5.2. Lifetime prediction
Fig. 11 shows the predicted lifetime as a function of relativeresistance difference, calculated by combining equations (3), (5)and (6) with the empirical relationship shown in Fig. 9. The topcurve accounts only for gradual capacity fade due to SEI formation.In addition, many cells experienced a sudden capacity loss of up to100 mAh towards the beginning of the cycling process. These ca-pacity losses could result from isolation of active material from theconductive matrix, due to SEI growth or physical separation. Thebottom curve represents a worst-case scenario, where both cellsexperience a 100 mAh capacity loss at the beginning of cycling,followed by gradual SEI formation. The model explains theobserved decrease of lifetimewith an increase in internal resistancemismatch, and that the observed scatter is due to random suddencapacity losses. These random losses can drastically reduce cyclelife, and so are important to monitor (and ideally prevent), eventhough on average most capacity fade is due to gradual SEIformation.

Fig. 9. Maximum charging current to the more resistive cell as a function of the excesscapacity of this cell (defined by equation (6)). More capacity remaining in one cell atthe end of a charge cycle leads to higher maximum charge current to that cell.
Fig. 10. Modeled capacity fade as a function of C rate according to Wang et al. [6].
R. Gogoana et al. / Journal of Power Sources 252 (2014) 8e13 13
The modeling described in this paper could be applied to anysituationwhere cells are charged at a C rate high enough to increasetemperature. In order to obtain a prediction of lifetime, it is vital toknow the actual C rate to which a cell is exposed. For instance, ifmore than two cells are connected in parallel, the extra currentimposedwhen one cell reaches capacity will be shared between theothers, and a detailed measurement or model of this sharing isnecessary to allow a quantitative prediction of pack lifetime.
6. Conclusions and outlook
Mismatching of internal resistance in parallel-connected cellscan lead to the more resistive cell taking a higher current towardthe end of the discharge cycle. This can lead to premature aging ifthe cell is not designed to handle this abnormally high current. Thiswork showed that this impact of resistance mismatch on batterylife was substantially more important than any effect of single cellresistance.
Sorting and binning by internal resistance is beneficial for packassemblers to better control the charge/discharge profiles that theircells will experience, reducing the probability of exposure to veryhigh C rates and thus increasing average battery life.
There are two obvious areas where further experiments wouldbe very valuable. First, this work examined only one circuit setupand cycling profile. Testing of a range of different setups wouldallow the assessment of the relevance of resistance mismatch in avariety of applications. For example, charging to less than full
Fig. 11. Experimental and predicted lifetime as a function of internal resistancemismatch.
capacity would avoid the charge region in which current to themore resistive cell is greatest, and we expect that this would in-crease lifetime. Further experiments could test this hypothesis andwhether it is sufficient to outweigh the underutilization of the cells.
Second, the model presented here, and its agreement withexperiment, suggest that the maximum charging current experi-enced by a cell has a strong impact on its degradation rate. A sys-tematic study of cell degradation under carefully controlledcharging current, with numerous identical cells subjected to a widevariety of charging profiles, would give very interesting funda-mental information about the factors influencing degradation, aswell as useful insight into the expected degradation of parallel-connected cells.
The understanding of how resistance mismatch leads to accel-erated capacity fade, contributed by this work and potential futureexperiments, could be used to optimize manufacturing processes.Combining knowledge of how resistance mismatch affects lifetimewith the intended application of the battery wouldmake it possibleto quantify the largest allowable tolerance windows for internalresistance. In turn, this can aid cost reductions in high-volumemanufacturing, as well as in enabling the use of less sophisticatedproduction equipment for low-volume manufacturing.
Acknowledgments
We thank Lennon Rodgers for useful comments on themanuscript.
References
[1] P. Arora, R.E. White, M. Doyle, J. Electrochem. Soc. 145 (10) (1998) 3647e3667.[2] J. Vetter, P. Novák, M.R. Wagner, C. Veit, K.-C. Möller, J.O. Besenhard, M. Winter,
M. Wohlfahrt-Mehrens, C. Vogler, A. Hammouche, J. Power Sources 147 (2005)269e281, http://dx.doi.org/10.1016/j.jpowsour.2005.01.006. URL: http://linkinghub.elsevier.com/retrieve/pii/S0378775305000832.
[3] H.-G. Schweiger, O. Obeidi, O. Komesker, A. Raschke, M. Schiemann, C. Zehner,M. Gehnen, M. Keller, P. Birke, Sensors 10 (6) (2010) 5604e5625, http://dx.doi.org/10.3390/s100605604. URL: http://www.pubmedcentral.nih.gov/articlerender.fcgi?artid¼3247723&tool¼pmcentrez&rendertype¼abstract.
[4] M.B. Pinson, M.Z. Bazant, J. Electrochem. Soc. 160 (2) (2013) A243eA250, http://dx.doi.org/10.1149/2.044302jes. URL: http://jes.ecsdl.org/cgi/doi/10.1149/2.044302jes.
[5] A.J. Smith, J.C. Burns, D. Xiong, J.R. Dahn, J. Electrochem. Soc. 158 (10) (2011)A1136, http://dx.doi.org/10.1149/1.3625232. URL: http://link.aip.org/link/JESOAN/v158/i10/pA1136/s1&Agg¼doi.
[6] J. Wang, P. Liu, J. Hicks-Garner, E. Sherman, S. Soukiazian, M. Verbrugge,H. Tataria, J. Musser, P. Finamore, J. Power Sources 196 (8) (2011) 3942e3948,http://dx.doi.org/10.1016/j.jpowsour.2010.11.134. URL: http://linkinghub.elsevier.com/retrieve/pii/S0378775310021269.
[7] G.G. Botte, B.A. Johnson, R.E. White, J. Electrochem. Soc. 146 (3) (1999) 914e923.URL: http://jes.ecsdl.org/content/146/3/914.short.
[8] G. Ning, B.N. Popov, J. Electrochem. Soc. 151 (10) (2004) A1584eA1591, http://dx.doi.org/10.1149/1.1787631. URL: http://jes.ecsdl.org/cgi/doi/10.1149/1.1787631.