Embed Size (px)
Citation preview

Aberdeen Asset Management Interim results to 31 March 2017
Martin Gilbert, Chief Executive and Bill Rattray, Finance Director 2 May 2017

1
Financial highlights
Aberdeen Asset Management PLC
Operating margin
Underlying diluted EPS
Underlying pre-tax profit
Regulatory capital headroom
32.2% 32.9%
£162.9m £189.8m £195.2m
9.6p 11.1p 11.5p
£80m £60m £76m
1H 2016 2H 2016 1H 2017
35.3%
Period end AuM £292.8bn £312.1bn £308.1bn
Interim dividend 7.5p 7.5p

2
Operational highlights
AUM
£312 billion
Net flows
(£32 billion)
£70 million cost
savings on track
Progress against
strategic objectives
Strong balance sheet
• Underlying PBT increased to £195.2 million, +19.8% compared to 1H 2016
• Net outflows of £13.4 billion
• Significant recovery: Q1 net flows of £10.5 billion, reducing to £2.9 billion
• Closing AuM of £308.1 billion
• Net inflows into US equities, DGF, Parmenion
• Positive Q2 for GEM and EMD
• Cost saves fully implemented to achieve £70 million annualised savings
• Benefit in the period of £60 million compared to 2015 baseline
• Net cash at half year end of £498.0 million and healthy headroom over our
regulatory capital
Resilient financial
performance
Flows reflect growing
interest in wider range
of capabilities
Continued strength in
investment
performance
Cost savings actioned
3
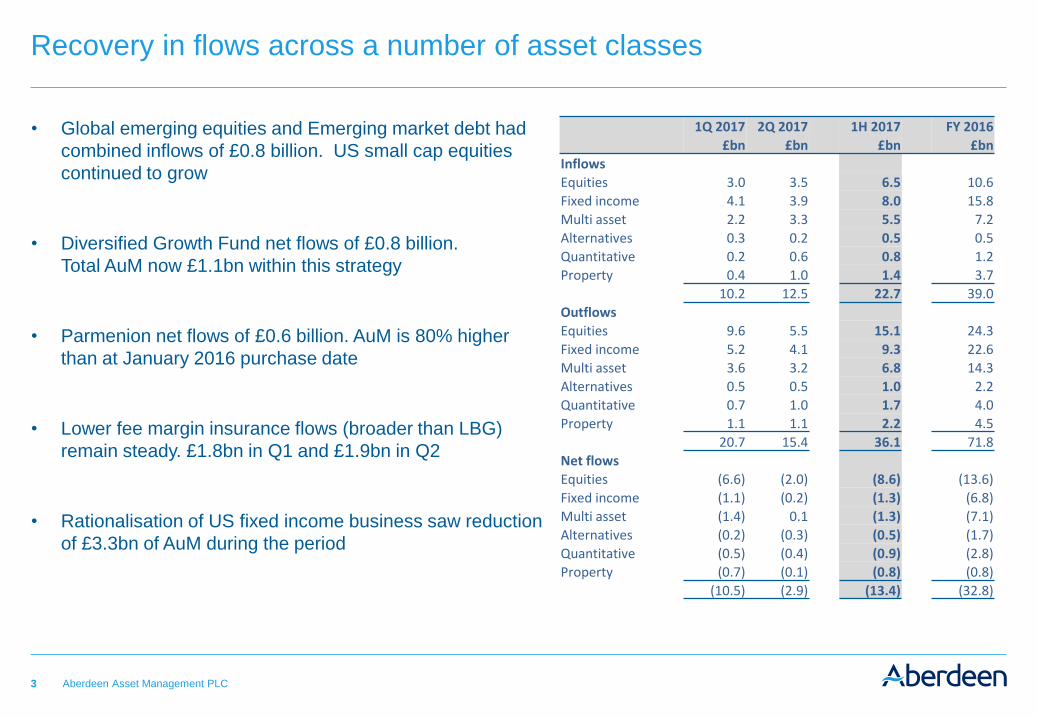
Recovery in flows across a number of asset classes
Aberdeen Asset Management PLC
• Global emerging equities and Emerging market debt had
combined inflows of £0.8 billion. US small cap equities
continued to grow
• Diversified Growth Fund net flows of £0.8 billion.
Total AuM now £1.1bn within this strategy
• Parmenion net flows of £0.6 billion. AuM is 80% higher
than at January 2016 purchase date
• Lower fee margin insurance flows (broader than LBG)
remain steady. £1.8bn in Q1 and £1.9bn in Q2
• Rationalisation of US fixed income business saw reduction
of £3.3bn of AuM during the period
1Q 2017 2Q 2017
1H 2017
FY 2016
£bn £bn £bn £bn
Inflows
Equities 3.0 3.5 6.5 10.6
Fixed income 4.1 3.9 8.0 15.8
Multi asset 2.2 3.3 5.5 7.2
Alternatives 0.3 0.2 0.5 0.5
Quantitative 0.2 0.6 0.8 1.2
Property 0.4 1.0 1.4 3.7
10.2 12.5 22.7 39.0
Outflows
Equities 9.6 5.5 15.1 24.3
Fixed income 5.2 4.1 9.3 22.6
Multi asset 3.6 3.2 6.8 14.3
Alternatives 0.5 0.5 1.0 2.2
Quantitative 0.7 1.0 1.7 4.0
Property 1.1 1.1 2.2 4.5
20.7 15.4 36.1 71.8
Net flows
Equities (6.6) (2.0) (8.6) (13.6)
Fixed income (1.1) (0.2) (1.3) (6.8)
Multi asset (1.4) 0.1 (1.3) (7.1)
Alternatives (0.2) (0.3) (0.5) (1.7)
Quantitative (0.5) (0.4) (0.9) (2.8)
Property (0.7) (0.1) (0.8) (0.8)
(10.5) (2.9) (13.4) (32.8)

4
Distribution activity continues to increase
• Sentiment is returning to emerging markets and Asia at the same time as our investment performance is improving
• Active management of opportunities pipeline by distribution team – activity levels of sales team have increased
significantly
• More diversified pipeline
– Strength of diversified growth strategies bearing fruit
– Increasing interest in next generation capabilities, inc real assets, liquid alternatives and smart beta
– Supports deeper dialogue with strategic partners
• ‘Income campaign’ is the biggest we have undertaken
• Continue to invest in brand
• No loss of momentum as a result of announcing SL transaction

5
Well positioned to address industry challenges
Aberdeen Asset Management PLC
Industry theme
Global
Solutions
Aberdeen response
• Broad range of capabilities includes Multi-
asset, Quant and Alternatives
• Continue to add global coverage for these
skills
• Specialist distribution teams support broader
capability set
• Strong solutions team to build portfolios to
deliver outcomes for clients
Scale
• Global network allows local contact with
clients and investments
• Management of regulatory capital headroom
• Investment in technology critical
Investors globally are demanding
more and broadening their
requirements
Investing globally adds complexity
Global investment plus local
engagement
Broad investment capability and
scale needed to deliver cost
effective offering
Results reflect resilience of business model – coupled with growth of multi asset business and distribution strength.
Standard Life transaction accelerates these responses.

6
Financial results
Aberdeen Asset Management PLC

7
Key points
Aberdeen Asset Management PLC
Blended fee rate remained steady at 33.7bps
Revenues and profits are significantly higher than the first half of 2016 boosted by markets and
currencies, and close control of costs
Strong conversion of operating cash flow into cash
£70 million cost savings actioned although costs saves masked by sterling weakness

8
Reconciliation of changes in AuM
Aberdeen Asset Management PLC
Equities
£bn
Fixed
income
£bn
Multi asset
£bn
Alternatives
£bn
Quantitative
investments
£bn
Property
£bn
Total
£bn
AuM at 30 September 2016 89.1 70.0 89.9 21.8 22.8 18.5 312.1
Net new business flows (8.6) (1.3) (1.3) (0.5) (0.9) (0.8) (13.4)
Markets and performance 6.0 (0.8) 4.3 0.1 2.0 0.6 12.2
FX movements 1.7 0.8 - 0.5 - (0.1) 2.9
Business rationalisation - (3.3) (2.4) - - - (5.7)
AuM at 31 March 2017 88.2 65.4 90.5 21.9 23.9 18.2 308.1
Average AuM 86.7 67.2 89.2 22.3 23.6 18.1 307.1

9
Income statement progression
Aberdeen Asset Management PLC
1H 2016
£m Margin
2H 2016
£m Margin
FY 2016
£m Margin
1H 2017
£m Margin
Revenue 483.6 523.5 1,007.1 534.9
Staff costs 205.5 42.5% 217.4 41.5% 422.9 42.0% 217.6 40.6%
Other costs 122.2 25.3% 133.9 25.6% 256.1 25.4% 128.7 24.1%
Total operating costs 327.7 67.8% 351.3 67.1% 679.0 67.4% 346.3 64.7%
Operating profit 155.9 32.2% 172.2 32.9% 328.1 32.6% 188.6 35.3%
Net finance costs 0.9 0.7 1.6 1.3
Other gains & losses 6.1 16.9 23.0 5.3
Profit before taxation 162.9 189.8 352.7 195.2
Taxation (25.8) (32.4) (58.2) (31.5)
Profit for the period 137.1 157.4 294.5 163.7
Effective tax rate 15.8% 16.5% 16.1%

10
Profit before tax
Aberdeen Asset Management PLC
+26.1
+13.8 -23.6
+10.6
+9.7
- -
+1.7 +5.0 -11.0
-
162.9
189.8 195.2
-
50.0
100.0
150.0
200.0
250.0
2016 1H Managementfees
Transaction &performance
fees
Operating costs Net interest &investment
gains
2016 2H Managementfees
Transaction &performance
fees
Operating costs Net interest &investment
gains
2017 1H

11
Blended fee rate
Aberdeen Asset Management PLC
1H 2016
bps
2H 2016 bps
FY 2016 bps
1H 2017 bps
Equities 65.9 66.8 66.2 66.9
Fixed income 18.8 19.3 19.1 17.9
Multi asset 15.2 15.7 15.5 15.8
Alternatives 44.5 43.4 44.4 45.2
Quantitative investments 9.0 8.5 8.7 8.4
Property 47.6 42.6 45.5 40.9
Blended average management fee 33.4 33.7 33.6 33.7

12
Cost efficiency activities complete
• The emphasis has been on cost discipline and managing for long term efficiency
• Largest source of saving came from role reduction :
– Senior retirements
– Non-replacement of staff, following review of team structures
– Selective redundancy
• Plus procurement discipline and optimising processes
All activities
now complete in
£70 million
programme
• £70 million target was set against 2H 2015 actuals = annualised costs of £700 million, including acquisitions
• Target costs on constant currency were £630 million (before research costs)
• FX has continued to increase costs in sterling terms - Adds £51 million to baseline costs
• 40% of costs in currencies other than GBP
• 1H 2017 costs of £346.3 million – equate to £692.6 million on annual basis
£60 million of
annualised
benefit in results

13
Cash flow
Aberdeen Asset Management PLC
1H 2017
£m
Operating cash flow, after interest and tax 124.0
Capital expenditure and long term investment (21.8)
Net decrease in seed capital 32.8 11.0
Coupon payments on capital securities & preference shares (16.5)
118.5
Ordinary dividend payments (154.2)
(35.7)
Hedging of deferred variable remuneration
Net disposal of investments in funds 1.4
EBT purchases of Aberdeen shares (23.4) (22.0)
Acquisition-related cash flows
Restructuring and deal-related costs (0.8) (0.8)
Net cash outflow (58.5)

14
Regulatory capital
Aberdeen Asset Management PLC
Regulatory
status
Mar 16
£m
Sep 16
£m
Mar 17
£m
Ordinary shareholders’ funds – as reported 1,690 1,691 1,628
Less: provision for dividend (96) (154) (96)
CET1 1,594 1,537 1,532
5.0 % Preference shares AT1 100 100 100
Tier 1 1,694 1,637 1,632
7.0% Perpetual capital securities Tier 2 322 322 322
2,016 1,959 1,954
Less: intangible assets, net of deferred tax (1,432) (1,411) (1,371)
Less: pension surplus, net of deferred tax (24) - -
Less: other deductions (7) (15) (16)
Total regulatory capital after deductions 553 533 567
Pillar 2 regulatory capital requirement
To cover operational risk 344 344 344
To cover credit and market risk 129 129 147
Total Pillar 2 requirement 473 473 491
Surplus over Pillar 2 requirement 80 60 76

15
Summary
Distinctive and strong capabilities
Broad distribution base/investment
Rigorous cost management
Balance sheet and capital
• Actions on £70 million programme now
complete
• Now have a full service offering. Committed
to growing alternatives and solutions, but our
traditional strengths remain equally important
• Healthy balance sheet, with substantial
regulatory capital headroom
• Expanded growth opportunities
• Broad range of opportunities
• Long term outlook – committed to investing
through cycle Discipline investment style

Appendix
Supplementary financials
New business flows
AuM breakouts
Performance

17
We now have a competitive full service capability
Everything to meet clients’ investment objectives
Equities
• Specialist markets
• Proprietary
research
High conviction
portfolios, home-
grown teams
Fixed Income
• Global reach
• Wide range
• LDI
Global market
exposure across
the risk spectrum
Property
• Bottom-up
• Absolute value
• Risk focused
• Active
Managed, stable
income with
growth potential
Alternatives
• Counter-cyclical
• Specialist insights
• Universal provider
Returns despite
market cycle
Quantitative
• Passive
• Enhanced index
• Smart beta
• Active quant
Scalable, cost-
efficient capture
of market returns
Multi-asset
• Unconstrained
• Open
architecture
• Strategic and
tactical
• Top-down and
bottom-up
Risk- and
cost-control

18
Revenue analysis
Aberdeen Asset Management PLC
1H 2016 2H 2016 FY 2016 1H 2017
£m £m £m £m
Management fees 479.4 99% 505.5 97% 984.9 98% 515.2 96%
Transaction fees 2.7 1% 3.7 0% 6.4 0% 11.9 2%
482.1 100% 509.2 97% 991.3 98% 527.1 98%
Performance fees 1.5 0% 14.3 3% 15.8 2% 7.8 2%
483.6 100% 523.5 100% 1,007.1 100% 534.9 100%
19
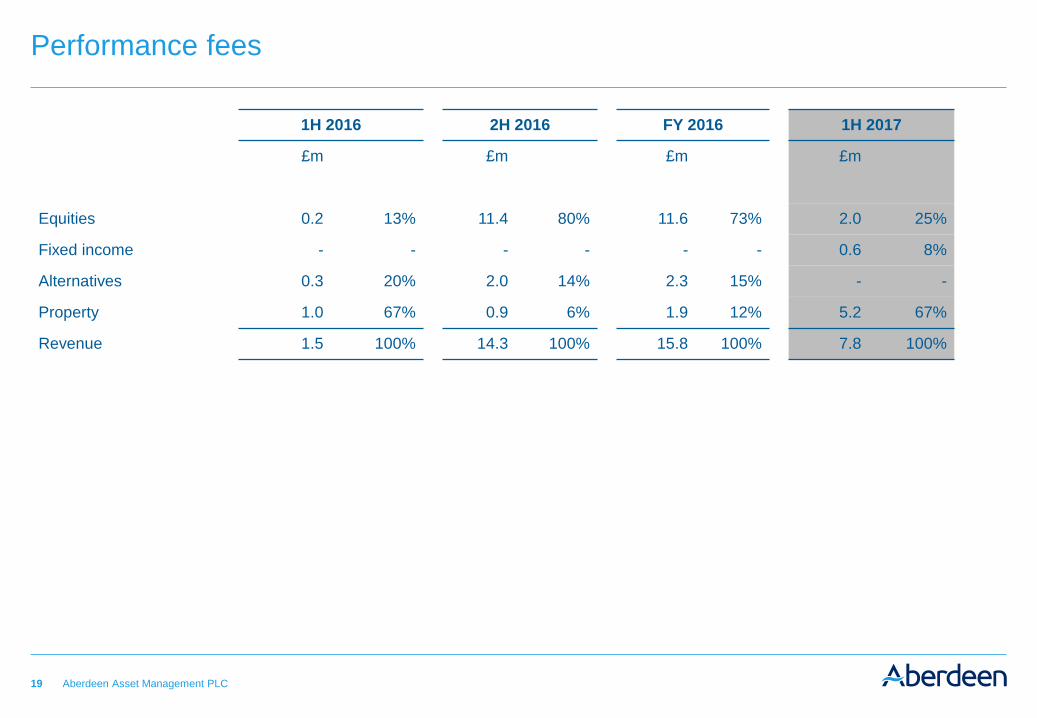
Performance fees
Aberdeen Asset Management PLC
1H 2016 2H 2016 FY 2016 1H 2017
£m £m £m £m
Equities 0.2 13% 11.4 80% 11.6 73% 2.0 25%
Fixed income - - - - - - 0.6 8%
Alternatives 0.3 20% 2.0 14% 2.3 15% - -
Property 1.0 67% 0.9 6% 1.9 12% 5.2 67%
Revenue 1.5 100% 14.3 100% 15.8 100% 7.8 100%

20
Revenues, costs and margin
166.0
185.3 201.8
229.0
192.2
229.7
294.9
343.3
385.9 398.1
413.1
456.1
516.0
562.5
503.5
614.1 605.2
563.8
483.6
523.5
534.9
0%
5%
10%
15%
20%
25%
30%
35%
40%
45%
50%
-
100
200
300
400
500
600
700
1H '07 2H '07 1H '08 2H '08 1H '09 2H '09 1H '10 2H '10 1H '11 2H '11 1H '12 2H '12 1H '13 2H '13 1H '14 2H '14 1H '15 2H '15 1H '16 2H '16 1H '17
Revenue Operating Costs Operating margin

21
Analysis of operating expenses
Aberdeen Asset Management PLC
1H 2016
£m
2H 2016
£m
FY 2016
£m
1H 2017
£m
Staff costs 205.5 217.4 422.9 217.6
Third party admin 34.0 30.0 64.0 32.2
Accommodation 13.9 18.0 31.9 16.8
IT 22.7 22.7 45.4 25.3
Marketing 9.2 12.5 21.7 9.3
Depreciation 3.8 4.3 8.1 3.9
Other 38.6 46.4 85.0 41.2
Non staff costs 122.2 133.9 256.1 128.7
327.7 351.3 679.0 346.3

22
Seed capital used to support launch of new funds
Increased commitment to seed capital, both number and value of funds
Aberdeen Asset Management PLC
FY 2016
£m
1H 2017
£m
Equities 19.1 21.8
Fixed income 66.1 64.1
Multi asset 57.5 43.6
Alternatives 45.3 15.9
188.0 145.4
Accounting adjustment for consolidation rules 12.6 50.3
Total 200.6 195.7

23
New business flows
Aberdeen Asset Management PLC

24
New business flows – by asset class
Aberdeen Asset Management PLC
Group
1H 2016
£m
2H 2016
£m
FY 2016
£m
1H 2017
£m
Inflows
Equities 5,113 5,536 10,649 6,501
Fixed income 9,127 6,696 15,823 7,973
Multi asset 3,647 3,602 7,249 5,520
Alternatives 351 119 470 450
Quantitative investments 644 521 1,165 799
Property 2,575 1,102 3,677 1,440
21,457 17,576 39,033 22,683
Outflows
Equities 14,932 9,343 24,275 15,110
Fixed income 11,382 11,194 22,576 9,260
Multi asset 7,541 6,803 14,344 6,837
Alternatives 561 1,594 2,155 953
Quantitative investments 2,180 1,798 3,978 1,739
Property 1,596 2,909 4,505 2,190
38,192 33,641 71,833 36,089
Net flows
Equities (9,819) (3,807) (13,626) (8,609)
Fixed income (2,255) (4,498) (6,753) (1,287)
Multi asset (3,894) (3,201) (7,095) (1,317)
Alternatives (210) (1,475) (1,685) (503)
Quantitative investments (1,536) (1,277) (2,813) (940)
Property 979 (1,807) (828) (750)
(16,735) (16,065) (32,800) (13,406)

25
New business flows
Aberdeen Asset Management PLC
Group
1Q 2017
£m
2Q 2017
£m
1H 2017
£m
Inflows
Equities 2,999 3,502 6,501
Fixed income 4,042 3,931 7,973
Multi asset 2,171 3,349 5,520
Alternatives 281 169 450
Quantitative investments 249 550 799
Property 420 1,020 1,440
10,162 12,521 22,683
Outflows
Equities 9,597 5,513 15,110
Fixed income 5,179 4,081 9,260
Multi asset 3,588 3,249 6,837
Alternatives 458 495 953
Quantitative investments 743 996 1,739
Property 1,086 1,104 2,190
20,651 15,438 36,089
Net flows
Equities (6,598) (2,011) (8,609)
Fixed income (1,137) (150) (1,287)
Multi asset (1,417) 100 (1,317)
Alternatives (177) (326) (503)
Quantitative investments (494) (446) (940)
Property (666) (84) (750)
(10,489) (2,917) (13,406)

26
New business flows – Equities
Aberdeen Asset Management PLC
Group
Inflows
1Q 2017
£m
2Q 2017
£m
1H 2017
£m
Asia Pacific 1,063 934 1,997
Global emerging markets 1,144 1,877 3,021
Europe 5 14 19
Global & EAFE 198 313 511
UK 40 31 71
US 549 333 882
2,999 3,502 6,501
Outflows
Asia Pacific 3,928 2,302 6,230
Global emerging markets 1,485 1,216 2,701
Europe 81 506 587
Global & EAFE 3,816 995 4,811
UK 115 292 407
US 172 202 374
9,597 5,513 15,110
Net flows
Asia Pacific (2,865) (1,368) (4,233)
Global emerging markets (341) 661 320
Europe (76) (492) (568)
Global & EAFE (3,618) (682) (4,300)
UK (75) (261) (336)
US 377 131 508
(6,598) (2,011) (8,609)

27
New business flows – Fixed income
Aberdeen Asset Management PLC
Group
Inflows
1Q 2017
£m
2Q 2017
£m
1H 2017
£m
Asia Pacific 32 60 92
Australia 171 124 295
Convertibles 23 11 34
Emerging markets 269 387 656
Europe 6 133 139
Global 131 57 188
High yield 114 153 267
Money market 1,660 2,086 3,746
UK 1,342 856 2,198
US 294 64 358
4,042 3,931 7,973
Net flows
Asia Pacific (53) 9 (44)
Australia 56 (809) (753)
Convertibles (2) (12) (14)
Emerging markets (283) 173 (110)
Europe (21) 110 89
Global (268) 23 (245)
High yield (241) (36) (277)
Money market 15 925 940
UK (460) (431) (891)
US 120 (102) 18
(1,137) (150) (1,287)

28
AuM breakouts
Aberdeen Asset Management PLC

29
A diversified asset base
31 March 17 £bn
Equities 88.2
Fixed Income 65.4
Multi asset 90.5
Alternatives 21.9
Quantitative investments 23.9
Property 18.2
Total 308.1
Our strategy for diversification has
progressed further
By asset class
Equities
29%
Fixed income
21%
Property
6%
Multi asset
29%
Alternatives
7%
Quantitative
investments
8%

30
AuM by client domicile Assets by client type
Insurance 45%
Open-ended funds 27%
Pension funds 15%
Other institutional
6%
Closed-end funds 5%
Central banks government
agencies 2%
Broad distribution base to support more capabilities
United Kingdom
57%
Europe ex UK 19%
Americas 17%
Asia Pacific
6%
Middle East & Africa
1%

31
Equities & Fixed income analysis
Aberdeen Asset Management PLC
Equities Fixed income
31 March 17 £bn
Asia Pacific 27.7
Emerging markets 37.8
Global 14.7
UK 4.2
US 2.8
Europe 1.0
Total 88.2
Emerging markets
43%
Asia Pacific
31%
Global
17%
US
3%
Europe
1% UK
5%
US
5%
UK
43%
High yield
3%
Australian
6%
Global
4%
Money market
23%
31 March 17 £bn
UK 28.4
Money market 14.7
US 3.4
EMD 6.5
Australian 4.1
High Yield 1.6
Global 2.7
Asia 2.2
European 1.8
Total 65.4
EMD
10%
Asia
3%
European
3%

32
Multi asset and Alternatives analysis
Aberdeen Asset Management PLC
Multi asset Alternatives
Insurance
90%
Pooled funds
7%
Private equity
45%
Property multi
manager
7%
Hedge fund
solutions
37%
Other
institutional
1%
31 March 17 £bn
Insurance 80.9
Wealth 0.2
Pooled funds 6.2
Other institutional 1.3
Pension 1.9
Total 90.5
31 March 17 £bn
Private equity 9.8
Hedge fund solutions 8.2
Property multi manager 1.6
Infrastructure 2.3
Total 21.9
Pension
2%
Infrastructure
11%

33
Quantitative investments and Property analysis
Aberdeen Asset Management PLC
Quantitative investments Property
Insurance
90%
UK
52%
Continental
Europe
22%
Nordic
26%
Pooled funds
10%
31 March 17 £bn
Insurance 21.5
Pooled funds 2.4
Total 23.9
31 March 17 £bn
UK 9.5
Nordics 4.7
Continental Europe 4.0
Total 18.2

34
AuM by client domicile
International reach: 38 offices across the world
Global reach, local understanding,
independent thinking Source: Aberdeen Asset Management, 31 March 2017
Europe
ex UK
19%
United
Kingdom
57% Americas
17%
Asia
Pacific
6%
Middle East
& Africa
1%
Boston New York Philadelphia Stamford Toronto
São Paulo
Bandung Bangkok Hong Kong Jakarta Kaohsiung Kuala Lumpur Melbourne Seoul Shanghai* Singapore Surabaya Sydney Taipei Tokyo
Aberdeen Amsterdam Abu Dhabi Bristol Budapest Copenhagen
Edinburgh Frankfurt Helsinki Jersey London Luxembourg
Madrid Milan Oslo Paris Stockholm Zurich
Full service with property Full service without property Distribution only Liaison office

35
Performance
Aberdeen Asset Management PLC

36
Equity performance
Aberdeen Asset Management PLC
To 31 March 2017
YTD 1 year 3 years 5 years 10 years
Aberdeen
% pa
Benchmark
% pa
Aberdeen
% pa
Benchmark
% pa
Aberdeen
% pa
Benchmark
% pa
Aberdeen
% pa
Benchmark
% pa
Aberdeen
% pa
Benchmark
% pa
Asia Pacific ex Japan Equity 1 13.01 11.50 38.45 36.23 12.47 14.30 8.66 10.31 11.13 9.66
Emerging Markets Equity 2 10.25 10.17 33.97 35.23 13.05 11.76 7.89 6.25 12.48 7.79
Global Equity ex US 9 7.96 6.70 31.28 30.69 8.69 11.19 8.27 10.10 7.97 6.51
Global Equity 3 6.86 5.27 30.69 32.68 10.94 16.79 10.49 15.52 9.40 9.63
UK Equities 4 4.87 4.02 21.75 21.95 6.07 7.69 9.01 9.67 5.53 5.67
Pan Euro Equities 5 6.86 6.36 24.86 26.47 7.04 9.04 9.58 11.57 5.00 6.00
US Equity 6 4.79 4.81 32.89 34.68 17.61 21.47 16.08 18.99 11.94 12.46
Japan Equities 7 4.30 4.02 28.63 32.97 20.07 18.10 15.17 13.12 8.77 6.02
Europe ex UK Equities 8 6.81 7.45 25.02 27.88 9.86 9.62 11.20 12.75 5.77 6.23
Benchmark 1 MSCI AC Asia Pacific ex Japan
Benchmark 2 MSCI Emerging Markets
Benchmark 3 MSCI World
Benchmark 4 FTSE All Share
Benchmark 5 FTSE World Europe
Benchmark 6 S&P 500
Benchmark 7 Topix (Tokyo First Section)
Benchmark 8 FTSE World Europe ex UK
Benchmark 9 MSCI EAFE switched on 31/12/06 to MSCI AC World ex US
Source: Total return, gross of fees, GBP. Composite performance displayed, Aberdeen Asset Management, BNP Paribas

37
Fixed income performance
Aberdeen Asset Management PLC
To 31 March 2017
Benchmark 1 Citigroup WGBI
Benchmark 2 Barclays Global Aggregate
Benchmark 3 Barclays Global Aggregate ex Treasuries
Benchmark 4 Barclays U.S. Aggregate Bond Index
Benchmark 5 Barclays Euro Aggregate Corporate
Benchmark 6 JP Morgan Euro High Yield to 31/03/2014 thereafter Merrill Lynch Euro High Yield Constrained
Benchmark 7 JPM EMBI Global Diversified
Benchmark 8 Bloomberg Ausbond Australia Composite Bond Index
Benchmark 9 Credit Suisse Upper Tier High Yield Index to 31/12/11 thereafter US High Yield Master II Index
Benchmark 10 Markit Asian Local Bond Index
Benchmark 11 20% JPMorgan Global Bond x US & 80% ML 1-10y Gov / Corp to 30/06/05 and thereafter Barclays U.S. Aggregate Bond Index
Benchmark 12 Merrill Lynch Global High Yield Constrained to 28/02/2014 then Merrill Lynch Global High Yield Constrained USD Hedged RI
Benchmark 13 JPM Corporate EMBI Broad Diversified
Benchmark 14 3 Month LIBOR
Source: Total return, gross of fees, base currency, Aberdeen Asset Management
1 year 3 years 5 years 10 years
Aberdeen
% pa
Benchmark
% pa
Aberdeen
% pa
Benchmark
% pa
Aberdeen
% pa
Benchmark
% pa
Aberdeen
% pa
Benchmark
% pa
Global Government 1 (USD) -3.63 -3.65 -1.11 -1.20 -0.43 -0.58 3.34 3.03
Global Aggregate Core2 (USD) -1.18 -1.90 -0.06 -0.39 0.81 0.38 2.92 3.34
Global Credit 3 (USD) 1.21 0.08 0.96 0.43 1.96 1.50 n/a n/a
Global Bonds: Global High Income 12 (USD) 13.54 15.80 1.17 5.30 5.24 7.58 6.73 7.89
US Core 4 (USD) 2.33 0.44 3.61 2.68 3.50 2.34 4.17 4.27
US Total Return Bond 11 (USD) 2.28 0.44 3.13 2.68 2.87 2.34 5.13 4.27
Euro Corporate 5 (EUR) 2.38 2.48 3.73 3.41 4.75 4.48 4.00 4.46
Euro High Yield 6 (EUR) 8.81 8.99 5.94 4.55 8.84 8.77 5.35 8.02
Emerging Market Debt - Plus 7 (USD) 14.26 8.92 5.63 6.23 5.77 5.83 7.48 7.03
Australian Fixed Interest 8 (AUD) 2.75 2.09 5.22 4.98 5.35 5.05 6.81 6.15
US Dollar High Yield 9 (USD) 15.20 16.88 1.56 4.62 5.60 6.85 6.78 8.06
Emerging Market Debt - Corporate Bond 13 (USD) 12.45 8.69 6.20 5.31 6.40 5.50 n/a n/a
UK Absolute Return Bond 14 (GBP) 4.46 0.45 0.09 0.53 2.06 0.56 n/a n/a
Asian Fixed Income 10 (USD) 2.61 0.01 2.69 1.81 2.32 1.44 n/a n/a

38
Fund Performance
Aberdeen UK Property Performance
2008 2009 2010 2011 2012 2013 2014 2015 2016
YTD
Mar
2017 1 yr
2 yrs
p.a.
3 yrs
p.a.
5 yrs
p.a.
7 yrs
p.a.
10 yrs
p.a.
Since
Launch
p.a.
Aberdeen Property Trust* -18.95 1.36 8.88 2.67 -2.06 10.63 12.59 8.01 -6.16 1.48 -1.32 0.03 4.10 5.27 4.46 0.13 3.27
Basis: Aberdeen UK Property A Acc, net of charges, net income re-invested, GBP
Source: Lipper, Aberdeen Asset Management; Data to 31 March 2017, Updated 27 April 2017
Aberdeen UK Property A Acc is the successor of the Aberdeen Property Trust A Acc, Inception date: 17 November 04
-25
-20
-15
-10
-5
0
5
10
15
2008 2009 2010 2011 2012 2013 2014 2015 2016 YTD2017
1 yr 2 yrsp.a.
3 yrsp.a.
5 yrsp.a.
7 yrsp.a.
10 yrsp.a.
SinceLaunch
p.a.
Aberdeen UK Property Fund
39
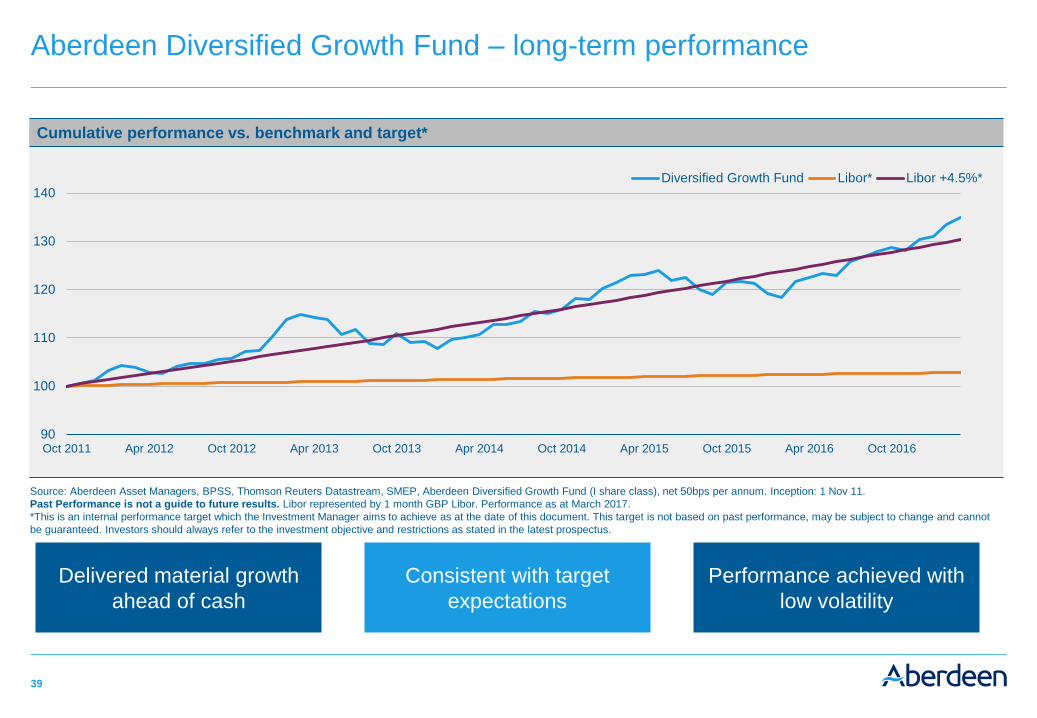
Aberdeen Diversified Growth Fund – long-term performance
Cumulative performance vs. benchmark and target*
Delivered material growth
ahead of cash
Consistent with target
expectations
Performance achieved with
low volatility
Source: Aberdeen Asset Managers, BPSS, Thomson Reuters Datastream, SMEP, Aberdeen Diversified Growth Fund (I share class), net 50bps per annum. Inception: 1 Nov 11.
Past Performance is not a guide to future results. Libor represented by 1 month GBP Libor. Performance as at March 2017.
*This is an internal performance target which the Investment Manager aims to achieve as at the date of this document. This target is not based on past performance, may be subject to change and cannot
be guaranteed. Investors should always refer to the investment objective and restrictions as stated in the latest prospectus.
90
100
110
120
130
140
Oct 2011 Apr 2012 Oct 2012 Apr 2013 Oct 2013 Apr 2014 Oct 2014 Apr 2015 Oct 2015 Apr 2016 Oct 2016
Diversified Growth Fund Libor* Libor +4.5%*

40
Performance attribution by month
Aberdeen DGF – 12 month performance attribution to end Q1 17
Source: Aberdeen Asset Management, 31 March 2017
0.7 0.8
-0.3
2.3
0.8 0.8 0.7
-0.4
1.8
0.5
1.8 1.2
11.0
-4.00
-2.00
0.00
2.00
4.00
6.00
8.00
10.00
12.00
Apr May Jun Jul Aug Sep Oct Nov Dec Jan Feb Mar Total
Government Bonds
Special Opportunities
Insurance Linked
Absolute Return
Emerging Market Bonds
Asset Backed Securities
Loans
High Yield
Infrastructure
Property
Private Equity
Listed Equity
(%)

41
These presentation slides may contain forward-looking statements with respect to the financial condition and results of
the operations and businesses of Aberdeen Asset Management PLC. These statements and forecasts involve risk and
uncertainty because they relate to events and depend upon circumstances that may occur in the future. There are a
number of factors that could cause actual results or developments to differ materially from those expressed or implied
by those forward-looking statements and forecasts.
Forward-looking statements and forecasts are based on the Directors’ current view and information known to them at
the date of this presentation. The Directors do not make any undertaking to update or revise any forward-looking
statements, whether as a result of new information, future events or otherwise. Nothing in this presentation should be
construed as a profit forecast. The information, statements and opinions contained in this presentation do not
constitute a public offer under any applicable legislation or an offer to sell or solicitation of any offer to buy any
securities or financial instruments or any advice or recommendation with respect to such securities or other financial
instruments.
Important information
Aberdeen Asset Management PLC