Embed Size (px)
Citation preview

U.S.-Canada Power System Outage Task Force
Interim Report:
Causes of theAugust 14th Blackout
in theUnited States and Canada
November 2003


U.S.-Canada Power System Outage Task Force
Interim Report:
Causes of theAugust 14th Blackout
in theUnited States and Canada
November 2003

Acknowledgments
The U.S.-Canada Power System Outage TaskForce would like to acknowledge all the research-ers, analysts, modelers, investigators, planners,designers, and others for their time and effortspent on completing this Interim Report. Theresult is an international coordinated report pro-viding factual reasons as to why the power outageoccurred. This Interim Report was prepared forthe U.S. Secretary of Energy and the Minister ofNatural Resources Canada (NRCAN) under thedirection of Jimmy Glotfelty (USDOE) and Dr.Nawal Kamel and the three working groups: elec-tric system, nuclear, and security.
Members of the three working groups and investi-gative teams spent an incalculable number ofhours researching in various locations to better
understand the intricacies of the August 14, 2003,power outage. It was a huge endeavor to achieve,and they did an excellent job providing the factsthough a variety of data requests; analysis of oper-ations, generator and transmission modeling;sequence of events, and root cause analysis. Alongwith countless interviews and a variety of sideinvestigations, the planning and preparation,coordinated internationally, all proved to be aconfidently coordinated effort.
Thank you for spending countless hours on in-depth research and participating in a report thatwill help the North American public and theworld better understand why and what caused theAugust 14, 2003, blackout. Your efforts are greatlyappreciated! Thank you.
ii � U.S.-Canada Power System Outage Task Force � Causes of the August 14th Blackout �

ContentsPage
� U.S.-Canada Power System Outage Task Force � Causes of the August 14th Blackout � iii
1. Introduction . . . . . . . . . . . . . . . . . . . . . . . . . . . . . . . . . . . . . . . . . . . . . . . . . . . . . . . . . . . . . . . . . . . . . . 1
2. Overview of the North American Electric Power System and Its Reliability Organizations . . . . . . . . 3The North American Power Grid Is One Large, Interconnected Machine . . . . . . . . . . . . . . . . . . . . . . 3Planning and Reliable Operation of the Power Grid Are Technically Demanding . . . . . . . . . . . . . . . . 4Reliability Organizations Oversee Grid Reliability in North America . . . . . . . . . . . . . . . . . . . . . . . . . 7Key Parties in the Pre-Cascade Phase of the August 14 Blackout . . . . . . . . . . . . . . . . . . . . . . . . . . . . . 10
3. Status of the Northeastern Power Grid Before the Blackout Sequence Began . . . . . . . . . . . . . . . . . . . 15Summary . . . . . . . . . . . . . . . . . . . . . . . . . . . . . . . . . . . . . . . . . . . . . . . . . . . . . . . . . . . . . . . . . . . . . . . . 15Electric Demands on August 14 . . . . . . . . . . . . . . . . . . . . . . . . . . . . . . . . . . . . . . . . . . . . . . . . . . . . . . 15Power Flow Patterns . . . . . . . . . . . . . . . . . . . . . . . . . . . . . . . . . . . . . . . . . . . . . . . . . . . . . . . . . . . . . . . 16System Frequency. . . . . . . . . . . . . . . . . . . . . . . . . . . . . . . . . . . . . . . . . . . . . . . . . . . . . . . . . . . . . . . . . 16Generation Facilities Unavailable on August 14. . . . . . . . . . . . . . . . . . . . . . . . . . . . . . . . . . . . . . . . . . 17Voltages . . . . . . . . . . . . . . . . . . . . . . . . . . . . . . . . . . . . . . . . . . . . . . . . . . . . . . . . . . . . . . . . . . . . . . . . . 18Unanticipated Outages of Transmission and Generation on August 14 . . . . . . . . . . . . . . . . . . . . . . . . 19Model-Based Analysis of the State of the Regional Power System at 15:05 EDT,Before the Loss of FE’s Harding-Chamberlin 345-kV Line . . . . . . . . . . . . . . . . . . . . . . . . . . . . . . . . . . 20Conclusion . . . . . . . . . . . . . . . . . . . . . . . . . . . . . . . . . . . . . . . . . . . . . . . . . . . . . . . . . . . . . . . . . . . . . . 20
4. How and Why the Blackout Began . . . . . . . . . . . . . . . . . . . . . . . . . . . . . . . . . . . . . . . . . . . . . . . . . . . . . 21Summary . . . . . . . . . . . . . . . . . . . . . . . . . . . . . . . . . . . . . . . . . . . . . . . . . . . . . . . . . . . . . . . . . . . . . . . . 21Chapter Organization . . . . . . . . . . . . . . . . . . . . . . . . . . . . . . . . . . . . . . . . . . . . . . . . . . . . . . . . . . . . . . 21Phase 1: A Normal Afternoon Degrades: 12:15 EDT to 14:14 EDT . . . . . . . . . . . . . . . . . . . . . . . . . . . . 22Phase 2: FE’s Computer Failures: 14:14 EDT to 15:59 EDT . . . . . . . . . . . . . . . . . . . . . . . . . . . . . . . . . . 28Phase 3: Three FE 345-kV Transmission Line Failures and Many Phone Calls:15:05 EDT to 15:57 EDT. . . . . . . . . . . . . . . . . . . . . . . . . . . . . . . . . . . . . . . . . . . . . . . . . . . . . . . . . . . . . 33Phase 4: 138-kV Transmission System Collapse in Northern Ohio: 15:39 to 16:08 EDT . . . . . . . . . . . 43
5. The Cascade Stage of the Blackout . . . . . . . . . . . . . . . . . . . . . . . . . . . . . . . . . . . . . . . . . . . . . . . . . . . . . 49Phase 5: 345-kV Transmission System Cascade in Northern Ohio and South-Central Michigan . . . . 51Phase 6: The Full Cascade . . . . . . . . . . . . . . . . . . . . . . . . . . . . . . . . . . . . . . . . . . . . . . . . . . . . . . . . . . . 54Phase 7: Several Electrical Islands Formed in Northeast U.S. and Canada:16:10:46 EDT to 16:12 EDT . . . . . . . . . . . . . . . . . . . . . . . . . . . . . . . . . . . . . . . . . . . . . . . . . . . . . . . . . . 58Why the Blackout Stopped Where It Did. . . . . . . . . . . . . . . . . . . . . . . . . . . . . . . . . . . . . . . . . . . . . . . . 61Voltage Collapse . . . . . . . . . . . . . . . . . . . . . . . . . . . . . . . . . . . . . . . . . . . . . . . . . . . . . . . . . . . . . . . . . . 63Why the Generators Tripped Off . . . . . . . . . . . . . . . . . . . . . . . . . . . . . . . . . . . . . . . . . . . . . . . . . . . . . . 63
6. The August 14 Blackout Compared With Previous Major North American Outages . . . . . . . . . . . . . . 67Incidence and Characteristics of Power System Outages . . . . . . . . . . . . . . . . . . . . . . . . . . . . . . . . . . . 67Outage Descriptions and Major Causal Factors. . . . . . . . . . . . . . . . . . . . . . . . . . . . . . . . . . . . . . . . . . . 68Common or Similar Factors Among Major Outages . . . . . . . . . . . . . . . . . . . . . . . . . . . . . . . . . . . . . . . 71Comparisons With the August 14 Blackout . . . . . . . . . . . . . . . . . . . . . . . . . . . . . . . . . . . . . . . . . . . . . 74
7. Performance of Nuclear Power Plants Affected by the Blackout. . . . . . . . . . . . . . . . . . . . . . . . . . . . . . 75Summary . . . . . . . . . . . . . . . . . . . . . . . . . . . . . . . . . . . . . . . . . . . . . . . . . . . . . . . . . . . . . . . . . . . . . . . . 75Findings of the U.S. Nuclear Working Group . . . . . . . . . . . . . . . . . . . . . . . . . . . . . . . . . . . . . . . . . . . . 76Findings of the Canadian Nuclear Working Group . . . . . . . . . . . . . . . . . . . . . . . . . . . . . . . . . . . . . . . . 84
8. Physical and Cyber Security Aspects of the Blackout . . . . . . . . . . . . . . . . . . . . . . . . . . . . . . . . . . . . . . 93Summary . . . . . . . . . . . . . . . . . . . . . . . . . . . . . . . . . . . . . . . . . . . . . . . . . . . . . . . . . . . . . . . . . . . . . . . . 93Security Working Group: Mandate and Scope . . . . . . . . . . . . . . . . . . . . . . . . . . . . . . . . . . . . . . . . . . . 93Cyber Security in the Electricity Sector . . . . . . . . . . . . . . . . . . . . . . . . . . . . . . . . . . . . . . . . . . . . . . . . 94Information Collection and Analysis . . . . . . . . . . . . . . . . . . . . . . . . . . . . . . . . . . . . . . . . . . . . . . . . . . 94Cyber Timeline . . . . . . . . . . . . . . . . . . . . . . . . . . . . . . . . . . . . . . . . . . . . . . . . . . . . . . . . . . . . . . . . . . . 98Findings to Date. . . . . . . . . . . . . . . . . . . . . . . . . . . . . . . . . . . . . . . . . . . . . . . . . . . . . . . . . . . . . . . . . . . 99

Appendixes Page
Tables
Figures
iv � U.S.-Canada Power System Outage Task Force � Causes of the August 14th Blackout �
3.1. Generators Not Available on August 14. . . . . . . . . . . . . . . . . . . . . . . . . . . . . . . . . . . . . . . . . . . . . . 176.1. Changing Conditions That Affect System Reliability . . . . . . . . . . . . . . . . . . . . . . . . . . . . . . . . . . . 687.1. U.S. Nuclear Plant Trip Times . . . . . . . . . . . . . . . . . . . . . . . . . . . . . . . . . . . . . . . . . . . . . . . . . . . . . 807.2. Summary of Shutdown Events for Canadian Nuclear Power Plants . . . . . . . . . . . . . . . . . . . . . . . . 92
2.1. Basic Structure of the Electric System . . . . . . . . . . . . . . . . . . . . . . . . . . . . . . . . . . . . . . . . . . . . . . . . . 32.2. NERC Interconnections . . . . . . . . . . . . . . . . . . . . . . . . . . . . . . . . . . . . . . . . . . . . . . . . . . . . . . . . . . . . 42.3. PJM Load Curve, August 18-24, 2003. . . . . . . . . . . . . . . . . . . . . . . . . . . . . . . . . . . . . . . . . . . . . . . . . . 52.4. Normal and Abnormal Frequency Ranges . . . . . . . . . . . . . . . . . . . . . . . . . . . . . . . . . . . . . . . . . . . . . . 52.5. NERC Regions . . . . . . . . . . . . . . . . . . . . . . . . . . . . . . . . . . . . . . . . . . . . . . . . . . . . . . . . . . . . . . . . . . . 82.6. NERC Regions and Control Areas . . . . . . . . . . . . . . . . . . . . . . . . . . . . . . . . . . . . . . . . . . . . . . . . . . . . 92.7. NERC Reliability Coordinators . . . . . . . . . . . . . . . . . . . . . . . . . . . . . . . . . . . . . . . . . . . . . . . . . . . . . 102.8. Reliability Coordinators and Control Areas in Ohio and Surrounding States. . . . . . . . . . . . . . . . . . 10
3.1. August 2003 Temperatures in the U.S. Northeast and Eastern Canada. . . . . . . . . . . . . . . . . . . . . . . 163.2. Generation, Demand, and Interregional Power Flows on August 14 at 15:05 EDT . . . . . . . . . . . . . . 163.3. Northeast Central Area Scheduled Imports and Exports: Summer 2003
Compared to August 14, 2003 . . . . . . . . . . . . . . . . . . . . . . . . . . . . . . . . . . . . . . . . . . . . . . . . . . . . . . 173.4. Frequency on August 14, 2003, up to 15:31 EDT . . . . . . . . . . . . . . . . . . . . . . . . . . . . . . . . . . . . . . . . 173.5. MW and MVAr Output from Eastlake Unit 5 on August 14 . . . . . . . . . . . . . . . . . . . . . . . . . . . . . . . . 20
4.1. Timeline: Start of the Blackout in Ohio . . . . . . . . . . . . . . . . . . . . . . . . . . . . . . . . . . . . . . . . . . . . . . . 224.2. Timeline Phase 1 . . . . . . . . . . . . . . . . . . . . . . . . . . . . . . . . . . . . . . . . . . . . . . . . . . . . . . . . . . . . . . . . 244.3. Eastlake Unit 5 . . . . . . . . . . . . . . . . . . . . . . . . . . . . . . . . . . . . . . . . . . . . . . . . . . . . . . . . . . . . . . . . . . 274.4. Timeline Phase 2 . . . . . . . . . . . . . . . . . . . . . . . . . . . . . . . . . . . . . . . . . . . . . . . . . . . . . . . . . . . . . . . . 294.5. FirstEnergy 345-kV Line Flows . . . . . . . . . . . . . . . . . . . . . . . . . . . . . . . . . . . . . . . . . . . . . . . . . . . . . 334.6. Voltages on FirstEnergy’s 345-kV Lines: Impacts of Line Trips . . . . . . . . . . . . . . . . . . . . . . . . . . . . . 344.7. Timeline Phase 3 . . . . . . . . . . . . . . . . . . . . . . . . . . . . . . . . . . . . . . . . . . . . . . . . . . . . . . . . . . . . . . . . 344.8. Harding-Chamberlin 345-kV Line . . . . . . . . . . . . . . . . . . . . . . . . . . . . . . . . . . . . . . . . . . . . . . . . . . . 364.9. Hanna-Juniper 345-kV Line . . . . . . . . . . . . . . . . . . . . . . . . . . . . . . . . . . . . . . . . . . . . . . . . . . . . . . . . 37
4.10. Cause of the Hanna-Juniper Line Loss . . . . . . . . . . . . . . . . . . . . . . . . . . . . . . . . . . . . . . . . . . . . . . . . 374.11. Star-South Canton 345-kV Line . . . . . . . . . . . . . . . . . . . . . . . . . . . . . . . . . . . . . . . . . . . . . . . . . . . . . 394.12. Cumulative Effects of Sequential Outages on Remaining 345-kV Lines . . . . . . . . . . . . . . . . . . . . . . 404.13. Timeline Phase 4 . . . . . . . . . . . . . . . . . . . . . . . . . . . . . . . . . . . . . . . . . . . . . . . . . . . . . . . . . . . . . . . . 434.14. Voltages on FirstEnergy’s 138-kV Lines: Impacts of Line Trips . . . . . . . . . . . . . . . . . . . . . . . . . . . . . 434.15. Simulated Effect of Prior Outages on 138-kV Line Loadings . . . . . . . . . . . . . . . . . . . . . . . . . . . . . . . 45
5.1. Area Affected by the Blackout . . . . . . . . . . . . . . . . . . . . . . . . . . . . . . . . . . . . . . . . . . . . . . . . . . . . . . 515.2. Sammis-Star 345-kV Line Trip, 16:05:57 EDT. . . . . . . . . . . . . . . . . . . . . . . . . . . . . . . . . . . . . . . . . . 515.3. Sammis-Star 345-kV Line Trips. . . . . . . . . . . . . . . . . . . . . . . . . . . . . . . . . . . . . . . . . . . . . . . . . . . . . 525.4. Ohio 345-kV Lines Trip, 16:08:59 to 16:09:07 EDT . . . . . . . . . . . . . . . . . . . . . . . . . . . . . . . . . . . . . . 535.5. New York-Ontario Line Flows at Niagara . . . . . . . . . . . . . . . . . . . . . . . . . . . . . . . . . . . . . . . . . . . . . 535.6. Michigan and Ohio Power Plants Trip. . . . . . . . . . . . . . . . . . . . . . . . . . . . . . . . . . . . . . . . . . . . . . . . 545.7. Transmission and Generation Trips in Michigan, 16:10:36 to 16:10:37 EDT . . . . . . . . . . . . . . . . . . 545.8. Michigan Lines Trip and Ohio Separates from Pennsylvania, 16:10:36 to 16:10:38.6 EDT . . . . . . . 555.9. Active and Reactive Power and Voltage from Ontario into Detroit . . . . . . . . . . . . . . . . . . . . . . . . . . 55
A. Description of Outage Investigation and Plan for Development of Recommendations. . . . . . . . . . . 101B. List of Electricity Acronyms. . . . . . . . . . . . . . . . . . . . . . . . . . . . . . . . . . . . . . . . . . . . . . . . . . . . . . . . 107C. Electricity Glossary . . . . . . . . . . . . . . . . . . . . . . . . . . . . . . . . . . . . . . . . . . . . . . . . . . . . . . . . . . . . . . 109D. Transmittal Letters from the Three Working Groups. . . . . . . . . . . . . . . . . . . . . . . . . . . . . . . . . . . . . 117
Figures (Continued) Page
� U.S.-Canada Power System Outage Task Force � Causes of the August 14th Blackout � v
5.10. Western Pennsylvania Separates from New York, 16:10:39 EDT to 16:10:44 EDT . . . . . . . . . . . . . . 565.11. More Transmission Line and Power Plant Losses . . . . . . . . . . . . . . . . . . . . . . . . . . . . . . . . . . . . . . . 565.12. Northeast Disconnects from Eastern Interconnection. . . . . . . . . . . . . . . . . . . . . . . . . . . . . . . . . . . . 575.13. New York and New England Separate, Multiple Islands Form . . . . . . . . . . . . . . . . . . . . . . . . . . . . . 585.14. Electric Islands Reflected in Frequency Plot . . . . . . . . . . . . . . . . . . . . . . . . . . . . . . . . . . . . . . . . . . . 605.15. Area Affected by the Blackout . . . . . . . . . . . . . . . . . . . . . . . . . . . . . . . . . . . . . . . . . . . . . . . . . . . . . . 605.16. Cascade Sequence . . . . . . . . . . . . . . . . . . . . . . . . . . . . . . . . . . . . . . . . . . . . . . . . . . . . . . . . . . . . . . . 625.17. Events at One Large Generator During the Cascade. . . . . . . . . . . . . . . . . . . . . . . . . . . . . . . . . . . . . . 645.18. Power Plants Tripped During the Cascade. . . . . . . . . . . . . . . . . . . . . . . . . . . . . . . . . . . . . . . . . . . . . 65
6.1. North American Power System Outages, 1984-1997. . . . . . . . . . . . . . . . . . . . . . . . . . . . . . . . . . . . . 67


1. Introduction
On August 14, 2003, large portions of the Midwestand Northeast United States and Ontario, Canada,experienced an electric power blackout. The out-age affected an area with an estimated 50 millionpeople and 61,800 megawatts (MW) of electricload in the states of Ohio, Michigan, Pennsylva-nia, New York, Vermont, Massachusetts, Connect-icut, and New Jersey and the Canadian province ofOntario. The blackout began a few minutes after4:00 pm Eastern Daylight Time (16:00 EDT), andpower was not restored for 2 days in some parts ofthe United States. Parts of Ontario suffered rollingblackouts for more than a week before full powerwas restored.
On August 15, President George W. Bush andPrime Minister Jean Chrétien directed that a jointU.S.-Canada Power System Outage Task Force beestablished to investigate the causes of the black-out and how to reduce the possibility of futureoutages. They named U.S. Secretary of EnergySpencer Abraham and Herb Dhaliwal, Minister ofNatural Resources, Canada, to chair the joint TaskForce. Three other U.S. representatives and threeother Canadian representatives were named to theTask Force. The U.S. members are Tom Ridge,Secretary of Homeland Security; Pat Wood, Chair-man of the Federal Energy Regulatory Commis-sion; and Nils Diaz, Chairman of the NuclearRegulatory Commission. The Canadian membersare Deputy Prime Minister John Manley, DeputyPrime Minister; Kenneth Vollman, Chairman ofthe National Energy Board; and Linda J. Keen,President and CEO of the Canadian Nuclear SafetyCommission.
The Task Force divided its work into two phases:
� Phase I: Investigate the outage to determine itscauses and why it was not contained.
� Phase II: Develop recommendations to reducethe possibility of future outages and minimizethe scope of any that occur.
The Task Force created three Working Groups toassist in the Phase I investigation of the blackout—an Electric System Working Group (ESWG), aNuclear Working Group (NWG), and a SecurityWorking Group (SWG). They were tasked withoverseeing and reviewing investigations of theconditions and events in their respective areas anddetermining whether they may have caused oraffected the blackout. The Working Groups aremade up of State and provincial representatives,Federal employees, and contractors working forthe U.S. and Canadian government agencies repre-sented on the Task Force.
This document provides an Interim Report, for-warded by the Working Groups, on the findings ofthe Phase I investigation. It presents the facts thatthe bi-national investigation has found regardingthe causes of the blackout on August 14, 2003. TheWorking Groups and their analytic teams are con-fident of the accuracy of these facts and the analy-sis built upon them. This report does not offerspeculations or assumptions not supported byevidence and analysis. Further, it does not attemptto draw broad conclusions or suggest policy rec-ommendations; that task is to be undertaken inPhase II and is beyond the scope of the Phase Iinvestigation.
This report will now be subject to public reviewand comment. The Working Groups will considerpublic commentary on the Interim Report and willoversee and review any additional analyses andinvestigation that may be required. This reportwill be finalized and made a part of the Task ForceFinal Report, which will also contain recommen-dations on how to minimize the likelihood andscope of future blackouts.
The Task Force will hold three public forums, orconsultations, in which the public will have theopportunity to comment on this Interim Reportand to present recommendations for consider-ation by the Working Groups and the Task Force.
� U.S.-Canada Power System Outage Task Force � Causes of the August 14th Blackout � 1

The public may also submit comments and recom-mendations to the Task Force electronically or bymail. Electronic submissions may be sent to:
Paper submissions may be sent by mail to:
Dr. Nawal KamelSpecial Adviser to the Deputy MinisterNatural Resources Canada21st Floor580 Booth StreetOttawa, ON K1A 0E4
and
Mr. James W. GlotfeltyDirector, Office of Electric Transmissionand Distribution
U.S. Department of Energy1000 Independence Avenue, S.W.Washington, DC 20585
This Interim Report is divided into eight chapters,including this introductory chapter:
� Chapter 2 provides an overview of the institu-tional framework for maintaining and ensuringthe reliability of the bulk power system in NorthAmerica, with particular attention to the rolesand responsibilities of several types of reliabil-ity-related organizations.
� Chapter 3 discusses conditions on the regionalpower system before August 14 and on August14 before the events directly related to theblackout began.
� Chapter 4 addresses the causes of the blackout,with particular attention to the evolution ofconditions on the afternoon of August 14, start-ing from normal operating conditions, thengoing into a period of abnormal but still poten-tially manageable conditions, and finally intoan uncontrollable cascading blackout.
� Chapter 5 provides details on the cascade phaseof the blackout.
� Chapter 6 compares the August 14, 2003, black-out with previous major North American poweroutages.
� Chapter 7 examines the performance of thenuclear power plants affected by the August 14outage.
� Chapter 8 addresses issues related to physicaland cyber security associated with the outage.
This report also includes four appendixes: a de-scription of the investigative process that pro-vided the basis for this report, a list of electricityacronyms, a glossary of electricity terms, and threetransmittal letters pertinent to this report from thethree Working Groups.
2 � U.S.-Canada Power System Outage Task Force � Causes of the August 14th Blackout �

2. Overview of the North American Electric PowerSystem and Its Reliability Organizations
The North American Power GridIs One Large, InterconnectedMachine
The North American electricity system is one ofthe great engineering achievements of the past 100years. This electricity infrastructure representsmore than $1 trillion in asset value, more than200,000 miles (320,000 kilometers) of transmis-sion lines operating at 230,000 volts and greater,950,000 megawatts of generating capability, andnearly 3,500 utility organizations serving wellover 100 million customers and 283 millionpeople.
Modern society has come to depend on reliableelectricity as an essential resource for nationalsecurity; health and welfare; communications;finance; transportation; food and water supply;heating, cooling, and lighting; computers andelectronics; commercial enterprise; and evenentertainment and leisure—in short, nearly allaspects of modern life. Customers have grown toexpect that electricity will almost always be avail-able when needed at the flick of a switch. Mostcustomers have also experienced local outagescaused by a car hitting a power pole, a construc-tion crew accidentally damaging a cable, or a
lightning storm. What is not expected is the occur-rence of a massive outage on a calm, warm day.Widespread electrical outages, such as the onethat occurred on August 14, 2003, are rare, butthey can happen if multiple reliability safeguardsbreak down.
Providing reliable electricity is an enormouslycomplex technical challenge, even on the mostroutine of days. It involves real-time assessment,control and coordination of electricity productionat thousands of generators, moving electricityacross an interconnected network of transmissionlines, and ultimately delivering the electricity tomillions of customers by means of a distributionnetwork.
As shown in Figure 2.1, electricity is produced atlower voltages (10,000 to 25,000 volts) at genera-tors from various fuel sources, such as nuclear,coal, oil, natural gas, hydro power, geothermal,photovoltaic, etc. Some generators are owned bythe same electric utilities that serve the end-usecustomer; some are owned by independent powerproducers (IPPs); and others are owned by cus-tomers themselves—particularly large industrialcustomers.
Electricity from generators is “stepped up” tohigher voltages for transportation in bulk over
� U.S.-Canada Power System Outage Task Force � Causes of the August 14th Blackout � 3
Figure 2.1. Basic Structure of the Electric System

transmission lines. Operating the transmissionlines at high voltage (i.e., 230,000 to 765,000 volts)reduces the losses of electricity from conductorheating and allows power to be shipped economi-cally over long distances. Transmission lines areinterconnected at switching stations and substa-tions to form a network of lines and stations calledthe power “grid.” Electricity flows through theinterconnected network of transmission linesfrom the generators to the loads in accordancewith the laws of physics—along “paths of leastresistance,” in much the same way that waterflows through a network of canals. When thepower arrives near a load center, it is “steppeddown” to lower voltages for distribution to cus-tomers. The bulk power system is predominantlyan alternating current (AC) system, as opposed toa direct current (DC) system, because of the easeand low cost with which voltages in AC systemscan be converted from one level to another. Somelarger industrial and commercial customers takeservice at intermediate voltage levels (12,000 to115,000 volts), but most residential customerstake their electrical service at 120 and 240 volts.
While the power system in North America is com-monly referred to as “the grid,” there are actuallythree distinct power grids or “interconnections”(Figure 2.2). The Eastern Interconnection includesthe eastern two-thirds of the continental UnitedStates and Canada from Saskatchewan east to theMaritime Provinces. The Western Interconnectionincludes the western third of the continentalUnited States (excluding Alaska), the CanadianProvinces of Alberta and British Columbia, and aportion of Baja California Norte, Mexico. The thirdinterconnection comprises most of the state of
Texas. The three interconnections are electricallyindependent from each other except for a fewsmall direct current (DC) ties that link them.Within each interconnection, electricity is pro-duced the instant it is used, and flows over virtu-ally all transmission lines from generators toloads.
The northeastern portion of the Eastern Intercon-nection (about 10 percent of the interconnection’stotal load) was affected by the August 14 blackout.The other two interconnections were notaffected.1
Planning and Reliable Operationof the Power Grid Are TechnicallyDemanding
Reliable operation of the power grid is complexand demanding for two fundamental reasons:
� First, electricity flows at the speed of light(186,000 miles per second or 297,600 kilome-ters per second) and is not economicallystorable in large quantities. Therefore electric-ity must be produced the instant it is used.
� Second, the flow of alternating current (AC)electricity cannot be controlled like a liquid orgas by opening or closing a valve in a pipe, orswitched like calls over a long-distance tele-phone network. Electricity flows freely along allavailable paths from the generators to the loadsin accordance with the laws of physics—divid-ing among all connected flow paths in the net-work, in inverse proportion to the impedance(resistance plus reactance) on each path.
Maintaining reliability is a complex enterprisethat requires trained and skilled operators, sophis-ticated computers and communications, and care-ful planning and design. The North AmericanElectric Reliability Council (NERC) and its tenRegional Reliability Councils have developed sys-tem operating and planning standards for ensur-ing the reliability of a transmission grid that arebased on seven key concepts:
� Balance power generation and demandcontinuously.
� Balance reactive power supply and demand tomaintain scheduled voltages.
� Monitor flows over transmission lines and otherfacilities to ensure that thermal (heating) limitsare not exceeded.
4 � U.S.-Canada Power System Outage Task Force � Causes of the August 14th Blackout �
Figure 2.2. NERC Interconnections

� Keep the system in a stable condition.
� Operate the system so that it remains in a reli-able condition even if a contingency occurs,such as the loss of a key generator or transmis-sion facility (the “N-1 criterion”).
� Plan, design, and maintain the system to oper-ate reliably.
� Prepare for emergencies.
These seven concepts are explained in more detailbelow.
1. Balance power generation and demand contin-uously. To enable customers to use as muchelectricity as they wish at any moment, produc-tion by the generators must be scheduled or“dispatched” to meet constantly changingdemands, typically on an hourly basis, and thenfine-tuned throughout the hour, sometimesthrough the use of automatic generation con-trols to continuously match generation to actualdemand. Demand is somewhat predictable,appearing as a daily demand curve—in thesummer, highest during the afternoon and eve-ning and lowest in the middle of the night, andhigher on weekdays when most businesses areopen (Figure 2.3).
Failure to match generation to demand causesthe frequency of an AC power system (nomi-nally 60 cycles per second or 60 Hertz) toincrease (when generation exceeds demand) ordecrease (when generation is less than demand)(Figure 2.4). Random, small variations in fre-quency are normal, as loads come on and offand generators modify their output to follow thedemand changes. However, large deviations infrequency can cause the rotational speed of gen-erators to fluctuate, leading to vibrations thatcan damage generator turbine blades and otherequipment. Extreme low frequencies can trigger
automatic under-frequency “load shedding,”which takes blocks of customers off-line inorder to prevent a total collapse of the electricsystem. As will be seen later in this report, suchan imbalance of generation and demand canalso occur when the system responds to majordisturbances by breaking into separate“islands”; any such island may have an excessor a shortage of generation, compared todemand within the island.
2. Balance reactive power supply and demand tomaintain scheduled voltages. Reactive powersources, such as capacitor banks and genera-tors, must be adjusted during the day to main-tain voltages within a secure range pertaining toall system electrical equipment (stations, trans-mission lines, and customer equipment). Mostgenerators have automatic voltage regulatorsthat cause the reactive power output of genera-tors to increase or decrease to control voltages toscheduled levels. Low voltage can cause electricsystem instability or collapse and, at distribu-tion voltages, can cause damage to motors andthe failure of electronic equipment. High volt-ages can exceed the insulation capabilities ofequipment and cause dangerous electric arcs(“flashovers”).
3. Monitor flows over transmission lines andother facilities to ensure that thermal (heating)limits are not exceeded. The dynamic interac-tions between generators and loads, combinedwith the fact that electricity flows freely acrossall interconnected circuits, mean that powerflow is ever-changing on transmission and dis-tribution lines. All lines, transformers, andother equipment carrying electricity are heatedby the flow of electricity through them. The
� U.S.-Canada Power System Outage Task Force � Causes of the August 14th Blackout � 5
Figure 2.3. PJM Load Curve, August 18-24, 2003
Figure 2.4. Normal and Abnormal FrequencyRanges

flow must be limited to avoid overheating anddamaging the equipment. In the case of over-head power lines, heating also causes the metalconductor to stretch or expand and sag closer toground level. Conductor heating is also affectedby ambient temperature, wind, and other fac-tors. Flow on overhead lines must be limited toensure that the line does not sag into obstruc-tions below such as trees or telephone lines, orviolate the minimum safety clearances betweenthe energized lines and other objects. (A shortcircuit or “flashover”—which can start fires ordamage equipment—can occur if an energizedline gets too close to another object). All electriclines, transformers and other current-carryingdevices are monitored continuously to ensurethat they do not become overloaded or violateother operating constraints. Multiple ratings aretypically used, one for normal conditions and ahigher rating for emergencies. The primarymeans of limiting the flow of power on trans-mission lines is to adjust selectively the outputof generators.
4. Keep the system in a stable condition. Becausethe electric system is interconnected anddynamic, electrical stability limits must beobserved. Stability problems can develop veryquickly—in just a few cycles (a cycle is 1/60th ofa second)—or more slowly, over seconds orminutes. The main concern is to ensure thatgeneration dispatch and the resulting powerflows and voltages are such that the system isstable at all times. (As will be described later inthis report, part of the Eastern Interconnectionbecame unstable on August 14, resulting in acascading outage over a wide area.) Stability
limits, like thermal limits, are expressed as amaximum amount of electricity that can besafely transferred over transmission lines.
There are two types of stability limits: (1) Volt-age stability limits are set to ensure that theunplanned loss of a line or generator (whichmay have been providing locally critical reac-tive power support, as described previously)will not cause voltages to fall to dangerouslylow levels. If voltage falls too low, it begins tocollapse uncontrollably, at which point auto-matic relays either shed load or trip generatorsto avoid damage. (2) Power (angle) stability lim-its are set to ensure that a short circuit or anunplanned loss of a line, transformer, or genera-tor will not cause the remaining generators andloads being served to lose synchronism withone another. (Recall that all generators andloads within an interconnection must operate ator very near a common 60 Hz frequency.) Lossof synchronism with the common frequencymeans generators are operating out-of-step withone another. Even modest losses of synchro-nism can result in damage to generation equip-ment. Under extreme losses of synchronism,the grid may break apart into separate electricalislands; each island would begin to maintain itsown frequency, determined by the load/genera-tion balance within the island.
5. Operate the system so that it remains in a reli-able condition even if a contingency occurs,such as the loss of a key generator or transmis-sion facility (the “N minus 1 criterion”). Thecentral organizing principle of electricity reli-ability management is to plan for the unex-pected. The unique features of electricity mean
6 � U.S.-Canada Power System Outage Task Force � Causes of the August 14th Blackout �
Local Supplies of Reactive Power Are Essential to Maintaining Voltage Stability
A generator typically produces some mixture of“active” and “reactive” power, and the balancebetween them can be adjusted at short notice tomeet changing conditions. Active power, mea-sured in watts, is the form of electricity that pow-ers equipment. Reactive power, a characteristicof AC systems, is measured in volt-amperes reac-tive (VAr), and is the energy supplied to create orbe stored in electric or magnetic fields in andaround electrical equipment. Reactive power isparticularly important for equipment that relieson magnetic fields for the production of inducedelectric currents (e.g., motors, transformers,pumps, and air conditioning.) Transmission
lines both consume and produce reactive power.At light loads they are net producers, and atheavy loads, they are heavy consumers. Reactivepower consumption by these facilities or devicestends to depress transmission voltage, while itsproduction (by generators) or injection (fromstorage devices such as capacitors) tends to sup-port voltage. Reactive power can be transmittedonly over relatively short distances, and thusmust be supplied as needed from nearby genera-tors or capacitor banks. If reactive power cannotbe supplied promptly and in sufficient quantity,voltages decay, and in extreme cases a “voltagecollapse” may result.

that problems, when they arise, can spread andescalate very quickly if proper safeguards arenot in place. Accordingly, through years ofexperience, the industry has developed asequence of defensive strategies for maintainingreliability based on the assumption that equip-ment can and will fail unexpectedly uponoccasion.
This principle is expressed by the requirementthat the system must be operated at all times toensure that it will remain in a secure condition(generally within emergency ratings for currentand voltage and within established stabilitylimits) following the loss of the most importantgenerator or transmission facility (a “worst sin-gle contingency”). This is called the “N-1 crite-rion.” In other words, because a generator orline trip can occur at any time from random fail-ure, the power system must be operated in apreventive mode so that the loss of the mostimportant generator or transmission facilitydoes not jeopardize the remaining facilities inthe system by causing them to exceed theiremergency ratings or stability limits, whichcould lead to a cascading outage.
Further, when a contingency does occur, theoperators are required to identify and assessimmediately the new worst contingencies,given the changed conditions, and promptlymake any adjustments needed to ensure that ifone of them were to occur, the system wouldstill remain operational and safe. NERC operat-ing policy requires that the system be restoredas soon as practical but within no more than 30minutes to compliance with normal limits, andto a condition where it can once again with-stand the next-worst single contingency with-out violating thermal, voltage, or stabilitylimits. A few areas of the grid are operated towithstand the concurrent loss of two or morefacilities (i.e., “N-2”). This may be done, forexample, as an added safety measure to protecta densely populated metropolitan area or whenlines share a common structure and could beaffected by a common failure mode, e.g., a sin-gle lightning strike.
6. Plan, design, and maintain the system to oper-ate reliably. Reliable power system operationrequires far more than monitoring and control-ling the system in real-time. Thorough plan-ning, design, maintenance, and analysis arerequired to ensure that the system can be oper-ated reliably and within safe limits. Short-term
planning addresses day-ahead and week-aheadoperations planning; long-term planningfocuses on providing adequate generationresources and transmission capacity to ensurethat in the future the system will be able towithstand severe contingencies without experi-encing widespread, uncontrolled cascadingoutages.
A utility that serves retail customers must esti-mate future loads and, in some cases, arrangefor adequate sources of supplies and plan ade-quate transmission and distribution infrastruc-ture. NERC planning standards identify a rangeof possible contingencies and set correspondingexpectations for system performance under sev-eral categories of possible events. Three catego-ries represent the more probable types of eventsthat the system must be planned to withstand.A fourth category represents “extreme events”that may involve substantial loss of customerload and generation in a widespread area. NERCplanning standards also address requirementsfor voltage support and reactive power, distur-bance monitoring, facility ratings, system mod-eling and data requirements, system protectionand control, and system restoration.
7. Prepare for emergencies. System operators arerequired to take the steps described above toplan and operate a reliable power system, butemergencies can still occur because of externalfactors such as severe weather, operator error,or equipment failures that exceed planning,design, or operating criteria. For these rareevents, the operating entity is required to haveemergency procedures covering a crediblerange of emergency scenarios. Operators mustbe trained to recognize and take effective actionin response to these emergencies. To deal with asystem emergency that results in a blackout,such as the one that occurred on August 14,2003, there must be procedures and capabilitiesto use “black start” generators (capable ofrestarting with no external power source) and tocoordinate operations in order to restore thesystem as quickly as possible to a normal andreliable condition.
Reliability Organizations OverseeGrid Reliability in North America
NERC is a non-governmental entity whose mis-sion is to ensure that the bulk electric system inNorth America is reliable, adequate and secure.
� U.S.-Canada Power System Outage Task Force � Causes of the August 14th Blackout � 7

The organization was established in 1968, as aresult of the Northeast blackout in 1965. Since itsinception, NERC has operated as a voluntary orga-nization, relying on reciprocity, peer pressure andthe mutual self-interest of all those involved toensure compliance with reliability requirements.An independent board governs NERC.
To fulfill its mission, NERC:
� Sets standards for the reliable operation andplanning of the bulk electric system.
� Monitors and assesses compliance with stan-dards for bulk electric system reliability.
� Provides education and training resources topromote bulk electric system reliability.
� Assesses, analyzes and reports on bulk electricsystem adequacy and performance.
� Coordinates with Regional Reliability Councilsand other organizations.
� Coordinates the provision of applications(tools), data and services necessary to supportthe reliable operation and planning of the bulkelectric system.
� Certifies reliability service organizations andpersonnel.
� Coordinates critical infrastructure protection ofthe bulk electric system.
� Enables the reliable operation of the intercon-nected bulk electric system by facilitating infor-mation exchange and coordination amongreliability service organizations.
Recent changes in the electricity industry havealtered many of the traditional mechanisms,incentives and responsibilities of the entitiesinvolved in ensuring reliability, to the point thatthe voluntary system of compliance with reliabil-ity standards is generally recognized as not ade-quate to current needs.2 NERC and many otherelectricity organizations support the developmentof a new mandatory system of reliability standardsand compliance, backstopped in the United Statesby the Federal Energy Regulatory Commission.This will require federal legislation in the UnitedStates to provide for the creation of a new electricreliability organization with the statutory author-ity to enforce compliance with reliability stan-dards among all market participants. Appropriategovernment entities in Canada and Mexico areprepared to take similar action, and some havealready done so. In the meantime, NERC encour-ages compliance with its reliability standardsthrough an agreement with its members.
NERC’s members are ten Regional ReliabilityCouncils. (See Figure 2.5 for a map showing thelocations and boundaries of the regional councils.)The regional councils and NERC have openedtheir membership to include all segments of theelectric industry: investor-owned utilities; federalpower agencies; rural electric cooperatives; state,municipal and provincial utilities; independentpower producers; power marketers; and end-usecustomers. Collectively, the members of the NERCregions account for virtually all the electricity sup-plied in the United States, Canada, and a portionof Baja California Norte, Mexico. The ten regionalcouncils jointly fund NERC and adapt NERC stan-dards to meet the needs of their regions. TheAugust 14 blackout affected three NERC regionalreliability councils—East Central Area ReliabilityCoordination Agreement (ECAR), Mid-AtlanticArea Council (MAAC), and Northeast Power Coor-dinating Council (NPCC).
“Control areas” are the primary operational enti-ties that are subject to NERC and regional councilstandards for reliability. A control area is a geo-graphic area within which a single entity, Inde-pendent System Operator (ISO), or RegionalTransmission Organization (RTO) balances gener-ation and loads in real time to maintain reliableoperation. Control areas are linked with eachother through transmission interconnection tielines. Control area operators control generationdirectly to maintain their electricity interchangeschedules with other control areas. They alsooperate collectively to support the reliability of
8 � U.S.-Canada Power System Outage Task Force � Causes of the August 14th Blackout �
Figure 2.5. NERC Regions
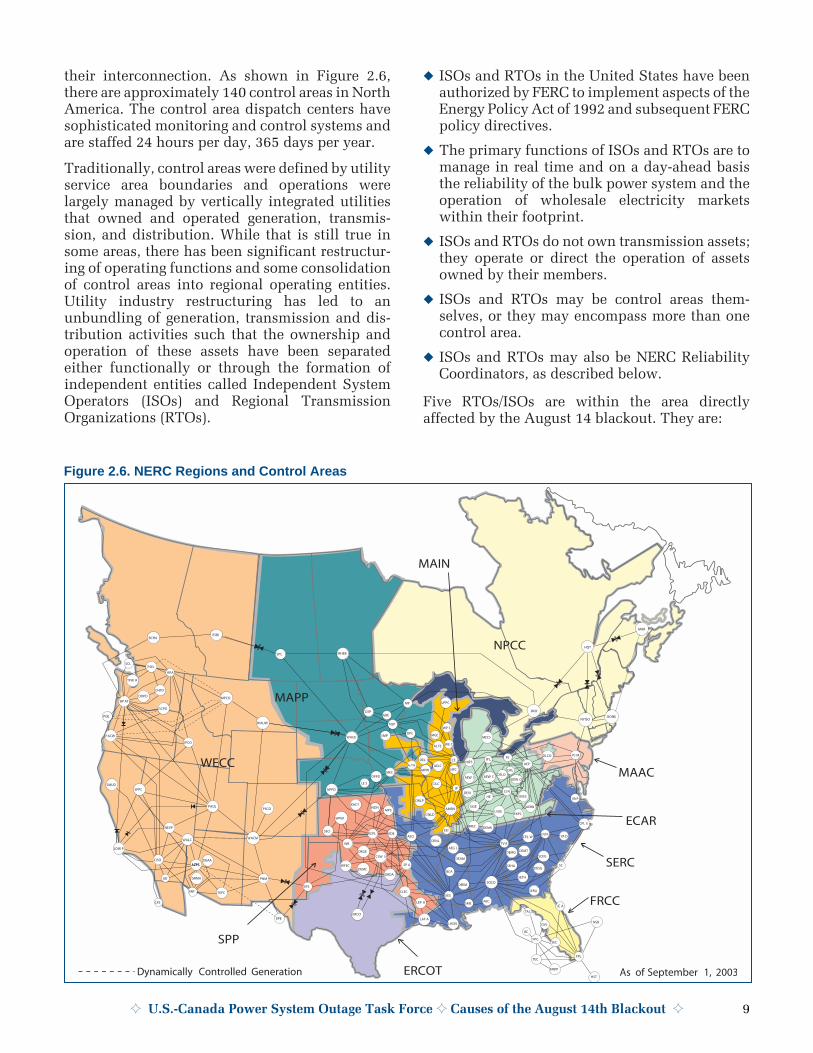
their interconnection. As shown in Figure 2.6,there are approximately 140 control areas in NorthAmerica. The control area dispatch centers havesophisticated monitoring and control systems andare staffed 24 hours per day, 365 days per year.
Traditionally, control areas were defined by utilityservice area boundaries and operations werelargely managed by vertically integrated utilitiesthat owned and operated generation, transmis-sion, and distribution. While that is still true insome areas, there has been significant restructur-ing of operating functions and some consolidationof control areas into regional operating entities.Utility industry restructuring has led to anunbundling of generation, transmission and dis-tribution activities such that the ownership andoperation of these assets have been separatedeither functionally or through the formation ofindependent entities called Independent SystemOperators (ISOs) and Regional TransmissionOrganizations (RTOs).
� ISOs and RTOs in the United States have beenauthorized by FERC to implement aspects of theEnergy Policy Act of 1992 and subsequent FERCpolicy directives.
� The primary functions of ISOs and RTOs are tomanage in real time and on a day-ahead basisthe reliability of the bulk power system and theoperation of wholesale electricity marketswithin their footprint.
� ISOs and RTOs do not own transmission assets;they operate or direct the operation of assetsowned by their members.
� ISOs and RTOs may be control areas them-selves, or they may encompass more than onecontrol area.
� ISOs and RTOs may also be NERC ReliabilityCoordinators, as described below.
Five RTOs/ISOs are within the area directlyaffected by the August 14 blackout. They are:
� U.S.-Canada Power System Outage Task Force � Causes of the August 14th Blackout � 9
Figure 2.6. NERC Regions and Control Areas

� Midwest Independent System Operator (MISO)
� PJM Interconnection (PJM)
� New York Independent System Operator(NYISO)
� New England Independent System Operator(ISO-NE)
� Ontario Independent Market Operator (IMO)
Reliability coordinators provide reliability over-sight over a wide region. They prepare reliabilityassessments, provide a wide-area view of reliabil-ity, and coordinate emergency operations in realtime for one or more control areas. They do notparticipate in the wholesale or retail market func-tions. There are currently 18 reliability coordina-tors in North America. Figure 2.7 shows thelocations and boundaries of their respective areas.
Key Parties in the Pre-CascadePhase of the August 14 Blackout
The initiating events of the blackout involved twocontrol areas—FirstEnergy (FE) and AmericanElectric Power (AEP)—and their respective reli-ability coordinators, MISO and PJM (see Figures2.7 and 2.8). These organizations and their reli-ability responsibilities are described briefly in thisfinal subsection.
1. FirstEnergy operates a control area in north-ern Ohio. FirstEnergy (FE) consists of sevenelectric utility operating companies. Four ofthese companies, Ohio Edison, Toledo Edison,The Illuminating Company, and Penn Power,operate in the NERC ECAR region, with MISO
serving as their reliability coordinator. Thesefour companies now operate as one integratedcontrol area managed by FE.3
2. American Electric Power (AEP) operates a con-trol area in Ohio just south of FE. AEP is both atransmission operator and a control areaoperator.
3. Midwest Independent System Operator(MISO) is the reliability coordinator forFirstEnergy. The Midwest Independent SystemOperator (MISO) is the reliability coordinatorfor a region of more than one million squaremiles, stretching from Manitoba, Canada in thenorth to Kentucky in the south, from Montanain the west to western Pennsylvania in the east.Reliability coordination is provided by twooffices, one in Minnesota, and the other at theMISO headquarters in Indiana. Overall, MISOprovides reliability coordination for 37 controlareas, most of which are members of MISO.
4. PJM is AEP’s reliability coordinator. PJM is oneof the original ISOs formed after FERC orders888 and 889, but was established as a regionalpower pool in 1935. PJM recently expanded itsfootprint to include control areas and transmis-sion operators within MAIN and ECAR (PJM-West). It performs its duties as a reliability coor-dinator in different ways, depending on thecontrol areas involved. For PJM-East, it isboth the control area and reliability coordinatorfor ten utilities, whose transmission systemsspan the Mid-Atlantic region of New Jersey,most of Pennsylvania, Delaware, Maryland,West Virginia, Ohio, Virginia, and the District ofColumbia. The PJM-West facility has the reli-ability coordinator desk for five control areas(AEP, Commonwealth Edison, Duquesne Light,
10 � U.S.-Canada Power System Outage Task Force � Causes of the August 14th Blackout �
Figure 2.7. NERC Reliability Coordinators
Figure 2.8. Reliability Coordinators and ControlAreas in Ohio and Surrounding States

Dayton Power and Light, and Ohio Valley Elec-tric Cooperative) and three generation-onlycontrol areas (Duke Energy’s WashingtonCounty (Ohio) facility, Duke’s LawrenceCounty/Hanging Rock (Ohio) facility, and Alle-gheny Energy’s Buchanan (West Virginia)facility.
Reliability Responsibilities of ControlArea Operators and ReliabilityCoordinators
1. Control area operators have primary responsi-bility for reliability. Their most importantresponsibilities, in the context of this report,are:
N-1 criterion. NERC Operating Policy 2.A—Transmission Operations:
“All CONTROL AREAS shall operate so thatinstability, uncontrolled separation, or cas-cading outages will not occur as a result ofthe most severe single contingency.”
Emergency preparedness and emergencyresponse. NERC Operating Policy 5—Emer-gency Operations, General Criteria:
“Each system and CONTROL AREA shallpromptly take appropriate action to relieveany abnormal conditions, which jeopardizereliable Interconnection operation.”
“Each system, CONTROL AREA, and Regionshall establish a program of manual and auto-matic load shedding which is designed toarrest frequency or voltage decays that couldresult in an uncontrolled failure of compo-nents of the interconnection.”
� U.S.-Canada Power System Outage Task Force � Causes of the August 14th Blackout � 11
Institutional Complexities and Reliability in the Midwest
The institutional arrangements for reliability inthe Midwest are much more complex than theyare in the Northeast-the areas covered by theNortheast Power Coordinating Council (NPCC)and the Mid-Atlantic Area Council (MAAC).There are two principal reasons for this complex-ity. One is that in NPCC and MAAC, the inde-pendent system operator (ISO) also serves as thesingle control area operator for the individualmember systems. In comparison, MISO providesreliability coordination for 35 control areas in theECAR, MAIN, and MAPP regions and 2 others inthe SPP region, and PJM provides reliability coor-dination for 8 control areas in the ECAR andMAIN regions (plus one in MAAC). (See tablebelow.) This results in 18 control-area-to-control-area interfaces across the PJM/MISO reli-ability coordinator boundary.
The other is that MISO has less reliability-relatedauthority over its control area members than PJMhas over its members. Arguably, this lack ofauthority makes day-to-day reliability operationsmore challenging. Note, however, that (1) FERC’sauthority to require that MISO have greaterauthority over its members is limited; and (2)before approving MISO, FERC asked NERC for aformal assessment of whether reliability could bemaintained under the arrangements proposed byMISO and PJM. After reviewing proposed plansfor reliability coordination within and betweenPJM and MISO, NERC replied affirmatively butprovisionally. NERC conducted audits inNovember and December 2002 of the MISO andPJM reliability plans, and some of the recommen-dations of the audit teams are still beingaddressed. The adequacy of the plans andwhether the plans were being implemented aswritten are factors in the NERC’s ongoinginvestigation.
Reliability Coordinator (RC)
ControlAreas inRC Area
Regional ReliabilityCouncils Affected and
Number of Control Areas Control Areas of Interest in RC Area
MISO 37 ECAR (12), MAIN (9),MAPP (14), SPP (2)
FE, Cinergy,Michigan Electric Coordinated System
PJM 9 MAAC (1), ECAR (7),MAIN (1)
PJM, AEP,Dayton Power & Light
ISO New England 2 NPCC (2) ISONE, Maritimes
New York ISO 1 NPCC (1) NYISO
Ontario Independent Market Operator 1 NPCC (1) IMO
Trans-Energie 1 NPCC (1) Hydro Québec

NERC Operating Policy 5.A—Coordinationwith Other Systems:
“A system, CONTROL AREA, or pool that isexperiencing or anticipating an operatingemergency shall communicate its currentand future status to neighboring systems,CONTROL AREAS, or pools and throughout theinterconnection…. A system shall informother systems … whenever … the system’scondition is burdening other systems orreducing the reliability of the Interconnec-tion …. [or whenever] the system’s line load-ings and voltage/reactive levels are such thata single contingency could threaten the reli-ability of the Interconnection.”
NERC Operating Policy 5.C—TransmissionSystem Relief:
“Action to correct an OPERATING SECURITY
LIMIT violation shall not impose unaccept-able stress on internal generation or transmis-sion equipment, reduce system reliabilitybeyond acceptable limits, or unduly imposevoltage or reactive burdens on neighboringsystems. If all other means fail, correctiveaction may require load reduction.”
Operating personnel and training: NERC Oper-ating Policy 8.B—Training:
“Each OPERATING AUTHORITY should period-ically practice simulated emergencies. The
scenarios included in practice situationsshould represent a variety of operating condi-tions and emergencies.”
2. Reliability Coordinators such as MISO andPJM are expected to comply with all aspects ofNERC Operating Policies, especially Policy 9,Reliability Coordinator Procedures, and itsappendices. Key requirements include:
NERC Operating Policy 9, Criteria for Reliabil-ity Coordinators, 5.2:
Have “detailed monitoring capability of theRELIABILITY AREA and sufficient monitoringcapability of the surrounding RELIABILITY
AREAS to ensure potential security violationsare identified.”
NERC Operating Policy 9, Functions of Reliabil-ity Coordinators, 1.7:
“Monitor the parameters that may have sig-nificant impacts within the RELIABILITY AREA
and with neighboring RELIABILITY AREAS
with respect to … sharing with otherRELIABILITY COORDINATORS any informationregarding potential, expected, or actual criti-cal operating conditions that could nega-tively impact other RELIABILITY AREAS. TheRELIABILITY COORDINATOR will coordinatewith other RELIABILITY COORDINATORS andCONTROL AREAS as needed to develop appro-priate plans to mitigate negative impacts ofpotential, expected, or actual critical operat-ing conditions….”
NERC Operating Policy 9, Functions of Reliabil-ity Coordinators, 6:
“Conduct security assessment and monitor-ing programs to assess contingency situa-tions. Assessments shall be made in real timeand for the operations planning horizon atthe CONTROL AREA level with any identifiedproblems reported to the RELIABILITY CO-
ORDINATOR. The RELIABILITY COORDINATOR
is to ensure that CONTROL AREA, RELIABILITY
AREA, and regional boundaries are suffi-ciently modeled to capture any problemscrossing such boundaries.”
Endnotes
12 � U.S.-Canada Power System Outage Task Force � Causes of the August 14th Blackout �
What Constitutes an Operating Emergency?
An operating emergency is an unsustainablecondition that cannot be resolved using theresources normally available. The NERC Oper-ating Manual defines a “capacity emergency” aswhen a system’s or pool’s operating generationcapacity, plus firm purchases from other sys-tems, to the extent available or limited by trans-fer capability, is inadequate to meet its demandplus its regulating requirements. It defines an“energy emergency” as when a load-servingentity has exhausted all other options and canno longer provide its customers’ expectedenergy requirements. A transmission emer-gency exists when “the system’s line loadingsand voltage/ reactive levels are such that a singlecontingency could threaten the reliability of theInterconnection.” Control room operators anddispatchers are given substantial latitude todetermine when to declare an emergency. (Seepage 42 in Chapter 4 for more detail.)
1The province of Quebec, although considered a part of theEastern Interconnection, is connected to the rest of the East-ern Interconnection primarily by DC ties. In this instance, theDC ties acted as buffers between portions of the Eastern Inter-connection; transient disturbances propagate through themless readily. Therefore, the electricity system in Quebec wasnot affected by the outage, except for a small portion of the

� U.S.-Canada Power System Outage Task Force � Causes of the August 14th Blackout � 13
province’s load that is directly connected to Ontario by ACtransmission lines. (Although DC ties can act as a bufferbetween systems, the tradeoff is that they do not allow instan-taneous generation support following the unanticipated lossof a generating unit.)2See, for example, Maintaining Reliability in a CompetitiveElectric Industry (1998), a report to the U.S. Secretary ofEnergy by the Task Force on Electric Systems Reliability;National Energy Policy (2001), a report to the President of the
United States by the National Energy Policy DevelopmentGroup, p. 7-6; and National Transmission Grid Study (2002),U.S. Dept. of Energy, pp. 46-48.3The remaining three FE companies, Penelec, Met-Ed, andJersey Central Power & Light, are in the NERC MAAC regionand have PJM as their reliability coordinator. The focus of thisreport is on the portion of FE in ECAR reliability region andwithin the MISO reliability coordinator footprint.


3. Status of the Northeastern Power GridBefore the Blackout Sequence Began
Summary
This chapter reviews the state of the northeast por-tion of the Eastern Interconnection during thedays prior to August 14, 2003 and up to 15:05 EDTon August 14 to determine whether conditions atthat time were in some way unusual and mighthave contributed to the initiation of the blackout.The Task Force’s investigators found that at 15:05EDT, immediately before the tripping (automaticshutdown) of FirstEnergy’s (FE) Harding-Cham-berlin 345-kV transmission line, the system wasable to be operated reliably following the occur-rence of any of more than 800 contingencies,including the loss of the Harding-Chamberlin line.At that point the system was being operated near(but still within) prescribed limits and in compli-ance with NERC’s operating policies.
Determining that the system was in a reliableoperational state at that time is extremely signifi-cant for understanding the causes of the blackout.It means that none of the electrical conditions onthe system before 15:05 EDT was a direct cause ofthe blackout. This eliminates a number of possiblecauses of the blackout, whether individually or incombination with one another, such as:
� High power flows to Canada
� System frequency variations
� Low voltages earlier in the day or on prior days
� Low reactive power output from IPPs
� Unavailability of individual generators or trans-mission lines.
It is important to emphasize that establishingwhether conditions were normal or unusual priorto and on August 14 has no direct bearing on theresponsibilities and actions expected of the orga-nizations and operators who are charged withensuring power system reliability. As described inChapter 2, the electricity industry has developedand codified a set of mutually reinforcing reliabil-ity standards and practices to ensure that system
operators are prepared for the unexpected. Thebasic assumption underlying these standards andpractices is that power system elements will failor become unavailable in unpredictable ways.Sound reliability management is designed toensure that safe operation of the system will con-tinue following the unexpected loss of any keyelement (such as a major generator or key trans-mission facility). These practices have beendesigned to maintain a functional and reliablegrid, regardless of whether actual operatingconditions are normal. It is a basic principle ofreliability management that “operators must oper-ate the system they have in front of them”—unconditionally.
In terms of day-ahead planning, this means evalu-ating and if necessary adjusting the plannedgeneration pattern (scheduled electricity transac-tions) to change the transmission flows, so that if akey facility were lost, the operators would still beable to readjust the remaining system and operatewithin safe limits. In terms of real-time operations,this means that the system should be operated atall times so as to be able to withstand the loss ofany single facility and still remain within the sys-tem’s thermal, voltage, and stability limits. If afacility is lost unexpectedly, the system operatorsmust determine whether to make operationalchanges to ensure that the remaining system isable to withstand the loss of yet another key ele-ment and still remain able to operate within safelimits. This includes adjusting generator outputs,curtailing electricity transactions, and if neces-sary, shedding interruptible and firm customerload—i.e., cutting some customers off tempo-rarily, and in the right locations, to reduce elec-tricity demand to a level that matches what thesystem is then able to deliver safely.
Electric Demands on August 14
Temperatures on August 14 were above normalthroughout the northeast region of the United
� U.S.-Canada Power System Outage Task Force � Causes of the August 14th Blackout � 15

States and in eastern Canada. As a result, electric-ity demands were high due to high air condition-ing loads typical of warm days in August, thoughnot unusually so. System operators had success-fully managed higher demands both earlier in thesummer and in previous years. Recorded peakelectric demands throughout the region on August14 were below peak demands recorded earlier inthe summer of 2003 (Figure 3.1).
Power Flow Patterns
On August 14, the flow of power through theECAR region was heavy as a result of large trans-fers of power from the south (Tennessee, Ken-tucky, Missouri, etc.) and west (Wisconsin,Minnesota, Illinois, etc.) to the north (Ohio, Mich-igan, and Ontario) and east (New York). The desti-nations for much of the power were northernOhio, Michigan, PJM, and Ontario (Figure 3.2).
While heavy, these transfers were not beyond pre-vious levels or in directions not seen before(Figure 3.3). The level of imports into Ontario onAugust 14 was high but not unusual, and wellwithin IMO’s import capability. Ontario’s IMO is afrequent importer of power, depending on theavailability and price of generation withinOntario. IMO had imported similar and higheramounts of power several times during the sum-mers of 2002 and 2003.
System Frequency
Although system frequency on the Eastern Inter-connection was somewhat more variable on
16 � U.S.-Canada Power System Outage Task Force � Causes of the August 14th Blackout �
Figure 3.1. August 2003 Temperatures in the U.S.Northeast and Eastern Canada
PJM
New YorkISO
MichiganElectric
CoordinatedSystems
AmericanElectric PowerCompany
Independent Electricity
Market Operator
DuquesneLight
AlleghenyPower
Systems
Dayton Power & Light
NorthernIndiana PublicService
First Energy
Load 12,080 MWGeneration 9,383 MW
Load 61,747 MWGeneration 60,858 MW
Load 27,672 MWGeneration 27,376 MW
Load 23,215 MWGeneration 21,986 MW
Load 19,155 MWGeneration 18,221 MW
Load 27,450 MWGeneration 28,225 MW
1434 MW
363 MVAR
380 MVAR
381 MW
962 MW
142 MVAR
188 MVAR120 MW
2766 MW
1733 MW
168 MVAR
341 MW
114 MVAR
295 MVAR
312 MW
149 MVAR
Figure 3.2. Generation, Demand, and Interregional Power Flows on August 14 at 15:05 EDT

August 14 prior to 15:05 EDT compared withrecent history, it was well within the bounds ofsafe operating practices as outlined in NERC oper-ating policies. As a result, system frequency varia-tion was not a cause of the initiation of theblackout. But once the cascade was initiated, thelarge frequency swings that were induced became
a principal means by which the blackout spreadacross a wide area (Figure 3.4).
Assuming stable conditions, the system frequencyis the same across an interconnected grid at anyparticular moment. System frequency will varyfrom moment to moment, however, depending onthe second-to-second balance between aggregategeneration and aggregate demand across the inter-connection. System frequency is monitored on acontinuous basis.
Generation Facilities Unavailableon August 14
Several key generators in the region were out ofservice going into the day of August 14. On anygiven day, some generation and transmissioncapacity is unavailable; some facilities are out forroutine maintenance, and others have been forcedout by an unanticipated breakdown and requirerepairs. August 14, 2003, was no exception (Table3.1).
The generating units that were not available onAugust 14 provide real and reactive power directlyto the Cleveland, Toledo, and Detroit areas. Understandard practice, system operators take intoaccount the unavailability of such units and any
� U.S.-Canada Power System Outage Task Force � Causes of the August 14th Blackout � 17
Frequency Management
Each control area is responsible for maintaininga balance between its generation and demand. Ifpersistent under-frequency occurs, at least onecontrol area somewhere is “leaning on the grid,”meaning that it is taking unscheduled electric-ity from the grid, which both depresses systemfrequency and creates unscheduled powerflows. In practice, minor deviations at the con-trol area level are routine; it is very difficult tomaintain an exact balance between generationand demand. Accordingly, NERC has estab-lished operating rules that specify maximumpermissible deviations, and focus on prohibit-ing persistent deviations, but not instantaneousones. NERC monitors the performance of con-trol areas through specific measures of controlperformance that gauge how accurately eachcontrol area matches its load and generation.
Figure 3.3. Northeast Central Area ScheduledImports and Exports: Summer 2003 Compared toAugust 14, 2003
Note: Area covered includes ECAR, PJM, Ontario, and NewYork, without imports from the Maritime Provinces, ISO-NewEngland, or Hydro-Quebec.
Table 3.1. Generators Not Available on August 14Generator Rating Reason
Davis-Besse Nuclear Unit 750 MW Prolonged NRC-ordered outage beginning on 3/22/02
Eastlake Unit 4 238 MW Forced outage on 8/13/03
Monroe Unit 1 817 MW Planned outage, taken out of service on 8/8/03
Cook Nuclear Unit 2 1,060 MW Outage began on 8/13/03
Figure 3.4. Frequency on August 14, 2003,up to 15:31 EDT

transmission facilities known to be out of servicein the day-ahead planning studies they perform todetermine the condition of the system for the nextday. Knowing the status of key facilities also helpsoperators determine in advance the safe electricitytransfer levels for the coming day.
MISO’s day-ahead planning studies for August 14took these generator outages and known transmis-sion outages into account and determined that theregional system could still be operated safely. Theunavailability of these generation units and trans-mission facilities did not cause the blackout.
Voltages
During the days before August 14 and throughoutthe morning and mid-day on August 14, voltageswere depressed in a variety of locations in north-ern Ohio because of high air conditioning demandand other loads, and power transfers into andacross the region. (Unlike frequency, which isconstant across the interconnection, voltage variesby location, and operators monitor voltages con-tinuously at key locations across their systems.)However, actual measured voltage levels at keypoints on FE’s transmission system on the morn-ing of August 14 and up to 15:05 EDT were withinthe range previously specified by FE as acceptable.Note, however, that many control areas in theEastern Interconnection have set their acceptablevoltage bands at levels higher than that used
by FE. For example, AEP’s minimum acceptablevoltage level is 95% of a line’s nominal rating, ascompared to FE’s 92%.1
Voltage management is especially challenging onhot summer days because of high air conditioningrequirements, other electricity demand, and hightransfers of power for economic reasons, all ofwhich increase the need for reactive power. Oper-ators address these challenges through long-termplanning, day-ahead planning, and real-timeadjustments to operating equipment. On August14, for example, PJM implemented routine voltagemanagement procedures developed for heavy loadconditions. FE also began preparations early in theafternoon of August 14, requesting capacitors tobe restored to service2 and additional voltage sup-port from generators.3 Such actions were typicalof many system operators that day as well as onother days with high electric demand. As the dayprogressed, operators across the region took addi-tional actions, such as increasing plants’ reactivepower output, plant redispatch, transformer tapchanges, and increased use of capacitors torespond to changing voltage conditions.
The power flow data for northern Ohio on August14 just before the Harding-Chamberlin line trip-ped at 15:05 EDT (Figure 3.2) show that FE’s loadwas approximately 12,080 MW. FE was importingabout 2,575 MW, 21% of its total system needs,and generating the remainder. With this high levelof imports and high air conditioning loads in the
18 � U.S.-Canada Power System Outage Task Force � Causes of the August 14th Blackout �
Independent Power Producers and Reactive Power
Independent power producers (IPPs) are powerplants that are not owned by utilities. They oper-ate according to market opportunities and theircontractual agreements with utilities, and may ormay not be under the direct control of grid opera-tors. An IPP’s reactive power obligations aredetermined by the terms of its contractual inter-connection agreement with the local transmis-sion owner. Under routine conditions, some IPPsprovide limited reactive power because they arenot required or paid to produce it; they are onlypaid to produce active power. (Generation ofreactive power by a generator can require scalingback generation of active power.) Some con-tracts, however, compensate IPPs for following avoltage schedule set by the system operator,which requires the IPP to vary its output of reac-tive power as system conditions change. Further,contracts typically require increased reactivepower production from IPPs when it is requested
by the control area operator during times of a sys-tem emergency. In some contracts, provisionscall for the payment of opportunity costs to IPPswhen they are called on for reactive power (i.e.,they are paid the value of foregone active powerproduction).
Thus, the suggestion that IPPs may have contrib-uted to the difficulties of reliability managementon August 14 because they don’t provide reactivepower is misplaced. What the IPP is required toproduce is governed by contractual arrange-ments, which usually include provisions for con-tributions to reliability, particularly duringsystem emergencies. More importantly, it is theresponsibility of system planners and operators,not IPPs, to plan for reactive power requirementsand make any short-term arrangements neededto ensure that adequate reactive power resourceswill be available.

metropolitan areas around the southern end ofLake Erie, FE’s system reactive power needs rosefurther. Investigation team modeling indicatesthat at 15:00 EDT, with Eastlake 5 out of service,FE was a net importer of about 132 MVAr. Asignificant amount of power also was flowingthrough northern Ohio on its way to Michigan andOntario (Figure 3.2). The net effect of this flow pat-tern and load composition was to depress voltagesin northern Ohio.
Unanticipated Outages ofTransmission and Generation
on August 14
Three significant unplanned outages occurred inthe Ohio area on August 14 prior to 15:05 EDT.Around noon, several Cinergy transmission linesin south-central Indiana tripped; at 13:31 EDT,FE’s Eastlake 5 generating unit along the south-western shore of Lake Erie tripped; at 14:02 EDT, aDayton Power and Light (DPL) line, the Stuart-Atlanta 345-kV line in southern Ohio, tripped.
� Transmission lines on the Cinergy 345-, 230-,and 138-kV systems experienced a series of out-ages starting at 12:08 EDT and remained out ofservice during the entire blackout. The loss ofthese lines caused significant voltage andloading problems in the Cinergy area. Cinergymade generation changes, and MISO operatorsresponded by implementing transmission load
relief (TLR) procedures to control flows on thetransmission system in south-central Indiana.System modeling by the investigation team (seedetails below, page 20) showed that the loss ofthese lines was not electrically related to subse-quent events in northern Ohio that led to theblackout.
� The DPL Stuart-Atlanta 345-kV line, linkingDPL to AEP and monitored by the PJM reliabil-ity coordinator, tripped at 14:02 EDT. This wasthe result of a tree contact, and the lineremained out of service during the entire black-out. As explained below, system modeling bythe investigation team has shown that this out-age was not a cause of the subsequent events innorthern Ohio that led to the blackout. How-ever, since the line was not in MISO’s footprint,MISO operators did not monitor the status ofthis line, and did not know that it had gone outof service. This led to a data mismatch that pre-vented MISO’s state estimator (a key monitoringtool) from producing usable results later in theday at a time when system conditions in FE’scontrol area were deteriorating (see detailsbelow, page 27).
� Eastlake Unit 5 is a 597-MW generating unitlocated just west of Cleveland near Lake Erie. Itis a major source of reactive power support forthe Cleveland area. It tripped at 13:31. Thecause of the trip was that as the Eastlake 5 oper-ator sought to increase the unit’s reactive power
� U.S.-Canada Power System Outage Task Force � Causes of the August 14th Blackout � 19
Power Flow Simulation of Pre-Cascade Conditions
The bulk power system has no memory. It doesnot matter if frequencies or voltage were unusualan hour, a day, or a month earlier. What mattersfor reliability are loadings on facilities, voltages,and system frequency at a given moment and thecollective capability of these system componentsat that same moment to withstand a contingencywithout exceeding thermal, voltage, or stabilitylimits.
Power system engineers use a technique calledpower flow simulation to reproduce known oper-ating conditions at a specific time by calibratingan initial simulation to observed voltages andline flows. The calibrated simulation can then beused to answer a series of “what if” questions todetermine whether the system was in a safe oper-ating state at that time. The “what if” questionsconsist of systematically simulating outages byremoving key elements (e.g., generators or trans-
mission lines) one by one and reassessing thesystem each time to determine whether line orvoltage limits would be exceeded. If a limit isexceeded, the system is not in a secure state. Asdescribed in Chapter 2, NERC operating policiesrequire operators, upon finding that their systemis not in a reliable state, to take immediateactions to restore the system to a reliable state assoon as possible and within a maximum of 30minutes.
To analyze the evolution of the system on theafternoon of August 14, this process was fol-lowed to model several points in time, corre-sponding to key transmission line trips. For eachpoint, three solutions were obtained: (1) condi-tions immediately before a facility tripped off; (2)conditions immediately after the trip; and (3)conditions created by any automatic actionstaken following the trip.

output (Figure 3.5), the unit’s protection systemdetected a failure and tripped the unit off-line.The loss of the Eastlake 5 unit did not put thegrid into an unreliable state—i.e., it was stillable to withstand safely another contingency.However, the loss of the unit required FE toimport additional power to make up for the lossof the unit’s output (540 MW), made voltagemanagement in northern Ohio more challeng-ing, and gave FE operators less flexibility inoperating their system (see details below, page27).
Model-Based Analysis of the Stateof the Regional Power System at
15:05 EDT, Before the Loss of FE’sHarding-Chamberlin 345-kV Line
As the first step in modeling the evolution of theAugust 14 blackout, the investigative team estab-lished a base case by creating a power flow simula-tion for the entire Eastern Interconnection andbenchmarking it to recorded system conditions at15:05 EDT on August 14. The team started with aprojected summer 2003 power flow case devel-oped in the spring of 2003 by the Regional Reli-ability Councils to establish guidelines for safeoperations for the coming summer. The level ofdetail involved in this region-wide study farexceeds that normally considered by individualcontrol areas and reliability coordinators. It con-sists of a detailed representation of more than43,000 buses (points at which lines, transformers,and/or generators converge), 57,600 transmissionlines, and all major generating stations across thenorthern U.S. and eastern Canada. The team thenrevised the summer power flow case to matchrecorded generation, demand, and power inter-change levels among control areas at 15:05 EDT onAugust 14. The benchmarking consisted of match-ing the calculated voltages and line flows torecorded observations at more than 1,500 loca-tions within the grid. Thousands of hours of effortwere required to benchmark the model satisfacto-rily to observed conditions at 15:05 EDT.
Once the base case was benchmarked, the teamran a contingency analysis that considered morethan 800 possible events as points of departurefrom the 15:05 EDT case. None of these contingen-cies resulted in a violation of a transmission lineloading or bus voltage limit prior to the trip of FE’s
Harding-Chamberlin 345-kV line. That is, accord-ing to these simulations, the system at 15:05 EDTwas able to be operated safely following the occur-rence of any of the tested contingencies. From anelectrical standpoint, therefore, the Eastern Inter-connection was then being operated within allestablished limits and in full compliance withNERC’s operating policies. However, after loss ofthe Harding-Chamberlin 345-kV line, the systemwould have exceeded emergency ratings on sev-eral lines for two of the contingencies studied. Inother words, it would no longer be operating incompliance with NERC operating policies.
Conclusion
Determining that the system was in a reliableoperational state at 15:05 EDT is extremely signifi-cant for understanding the causes of the blackout.It means that none of the electrical conditions onthe system before 15:05 EDT was a cause of theblackout. This eliminates high power flows toCanada, unusual system frequencies, low voltagesearlier in the day or on prior days, and the unavail-ability of individual generators or transmissionlines, either individually or in combination withone another, as direct, principal or sole causes ofthe blackout.
Endnotes
20 � U.S.-Canada Power System Outage Task Force � Causes of the August 14th Blackout �
Figure 3.5. MW and MVAr Output from EastlakeUnit 5 on August 14
1DOE/NERC fact-finding meeting, September 2003, state-ment by Mr. Steve Morgan (FE), PR0890803, lines 5-23.2Transmission operator at FE requested the restoration of theAvon Substation capacitor bank #2. Example at Channel 3,13:33:40.3From 13:13 through 13:28, reliability operator at FE callednine plant operators to request additional voltage support.Examples at Channel 16, 13:13:18, 13:15:49, 13:16:44,13:20:44, 13:22:07, 13:23:24, 13:24:38, 13:26:04, 13:28:40.

4. How and Why the Blackout Began
Summary
This chapter explains the major events—electri-cal, computer, and human—that occurred as theblackout evolved on August 14, 2003, and identi-fies the causes of the initiation of the blackout. Italso lists initial findings concerning violations ofNERC reliability standards. It presents facts col-lected by the investigation team and does not offerspeculative or unconfirmed information orhypotheses. Some of the information presentedhere, such as the timing of specific electricalevents, updates the Sequence of Events1 releasedearlier by the Task Force.
The period covered in this chapter begins at 12:15Eastern Daylight Time (EDT) on August 14, 2003when inaccurate input data rendered MISO’s stateestimator (a system monitoring tool) ineffective.At 13:31 EDT, FE’s Eastlake 5 generation unit trip-ped and shut down automatically. Shortly after14:14 EDT, the alarm and logging system in FE’scontrol room failed and was not restored untilafter the blackout. After 15:05 EDT, some of FE’s345-kV transmission lines began tripping outbecause the lines were contacting overgrown treeswithin the lines’ right-of-way areas.
By around 15:46 EDT when FE, MISO and neigh-boring utilities had begun to realize that the FEsystem was in jeopardy, the only way that theblackout might have been averted would havebeen to drop at least 1,500 to 2,500 MW of loadaround Cleveland and Akron, and at this time theamount of load reduction required was increasingrapidly. No such effort was made, however, and by15:46 EDT it may already have been too lateregardless of any such effort. After 15:46 EDT, theloss of some of FE’s key 345-kV lines in northernOhio caused its underlying network of 138-kVlines to begin to fail, leading in turn to the loss of
FE’s Sammis-Star 345-kV line at 16:06 EDT. Thechapter concludes with the loss of FE’s Sammis-Star line, the event that triggered the uncontrolla-ble cascade portion of the blackout sequence.
The loss of the Sammis-Star line triggered the cas-cade because it shut down the 345-kV path intonorthern Ohio from eastern Ohio. Although thearea around Akron, Ohio was already blacked outdue to earlier events, most of northern Ohioremained interconnected and electricity demandwas high. This meant that the loss of the heavilyoverloaded Sammis-Star line instantly createdmajor and unsustainable burdens on lines in adja-cent areas, and the cascade spread rapidly as linesand generating units automatically took them-selves out of service to avoid physical damage.
Chapter Organization
This chapter is divided into several phases thatcorrelate to major changes within the FirstEnergysystem and the surrounding area in the hoursleading up to the cascade:
� Phase 1: A normal afternoon degrades
� Phase 2: FE’s computer failures
� Phase 3: Three FE 345-kV transmission line fail-ures and many phone calls
� Phase 4: The collapse of the FE 138-kV systemand the loss of the Sammis-Star line
Key events within each phase are summarized inFigure 4.1, a timeline of major events in the originof the blackout in Ohio. The discussion that fol-lows highlights and explains these significantevents within each phase and explains how theevents were related to one another and to thecascade.
� U.S.-Canada Power System Outage Task Force � Causes of the August 14th Blackout � 21

Phase 1:A Normal Afternoon Degrades:
12:15 EDT to 14:14 EDT
Overview of This Phase
Northern Ohio was experiencing an ordinaryAugust afternoon, with loads moderately high toserve air conditioning demand. FirstEnergy (FE)was importing approximately 2,000 MW into itsservice territory, causing its system to consumehigh levels of reactive power. With two of Cleve-land’s active and reactive power productionanchors already shut down (Davis-Besse andEastlake 4), the loss of the Eastlake 5 unit at 13:31further depleted critical voltage support for theCleveland-Akron area. Detailed simulation model-ing reveals that the loss of Eastlake 5 was a signifi-cant factor in the outage later that afternoon—withEastlake 5 gone, transmission line loadingswere notably higher and after the loss of FE’sHarding-Chamberlin line at 15:05, the system
eventually became unable to sustain additionalcontingencies without line overloads above emer-gency ratings. Had Eastlake 5 remained in service,subsequent line loadings would have been lowerand tripping due to tree contacts may not haveoccurred. Loss of Eastlake 5, however, did not ini-tiate the blackout. Subsequent computer failuresleading to the loss of situational awareness in FE’scontrol room and the loss of key FE transmissionlines due to contacts with trees were the mostimportant causes.
At 14:02 EDT, Dayton Power & Light’s (DPL) Stu-art-Atlanta 345-kV line tripped off-line due to atree contact. This line had no direct electricaleffect on FE’s system—but it did affect MISO’s per-formance as reliability coordinator, even thoughPJM is the reliability coordinator for the DPL line.One of MISO’s primary system condition evalua-tion tools, its state estimator, was unable to assesssystem conditions for most of the period between12:37 EDT and 15:34 EDT, due to a combination ofhuman error and the effect of the loss of DPL’s
22 � U.S.-Canada Power System Outage Task Force � Causes of the August 14th Blackout �
Figure 4.1. Timeline: Start of the Blackout in Ohio

Stuart-Atlanta line on other MISO lines asreflected in the state estimator’s calculations.Without an effective state estimator, MISO wasunable to perform contingency analyses of genera-tion and line losses within its reliability zone.Therefore, through 15:34 EDT MISO could notdetermine that with Eastlake 5 down, other trans-mission lines would overload if FE lost a majortransmission line, and could not issue appropriatewarnings and operational instructions.
In the investigation interviews, all utilities, con-trol area operators, and reliability coordinators
indicated that the morning of August 14 was a rea-sonably typical day. FE managers referred to it aspeak load conditions on a less than peak loadday.2 Dispatchers consistently said that whilevoltages were low, they were consistent with his-torical voltages.3 Throughout the morning andearly afternoon of August 14, FE reported a grow-ing need for voltage support in the upper Midwest.
The FE reliability operator was concerned aboutlow voltage conditions on the FE system as earlyas 13:13 EDT. He asked for voltage support (i.e.,increased reactive power output) from FE’s
� U.S.-Canada Power System Outage Task Force � Causes of the August 14th Blackout � 23
The Causes of the Blackout
The initiation of the August 14, 2003, blackoutwas caused by deficiencies in specific practices,equipment, and human decisions that coincidedthat afternoon. There were three groups ofcauses:
Group 1: Inadequate situational awareness atFirstEnergy Corporation (FE). In particular:
A) FE failed to ensure the security of its transmis-sion system after significant unforeseen con-tingencies because it did not use an effectivecontingency analysis capability on a routinebasis. (See page 28.)
B) FE lacked procedures to ensure that theiroperators were continually aware of the func-tional state of their critical monitoring tools.(See page 31.)
C) FE lacked procedures to test effectively thefunctional state of these tools after repairswere made. (See page 31.)
D) FE did not have additional monitoring toolsfor high-level visualization of the status oftheir transmission system to facilitate its oper-ators’ understanding of transmission systemconditions after the failure of their primarymonitoring/alarming systems. (See page 33.)
Group 2: FE failed to manage adequately treegrowth in its transmission rights-of-way. Thisfailure was the common cause of the outage ofthree FE 345-kV transmission lines. (See page34.)
Group 3: Failure of the interconnected grid’sreliability organizations to provide effectivediagnostic support. In particular:
A) MISO did not have real-time data from DaytonPower and Light’s Stuart-Atlanta 345-kV lineincorporated into its state estimator (a systemmonitoring tool). This precluded MISO frombecoming aware of FE’s system problems ear-lier and providing diagnostic assistance to FE.(See page 24.)
B) MISO’s reliability coordinators were usingnon-real-time data to support real-time“flowgate” monitoring. This prevented MISOfrom detecting an N-1 security violation inFE’s system and from assisting FE in neces-sary relief actions. (See page 39.)
C) MISO lacked an effective means of identifyingthe location and significance of transmissionline breaker operations reported by theirEnergy Management System (EMS). Suchinformation would have enabled MISO opera-tors to become aware earlier of important lineoutages. (See pages 27 and 36.)
D) PJM and MISO lacked joint procedures orguidelines on when and how to coordinate asecurity limit violation observed by one ofthem in the other’s area due to a contingencynear their common boundary. (See page 38.)
In the pages below, sections that relate to par-ticular causes are denoted with the followingsymbols:
Cause 1:InadequateSituationalAwareness
Cause 2:InadequateTreeTrimming
Cause 3:InadequateRC DiagnosticSupport

interconnected generators. Plants were operatingin automatic voltage control mode (reacting to sys-tem voltage conditions and needs rather than con-stant reactive power output). As directed in FE’sManual of Operations,4 the FE reliability operatorbegan to call plant operators to ask for additionalvoltage support from their units. He noted to mostof them that system voltages were sagging “allover.” Several mentioned that they were already ator near their reactive output limits. None wereasked to reduce their active power output to beable to produce more reactive output. He calledthe Sammis plant at 13:13 EDT, West Lorain at13:15 EDT, Eastlake at 13:16 EDT, made threecalls to unidentified plants between 13:20 EDTand 13:23 EDT, a “Unit 9” at 13:24 EDT, and twomore at 13:26 EDT and 13:28 EDT.5 The operatorsworked to get shunt capacitors at Avon that wereout of service restored to support voltage.6
Following the loss of Eastlake 5 at 13:31 EDT, FE’soperators’ concern about voltage levels washeightened. They called Bayshore at 13:41 EDTand Perry at 13:43 EDT to ask the plants for morevoltage support. Again, while there was substan-tial effort to support voltages in the Ohio area,First Energy personnel characterized the condi-tions as not being unusual for a peak load day,although this was not an all-time (or record) peakload day.
Key Phase 1 Events
1A) 12:15 EDT to 16:04 EDT: MISO’s state estima-tor software solution was compromised, andMISO’s single contingency reliability assess-ment became unavailable.
1B) 13:31:34 EDT: Eastlake Unit 5 generation trip-ped in northern Ohio.
1C) 14:02 EDT: Stuart-Atlanta 345-kV transmis-sion line tripped in southern Ohio.
1A) MISO’s State Estimator Was Turned Off:12:15 EDT to 16:04 EDT
It is common for reliability coordinators and con-trol areas to use a tool called a state estimator (SE)to improve the accuracy of the raw sampled datathey have for the electric system by mathemati-cally processing raw data to make it consistentwith the electrical system model. The resultinginformation on equipment voltages and loadingsis used in software tools such as real time contin-gency analysis (RTCA) to simulate various condi-tions and outages to evaluate the reliability of thepower system. The RTCA tool is used to alert oper-ators if the system is operating insecurely; it canbe run either on a regular schedule (e.g., every 5minutes), when triggered by some system event(e.g., the loss of a power plant or transmissionline), or when initiated by an operator. MISO usu-ally runs the SE every 5 minutes, and the RTCAless frequently. If the model does not have accu-rate and timely information about key pieces ofsystem equipment or if key input data are wrong,the state estimator may be unable to reach a solu-tion or it will reach a solution that is labeled ashaving a high degree of error. MISO considers itsSE and RTCA tools to be still under developmentand not fully mature.
On August 14 at about 12:15 EDT, MISO’s stateestimator produced a solution with a high mis-match (outside the bounds of acceptable error).This was traced to an outage of Cinergy’s
24 � U.S.-Canada Power System Outage Task Force � Causes of the August 14th Blackout �
Figure 4.2. Timeline Phase 1

� U.S.-Canada Power System Outage Task Force � Causes of the August 14th Blackout � 25
Initial Findings: Violations of NERC Reliability Standards
Note: These are initial findings and subject tofurther review by NERC. Additional violationsmay be identified.
Violation Number 1. Following the outage of theChamberlin-Harding 345-kV line, FE did not takethe necessary actions to return the system to asafe operating state within 30 minutes.a
Reference: NERC Operating Policy 2:
Following a contingency or other event thatresults in an OPERATING SECURITY LIMIT viola-tion, the CONTROL AREA shall return its trans-mission system to within OPERATING SECURITY
LIMITS soon as possible, but no longer than 30minutes.
Violation Number 2. FE did not notify other sys-tems of an impending system emergency.b
Reference: NERC Operating Policy 5:
Notifying other systems. A system shall informother systems in their Region or subregion,through predetermined communication paths,whenever the following situations are antici-pated or arise:
System is burdening others. The system’s con-dition is burdening other systems or reducingthe reliability of the Interconnection.
Lack of single contingency coverage. The sys-tem’s line loadings and voltage/reactive levelsare such that a single contingency couldthreaten the reliability of the Interconnection.
Violation Number 3. FE’s state estimation/con-tingency analysis tools were not used to assessthe system conditions.c
Reference: NERC Operating Policy 5:
Sufficient information and analysis tools shall beprovided to the SYSTEM OPERATOR to determine
the cause(s) of OPERATING SECURITY LIMIT viola-tions. This information shall be provided inboth real time and predictive formats so that theappropriate corrective actions may be taken.
Violation Number 4. FE operator training wasinadequate for maintaining reliable operation.d
Reference: NERC Operating Policy 8:
SYSTEM OPERATOR Training. Each OPERATING
AUTHORITY shall provide its SYSTEM OPERATORS
with a coordinated training program that isdesigned to promote reliable operation. Thisprogram shall include:
� Training staff. Individuals competent in bothknowledge of system operations and instruc-tional capabilities.
� Verification of achievement. Verification thatall trainees have successfully demonstratedattainment of all required training objectives,including documented assessment of theirtraining progress.
� Review. Periodic review to ensure that train-ing materials are technically accurate andcomplete and to ensure that the training pro-gram continues to meet its objectives.
Violation Number 5. MISO did not notify otherreliability coordinators of potential problems.e
Reference: NERC Operating Policy 9:
Notify RELIABILITY COORDINATORS of potentialproblems. The RELIABILITY COORDINATOR whoforesees a transmission problem within hisRELIABILITY AREA shall issue an alert to allCONTROL AREAS and Transmission Providers inhis RELIABILITY AREA, and all RELIABILITY
COORDINATORS within the INTERCONNECTION viathe RCIS without delay.
(continued on following page)
aInvestigation team modeling showed that following the loss of the Chamberlin-Harding 345-kV line the system was beyond itsOPERATING SECURITY LIMIT; i.e., the loss of the next most severe contingency would have resulted in other lines exceeding theiremergency limits. Blackout causes 1A, 1B, 1E.bDOE on-site interviews; comparative review of FE and MISO phone transcripts of 14 August; no calls found of FE declaring anemergency to MISO in either set of transcripts. Blackout causes 1A, 1B, 1D, 1E.cDOE on-site interviews; Mr. Morgan, September 8 and 9 transcripts.dSite visit by interviewers from Operations Team.eMISO site visit and DOE interviews; Oct 1-3 Newark meetings, ns100303.pdf; Harzey-Cauley conversation, pages 111-119;blackout cause 3D.

26 � U.S.-Canada Power System Outage Task Force � Causes of the August 14th Blackout �
Initial Findings: Violations of NERC Reliability Standards (Continued)
Violation Number 6. MISO did not have ade-quate monitoring capability.f
Reference: NERC Operating Policy 9, Appendix9D:
Adequate facilities. Must have the facilities toperform their responsibilities, including:
� Detailed monitoring capability of theRELIABILITY AREA and sufficient monitoring
capability of the surrounding RELIABILITY
AREAS to ensure potential security violationsare identified.
Continuous monitoring of Reliability Area.Must ensure that its RELIABILITY AREA of respon-sibility is continuously and adequately moni-tored. This includes the provisions for backupfacilities.
fDOE interviews and Operations Team site visit. Oct 1-3 Newark meetings, ns100303.pdf; Harzey-Cauley conversation, pages111-119; blackout causes 3A, 3B, 3C.
Energy Management System (EMS) and Decision Support Tools
Operators look at potential problems that couldarise on their systems by using contingency anal-yses, driven from state estimation, that are fed bydata collected by the SCADA system.
SCADA: System operators use System Controland Data Acquisition systems to acquire powersystem data and control power system equip-ment. SCADA systems have three types of ele-ments: field remote terminal units (RTUs),communication to and between the RTUs, andone or more Master Stations.
Field RTUs, installed at generation plants andsubstations, are combination data gathering anddevice control units. They gather and provideinformation of interest to system operators, suchas the status of a breaker (switch), the voltage ona line or the amount of power being produced bya generator, and execute control operations suchas opening or closing a breaker. Telecommunica-tions facilities, such as telephone lines or micro-wave radio channels, are provided for the fieldRTUs so they can communicate with one or moreSCADA Master Stations or, less commonly, witheach other.
Master stations are the pieces of the SCADA sys-tem that initiate a cycle of data gathering from thefield RTUs over the communications facilities,with the time cycles ranging from every few sec-onds to as long as several minutes. In manypower systems, Master Stations are fully inte-grated into the control room, serving as the directinterface to the Energy Management System(EMS), receiving incoming data from the fieldRTUs and relaying control operations commandsto the field devices for execution.
State Estimation: Transmission system operatorshave visibility (condition information) over their
own transmission facilities. Most control facili-ties do not receive direct line voltage and currentdata on every facility for which they need visibil-ity. Instead, system state estimators use thereal-time data measurements available on a sub-set of those facilities in a complex mathematicalmodel of the power system that reflects the con-figuration of the network (which facilities are inservice and which are not) and real-time systemcondition data to estimate voltage at each bus,and to estimate real and reactive power flowquantities on each line or through each trans-former. Reliability coordinators and control areasthat have them commonly run a state estimatoron regular intervals or only as the need arises(i.e., upon demand). Not all control areas usestate estimators.
Contingency Analysis: Given the state estima-tor’s representation of current system conditions,a system operator or planner uses contingencyanalysis to analyze the impact of specific outages(lines, generators, or other equipment) or higherload, flow, or generation levels on the security ofthe system. The contingency analysis shouldidentify problems such as line overloads or volt-age violations that will occur if a new event(contingency) happens on the system. Sometransmission operators and control areas haveand use state estimators to produce base casesfrom which to analyze next contingencies (“N-1,”meaning normal system minus 1 element) fromthe current conditions. This tool is typically usedto assess the reliability of system operation.Many control areas do not use real time contin-gency analysis tools, but others run them ondemand following potentially significant systemevents.

Bloomington-Denois Creek 230-kV line—al-though it was out of service, its status was notupdated in MISO’s state estimator. Line statusinformation within MISO’s reliability coordina-tion area is transmitted to MISO by the ECAR datanetwork or direct links and intended to be auto-matically linked to the SE. This requires coordi-nated data naming as well as instructions that linkthe data to the tools. For this line, the automaticlinkage of line status to the state estimator had notyet been established (this is an ongoing project atMISO). The line status was corrected and MISO’sanalyst obtained a good SE solution at 13:00 EDTand an RTCA solution at 13:07 EDT, but to trou-bleshoot this problem he had turned off the auto-matic trigger that runs the state estimator everyfive minutes. After fixing the problem he forgot tore-enable it, so although he had successfully runthe SE and RTCA manually to reach a set of correctsystem analyses, the tools were not returned tonormal automatic operation. Thinking the systemhad been successfully restored, the analyst wentto lunch.
The fact that the state estimatorwas not running automatically onits regular 5-minute schedule wasdiscovered about 14:40 EDT. Theautomatic trigger was re-enabled
but again the state estimator failed to solve suc-cessfully. This time investigation identified theStuart-Atlanta 345-kV line outage (14:02 EDT) tobe the likely cause.7 This line is jointly owned byDayton Power and Light and AEP and is moni-tored by Dayton Power and Light and is underPJM’s reliability umbrella rather than MISO’s.Even though it affects electrical flows withinMISO, its status had not been automatically linkedto MISO’s SE.
The discrepancy between actual measured systemflows (with Stuart-Atlanta off-line) and the MISOmodel (which assumed Stuart-Atlanta on-line)prevented the state estimator from solvingcorrectly. At 15:09 EDT, when informed by thesystem engineer that the Stuart-Atlanta lineappeared to be the problem, the MISO operatorsaid (mistakenly) that this line was in service. Thesystem engineer then tried unsuccessfully toreach a solution with the Stuart-Atlanta line mod-eled as in service until approximately 15:29 EDT,when the MISO operator called PJM to verify thecorrect status. After they determined that Stu-art-Atlanta had tripped, they updated the stateestimator and it solved successfully. The RTCAwas then run manually and solved successfully at
15:41 EDT. MISO’s state estimator and contin-gency analysis were back under full automaticoperation and solving effectively by 16:04 EDT,about two minutes before the initiation of thecascade.
In summary, the MISO state estimator and realtime contingency analysis tools were effectivelyout of service between 12:15 EDT and 16:04 EDT.This prevented MISO from promptly performingprecontingency “early warning” assessments ofpower system reliability over the afternoon ofAugust 14.
1B) Eastlake Unit 5 Tripped: 13:31 EDT
Eastlake Unit 5 (rated at 597 MW) is in northernOhio along the southern shore of Lake Erie, con-nected to FE’s 345-kV transmission system (Figure4.3). The Cleveland and Akron loads are generallysupported by generation from a combination ofthe Eastlake and Davis-Besse units, along with sig-nificant imports, particularly from 9,100 MW ofgeneration located along the Ohio and Pennsylva-nia border. The unavailability of Eastlake 4 andDavis-Besse meant that FE had to import moreenergy into the Cleveland area (either from its ownplants or from or through neighboring utilities) tosupport its load.
When Eastlake 5 dropped off-line, flows caused byreplacement power transfers and the associatedreactive power to support the imports to the localarea contributed to the additional line loadings inthe region. At 15:00 EDT on August 14, FE’s loadwas approximately 12,080 MW. They wereimporting about 2,575 MW, 21% of their total.With this high level of imports, FE’s system reac-tive power needs rose further. Investigation teammodeling indicates that at about 15:00 EDT, FE’s
� U.S.-Canada Power System Outage Task Force � Causes of the August 14th Blackout � 27
Figure 4.3. Eastlake Unit 5
Cause 3:InadequateRC DiagnosticSupport

system was consuming so much reactive powerthat it was a net importer, bringing in about 132MVAr.
The investigation team’s system simulations indi-cate that the loss of Eastlake 5 was a critical step inthe sequence of events. Contingency analysis sim-ulation of the conditions following the loss of theHarding-Chamberlin 345-kV circuit at 15:05 EDTshowed that the system would be unable to sus-tain some contingencies without line overloadsabove emergency ratings. However, when Eastlake5 was modeled as in service and fully available inthose simulations, all overloads above emergencylimits were eliminated even with the loss ofHarding-Chamberlin.
FE did not perform a contingencyanalysis after the loss of Eastlake5 at 13:31 EDT to determinewhether the loss of further linesor plants would put their system
at risk. FE also did not perform a contingency anal-ysis after the loss of Harding-Chamberlin at 15:05EDT (in part because they did not know that it hadtripped out of service), nor does the utility rou-tinely conduct such studies.8 Thus FE did not dis-cover that their system was no longer in an N-1secure state at 15:05 EDT, and that operator actionwas needed to remedy the situation.
1C) Stuart-Atlanta 345-kV Line Tripped:14:02 EDT
The Stuart-Atlanta 345-kV trans-mission line is in the control areaof Dayton Power and Light.9 At14:02 EDT the line tripped due tocontact with a tree, causing a
short circuit to ground, and locked out. Investiga-tion team modeling reveals that the loss of DPL’sStuart-Atlanta line had no significant electricaleffect on power flows and voltages in the FE area.The team examined the security of FE’s system,testing power flows and voltage levels with thecombination of plant and line outages that evolvedon the afternoon of August 14. This analysisshows that the availability or unavailability of theStuart-Atlanta 345-kV line did not change thecapability or performance of FE’s system or affectany line loadings within the FE system, eitherimmediately after its trip or later that afternoon.Again, the only reason why Stuart-Atlanta mattersto the blackout is because it contributed to the fail-ure of MISO’s state estimator to operate effec-tively, so MISO could not fully identify FE’sprecarious system conditions until 16:04 EDT.
Phase 2:FE’s Computer Failures:14:14 EDT to 15:59 EDT
Overview of This Phase
Starting around 14:14 EDT, FE’s control roomoperators lost the alarm function that providedaudible and visual indications when a significantpiece of equipment changed from an acceptable toproblematic condition. Shortly thereafter, theEMS system lost a number of its remote controlconsoles. Next it lost the primary server computerthat was hosting the alarm function, and then thebackup server such that all functions that werebeing supported on these servers were stopped at14:54 EDT. However, for over an hour no one inFE’s control room grasped that their computer sys-tems were not operating properly, even thoughFE’s Information Technology support staff knewof the problems and were working to solve them,and the absence of alarms and other symptomsoffered many clues to the operators of the EMSsystem’s impaired state. Thus, without a function-ing EMS or the knowledge that it had failed, FE’ssystem operators remained unaware that theirelectrical system condition was beginning todegrade. Unknowingly, they used the outdatedsystem condition information they did have to dis-count information from others about growing sys-tem problems.
Key Events in This Phase
2A) 14:14 EDT: FE alarm and logging softwarefailed. Neither FE’s control room operatorsnor FE’s IT EMS support personnel wereaware of the alarm failure.
2B) 14:20 EDT: Several FE remote location con-soles failed. FE Information Technology (IT)engineer was computer auto-paged.
2C) 14:27:16 EDT: Star-South Canton 345-kVtransmission line tripped and successfullyreclosed.
2D) 14:32 EDT: AEP called FE control room aboutAEP indication of Star-South Canton 345-kVline trip and reclosure. FE had no alarm or logof this line trip.
2E) 14:41 EDT: The primary FE control systemserver hosting the alarm function failed. Itsapplications and functions were passed overto a backup computer. FE’s IT engineer wasauto-paged.
28 � U.S.-Canada Power System Outage Task Force � Causes of the August 14th Blackout �
Cause 1:InadequateSituationalAwareness
Cause 3:InadequateRC DiagnosticSupport

2F) 14:54 EDT: The FE back-up computer failedand all functions that were running on itstopped. FE’s IT engineer was auto-paged.
Failure of FE’s Alarm System
FE’s computer SCADA alarm andlogging software failed sometimeshortly after 14:14 EDT (the lasttime that a valid alarm came in).After that time, the FE control
room consoles did not receive any further alarmsnor were there any alarms being printed or postedon the EMS’s alarm logging facilities. Power sys-tem operators rely heavily on audible andon-screen alarms, plus alarm logs, to reveal anysignificant changes in their system’s conditions.After 14:14 EDT on August 14, FE’s operators wereworking under a significant handicap withoutthese tools. However, they were in further jeop-ardy because they did not know that they wereoperating without alarms, so that they did not real-ize that system conditions were changing.
Alarms are a critical function of an EMS, andEMS-generated alarms are the fundamental meansby which system operators identify events on thepower system that need their attention. Withoutalarms, events indicating one or more significantsystem changes can occur but remain undetectedby the operator. If an EMS’s alarms are absent, butoperators are aware of the situation and theremainder of the EMS’s functions are intact, theoperators can potentially continue to use the EMSto monitor and exercise control of their power sys-tem. In such circumstances, the operators wouldhave to do so via repetitive, continuous manualscanning of numerous data and status points
located within the multitude of individual dis-plays available within their EMS. Further, itwould be difficult for the operator to identifyquickly the most relevant of the many screensavailable.
Although the alarm processing function of FE’sEMS failed, the remainder of that system generallycontinued to collect valid real-time status infor-mation and measurements about FE’s power sys-tem, and continued to have supervisory controlover the FE system. The EMS also continued tosend its normal and expected collection of infor-mation on to other monitoring points and authori-ties, including MISO and AEP. Thus these entitiescontinued to receive accurate information aboutthe status and condition of FE’s power systemeven past the point when FE’s EMS alarms failed.FE’s operators were unaware that in this situationthey needed to manually and more closely moni-tor and interpret the SCADA information theywere receiving. Continuing on in the belief thattheir system was satisfactory and lacking anyalarms from their EMS to the contrary, FE controlroom operators were subsequently surprisedwhen they began receiving telephone calls fromother locations and information sources—MISO,AEP, PJM, and FE field operations staff—whooffered information on the status of FE’s transmis-sion facilities that conflicted with FE’s systemoperators’ understanding of the situation.
Analysis of the alarm problem performed by FEsuggests that the alarm process essentially“stalled” while processing an alarm event, suchthat the process began to run in a manner thatfailed to complete the processing of that alarm orproduce any other valid output (alarms). In the
� U.S.-Canada Power System Outage Task Force � Causes of the August 14th Blackout � 29
Figure 4.4. Timeline Phase 2
Cause 1:InadequateSituationalAwareness

meantime, new inputs—system condition datathat needed to be reviewed for possible alarms—built up in and then overflowed the process’ inputbuffers.10
Loss of Remote EMS Terminals. Between 14:20EDT and 14:25 EDT, some of FE’s remote controlterminals in substations ceased operation. FE hasadvised the investigation team that it believes thisoccurred because the data feeding into those ter-minals started “queuing” and overloading the ter-minals’ buffers. FE’s system operators did notlearn about this failure until 14:36 EDT, when atechnician at one of the sites noticed the terminalwas not working after he came in on the 15:00shift, and called the main control room to reportthe problem. As remote terminals failed, eachtriggered an automatic page to FE’s Information
Technology (IT) staff.11 The investigation teamhas not determined why some terminals failedwhereas others did not. Transcripts indicate thatdata links to the remote sites were down as well.12
EMS Server Failures. FE’s EMS system includesseveral server nodes that perform the higher func-tions of the EMS. Although any one of them canhost all of the functions, FE’s normal system con-figuration is to have a number of host subsets ofthe applications, with one server remaining in a“hot-standby” mode as a backup to the othersshould any fail. At 14:41 EDT, the primary serverhosting the EMS alarm processing applicationfailed, due either to the stalling of the alarmapplication, “queuing” to the remote terminals,or some combination of the two. Followingpreprogrammed instructions, the alarm system
30 � U.S.-Canada Power System Outage Task Force � Causes of the August 14th Blackout �
Alarms
System operators must keep a close and constantwatch on the multitude of things occurringsimultaneously on their power system. Theseinclude the system’s load, the generation andsupply resources to meet that load, availablereserves, and measurements of critical powersystem states, such as the voltage levels on thelines. Because it is not humanly possible towatch and understand all these events and con-ditions simultaneously, Energy ManagementSystems use alarms to bring relevant informationto operators’ attention. The alarms draw on theinformation collected by the SCADA real-timemonitoring system.
Alarms are designed to quickly and appropri-ately attract the power system operator's atten-tion to events or developments of interest on thesystem. They do so using combinations of audi-ble and visual signals, such as sounds at opera-tors’ control desks and symbol or color changesor animations on system monitors or displays.EMS alarms for power systems are similar to theindicator lights or warning bell tones that a mod-ern automobile uses to signal its driver, like the“door open” bell, an image of a headlight highbeam, a “parking brake on” indicator, and thevisual and audible alert when a gas tank is almostempty.
Power systems, like cars, use “status” alarms and“limit” alarms. A status alarm indicates the stateof a monitored device. In power systems theseare commonly used to indicate whether suchitems as switches or breakers are “open” or
“closed” (off or on) when they should be other-wise, or whether they have changed conditionsince the last scan. These alarms should provideclear indication and notification to system opera-tors of whether a given device is doing what theythink it is, or what they want it to do—forinstance, whether a given power line is con-nected to the system and moving power at a par-ticular moment.
EMS limit alarms are designed to provide anindication to system operators when somethingimportant that is measured on a power systemdevice—such as the voltage on a line or theamount of power flowing across it—is below orabove pre-specified limits for using that devicesafely and efficiently. When a limit alarm acti-vates, it provides an important early warning tothe power system operator that elements of thesystem may need some adjustment to preventdamage to the system or to customer loads—rather like the “low fuel” or “high engine temper-ature” warnings in a car.
When FE’s alarm system failed on August 14, itsoperators were running a complex power systemwithout adequate indicators of when key ele-ments of that system were reaching and passingthe limits of safe operation—and without aware-ness that they were running the system withoutthese alarms and should no longer trust the factthat they were not getting alarms as indicatingthat system conditions were still safe and notchanging.

application and all other EMS software running onthe first server automatically transferred (“failed-over”) onto the back-up server. However, becausethe alarm application moved intact onto thebackup while still stalled and ineffective, thebackup server failed 13 minutes later, at 14:54EDT. Accordingly, all of the EMS applications onthese two servers stopped running.
The concurrent loss of both EMS servers appar-ently caused several new problems for FE’s EMSand the operators who used it. Tests run duringFE’s after-the-fact analysis of the alarm failureevent indicate that a concurrent absence of theseservers can significantly slow down the rate atwhich the EMS system puts new—or refreshesexisting—displays on operators’ computer con-soles. Thus at times on August 14th, operators’screen refresh rates—the rate at which new infor-mation and displays are painted onto the com-puter screen, normally 1 to 3 seconds—slowed toas long as 59 seconds per screen. Since FE opera-tors have numerous information screen options,and one or more screens are commonly “nested” assub-screens to one or more top level screens, oper-ators’ ability to view, understand and operate theirsystem through the EMS would have slowed to afrustrating crawl.13 This situation may haveoccurred between 14:54 EDT and 15:08 EDT whenboth servers failed, and again between 15:46 EDTand 15:59 EDT while FE’s IT personnel attemptedto reboot both servers to remedy the alarmproblem.
Loss of the first server caused an auto-page to beissued to alert FE’s EMS IT support personnel tothe problem. When the back-up server failed, ittoo sent an auto-page to FE’s IT staff. At 15:08EDT, IT staffers completed a “warm reboot”(restart) of the primary server. Startup diagnosticsmonitored during that reboot verified that thecomputer and all expected processes were run-ning; accordingly, FE’s IT staff believed that theyhad successfully restarted the node and all theprocesses it was hosting. However, although theserver and its applications were again running, thealarm system remained frozen and non-func-tional, even on the restarted computer. The IT staffdid not confirm that the alarm system was againworking properly with the control room operators.
Another casualty of the loss of both servers wasthe Automatic Generation Control (AGC) functionhosted on those computers. Loss of AGC meantthat FE’s operators could not run affiliatedpower plants on pre-set programs to respond
automatically to meet FE’s system load and inter-change obligations. Although the AGC did notwork from 14:54 EDT to 15:08 EDT and 15:46 EDTto 15:59 EDT (periods when both servers weredown), this loss of function does not appear tohave had any effect on the blackout.
The concurrent loss of the EMS servers alsocaused the failure of FE’s strip chart function.There are many strip charts in the FE ReliabilityOperator control room driven by the EMS comput-ers, showing a variety of system conditions,including raw ACE (Area Control Error), FE Sys-tem Load, and Sammis-South Canton and SouthCanton-Star loading. These charts are visible inthe reliability operator control room. The chartprinters continued to scroll but because the under-lying computer system was locked up the chartpens showed only the last valid measurementrecorded, without any variation from that mea-surement as time progressed; i.e. the charts“flat-lined.” There is no indication that any opera-tors noticed or reported the failed operation of thecharts.14 The few charts fed by direct analogtelemetry, rather than the EMS system, showedprimarily frequency data, and remained availablethroughout the afternoon of August 14. Theseyield little useful system information for opera-tional purposes.
FE’s Area Control Error (ACE), the primary controlsignal used to adjust generators and imports tomatch load obligations, did not function between14:54 EDT and 15:08 EDT and later between 15:46EDT and 15:59 EDT, when the two servers weredown. This meant that generators were not con-trolled during these periods to meet FE’s load andinterchange obligations (except from 15:00 EDT to15:09 EDT when control was switched to a backupcontroller). There were no apparent negativeimpacts due to this failure. It has not been estab-lished how loss of the primary generation controlsignal was identified or if any discussionsoccurred with respect to the computer system’soperational status.15
EMS System History. The EMS in service at FE’sOhio control center is a GE Harris (now GE Net-work Systems) XA21 system. It was initiallybrought into service in 1995. Other than the appli-cation of minor software fixes or patches typicallyencountered in the ongoing maintenance and sup-port of such a system, the last major updates orrevisions to this EMS were implemented in 1998.On August 14 the system was not running themost current release of the XA21 software. FE had
� U.S.-Canada Power System Outage Task Force � Causes of the August 14th Blackout � 31

decided well before August 14 to replace it withone from another vendor.
FE personnel told the investigation team that thealarm processing application had failed on occa-sions prior to August 14, leading to loss of thealarming of system conditions and events for FE’soperators.16 However, FE said that the mode andbehavior of this particular failure event were bothfirst time occurrences and ones which, at the time,FE’s IT personnel neither recognized nor knewhow to correct. FE staff told investigators that itwas only during a post-outage support call withGE late on 14 August that FE and GE determinedthat the only available course of action to correctthe alarm problem was a “cold reboot”17 of FE’soverall XA21 system. In interviews immediatelyafter the blackout, FE IT personnel indicated thatthey discussed a cold reboot of the XA21 systemwith control room operators after they were told ofthe alarm problem at 15:42 EDT, but decided notto take such action because operators considered
power system conditions precarious, were con-cerned about the length of time that the rebootmight take to complete, and understood that a coldboot would leave them with even less EMS sup-port until it was completed.18
Clues to the EMS Problems. There is an entry inFE’s western desk operator’s log at 14:14 EDTreferring to the loss of alarms, but it is not clearwhether that entry was made at that time or subse-quently, referring back to the last known alarm.There is no indication that the operator mentionedthe problem to other control room staff and super-visors or to FE’s IT staff.
The first clear hint to FE control room staff of anycomputer problems occurred at 14:19 EDT when acaller and an FE control room operator discussedthe fact that three sub-transmission centerdial-ups had failed.19 At 14:25 EDT, a controlroom operator talked with a caller about the fail-ure of these three remote terminals.20 The next
32 � U.S.-Canada Power System Outage Task Force � Causes of the August 14th Blackout �
Who Saw What?
What data and tools did others have to monitorthe conditions on the FE system?
Midwest ISO (MISO), reliability coordinator forFE
Alarms: MISO received indications of breakertrips in FE that registered in their alarms. Thesealarms were missed. These alarms require alook-up to link the flagged breaker with the asso-ciated line or equipment and unless this line wasspecifically monitored, require another look-upto link the line to the monitored flowgate. MISOoperators did not have the capability to click onthe on-screen alarm indicator to display theunderlying information.
Real Time Contingency Analysis (RTCA): Thecontingency analysis showed several hundredviolations around 15:00 EDT. This includedsome FE violations, which MISO (FE’s reliabilitycoordinator) operators discussed with PJM(AEP’s Reliability Coordinator).a Simulationsdeveloped for this investigation show that viola-tions for a contingency would have occurredafter the Harding-Chamberlin trip at 15:05 EDT.There is no indication that MISO addressed thisissue. It is not known whether MISO identifiedthe developing Sammis-Star problem.
Flowgate Monitoring Tool: While an inaccuracyhas been identified with regard to this tool it stillfunctioned with reasonable accuracy andprompted MISO to call FE to discuss the Hanna-Juniper line problem. It would not have identi-fied problems south of Star since that was notpart of the flowgate and thus not modeled inMISO’s flowgate monitor.
AEP
Contingency Analysis: According to interviews,b
AEP had contingency analysis that covered linesinto Star. The AEP operator identified a problemfor Star-South Canton overloads for a Sammis-Star line loss about 15:33 EDT and asked PJM todevelop TLRs for this.
Alarms: Since a number of lines cross betweenAEP’s and FE’s systems, they had the ability attheir respective end of each line to identify con-tingencies that would affect both. AEP initiallynoticed FE line problems with the first and sub-sequent trippings of the Star-South Canton345-kV line, and called FE three times between14:35 EDT and 15:45 EDT to determine whetherFE knew the cause of the outage.c
a“MISO Site Visit,” Benbow interview.b“AEP Site Visit,” Ulrich interview.cExample at 14:35, Channel 4; 15:19, Channel 4; 15:45, Channel 14 (FE transcripts).

hint came at 14:32 EDT, when FE scheduling staffspoke about having made schedule changes toupdate the EMS pages, but that the totals did notupdate.21
Although FE’s IT staff would have been aware thatconcurrent loss of its servers would mean the lossof alarm processing on the EMS, the investigationteam has found no indication that the IT staffinformed the control room staff either when theybegan work on the servers at 14:54 EDT, or whenthey completed the primary server restart at 15:08EDT. At 15:42 EDT, the IT staff were first told ofthe alarm problem by a control room operator; FEhas stated to investigators that their IT staff hadbeen unaware before then that the alarm process-ing sub-system of the EMS was not working.
Without the EMS systems, theonly remaining ways to monitorsystem conditions would havebeen through telephone calls anddirect analog telemetry. FE con-
trol room personnel did not realize that alarmprocessing on their EMS was not working and,subsequently, did not monitor other availabletelemetry.
During the afternoon of August14, FE operators talked to theirfield personnel, MISO, PJM (con-cerning an adjoining system inPJM’s reliability coordination
region), adjoining systems (such as AEP), and cus-tomers. The FE operators received pertinent infor-mation from all these sources, but did not graspsome key information about the system from theclues offered. This pertinent information includedcalls such as that from FE’s eastern control centerwhere they were asking about possible line trips,FE Perry nuclear plant calls regarding what lookedlike near-line trips, AEP calling about their end ofthe Star-South Canton line tripping, and MISOand PJM calling about possible line overloads.
Without a functioning alarm system, the FE con-trol area operators failed to detect the tripping ofelectrical facilities essential to maintain the secu-rity of their control area. Unaware of the loss ofalarms and a limited EMS, they made no alternatearrangements to monitor the system. When AEPidentified a circuit trip and reclosure on a 345-kVline, the FE operator dismissed the informationas either not accurate or not relevant to his sys-tem, without following up on the discrepancybetween the AEP event and the information fromhis own tools. There was no subsequent verifica-tion of conditions with their MISO reliability
coordinator. Only after AEP notified FE that a345-kV circuit had tripped and locked out did theFE control area operator compare this informationto the breaker statuses for their station. FE failed toinform immediately its reliability coordinator andadjacent control areas when they became awarethat system conditions had changed due tounscheduled equipment outages that might affectother control areas.
Phase 3:Three FE 345-kV
Transmission Line Failuresand Many Phone Calls:15:05 EDT to 15:57 EDT
Overview of This Phase
From 15:05:41 EDT to 15:41:35 EDT, three 345-kVlines failed with power flows at or below eachtransmission line’s emergency rating. Each wasthe result of a contact between a line and a treethat had grown so tall that, over a period of years,it encroached into the required clearance heightfor the line. As each line failed, its outageincreased the loading on the remaining lines(Figure 4.5). As each of the transmission linesfailed, and power flows shifted to other transmis-sion paths, voltages on the rest of FE’s systemdegraded further (Figure 4.6).
Key Phase 3 Events
3A) 15:05:41 EDT: Harding-Chamberlin 345-kVline tripped.
3B) 15:31-33 EDT: MISO called PJM to determineif PJM had seen the Stuart-Atlanta 345-kVline outage. PJM confirmed Stuart-Atlantawas out.
� U.S.-Canada Power System Outage Task Force � Causes of the August 14th Blackout � 33
Cause 1:InadequateSituationalAwareness
Cause 1:InadequateSituationalAwareness
Figure 4.5. FirstEnergy 345-kV Line Flows

3C) 15:32:03 EDT: Hanna-Juniper 345-kV linetripped.
3D) 15:35 EDT: AEP asked PJM to begin work on a350-MW TLR to relieve overloading on theStar-South Canton line, not knowing theHanna-Juniper 345-kV line had already trip-ped at 15:32 EDT.
3E) 15:36 EDT: MISO called FE regardingpost-contingency overload on Star-Juniper345-kV line for the contingency loss of theHanna-Juniper 345-kV line, unaware at thestart of the call that Hanna-Juniper hadalready tripped.
3F) 15:41:33-41 EDT: Star-South Canton 345-kVtripped, reclosed, tripped again at 15:41 EDTand remained out of service, all while AEPand PJM were discussing TLR relief options(event 3D).
Transmission lines are designed with the expecta-tion that they will sag lower when they are hotter.The transmission line gets hotter with heavier lineloading and under higher ambient temperatures,so towers and conductors are designed to be tallenough and conductors pulled tightly enough toaccommodate expected sagging.
A short-circuit occurred on the Harding-Cham-berlin 345-kV line due to a contact between theline conductor and a tree. This line failed withpower flow at only 43.5% of its normal and emer-gency line rating. Incremental line current andtemperature increases, escalated by the loss ofHarding-Chamberlin, caused enough sag on theHanna-Juniper line that it contacted a tree andfaulted with power flow at 87.5% of its normaland emergency line rating. Star-South Cantoncontacted a tree three times between 14:27:15 EDTand 15:41:33 EDT, opening and reclosing eachtime before finally locking out while loaded at93.2% of its emergency rating at 15:42:35 EDT.
Overgrown trees, as opposed toexcessive conductor sag, causedeach of these faults. While sagmay have contributed to theseevents, these incidents occurred
because the trees grew too tall and encroachedinto the space below the line which is intendedto be clear of any objects, not because the linessagged into short trees. Because the trees were sotall (as discussed below), each of these linesfaulted under system conditions well within spec-ified operating parameters. The investigation teamfound field evidence of tree contact at all threelocations, although Hanna-Juniper is the onlyone with a confirmed sighting for the August 14
34 � U.S.-Canada Power System Outage Task Force � Causes of the August 14th Blackout �
Cause 2:InadequateTreeTrimming
Figure 4.6. Voltages on FirstEnergy’s 345-kV Lines:Impacts of Line Trips
Figure 4.7. Timeline Phase 3

tree/line contact. For the other locations, the teamfound various types of evidence, outlined below,that confirm that contact with trees caused theshort circuits to ground that caused each line totrip out on August 14.
To be sure that the evidence of tree/line contactsand tree remains found at each site was linked tothe events of August 14, the team looked atwhether these lines had any prior history of out-ages in preceding months or years that might haveresulted in the burn marks, debarking, and othervegetative evidence of line contacts. The recordestablishes that there were no prior sustained out-ages known to be caused by trees for these lines in2001, 2002 and 2003.22
Like most transmission owners, FE patrols its linesregularly, flying over each transmission line twicea year to check on the condition of the rights-of-way. Notes from fly-overs in 2001 and 2002indicate that the examiners saw a significant num-ber of trees and brush that needed clearing or trim-ming along many FE transmission lines.
� U.S.-Canada Power System Outage Task Force � Causes of the August 14th Blackout � 35
Utility Vegetation Management: When Trees and Lines Contact
Vegetation management is critical to any utilitycompany that maintains overhead energizedlines. It is important and relevant to the August14 events because electric power outages occurwhen trees, or portions of trees, grow up or fallinto overhead electric power lines. While not alloutages can be prevented (due to storms, heavywinds, etc.), many outages can be mitigated orprevented by managing the vegetation before itbecomes a problem. When a tree contacts apower line it causes a short circuit, which is readby the line’s relays as a ground fault. Direct phys-ical contact is not necessary for a short circuit tooccur. An electric arc can occur between a part ofa tree and a nearby high-voltage conductor if asufficient distance separating them is not main-tained. Arcing distances vary based on such fac-tors such as voltage and ambient wind andtemperature conditions. Arcs can cause fires aswell as short circuits and line outages.
Most utilities have right-of-way and easementagreements allowing the utility to clear andmaintain the vegetation as needed along its linesto provide safe and reliable electric power. Ease-ments give the utility a great deal of control overthe landscape, with extensive rights to do what-ever work is required to maintain the lines withadequate clearance through the control of veg-etation. The three principal means of managingvegetation along a transmission right-of-wayare pruning the limbs adjacent to the line
clearance zone, removing vegetation completelyby mowing or cutting, and using herbicides toretard or kill further growth. It is common to seemore tree and brush removal using mechanicaland chemical tools and relatively less pruningalong transmission rights-of-way.
FE’s easement agreements establish extensiverights regarding what can be pruned or removedin these transmission rights-of-way, including:“the right to erect, inspect, operate, replace, relo-cate, repair, patrol and permanently maintainupon, over, under and along the above describedright of way across said premises all necessarystructures, wires, cables and other usual fixturesand appurtenances used for or in connectionwith the transmission and distribution of electriccurrent, including telephone and telegraph, andthe right to trim, cut, remove or control by anyother means at any and all times such trees, limbsand underbrush within or adjacent to said rightof way as may interfere with or endanger saidstructures, wires or appurtenances, or their oper-ations.”a
FE uses a 5-year cycle for transmission line vege-tation maintenance, i.e. completes all requiredvegetation work within a five year period for allcircuits. A 5-year cycle is consistent with indus-try standards, and it is common for transmissionproviders not to fully exercise their easementrights on transmission rights-of-way due to land-owner opposition.
aStandard language in FE’s right-of-way easement agreement.
Line Ratings
A conductor’s normal rating reflects howheavily the line can be loaded under routineoperation and keep its internal temperaturebelow 90°C. A conductor’s emergency rating isoften set to allow higher-than-normal powerflows, but to limit its internal temperature to amaximum of 100°C for no longer than a short,specified period, so that it does not sag too low.For three of the four 345-kV lines that failed,FE set the normal and emergency ratings at thesame level.

3A) FE’s Harding-Chamberlin 345-kV LineTripped: 15:05 EDT
At 15:05:41 EDT, FE’s Harding-Chamberlin line (Figure 4.8)tripped and locked out whileloaded at 43.5% of its normal andemergency rating. The investiga-
tion team has examined the relay data for this trip,identified the geographic location of the fault, anddetermined that the relay data match the classic“signature” pattern for a tree/line short circuit toground fault. Going to the fault location deter-mined from the relay data, the field team foundthe remains of trees and brush. At this location,conductor height measured 46 feet 7 inches, whilethe height of the felled tree measured 42 feet; how-ever, portions of the tree had been removed fromthe site. This means that while it is difficult todetermine the exact height of the line contact, themeasured height is a minimum and the actual con-tact was likely 3 to 4 feet higher than estimatedhere. Burn marks were observed 35 feet 8 inchesup the tree, and the crown of this tree was at least 6feet taller than the observed burn marks. The treeshowed evidence of fault current damage.23
When the Harding-Chamberlin line locked out,the loss of this 345-kV path caused the remainingthree southern 345-kV lines into Cleveland to pickup more load, with Hanna-Juniper picking upthe most. The Harding-Chamberlin outage alsocaused more power to flow through the underly-ing 138-kV system.
MISO did not discover that Har-ding-Chamberlin had trippeduntil after the blackout, whenMISO reviewed the breakeroperation log that evening. FE
indicates that it discovered the line was out whileinvestigating system conditions in responseMISO’s call at 15:36 EDT, when MISO told FE thatMISO’s flowgate monitoring tool showed a Star-Juniper line overload following a contingency lossof Hanna-Juniper;24 however, the investigationteam has found no evidence within the controlroom logs or transcripts to show that FE knew ofthe Harding-Chamberlin line failure until after theblackout.
Harding-Chamberlin was not oneof the flowgates that MISO moni-tored as a key transmission loca-tion, so the reliability coordinator
was unaware when FE’s first 345-kV line failed.Although MISO received SCADA input of the
line’s status change, this was presented to MISOoperators as breaker status changes rather than aline failure. Because their EMS system topologyprocessor had not yet been linked to recognize linefailures, it did not connect the breaker informationto the loss of a transmission line. Thus, MISO’soperators did not recognize the Harding-Chamberlin trip as a significant contingency eventand could not advise FE regarding the event or itsconsequences. Further, without its state estimatorand associated contingency analyses, MISO wasunable to identify potential overloads that wouldoccur due to various line or equipment outages.Accordingly, when the Harding-Chamberlin345-kV line tripped at 15:05 EDT, the state estima-tor did not produce results and could not predictan overload if the Hanna-Juniper 345-kV line wereto fail.25
3C) FE’s Hanna-Juniper 345-kV Line Tripped:15:32 EDT
At 15:32:03 EDT the Hanna-Juniper line (Figure 4.9) trippedand locked out. A tree-trimmingcrew was working nearby andobserved the tree/line contact.
The tree contact occurred on the South phase,which is lower than the center phase due toconstruction design. Although little evidence re-mained of the tree during the field team’s visit inOctober, the team observed a tree stump 14 inchesin diameter at its ground line and talked to an indi-vidual who witnessed the contact on August 14.26
FE provided photographs that clearly indicate thatthe tree was of excessive height. Surrounding treeswere 18 inches in diameter at ground line and 60feet in height (not near lines). Other sites at thislocation had numerous (at least 20) trees in thisright-of-way.
36 � U.S.-Canada Power System Outage Task Force � Causes of the August 14th Blackout �
Figure 4.8. Harding-Chamberlin 345-kV Line
Cause 3:InadequateRC DiagnosticSupport
Cause 1:InadequateSituationalAwareness
Cause 2:InadequateTreeTrimming
Cause 2:InadequateTreeTrimming

� U.S.-Canada Power System Outage Task Force � Causes of the August 14th Blackout � 37
Why Did So Many Tree-to-Line Contacts Happen on August 14?
Tree-to-line contacts and resulting transmissionoutages are not unusual in the summer acrossmuch of North America. The phenomenonoccurs because of a combination of events occur-ring particularly in late summer:
� Most tree growth occurs during the spring andsummer months, so the later in the summerthe taller the tree and the greater its potentialto contact a nearby transmission line.
� As temperatures increase, customers use moreair conditioning and load levels increase.Higher load levels increase flows on the trans-mission system, causing greater demands forboth active power (MW) and reactive power(MVAr). Higher flow on a transmission linecauses the line to heat up, and the hot line sagslower because the hot conductor metalexpands. Most emergency line ratings are setto limit conductors’ internal temperatures tono more than 100 degrees Celsius (212 degreesFahrenheit).
� As temperatures increase, ambient air temper-atures provide less cooling for loaded trans-mission lines.
� Wind flows cool transmission lines by increas-ing the airflow of moving air across the line.On August 14 wind speeds at the OhioAkron-Fulton airport averaged 5 knots ataround 14:00 EDT, but by 15:00 EDT windspeeds had fallen to 2 knots (the wind speedcommonly assumed in conductor design) orlower. With lower winds, the lines sagged fur-ther and closer to any tree limbs near the lines.
This combination of events on August 14 acrossmuch of Ohio and Indiana caused transmissionlines to heat and sag. If a tree had grown into apower line’s designed clearance area, then atree/line contact was more likely, though notinevitable. An outage on one line would increasepower flows on related lines, causing them to beloaded higher, heat further, and sag lower.
Figure 4.9. Hanna-Juniper 345-kV Line Figure 4.10. Cause of the Hanna-Juniper Line Loss
This August 14 photo shows the tree that caused the loss ofthe Hanna-Juniper line (tallest tree in photo). Other 345-kVconductors and shield wires can be seen in the background.Photo by Nelson Tree.

Hanna-Juniper was loaded at 87.5% of its normaland emergency rating when it tripped. With thisline open, almost 1,000 MVA had to find a newpath to reach its load in Cleveland. Loading on theremaining two 345-kV lines increased, withStar-Juniper taking the bulk of the power. Thiscaused Star-South Canton’s loading to rise aboveits normal but within its emergency rating andpushed more power onto the 138-kV system.Flows west into Michigan decreased slightly andvoltages declined somewhat in the Cleveland area.
3D) AEP and PJM Begin Arranging a TLR forStar-South Canton: 15:35 EDT
Because its alarm system was notworking, FE was not aware of theHarding-Chamberlin or Hanna-Juniper line trips. However, onceMISO manually updated the state
estimator model for the Stuart-Atlanta 345-kV lineoutage, the software successfully completed astate estimation and contingency analysis at 15:41
EDT. But this left a 36 minute period, from 15:05EDT to 15:41 EDT, during which MISO did notrecognize the consequences of the Hanna-Juniperloss, and FE operators knew neither of the line’sloss nor its consequences. PJM and AEP recog-nized the overload on Star-South Canton, but hadnot expected it because their earlier contingencyanalysis did not examine enough lines within theFE system to foresee this result of the Hanna-Juniper contingency on top of the Harding-Chamberlin outage.
After AEP recognized the Star-South Canton overload, at 15:35EDT AEP asked PJM to begindeveloping a 350-MW TLR to mit-igate it. The TLR was to relieve
the actual overload above normal rating thenoccurring on Star-South Canton, and prevent anoverload above emergency rating on that line if theSammis-Star line were to fail. But when theybegan working on the TLR, neither AEP nor PJMrealized that the Hanna-Juniper 345-kV line had
38 � U.S.-Canada Power System Outage Task Force � Causes of the August 14th Blackout �
Cause 3:InadequateRC DiagnosticSupport
Cause 3:InadequateRC DiagnosticSupport
Handling Emergencies by Shedding Load and Arranging TLRs
Transmission loading problems. Problems suchas contingent overloads or contingent breachesof stability limits are typically handled by arrang-ing Transmission Loading Relief (TLR) measures,which in most cases take effect as a schedulechange 30 to 60 minutes after they are issued.Apart from a TLR level 6, TLRs are intended as atool to prevent the system from being operated inan unreliable state,a and are not applicable inreal-time emergency situations because it takestoo long to implement reductions. Actual over-loads and violations of stability limits need to behandled immediately under TLR level 6 byredispatching generation, system reconfigura-tion or tripping load. The dispatchers at FE,MISO and other control areas or reliability coor-dinators have authority—and under NERC oper-ating policies, responsibility—to take suchaction, but the occasion to do so is relatively rare.
Lesser TLRs reduce scheduled transactions—non-firm first, then pro-rata between firm trans-actions, including native load. When pre-contingent conditions are not solved with TLRlevels 3 and 5, or conditions reach actual over-loading or surpass stability limits, operators mustuse emergency generation redispatch and/or
load-shedding under TLR level 6 to return to asecure state. After a secure state is reached,TLR level 3 and/or 5 can be initiated to relievethe emergency generation redispatch or load-shedding activation.
System operators and reliability coordinators, byNERC policy, have the responsibility and theauthority to take actions up to and includingemergency generation redispatch and sheddingfirm load to preserve system security. On August14, because they either did not know or under-stand enough about system conditions at thetime, system operators at FE, MISO, PJM, or AEPdid not call for emergency actions.
Use of automatic procedures in voltage-relatedemergencies. There are few automatic safety netsin place in northern Ohio except for under-frequency load-shedding in some locations. Insome utility systems in the U.S. Northeast,Ontario, and parts of the Western Interconnec-tion, special protection systems or remedialaction schemes, such as under-voltage load-shedding are used to shed load under definedsevere contingency conditions similar to thosethat occurred in northern Ohio on August 14.
a“Northern MAPP/Northwestern Ontario Disturbance-June 25, 1998,” NERC 1998 Disturbance Report, page 17.

already tripped at 15:32 EDT, further degradingsystem conditions. Since the great majority ofTLRs are for cuts of 25 to 50 MW, a 350-MW TLRrequest was highly unusual and operators wereattempting to confirm why so much relief wassuddenly required before implementing therequested TLR. Less than ten minutes elapsedbetween the loss of Hanna-Juniper, the overloadabove the normal limits of Star-South Canton, andthe Star-South Canton trip and lock-out.
The primary tool MISO uses forassessing reliability on keyflowgates (specified groupings oftransmission lines or equipmentthat sometimes have less transfer
capability than desired) is the flowgate monitoringtool. After the Harding-Chamberlin 345-kV lineoutage at 15:05 EDT, the flowgate monitoring toolproduced incorrect (obsolete) results, because theoutage was not reflected in the model. As a result,the tool assumed that Harding-Chamberlin wasstill available and did not predict an overload forloss of the Hanna-Juniper 345-kV line. WhenHanna-Juniper tripped at 15:32 EDT, the resultingoverload was detected by MISO’s SCADA and setoff alarms to MISO’s system operators, who thenphoned FE about it.27 Because both MISO’s stateestimator, which was still in a developmentalstate, and its flowgate monitoring tool were notworking properly, MISO’s ability to recognize FE’sevolving contingency situation was impaired.
3F) Loss of the Star-South Canton 345-kV Line:15:41 EDT
The Star-South Canton line (Figure 4.11) crossesthe boundary between FE and AEP, and the line isjointly owned—each company owns the portionof the line within its respective territory and man-ages the right-of-way there. The Star-South Can-ton line tripped and reclosed three times on theafternoon of August 14, first at 14:27:15 EDT(reclosing at both ends), then at 15:38:48 EDT, andat 15:41:35 EDT it tripped and locked out at theStar substation. A short-circuit to ground occurredin each case. This line failed with power flow at93.2% of its emergency rating.
The investigation field teaminspected the right of way in thelocation indicated by the relaydigital fault recorders, in the FEportion of the line. They found
debris from trees and vegetation that had beenfelled. At this location the conductor heightwas 44 feet 9 inches. The identifiable tree remains
measured 30 feet in height, although the teamcould not verify the location of the stump, nor findall sections of the tree. A nearby cluster of treesshowed significant fault damage, includingcharred limbs and de-barking from fault current.Further, topsoil in the area of the tree trunk wasdisturbed, discolored and broken up, a commonindication of a higher magnitude fault or multiplefaults. Analysis of another stump showed that afourteen year-old tree had recently been removedfrom the middle of the right-of-way.28
After the Star-South Canton line was lost, flowsincreased greatly on the 138-kV system towardCleveland and area voltage levels began to degradeon the 138-kV and 69-kV system. At the sametime, power flows increased on the Sammis-Star345-kV line due to the 138-kV line trips—the onlyremaining paths into Cleveland from the south.
FE’s operators were not aware thatthe system was operating outsidefirst contingency limits after theHarding-Chamberlin trip (for thepossible loss of Hanna-Juniper),
because they did not conduct a contingency analy-sis.29 The investigation team has not determinedwhether the system status information used byFE’s state estimator and contingency analysismodel was being accurately updated.
System impacts of the 345-kV failures. The inves-tigation modeling team examined the impact ofthe loss of the Harding-Chamberlin, Hanna-Juniper and Star-South Canton 345-kV lines. Afterconducting a variety of scenario analyses, theyconcluded that had either Hanna-Juniper or Har-ding-Chamberlin been restored and remained in-service, the Star-South Canton line might not havetripped and locked out at 15:42 EDT.
� U.S.-Canada Power System Outage Task Force � Causes of the August 14th Blackout � 39
Cause 3:InadequateRC DiagnosticSupport
Cause 2:InadequateTreeTrimming
Figure 4.11. Star-South Canton 345-kV Line
Cause 1:InadequateSituationalAwareness

According to extensive investigation team model-ing, there were no contingency limit violations asof 15:05 EDT prior to the loss of the Chamberlin-Harding 345-kV line. Figure 4.12 shows theline loadings estimated by investigation teammodeling as the 345-kV lines in northeast Ohiobegan to trip. Showing line loadings on the 345-kVlines as a percent of normal rating, it tracks howthe loading on each line increased as each subse-quent 345-kV and 138-kV line tripped out of ser-vice between 15:05 EDT (Harding-Chamberlin,the first line above to stair-step down) and 16:06EDT (Dale-West Canton). As the graph shows,none of the 345- or 138-kV lines exceeded theirnormal ratings until after the combined trips ofHarding-Chamberlin and Hanna-Juniper. But im-mediately after the second line was lost, Star-South Canton’s loading jumped from an estimated82% of normal to 120% of normal (which was stillbelow its emergency rating) and remained at the120% level for 10 minutes before tripping out. Tothe right, the graph shows the effects of the 138-kVline failures (discussed in the next phase) uponthe two remaining 345-kV lines—i.e., Sammis-Star’s loading increased steadily above 100% witheach succeeding 138-kV line lost.
Following the loss of the Harding-Chamberlin345-kV line at 15:05 EDT, contingency limit viola-tions existed for:
� The Star-Juniper 345-kV line, whose loadingswould exceed emergency limits if the Hanna-Juniper 345-kV line were lost; and
� The Hanna-Juniper and Harding-Juniper345-kV lines, whose loadings would exceedemergency limits if the Perry generation unit(1,255 MW) were lost.
Operationally, once FE’s system entered an N-1contingency violation state, any facility lossbeyond that pushed them farther into violationand into a more unreliable state. After loss of theHarding-Chamberlin line, to avoid violating NERCcriteria, FE needed to reduce loading on thesethree lines within 30 minutes such that no singlecontingency would violate an emergency limit;that is, to restore the system to a reliable operatingmode.
Phone Calls into the FE Control Room
Beginning no earlier than 14:14EDT when their EMS alarmsfailed, and until at least 15:42EDT when they began to recog-nize their situation, FE operators
did not understand how much of their system wasbeing lost, and did not realize the degree to whichtheir perception of their system was in error ver-sus true system conditions, despite receivingclues via phone calls from AEP, PJM and MISO,and customers. The FE operators were not awareof line outages that occurred after the trip ofEastlake 5 at 13:31 EDT until approximately 15:45EDT, although they were beginning to get externalinput describing aspects of the system’s weaken-ing condition. Since FE’s operators were not awareand did not recognize events as they were occur-ring, they took no actions to return the system to areliable state.
A brief description follows of some of the calls FEoperators received concerning system problemsand their failure to recognize that the problem wason their system. For ease of presentation, this setof calls extends past the time of the 345-kV linetrips into the time covered in the next phase, whenthe 138-kV system collapsed.
Following the first trip of the Star-South Canton345-kV line at 14:27 EDT, AEP called FE at 14:32EDT to discuss the trip and reclose of the line. AEPwas aware of breaker operations at their end(South Canton) and asked about operations at FE’sStar end. FE indicated they had seen nothing attheir end of the line but AEP reiterated that the tripoccurred at 14:27 EDT and that the South Cantonbreakers had reclosed successfully.30 There wasan internal FE conversation about the AEP call at14:51 EDT, expressing concern that they had notseen any indication of an operation, but lackingevidence within their control room, the FE opera-tors did not pursue the issue.
At 15:19 EDT, AEP called FE back to confirm thatthe Star-South Canton trip had occurred and that
40 � U.S.-Canada Power System Outage Task Force � Causes of the August 14th Blackout �
Figure 4.12. Cumulative Effects of SequentialOutages on Remaining 345-kV Lines
Cause 1:InadequateSituationalAwareness

AEP had a confirmed relay operation from the site.FE’s operator restated that because they hadreceived no trouble or alarms, they saw no prob-lem. An AEP technician at the South Canton sub-station verified the trip. At 15:20 EDT, AEPdecided to treat the South Canton digital faultrecorder and relay target information as a “fluke,”and checked the carrier relays to determine whatthe problem might be.31
At 15:35 EDT the FE control center received a callfrom the Mansfield 2 plant operator concernedabout generator fault recorder triggers and excita-tion voltage spikes with an alarm for over-excitation, and a dispatcher called reporting a“bump” on their system. Soon after this call, FE’sReading, Pennsylvania control center calledreporting that fault recorders in the Erie west andsouth areas had activated, wondering if somethinghad happened in the Ashtabula-Perry area. ThePerry nuclear plant operator called to report a“spike” on the unit’s main transformer. When hewent to look at the metering it was “still bouncingaround pretty good. I’ve got it relay tripped uphere … so I know something ain’t right.”32
Beginning at this time, the FE operators began tothink that something was wrong, but did not rec-ognize that it was on their system. “It’s got to be indistribution, or something like that, or somebodyelse’s problem … but I’m not showing any-thing.”33 Unlike many other transmission gridcontrol rooms, FE’s control center does not have amap board (which shows schematically all majorlines and plants in the control area on the wall infront of the operators), which might have shownthe location of significant line and facility outageswithin the control area.
At 15:36 EDT, MISO contacted FE regarding thepost-contingency overload on Star-Juniper for theloss of the Hanna-Juniper 345-kV line.34
At 15:42 EDT, FE’s western transmission operatorinformed FE’s IT staff that the EMS system func-tionality was compromised. “Nothing seems to beupdating on the computers…. We’ve had peoplecalling and reporting trips and nothing seems to beupdating in the event summary… I think we’ve gotsomething seriously sick.” This is the first evi-dence that a member of FE’s control room staff rec-ognized any aspect of their degraded EMS system.There is no indication that he informed any of theother operators at this moment. However, FE’s ITstaff discussed the subsequent EMS alarm correc-tive action with some control room staff shortlythereafter.
Also at 15:42 EDT, the Perry plant operator calledback with more evidence of problems. “I’m stillgetting a lot of voltage spikes and swings on thegenerator…. I don’t know how much longer we’regoing to survive.”35
At 15:45 EDT, the tree trimming crew reportedthat they had witnessed a tree-caused fault on theEastlake-Juniper 345-kV line; however, the actualfault was on the Hanna-Juniper 345-kV line in thesame vicinity. This information added to the con-fusion in the FE control room, because the opera-tor had indication of flow on the Eastlake-Juniperline.36
After the Star-South Canton 345-kV line tripped athird time and locked out at 15:42 EDT, AEP calledFE at 15: 45 EDT to discuss and inform them thatthey had additional lines that showed overload.FE recognized then that the Star breakers had trip-ped and remained open.37
At 15:46 EDT the Perry plant operator called theFE control room a third time to say that the unitwas close to tripping off: “It’s not looking good….We ain’t going to be here much longer and you’regoing to have a bigger problem.”38
At 15:48 EDT, an FE transmission operator sentstaff to man the Star substation, and then at 15:50EDT, requested staffing at the regions, beginningwith Beaver, then East Springfield.39
At 15:48 EDT, PJM called MISO to report theStar-South Canton trip, but the two reliabilitycoordinators’ measures of the resulting line flowson FE’s Sammis-Star 345-kV line did not match,causing them to wonder whether the Star-SouthCanton 345-kV line had returned to service.40
At 15:56 EDT, because PJM was still concernedabout the impact of the Star-South Canton trip,PJM called FE to report that Star-South Cantonhad tripped and that PJM thought FE’sSammis-Star line was in actual emergency limitoverload. FE could not confirm this overload. FEinformed PJM that Hanna-Juniper was also outservice. FE believed that the problems existedbeyond their system. “AEP must have lost somemajor stuff.”41
Emergency Action
For FirstEnergy, as with many utilities, emergencyawareness is often focused on energy shortages.Utilities have plans to reduce loads under thesecircumstances to increasingly greater degrees.Tools include calling for contracted customer loadreductions, then public appeals, voltage reduc-tions, and finally shedding system load by cutting
� U.S.-Canada Power System Outage Task Force � Causes of the August 14th Blackout � 41

off interruptible and firm customers. FE has a planfor this that is updated yearly. While they can triploads quickly where there is SCADA control ofload breakers (although FE has few of these), froman energy point of view, the intent is to be able toregularly rotate what loads are not being served,which requires calling personnel out to switch thevarious groupings in and out. This event was not,however, a capacity or energy emergency or sys-tem instability, but an emergency due to transmis-sion line overloads.
To handle an emergency effectively a dispatchermust first identify the emergency situation andthen determine effective action. AEP identifiedpotential contingency overloads at 15:36 EDT andcalled PJM even as Star-South Canton, one of theAEP/FE lines they were discussing, tripped andpushed FE’s Sammis-Star 345-kV line to its emer-gency rating. Since that event was the opposite ofthe focus of their discussion about a TLR for a pos-sible loss of Sammis-Star that would overloadStar-South Canton, they recognized that a seriousproblem had arisen on the system for which theydid not have a ready solution.42 Later, around15:50 EDT, their conversation reflected emer-gency conditions (138-kV lines were tripping andseveral other lines overloaded) but they still foundno practical way to mitigate these overloads acrossutility and reliability coordinator boundaries.
At the control area level, FE remained unaware ofthe precarious condition their system was in, withkey lines out of service, degrading voltages, andsevere overloads on their remaining lines.43 Tran-scripts show that FE operators were aware of fall-ing voltages and customer problems after loss ofthe Hanna-Juniper 345-kV line (at 15:32 EDT).They called out personnel to staff substationsbecause they did not think they could see themwith their data gathering tools. They were alsotalking to customers. But there is no indicationthat FE’s operators clearly identified their situa-tion as a possible emergency until around 15:45EDT when the shift supervisor informed his man-ager that it looked as if they were losing the sys-tem; even then, although FE had grasped that itssystem was in trouble, it never officially declaredthat it was an emergency condition and that emer-gency or extraordinary action was needed.
FE’s internal control room procedures and proto-cols did not prepare them adequately to identifyand react to the August 14 emergency. Through-out the afternoon of August 14 there were manyclues that FE had lost both its critical monitoringalarm functionality and that its transmission
system’s reliability was becoming progressivelymore compromised. However, FE did not fullypiece these clues together until after it had alreadylost critical elements of its transmission systemand only minutes before subsequent trippingstriggered the cascade phase of the blackout. Theclues to a compromised EMS alarm system andtransmission system came from a number ofreports from various parties external to the FEtransmission control room. Calls from FE custom-ers, generators, AEP, MISO and PJM came into theFE control room. In spite of these clues, because ofa number of related factors, FE failed to identifythe emergency that it faced.
The most critical factor delaying the assessmentand synthesis of the clues was a lack of informa-tion sharing between the FE system operators. Ininterviews with the FE operators and analysis ofphone transcripts, it is evident that rarely wereany of the critical clues shared with fellow opera-tors. This lack of information sharing can beattributed to:
1. Physical separation of operators (the reliabilityoperator responsible for voltage schedules isacross the hall from the transmissionoperators).
2. The lack of a shared electronic log (visible toall), as compared to FE’s practice of separatehand-written logs.44
3. Lack of systematic procedures to brief incomingstaff at shift change times.
4. Infrequent training of operators in emergencyscenarios, identification and resolution of baddata, and the importance of sharing key infor-mation throughout the control room.
FE has specific written proce-dures and plans for dealing withresource deficiencies, voltagedepressions, and overloads, andthese include instructions to
adjust generators and trip firm loads. After the lossof the Star-South Canton line, voltages were belowlimits, and there were severe line overloads. ButFE did not follow any of these procedures onAugust 14, because FE did not know for most ofthat time that its system might need suchtreatment.
MISO was hindered because itlacked clear visibility, responsi-bility, authority, and ability totake the actions needed in this cir-cumstance. MISO had interpre-
tive and operational tools and a large amount of
42 � U.S.-Canada Power System Outage Task Force � Causes of the August 14th Blackout �
Cause 1:InadequateSituationalAwareness
Cause 3:InadequateRC DiagnosticSupport

system data, but had a limited view of FE’s system.In MISO’s function as FE’s reliability coordinator,its primary task was to initiate and implementTLRs, recognize and solve congestion problems inless dramatic reliability circumstances with lon-ger solution time periods than those which existedon August 14.
What training did the operators and reliabilitycoordinators have for recognizing and respondingto emergencies? FE relied upon on-the-job experi-ence as training for its operators in handling theroutine business of a normal day but had neverexperienced a major disturbance and had no simu-lator training or formal preparation for recogniz-ing and responding to emergencies. Although allaffected FE and MISO operators were NERC certi-fied, neither group had significant training, docu-mentation, or actual experience for how to handlean emergency of this type and magnitude.
Throughout August 14, most major elements ofFE’s EMS were working properly. The system wasautomatically transferring accurate real-timeinformation about FE’s system conditions to com-puters at AEP, MISO, and PJM. FE’s operator didnot believe the transmission line failures reportedby AEP and MISO were real until 15:42 EDT, afterFE conversations with the AEP and MISO controlrooms and calls from FE IT staff to report the fail-ure of their alarms. At that point in time, FE opera-tors began to think that their system might be injeopardy—but they did not act to restore any of thelost transmission lines, clearly alert their reliabil-ity coordinator or neighbors about their situation,or take other possible remedial measures (such asload-shedding) to stabilize their system.
Phase 4:138-kV Transmission SystemCollapse in Northern Ohio:
15:39 to 16:08 EDT
Overview of This Phase
As each of FE’s 345-kV lines in the Cleveland areatripped out, it increased loading and decreasedvoltage on the underlying 138-kV system servingCleveland and Akron, pushing those lines intooverload. Starting at 15:39 EDT, the first of aneventual sixteen 138-kV lines began to fail. Figure4.14 shows how actual voltages declined at key138-kV buses as the 345- and 138-kV lines werelost. As these lines failed, the voltage drops causeda number of large industrial customers with volt-age-sensitive equipment to go off-line automati-cally to protect their operations. As the 138-kVlines opened, they blacked out customers in
� U.S.-Canada Power System Outage Task Force � Causes of the August 14th Blackout � 43
Figure 4.13. Timeline Phase 4
Figure 4.14. Voltages on FirstEnergy’s 138-kVLines: Impacts of Line Trips

Akron and the areas west and south of the city,ultimately dropping about 600 MW of load.
Key Phase 4 Events
Between 15:39 EDT and 15:58:47 EDT seven138-kV lines tripped:
4A) 15:39:17 EDT: Pleasant Valley-West Akron138-kV line tripped and reclosed at both ends.
15:42:05 EDT: Pleasant Valley-West Akron138-kV West line tripped and reclosed.
15:44:40 EDT: Pleasant Valley-West Akron138-kV West line tripped and locked out.
4B) 15:42:49 EDT: Canton Central-Cloverdale138-kV line tripped and reclosed.
15:45:39 EDT: Canton Central-Cloverdale138-kV line tripped and locked out.
4C) 15:42:53 EDT: Cloverdale-Torrey 138-kV linetripped.
4D) 15:44:12 EDT: East Lima-New Liberty 138-kVline tripped.
4E) 15:44:32 EDT: Babb-West Akron 138-kV lineand locked out.
4F) 15:51:41 EDT: East Lima-N. Findlay 138-kVline tripped and reclosed at East Lima endonly.
4G) 15:58:47 EDT: Chamberlin-West Akron 138-kV line tripped.
Note: 15:51:41 EDT: Fostoria Central-N.Findlay 138-kV line tripped and reclosed, butnever locked out.
At 15:59:00 EDT, the loss of the West Akron buscaused another five 138-kV lines to trip:
4H) 15:59:00 EDT: West Akron 138-kV bus trip-ped, and cleared bus section circuit breakersat West Akron 138 kV.
4I) 15:59:00 EDT: West Akron-Aetna 138-kV lineopened.
4J) 15:59:00 EDT: Barberton 138-kV line openedat West Akron end only. West Akron-B18138-kV tie breaker opened, affecting WestAkron 138/12-kV transformers #3, 4 and 5 fedfrom Barberton.
4K) 15:59:00 EDT: West Akron-Granger-Stoney-Brunswick-West Medina opened.
4L) 15:59:00 EDT: West Akron-Pleasant Valley138-kV East line (Q-22) opened.
4M) 15:59:00 EDT: West Akron-Rosemont-Pine-Wadsworth 138-kV line opened.
From 16:00 EDT to 16:08:59 EDT, four 138-kVlines tripped, and the Sammis-Star 345-kV linetripped on overload:
4N) 16:05:55 EDT: Dale-West Canton 138-kV linetripped at both ends, reclosed at West Cantononly
4O) 16:05:57 EDT: Sammis-Star 345-kV linetripped
4P) 16:06:02 EDT: Star-Urban 138-kV line tripped
4Q) 16:06:09 EDT: Richland-Ridgeville-Napo-leon-Stryker 138-kV line tripped and lockedout at all terminals
4R) 16:08:58 EDT: Ohio Central-Wooster 138-kVline tripped
Note: 16:08:55 EDT: East Wooster-South Can-ton 138-kV line tripped, but successful auto-matic reclosing restored this line.
4A-G) Pleasant Valley to Chamberlin-WestAkron Line Outages
From 15:39 EDT to 15:58:47 EDT, seven 138-kVlines in northern Ohio tripped and locked out. At15:45:41 EDT, Canton Central-Tidd 345-kV linetripped and reclosed at 15:46:29 EDT becauseCanton Central 345/138-kV CB “A1” operatedmultiple times, causing a low air pressure problemthat inhibited circuit breaker tripping. This eventforced the Canton Central 345/138-kV transform-ers to disconnect and remain out of service, fur-ther weakening the Canton-Akron area 138-kVtransmission system. At 15:58:47 EDT theChamberlin-West Akron 138-kV line tripped.
4H-M) West Akron Transformer CircuitBreaker Failure and Line Outages
At 15:59 EDT FE’s West Akron 138-kV bus trippeddue to a circuit breaker failure on West Akrontransformer #1. This caused the five remaining138-kV lines connected to the West Akronsubstation to open. The West Akron 138/12-kVtransformers remained connected to the Barber-ton-West Akron 138-kV line, but power flow toWest Akron 138/69-kV transformer #1 wasinterrupted.
4N-O) Dale-West Canton 138-kV andSammis-Star 345-kV Lines Tripped
After the Cloverdale-Torrey line failed at 15:42EDT, Dale-West Canton was the most heavilyloaded line on FE’s system. It held on, althoughheavily overloaded to 160 and 180% of normal
44 � U.S.-Canada Power System Outage Task Force � Causes of the August 14th Blackout �

ratings, until tripping at 16:05:55 EDT. The loss ofthis line had a significant effect on the area, andvoltages dropped significantly. More powershifted back to the remaining 345-kV network,pushing Sammis-Star’s loading above 120% of rat-ing. Two seconds later, at 16:05:57 EDT, Sammis-Star tripped out. Unlike the previous three 345-kVlines, which tripped on short circuits to grounddue to tree contacts, Sammis-Star tripped becauseits protective relays saw low apparent impedance(depressed voltage divided by abnormally highline current)—i.e., the relay reacted as if the highflow was due to a short circuit. Although threemore 138-kV lines dropped quickly in Ohio fol-lowing the Sammis-Star trip, loss of the Sammis-Star line marked the turning point at which sys-tem problems in northeast Ohio initiated a cascad-ing blackout across the northeast United Statesand Ontario.45
Losing the 138-kV System
The tripping of 138-kV transmission lines thatbegan at 15:39 EDT occurred because the lossof the combination of the Harding-Chamberlin,Hanna-Juniper and Star-South Canton 345-kVlines overloaded the 138-kV system with electric-ity flowing north toward the Akron and Clevelandloads. Modeling indicates that the return of eitherthe Hanna-Juniper or Chamberlin-Harding 345-kVlines would have diminished, but not alleviated,all of the 138-kV overloads. In theory, the return ofboth lines would have restored all the 138 lines towithin their emergency ratings.
However, all three 345-kV lineshad already been compromiseddue to tree contacts so it isunlikely that FE would have suc-cessfully restored either line had
they known it had tripped out, and sinceStar-South Canton had already tripped andreclosed three times it is also unlikely that anoperator knowing this would have trusted it tooperate securely under emergency conditions.While generation redispatch scenarios alonewould not have solved the overload problem,modeling indicates that shedding load in theCleveland and Akron areas may have reducedmost line loadings to within emergency range andhelped stabilize the system. However, the amountof load shedding required grew rapidly as FE’s sys-tem unraveled.
Loss of the Sammis-Star 345-kV Line
Figure 4.15, derived from investigation team mod-eling, shows how the power flows shifted across
FE’s 345- and key 138-kV northeast Ohio lines asthe line failures progressed. All lines wereloaded within normal limits after the Harding-Chamberlin lock-out, but after the Hanna-Junipertrip at 15:32, the Star-South Canton 345-kV lineand three 138-kV lines jumped above normal load-ings. After Star-South Canton locked out at 15:41EDT, five 138-kV and the Sammis-Star 345-kVlines were overloaded and Star-South Canton waswithin its emergency rating. From that point, asthe graph shows, each subsequent line lossincreased loadings on other lines, some loading towell over 150% of normal ratings before theyfailed. The Sammis-Star 345-kV line stayed in ser-vice until it tripped at 16:05:57 EDT.
Endnotes
� U.S.-Canada Power System Outage Task Force � Causes of the August 14th Blackout � 45
Cause 1:InadequateSituationalAwareness
Figure 4.15. Simulated Effect of Prior Outages on138-kV Line Loadings
1August 14, 2003 Outage Sequence of Events, U.S./CanadaPower Outage Task Force (September 12, 2003), http://www.
electricity.doe.gov/documents/1282003113351_BlackoutSummary.pdf.2DOE Site Visit to FE 10/8/2003: Steve Morgan.3DOE Site Visit to FE, September 3, 2003, Hough interview:“When asked whether the voltages seemed unusual, he saidthat some sagging would be expected on a hot day, but onAugust 14th the voltages did seem unusually low.” Spidleinterview: “The voltages for the day were not particularlybad.”4Manual of Operations, valid as of March 3, 2003, Processflowcharts: Voltage Control and Reactive Support – Plant andSystem Voltage Monitoring Under Normal Conditions.514:13:18. Channel 16 - Sammis 1. 13:15:49 / Channel 16 –West Lorain (FE Reliability Operator (RO) says, “Thanks.We’re starting to sag all over the system.”) / 13:16:44. Channel16 – Eastlake (talked to two operators) (RO says, “We got away bigger load than we thought we would have.” And “…Sowe’re starting to sag all over the system.”) / 13:20:22. Channel16 – RO to “Berger” / 13:22:07. Channel 16 – “control room”

46 � U.S.-Canada Power System Outage Task Force � Causes of the August 14th Blackout �
RO says, “We’re sagging all over the system. I need somehelp.” / 13:23:24. Channel 16 – “Control room, Tom” /13:24:38. Channel 16 – “Unit 9” / 13:26:04. Channel 16 –“Dave” / 13:28:40. Channel 16 “Troy Control”. Also generalnote in RO Dispatch Log.6Example at 13:33:40, Channel 3, FE transcripts.7Investigation Team Site Visit to MISO, Walsh and Seiduinterviews.8FE had and ran a state estimator every 30 minutes. Thisserved as a base from which to perform contingency analyses.FE’s contingency analysis tool used SCADA and EMS inputsto identify any potential overloads that could result from vari-ous line or equipment outages. FE indicated that it has experi-enced problems with the automatic contingency analysisoperation since the system was installed in 1995. As a result,FE operators or engineers ran contingency analysis manuallyrather than automatically, and were expected to do so whenthere were questions about the state of the system. Investiga-tion team interviews of FE personnel indicate that the contin-gency analysis model was likely running but not consulted atany point in the afternoon of August 14.9After the Stuart-Atlanta line tripped, Dayton Power & Lightdid not immediately provide an update of a change in equip-ment availability using a standard form that posts the statuschange in the SDX (System Data Exchange, the NERC data-base which maintains real-time information on grid equip-ment status), which relays that notice to reliabilitycoordinators and control areas. After its state estimator failedto solve properly, MISO checked the SDX to make sure thatthey had properly identified all available equipment and out-ages, but found no posting there regarding Stuart-Atlanta’soutage.10 Investigation team field visit, interviews with FE personnelon October 8-9, 2003.11 DOE Site Visit to First Energy, September 3, 2003, Inter-view with David M. Elliott.12 FE Report, “Investigation of FirstEnergy’s Energy Manage-ment System Status on August 14, 2003”, Bullet 1, Section4.2.11.13 Investigation team interviews with FE, October 8-9, 2003.14DOE Site Visit at FE, October 8-9, 2003; investigation teamwas advised that FE had discovered this effect duringpost-event investigation and testing of the EMS. FE’s report“Investigation of FirstEnergy’s Energy Management SystemStatus on August 14, 2003” also indicates that this findingwas “verified using the strip charts from 8-14-03” (page 23),not that the investigation of this item was instigated by opera-tor reports of such a failure.15 There is a conversation between a Phil and a Tom thatspeaks of “flatlining” 15:01:33. Channel 15. There is no men-tion of AGC or generation control in the DOE Site Visit inter-views with the reliability coordinator.16DOE Site Visit to FE, October 8-9, 2003, Sanicky Interview:“From his experience, it is not unusual for alarms to fail.Often times, they may be slow to update or they may die com-pletely. From his experience as a real-time operator, the factthat the alarms failed did not surprise him.” Also from samedocument, Mike McDonald interview “FE has previously had[servers] down at the same time. The big issue for them wasthat they were not receiving new alarms.”17 A “cold” reboot of the XA21 system is one in which allnodes (computers, consoles, etc.) of the system are shut downand then restarted. Alternatively, a given XA21 node can be
“warm” rebooted wherein only that node is shut down andrestarted, or restarted from a shutdown state. A cold rebootwill take significantly longer to perform than a warm one.Also during a cold reboot much more of the system is unavail-able for use by the control room operators for visibility or con-trol over the power system. Warm reboots are not uncommon,whereas cold reboots are rare. All reboots undertaken by FE’sIT EMSS support personnel on August 14 were warm reboots.18The cold reboot was done in the early morning of 15 Augustand corrected the alarm problem as hoped.19Example at 14:19, Channel l4, FE transcripts.20Example at 14:25, Channel 8, FE transcripts.21Example at 14:32, Channel 15, FE transcripts.22 Investigation team transcript, meeting on September 9,2003, comments by Mr. Steve Morgan, Vice President ElectricOperations:Mr. Morgan: The sustained outage history for these lines,2001, 2002, 2003, up until the event, Chamberlin-Hardinghad zero operations for those two-and-a-half years. AndHanna-Juniper had six operations in 2001, ranging from fourminutes to maximum of 34 minutes. Two were unknown, onewas lightning, one was a relay failure, and two were reallyrelay scheme mis-operations. They’re category other. Andtypically, that—I don’t know what this is particular to opera-tions, that typically occurs when there is a mis-operation.Star-South Canton had no operations in that same period oftime, two-and-a-half years. No sustained outages. AndSammis-Star, the line we haven’t talked about, also no sus-tained outages during that two-and-a-half year period.So is it normal? No. But 345 lines do operate, so it’s notunknown.23 “Interim Report, Utility Vegetation Management,”U.S.-Canada Joint Outage Investigation Task Force, Vegeta-tion Management Program Review, October 2003, page 7.24 Investigation team October 2, 2003, fact-finding meeting,Steve Morgan statement.25“FE MISO Findings,” page 11.26FE was conducting right-of-way vegetation maintenance ona 5-year cycle, and the tree crew at Hanna-Juniper was threespans away, clearing vegetation near the line, when the con-tact occurred on August 14. Investigation team 9/9/03 meet-ing transcript, and investigation field team discussion withthe tree-trimming crew foreman.27Based on “FE MISO Findings” document, page 11.28 “Interim Report, Utility Vegetation Management,”US-Canada Joint Outage Task Force, Vegetation ManagementProgram Review, October 2003, page 6.29Investigation team September 9, 2003 meeting transcripts,Mr. Steve Morgan, First Energy Vice President, Electric Sys-tem Operations:Mr. Benjamin: Steve, just to make sure that I’m understand-ing it correctly, you had indicated that once afterHanna-Juniper relayed out, there wasn’t really a problemwith voltage on the system until Star-S. Canton operated. Butwere the system operators aware that when Hanna-Juniperwas out, that if Star-S. Canton did trip, they would be outsideof operating limits?Mr. Morgan: I think the answer to that question would haverequired a contingency analysis to be done probably ondemand for that operation. It doesn’t appear to me that a con-tingency analysis, and certainly not a demand contingencyanalysis, could have been run in that period of time. Otherthan experience, I don’t know that they would have been able

� U.S.-Canada Power System Outage Task Force � Causes of the August 14th Blackout � 47
to answer that question. And what I know of the record rightnow is that it doesn’t appear that they ran contingency analy-sis on demand.Mr. Benjamin: Could they have done that?Mr. Morgan: Yeah, presumably they could have.Mr. Benjamin: You have all the tools to do that?Mr. Morgan: They have all the tools and all the information isthere. And if the State Estimator is successful in solving, andall the data is updated, yeah, they could have. I would say inaddition to those tools, they also have access to the planningload flow model that can actually run the same—full load ofthe model if they want to.30 Example synchronized at 14:32 (from 13:32) #18 041TDC-E2 283.wav, AEP transcripts.31 Example synchronized at 14:19 #2 020 TDC-E1 266.wav,AEP transcripts.32Example at 15:36 Channel 8, FE transcripts.33Example at 15:41:30 Channel 3, FE transcripts.34 Example synchronized at 15:36 (from 14:43) Channel 20,MISO transcripts.35Example at 15:42:49, Channel 8, FE transcripts.36Example at 15:46:00, Channel 8 FE transcripts.37Example at 15:45:18, Channel 4, FE transcripts.38Example at 15:46:00, Channel 8 FE transcripts.
39Example at 15:50:15, Channel 12 FE transcripts.40 Example synchronized at 15:48 (from 14:55), channel 22,MISO transcripts.41Example at 15:56:00, Channel 31, FE transcripts.42AEP Transcripts CAE1 8/14/2003 14:35 240.43 FE Transcripts 15:45:18 on Channel 4 and 15:56:49 onChannel 31.44 The operator logs from FE’s Ohio control center indicatethat the west desk operator knew of the alarm system failureat 14:14, but that the east desk operator first knew of thisdevelopment at 15:45. These entries may have been enteredafter the times noted, however.45The investigation team determined that FE was using a dif-ferent set of line ratings for Sammis-Star than those beingused in the MISO and PJM reliability coordinator calcula-tions or by its neighbor AEP. Specifically, FE was operatingSammis-Star assuming that the 345-kV line was rated forsummer normal use at 1,310 MVA, with a summer emer-gency limit rating of 1,310 MVA. In contrast, MISO, PJM andAEP were using a more conservative rating of 950 MVA nor-mal and 1,076 MVA emergency for this line. The facilityowner (in this case FE) is the entity which provides the linerating; when and why the ratings were changed and not com-municated to all concerned parties has not been determined.

5. The Cascade Stage of the Blackout
Chapter 4 described how uncorrected problems innorthern Ohio developed to a point that a cascad-ing blackout became inevitable. However, theTask Force’s investigation also sought to under-stand how and why the cascade spread andstopped as it did. As detailed below, the investiga-tion determined the sequence of events in the cas-cade, and in broad terms how it spread and how itstopped in each general geographic area.1
Why Does a Blackout Cascade?
Major blackouts are rare, and no two blackout sce-narios are the same. The initiating events willvary, including human actions or inactions, sys-tem topology, and load/generation balances. Otherfactors that will vary include the distance betweengenerating stations and major load centers, voltageprofiles, and the types and settings of protectiverelays in use.
Most wide-area blackouts start with short circuits(faults) on several transmission lines in short suc-cession—sometimes resulting from natural causessuch as lightning or wind or, as on August 14,resulting from inadequate tree management inright-of-way areas. A fault causes a high currentand low voltage on the line containing the fault. Aprotective relay for that line detects the high cur-rent and low voltage and quickly trips the circuitbreakers to isolate that line from the rest of thepower system.
A cascade occurs when there is a sequential trip-ping of numerous transmission lines and genera-tors in a widening geographic area. A cascade canbe triggered by just a few initiating events, as wasseen on August 14. Power swings and voltage fluc-tuations caused by these initial events can causeother lines to detect high currents and low volt-ages that appear to be faults, even when faults donot actually exist on those other lines. Generatorsare tripped off during a cascade to protect themfrom severe power and voltage swings. Relay pro-tection systems work well to protect lines and gen-erators from damage and to isolate them fromthe system under normal, steady conditions.
However, when power system operating anddesign criteria are violated as a result of severaloutages occurring at the same time, most commonprotective relays cannot distinguish between thecurrents and voltages seen in a system cascadefrom those caused by a fault. This leads to moreand more lines and generators being tripped, wid-ening the blackout area.
How Did the Cascade Evolve onAugust 14?
At 16:05:57 Eastern Daylight Time, the trip andlock-out of FE’s Sammis-Star 345 kV line set off acascade of interruptions on the high voltage sys-tem, causing electrical fluctuations and facilitytrips as within seven minutes the blackout rippledfrom the Akron area across much of the northeastUnited States and Canada. By 16:13 EDT, morethan 263 power plants (531 individual generatingunits) had been lost, and tens of millions of peoplein the United States and Canada were withoutelectric power.
Chapter 4 described the four phases that led to theinitiation of the cascade at about 16:06 EDT. After16:06 EDT, the cascade evolved in three distinctphases:
� Phase 5. The collapse of FE’s transmission sys-tem induced unplanned power surges acrossthe region. Shortly before the collapse, largeelectricity flows were moving across FE’s sys-tem from generators in the south (Tennessee,Kentucky, Missouri) to load centers in northernOhio, eastern Michigan, and Ontario. This path-way in northeastern Ohio became unavailablewith the collapse of FE’s transmission system.The electricity then took alternative paths to theload centers located along the shore of LakeErie. Power surged in from western Ohio andIndiana on one side and from Pennsylvaniathrough New York and Ontario around thenorthern side of Lake Erie. Transmission linesin these areas, however, were already heavilyloaded with normal flows, and some of thembegan to trip.
� U.S.-Canada Power System Outage Task Force � Causes of the August 14th Blackout � 49
� Phase 6. The northeast then separated from therest of the Eastern Interconnection due to theseadditional power surges. The power surgesresulting from the FE system failures causedlines in neighboring areas to see overloads thatcaused impedance relays to operate. The resultwas a wave of line trips through western Ohiothat separated AEP from FE. Then the line tripsprogressed northward into Michigan separatingwestern and eastern Michigan.
With paths cut from the west, a massive powersurge flowed from PJM into New York andOntario in a counter-clockwise flow aroundLake Erie to serve the load still connected ineastern Michigan and northern Ohio. The relayson the lines between PJM and New York sawthis massive power surge as faults and trippedthose lines. Lines in western Ontario alsobecame overloaded and tripped. The entirenortheastern United States and the province ofOntario then became a large electrical islandseparated from the rest of the Eastern Intercon-nection. This large island, which had beenimporting power prior to the cascade, quicklybecame unstable as there was not sufficient gen-eration in operation within it to meet electricitydemand. Systems to the south and west of the
split, such as PJM, AEP and others further awayremained intact and were mostly unaffected bythe outage. Once the northeast split from therest of the Eastern Interconnection, the cascadewas isolated.
Phase 7. In the final phase, the large electricalisland in the northeast was deficient in generationand unstable with large power surges and swingsin frequency and voltage. As a result, many linesand generators across the disturbance area trip-ped, breaking the area into several electricalislands. Generation and load within these smallerislands was often unbalanced, leading to furthertripping of lines and generating units until equi-librium was established in each island. Althoughmuch of the disturbance area was fully blackedout in this process, some islands were able toreach equilibrium without total loss of service. Forexample, most of New England was stabilized andgeneration and load restored to balance. Approxi-mately half of the generation and load remainedon in western New York, which has an abundanceof generation. By comparison, other areas withlarge load centers and insufficient generationnearby to meet that load collapsed into a blackoutcondition (Figure 5.1).
50 � U.S.-Canada Power System Outage Task Force � Causes of the August 14th Blackout �
Impedance Relays
The most common protective device for trans-mission lines is the impedance relay (also knownas a distance relay). It detects changes in currentsand voltages to determine the apparent imped-ance of the line. A relay is installed at each end ofa transmission line. Each relay is actually threerelays within one, with each element looking at aparticular “zone” or length of the line beingprotected.
� The first zone looks for faults on the line itself,with no intentional delay.
� The second zone is set to look at the entire lineand slightly beyond the end of the line with aslight time delay. The slight delay on the zone2 relay is useful when a fault occurs near oneend of the line. The zone 1 relay near that endoperates quickly to trip the circuit breakers onthat end. However, the zone 1 relay on the farend may not be able to tell if the fault is justinside the line or just beyond the line. In this
case, the zone 2 relay on the far end trips thebreakers after a short delay, allowing the zone1 relay near the fault to open the line on thatend first.
� The third zone is slower acting and looks forfaults well beyond the length of the line. It canbe thought of as a backup, but would generallynot be used under normal conditions.
An impedance relay operates when the apparentimpedance, as measured by the current and volt-age seen by the relay, falls within any one of theoperating zones for the appropriate amount oftime for that zone. The relay will trip and causecircuit breakers to operate and isolate the line.Typically, Zone 1 and 2 operations are used toprotect lines from faults. Zone 3 relay operations,as in the August 14 cascade, can occur if there areapparent faults caused by large swings in volt-ages and currents.

What Stopped the August 14 Blackoutfrom Cascading Further?The investigation concluded that one or more ofthe following likely determined where and whenthe cascade stopped spreading:
� The effects of a disturbance travel over powerlines and become dampened the further theyare from the initial point, much like the ripplefrom a stone thrown in a pond. Thus, the volt-age and current swings seen by relays on linesfarther away from the initial disturbance are notas severe, and at some point they are no longersufficient to induce lines to trip.
� Higher voltage lines and more densely net-worked lines, such as the 500-kV system in PJMand the 765-kV system in AEP, are better able toabsorb voltage and current swings and thusserve as a barrier to the spreading of a cascade.As seen in Phase 6, the cascade progressed intowestern Ohio and then northward throughMichigan through the areas that had the fewesttransmission lines. Because there were fewerlines, each line absorbed more of the power andvoltage surges and was more vulnerable to trip-ping. A similar effect was seen toward the eastas the lines between New York and Pennsylva-nia, and eventually northern New Jersey trip-ped. The cascade of transmission line outagesbecame isolated after the northeast UnitedStates and Ontario were completely separatedfrom the rest of the Eastern Interconnection andno more power flows were possible into thenortheast (except the DC ties from Quebec,which continued to supply power to westernNew York and New England).
� Some areas, due to line trips, were isolated fromthe portion of the grid that was experiencinginstability. Many of these areas retainedsufficient on-line generation or the capacity to
import power from other parts of the grid, unaf-fected by the surges or instability, to meetdemand. As the cascade progressed, and moregenerators and lines tripped off to protect them-selves from severe damage, and some areascompletely separated from the unstable part ofthe Eastern Interconnection. In many of theseareas there was sufficient generation to stabilizethe system. After the large island was formed inthe northeast, symptoms of frequency and volt-age collapse became evident. In some parts ofthe large area, the system was too unstable andshut itself down. In other parts, there was suffi-cient generation, coupled with fast-acting auto-matic load shedding, to stabilize frequency andvoltage. In this manned, most of New Englandremained energized. Approximately half of thegeneration and load remained on in westernNew York, aided by generation in southernOntario that split and stayed with western NewYork. There were other smaller isolated pocketsof load and generation that were able to achieveequilibrium and remain energized.
Phase 5:345-kV Transmission System
Cascade in Northern Ohio andSouth-Central Michigan
Overview of This PhaseThis initial phase of the cascade began becauseafter the loss of FE’s Sammis-Star 345-kV line andthe underlying 138-kV system, there were no largetransmission paths left from the south to supportthe significant amount of load in northern Ohio(Figure 5.2). This placed a significant load burden
� U.S.-Canada Power System Outage Task Force � Causes of the August 14th Blackout � 51
Figure 5.1. Area Affected by the Blackout
Figure 5.2. Sammis-Star 345-kV Line Trip,16:05:57 EDT

onto the transmission paths north and northwestinto Michigan, causing a steady loss of lines andpower plants.
Key Events in This Phase
5A) 16:05:57 EDT: Sammis-Star 345-kV tripped.
5B) 16:08:59 EDT: Galion-Ohio Central-Musk-ingum 345-kV line tripped.
5C) 16:09:06 EDT: East Lima-Fostoria Central345-kV line tripped, causing major powerswings through New York and Ontario intoMichigan.
5D) 16:09:08 EDT to 16:10:27 EDT: Several powerplants lost, totaling 937 MW.
5A) Sammis-Star 345-kV Tripped: 16:05:57 EDT
Sammis-Star did not trip due to a short circuit toground (as did the prior 345-kV lines that tripped).Sammis-Star tripped due to protective relay actionthat measured low apparent impedance (de-pressed voltage divided by abnormally high linecurrent) (Figure 5.3). There was no fault and nomajor power swing at the time of the trip—rather,high flows above the line’s emergency ratingtogether with depressed voltages caused the over-load to appear to the protective relays as a remotefault on the system. In effect, the relay could nolonger differentiate between a remote three-phasefault and an exceptionally high line-load condi-tion. Moreover, the reactive flows (VArs) on theline were almost ten times higher than they hadbeen earlier in the day. The relay operated as itwas designed to do.
The Sammis-Star 345-kV line trip completely sev-ered the 345-kV path into northern Ohio fromsoutheast Ohio, triggering a new, fast-pacedsequence of 345-kV transmission line trips inwhich each line trip placed a greater flow burden
on those lines remaining in service. These lineoutages left only three paths for power to flow intonorthern Ohio: (1) from northwest Pennsylvaniato northern Ohio around the south shore of LakeErie, (2) from southern Ohio, and (3) from easternMichigan and Ontario. The line interruptions sub-stantially weakened northeast Ohio as a source ofpower to eastern Michigan, making the Detroitarea more reliant on 345-kV lines west and north-west of Detroit, and from northwestern Ohio toeastern Michigan.
Transmission Lines into Northwestern OhioTripped, and Generation Tripped in SouthCentral Michigan and Northern Ohio: 16:08:59EDT to 16:10:27 EDT
5B) Galion-Ohio Central-Muskingum 345-kV linetripped: 16:08:59 EDT
5C) East Lima-Fostoria Central 345-kV linetripped, causing a large power swing fromPennsylvania and New York through Ontarioto Michigan: 16:09:05 EDT
The tripping of the Galion-Ohio Central-Mus-kingum and East Lima-Fostoria Central 345-kVtransmission lines removed the transmissionpaths from southern and western Ohio into north-ern Ohio and eastern Michigan. Northern Ohiowas connected to eastern Michigan by only three345-kV transmission lines near the southwestern
52 � U.S.-Canada Power System Outage Task Force � Causes of the August 14th Blackout �
System Oscillations
The electric power system constantly experi-ences small, stable power oscillations. Theyoccur as generator rotors accelerate or slowdown while rebalancing electrical output powerto mechanical input power, to respond tochanges in load or network conditions. Theseoscillations are observable in the power flow ontransmission lines that link generation to loador in the tie lines that link different regions ofthe system together. The greater the disturbanceto the network, the more severe these oscilla-tions can become, even to the point where flowsbecome so great that protective relays trip theconnecting lines, just as a rubber band breakswhen stretched too far. If the lines connectingdifferent electrical regions separate, each regionwill drift to its own frequency.
Oscillations that grow in amplitude are calledunstable oscillations. Oscillations are alsosometimes called power swings, and once initi-ated they flow back and forth across the systemrather like water sloshing in a rocking tub.
Figure 5.3. Sammis-Star 345-kV Line Trips
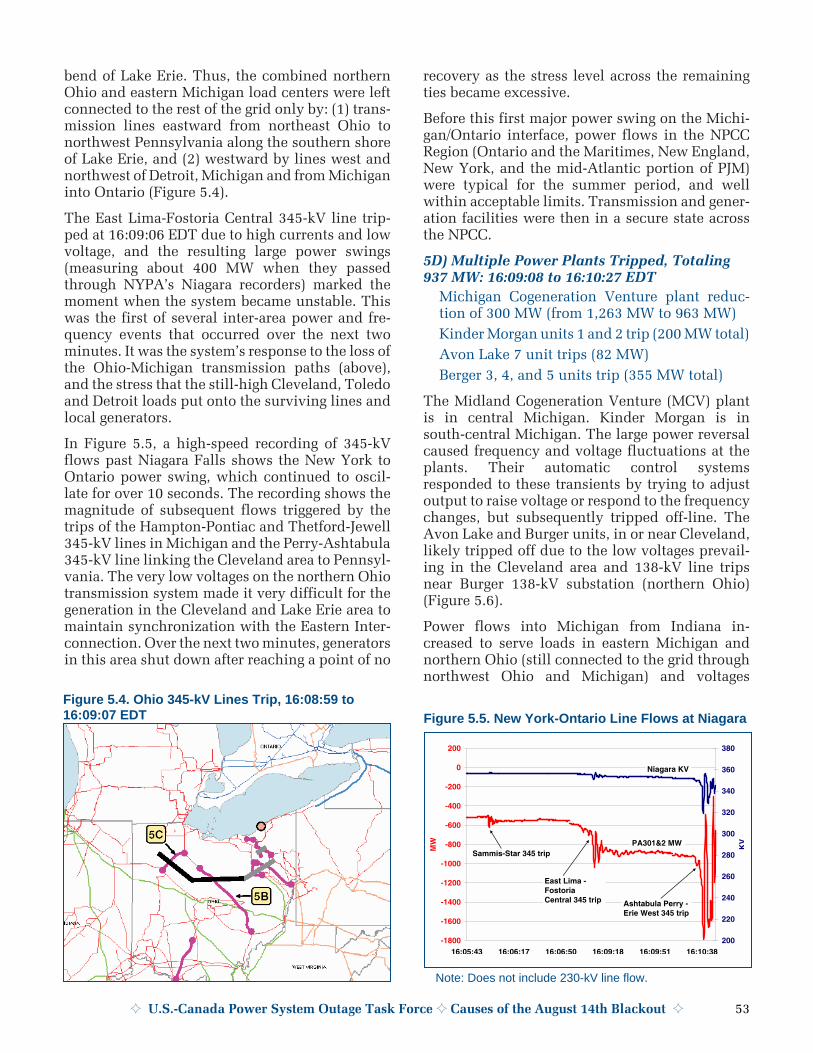
bend of Lake Erie. Thus, the combined northernOhio and eastern Michigan load centers were leftconnected to the rest of the grid only by: (1) trans-mission lines eastward from northeast Ohio tonorthwest Pennsylvania along the southern shoreof Lake Erie, and (2) westward by lines west andnorthwest of Detroit, Michigan and from Michiganinto Ontario (Figure 5.4).
The East Lima-Fostoria Central 345-kV line trip-ped at 16:09:06 EDT due to high currents and lowvoltage, and the resulting large power swings(measuring about 400 MW when they passedthrough NYPA’s Niagara recorders) marked themoment when the system became unstable. Thiswas the first of several inter-area power and fre-quency events that occurred over the next twominutes. It was the system’s response to the loss ofthe Ohio-Michigan transmission paths (above),and the stress that the still-high Cleveland, Toledoand Detroit loads put onto the surviving lines andlocal generators.
In Figure 5.5, a high-speed recording of 345-kVflows past Niagara Falls shows the New York toOntario power swing, which continued to oscil-late for over 10 seconds. The recording shows themagnitude of subsequent flows triggered by thetrips of the Hampton-Pontiac and Thetford-Jewell345-kV lines in Michigan and the Perry-Ashtabula345-kV line linking the Cleveland area to Pennsyl-vania. The very low voltages on the northern Ohiotransmission system made it very difficult for thegeneration in the Cleveland and Lake Erie area tomaintain synchronization with the Eastern Inter-connection. Over the next two minutes, generatorsin this area shut down after reaching a point of no
recovery as the stress level across the remainingties became excessive.
Before this first major power swing on the Michi-gan/Ontario interface, power flows in the NPCCRegion (Ontario and the Maritimes, New England,New York, and the mid-Atlantic portion of PJM)were typical for the summer period, and wellwithin acceptable limits. Transmission and gener-ation facilities were then in a secure state acrossthe NPCC.
5D) Multiple Power Plants Tripped, Totaling937 MW: 16:09:08 to 16:10:27 EDT
Michigan Cogeneration Venture plant reduc-tion of 300 MW (from 1,263 MW to 963 MW)
Kinder Morgan units 1 and 2 trip (200 MW total)
Avon Lake 7 unit trips (82 MW)
Berger 3, 4, and 5 units trip (355 MW total)
The Midland Cogeneration Venture (MCV) plantis in central Michigan. Kinder Morgan is insouth-central Michigan. The large power reversalcaused frequency and voltage fluctuations at theplants. Their automatic control systemsresponded to these transients by trying to adjustoutput to raise voltage or respond to the frequencychanges, but subsequently tripped off-line. TheAvon Lake and Burger units, in or near Cleveland,likely tripped off due to the low voltages prevail-ing in the Cleveland area and 138-kV line tripsnear Burger 138-kV substation (northern Ohio)(Figure 5.6).
Power flows into Michigan from Indiana in-creased to serve loads in eastern Michigan andnorthern Ohio (still connected to the grid throughnorthwest Ohio and Michigan) and voltages
� U.S.-Canada Power System Outage Task Force � Causes of the August 14th Blackout � 53
Figure 5.4. Ohio 345-kV Lines Trip, 16:08:59 to16:09:07 EDT Figure 5.5. New York-Ontario Line Flows at Niagara
Note: Does not include 230-kV line flow.

dropped from the imbalance between highloads and limited transmission and generationcapability.
Phase 6: The Full Cascade
Between 16:10:36 EDT and 16:13 EDT, thousandsof events occurred on the grid, driven by physicsand automatic equipment operations. When it wasover, much of the northeast United States and theCanadian province of Ontario was in the dark.
Key Phase 6 Events
Transmission Lines Disconnected AcrossMichigan and Northern Ohio, Generation ShutDown in Central Michigan and Northern Ohio,and Northern Ohio Separated fromPennsylvania: 16:10:36 EDT to 16:10:39 EDT
6A) Transmission and more generation trippedwithin Michigan: 16:10:36 EDT to 16:10:37EDT:
Argenta-Battlecreek 345-kV line tripped
Battlecreek-Oneida 345-kV line tripped
Argenta-Tompkins 345-kV line tripped
Sumpter Units 1, 2, 3, and 4 units tripped(300 MW near Detroit)
MCV Plant output dropped from 944 MW to109 MW.
Together, the above line outages interrupted theeast-to-west transmission paths into the Detroitarea from south-central Michigan. The Sumptergeneration units tripped in response tounder-voltage on the system. Michigan linesnorthwest of Detroit then began to trip, as notedbelow (Figure 5.7).
6B) More Michigan lines tripped: 16:10:37 EDT to16:10:38 EDT
Hampton-Pontiac 345-kV line tripped
Thetford-Jewell 345-kV line tripped
These 345-kV lines connect Detroit to the north.When they tripped out of service, it left the loadsin Detroit, Toledo, Cleveland, and their surround-ing areas served only by local generation and thelines connecting Detroit east to Ontario and Cleve-land east to northeast Pennsylvania.
6C) Cleveland separated from Pennsylvania,flows reversed and a huge power surgeflowed counter-clockwise around Lake Erie:16:10:38.6 EDT
Perry-Ashtabula-Erie West 345-kV line trip-ped: 16:10:38.6 EDT
Large power surge to serve loads in easternMichigan and northern Ohio swept acrossPennsylvania, New Jersey, and New Yorkthrough Ontario into Michigan: 16:10:38.6EDT.
Perry-Ashtabula-West Erie was the last 345-kVline connecting northern Ohio to the east. Thisline’s trip separated the Ohio 345-kV transmissionsystem from Pennsylvania. When it tripped, theload centers in eastern Michigan and northernOhio remained connected to the rest of the EasternInterconnection only at the interface between the
54 � U.S.-Canada Power System Outage Task Force � Causes of the August 14th Blackout �
Figure 5.6. Michigan and Ohio Power Plants Trip
Figure 5.7. Transmission and Generation Trips inMichigan, 16:10:36 to 16:10:37 EDT
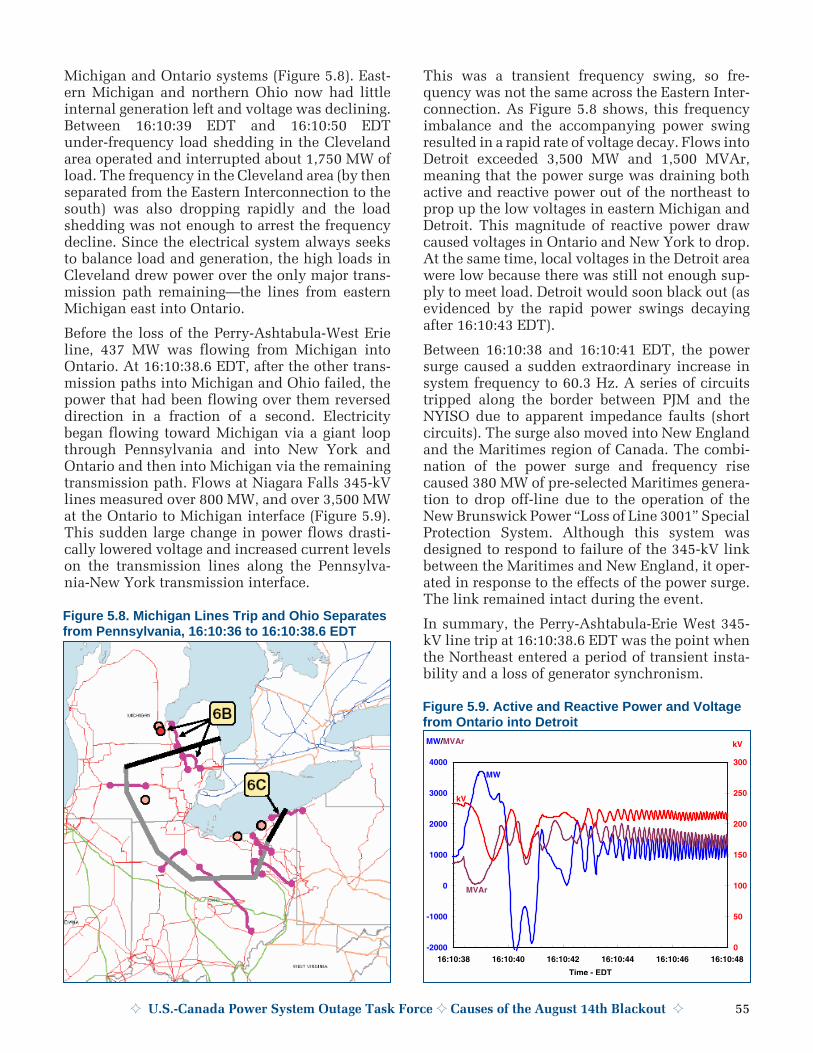
Michigan and Ontario systems (Figure 5.8). East-ern Michigan and northern Ohio now had littleinternal generation left and voltage was declining.Between 16:10:39 EDT and 16:10:50 EDTunder-frequency load shedding in the Clevelandarea operated and interrupted about 1,750 MW ofload. The frequency in the Cleveland area (by thenseparated from the Eastern Interconnection to thesouth) was also dropping rapidly and the loadshedding was not enough to arrest the frequencydecline. Since the electrical system always seeksto balance load and generation, the high loads inCleveland drew power over the only major trans-mission path remaining—the lines from easternMichigan east into Ontario.
Before the loss of the Perry-Ashtabula-West Erieline, 437 MW was flowing from Michigan intoOntario. At 16:10:38.6 EDT, after the other trans-mission paths into Michigan and Ohio failed, thepower that had been flowing over them reverseddirection in a fraction of a second. Electricitybegan flowing toward Michigan via a giant loopthrough Pennsylvania and into New York andOntario and then into Michigan via the remainingtransmission path. Flows at Niagara Falls 345-kVlines measured over 800 MW, and over 3,500 MWat the Ontario to Michigan interface (Figure 5.9).This sudden large change in power flows drasti-cally lowered voltage and increased current levelson the transmission lines along the Pennsylva-nia-New York transmission interface.
This was a transient frequency swing, so fre-quency was not the same across the Eastern Inter-connection. As Figure 5.8 shows, this frequencyimbalance and the accompanying power swingresulted in a rapid rate of voltage decay. Flows intoDetroit exceeded 3,500 MW and 1,500 MVAr,meaning that the power surge was draining bothactive and reactive power out of the northeast toprop up the low voltages in eastern Michigan andDetroit. This magnitude of reactive power drawcaused voltages in Ontario and New York to drop.At the same time, local voltages in the Detroit areawere low because there was still not enough sup-ply to meet load. Detroit would soon black out (asevidenced by the rapid power swings decayingafter 16:10:43 EDT).
Between 16:10:38 and 16:10:41 EDT, the powersurge caused a sudden extraordinary increase insystem frequency to 60.3 Hz. A series of circuitstripped along the border between PJM and theNYISO due to apparent impedance faults (shortcircuits). The surge also moved into New Englandand the Maritimes region of Canada. The combi-nation of the power surge and frequency risecaused 380 MW of pre-selected Maritimes genera-tion to drop off-line due to the operation of theNew Brunswick Power “Loss of Line 3001” SpecialProtection System. Although this system wasdesigned to respond to failure of the 345-kV linkbetween the Maritimes and New England, it oper-ated in response to the effects of the power surge.The link remained intact during the event.
In summary, the Perry-Ashtabula-Erie West 345-kV line trip at 16:10:38.6 EDT was the point whenthe Northeast entered a period of transient insta-bility and a loss of generator synchronism.
� U.S.-Canada Power System Outage Task Force � Causes of the August 14th Blackout � 55
Figure 5.8. Michigan Lines Trip and Ohio Separatesfrom Pennsylvania, 16:10:36 to 16:10:38.6 EDT
Figure 5.9. Active and Reactive Power and Voltagefrom Ontario into Detroit

Western Pennsylvania Separated from NewYork: 16:10:39 EDT to 16:10:44 EDT
6D) 16:10:39 EDT, Homer City-Watercure Road345-kV
Homer City-Stolle Road 345-kV: 16:10:39EDT
6E) South Ripley-Erie East 230-kV, and SouthRipley-Dunkirk 230-kV: 16:10:44 EDT
East Towanda-Hillside 230-kV: 16:10:44 EDT
Responding to the surge of power flowing northout of Pennsylvania through New York andOntario into Michigan, relays on these lines acti-vated on apparent impedance within a five-secondperiod and separated Pennsylvania from NewYork (Figure 5.10).
At this point, the northern part of the EasternInterconnection (including eastern Michigan andnorthern Ohio) remained connected to the rest ofthe Interconnection at only two locations: (1) in
the east through the 500-kV and 230-kV tiesbetween New York and northeast New Jersey, and(2) in the west through the long and therefore frag-ile 230-kV transmission path connecting Ontarioto Manitoba and Minnesota.
Because the demand for power in Michigan, Ohio,and Ontario was drawing on lines through NewYork and Pennsylvania, heavy power flows weremoving northward from New Jersey over the NewYork tie lines to meet those power demands, exac-erbating the power swing.
6F) Conditions in Northern Ohio and EasternMichigan Degraded Further, With MoreTransmission Lines and Power Plants Failing:16:10:39 to 16:10:46 EDT
Bayshore-Monroe 345-kV line
Allen Junction-Majestic-Monroe 345-kV line
Majestic 345-kV Substation: one terminalopened on all 345-kV lines
Perry-Ashtabula-Erie West 345-kV line terminalat Ashtabula 345/138-kV substation
Fostoria Central-Galion 345-kV line
Beaver-Davis Besse 345-kV line
Galion-Ohio Central-Muskingum 345 tripped atGalion
Six power plants, for a total of 3,097 MW of gener-ation, tripped off-line:
Lakeshore unit 18 (156 MW, near Cleveland)
Bay Shore Units 1-4 (551 MW near Toledo)
Eastlake 1, 2, and 3 units (403 MW total, nearCleveland)
Avon Lake unit 9 (580 MW, near Cleveland)
Perry 1 nuclear unit (1,223 MW, nearCleveland)
Ashtabula unit 5 (184 MW, near Cleveland)
Back in northern Ohio, the trips of the Majestic345-kV substation in southeast Michigan, the BayShore-Monroe 345-kV line, and the Ashtabula345/138-kV transformer created a Toledo andCleveland electrical “island” (Figure 5.11). Fre-quency in this large island began to fall rapidly.This led to a series of power plants in the areashutting down due to the operation of under-frequency relays, including the Bay Shore units.When the Beaver-Davis Besse 345-kV line con-necting Cleveland and Toledo tripped, it left theCleveland area completely isolated. Clevelandarea load was disconnected by automatic under-frequency load-shedding (approximately 1,300
56 � U.S.-Canada Power System Outage Task Force � Causes of the August 14th Blackout �
Figure 5.10. Western Pennsylvania Separates fromNew York, 16:10:39 EDT to 16:10:44 EDT
Figure 5.11. More Transmission Line and PowerPlant Losses

MW in the greater Cleveland area), and another434 MW of load was interrupted after the genera-tion remaining within this transmission “island”was tripped by under-frequency relays. Portionsof Toledo blacked out from automaticunder-frequency load-shedding but most of theToledo load was restored by automatic reclosingof lines such as the East Lima-Fostoria Central345-kV line and several lines at the Majestic345-kV substation.
The prolonged period of system-wide low voltagearound Detroit caused the remaining generators inthat area, then running at maximum mechanicaloutput, to begin to pull out of synchronous opera-tion with the rest of the grid. Those plants racedahead of system frequency with higher than nor-mal revolutions per second by each generator. Butwhen voltage returned to near-normal, the genera-tor could not fully pull back its rate of revolutions,and ended up producing excessive temporary out-put levels, still out of step with the system. This isevident in Figure 5.9 (above), which shows at leasttwo sets of generator “pole slips” by plants in theDetroit area between 16:10:40 EDT and 16:10:42EDT. Several large units around Detroit—BelleRiver, St. Clair, Greenwood, Monroe and Fermi—all recorded tripping for out-of-step operation dueto this cause. The Perry 1 nuclear unit, located onthe southern shore of Lake Erie near the borderwith Pennsylvania, and a number of other unitsnear Cleveland tripped off-line by unit under-frequency protection.
6G) Transmission paths disconnected in NewJersey and northern Ontario, isolating thenortheast portion of the EasternInterconnection: 16:10:42 EDT to 16:10:45 EDT
Four power plants producing 1,630 MW trippedoff-line
Greenwood unit 11 and 12 tripped (225 MWnear Detroit)
Belle River unit 1 tripped (600 MW nearDetroit)
St. Clair unit 7 tripped (221 MW, DTE unit)
Trenton Channel units 7A, 8 and 9 tripped(584 MW, DTE units)
Keith-Waterman 230-kV tripped, 16:10:43 EDT
Wawa-Marathon W21-22 230-kV line tripped,16:10:45 EDT
Branchburg-Ramapo 500-kV line tripped,16:10:45 EDT
A significant amount of the remaining generationserving Detroit tripped off-line in response tothese events. At 16:10:43 EDT, eastern Michiganwas still connected to Ontario, but the Keith-Waterman 230-kV line that forms part of thatinterface disconnected due to apparent imped-ance (Figure 5.12).
At 16:10:45 EDT, northwest Ontario separatedfrom the rest of Ontario when the Wawa-Marathon230-kV lines disconnected along the northernshore of Lake Superior. This separation left theloads in the far northwest portion of Ontario con-nected to the Manitoba and Minnesota systems,and protected them from the blackout.
The Branchburg-Ramapo 500-kV line betweenNew Jersey and New York was the last major trans-mission path remaining between the Eastern Inter-connection and the area ultimately affected by theblackout. That line disconnected at 16:10:45 EDTalong with the underlying 230 and 138-kV linesin northeast New Jersey. This left the northeastportion of New Jersey connected to New York,while Pennsylvania and the rest of New Jerseyremained connected to the rest of the EasternInterconnection.
At this point, the Eastern Interconnection wassplit into two major sections. To the north and eastof the separation point lay New York City, north-ern New Jersey, New York state, New England, theCanadian Maritime provinces, eastern Michigan,the majority of Ontario, and the Québec system.The rest of the Eastern Interconnection, to thesouth and west of the separation boundary, wasnot seriously affected by the blackout.
� U.S.-Canada Power System Outage Task Force � Causes of the August 14th Blackout � 57
Figure 5.12. Northeast Disconnects from EasternInterconnection

Phase 7:Several Electrical Islands Formed
in Northeast U.S. and Canada:16:10:46 EDT to 16:12 EDT
Overview of This Phase
New England (except southwestern Connecticut)and the Maritimes separated from New York andremained intact; New York split east to west:16:10:46 EDT to 16:11:57 EDT. Figure 5.13 illus-trates the events of this phase.
During the next 3 seconds, the islanded northernsection of the Eastern Interconnection broke apartinternally.
7A) New York-New England transmission linesdisconnected: 16:10:46 EDT to 16:10:47 EDT
7B) 16:10:49 EDT, New York transmission sys-tem split east to west
7C) The Ontario system just west of Niagara Fallsand west of St. Lawrence separated from thewestern New York island: 16:10:50 EDT
7D) Southwest Connecticut separated from NewYork City: 16:11:22 EDT
7E) Remaining transmission lines betweenOntario and eastern Michigan separated:16:11:57 EDT
Key Phase 7 Events
7A) New York-New England TransmissionLines Disconnected: 16:10:46 EDT to 16:10:49EDT
Over the period 16:10:46 EDT to 16:10:49 EDT, theNew York to New England tie lines tripped. Thepower swings continuing through the regioncaused this separation, and caused Vermont tolose approximately 70 MW of load.
The ties between New York and New England dis-connected, and most of the New England areaalong with Canada’s Maritime Provinces becamean island with generation and demand balancedclose enough that it was able to remain opera-tional. New England had been exporting close to600 MW to New York, and its system experiencedcontinuing fluctuations until it reached electricalequilibrium. Before the Maritimes-New Englandseparated from the Eastern Interconnection atapproximately 16:11 EDT, voltages becamedepressed due to the large power swings across
portions of New England. Some large customersdisconnected themselves automatically.2 How-ever, southwestern Connecticut separated fromNew England and remained tied to the New Yorksystem for about 1 minute.
Due to its geography and electrical characteristics,the Quebec system in Canada is tied to the remain-der of the Eastern Interconnection via high voltageDC links instead of AC transmission lines. Quebecwas able to survive the power surges with onlysmall impacts because the DC connectionsshielded it from the frequency swings.
7B) New York Transmission Split East-West:16:10:49 EDT
The transmission system split internally withinNew York, with the eastern portion islanding tocontain New York City, northern New Jersey andsouthwestern Connecticut. The western portion ofNew York remained connected to Ontario andeastern Michigan.
7C) The Ontario System Just West of NiagaraFalls and West of St. Lawrence Separated fromthe Western New York Island: 16:10:50 EDT
At 16:10:50 EDT, Ontario and New York separatedwest of the Ontario/New York interconnection,due to relay operations which disconnected nine230-kV lines within Ontario. These left most ofOntario isolated to the north. Ontario’s large Beckand Saunders hydro stations, along with someOntario load, the New York Power Authority’s(NYPA) Niagara and St. Lawrence hydro stations,and NYPA’s 765-kV AC interconnection withQuébec, remained connected to the western NewYork system, supporting the demand in upstateNew York.
58 � U.S.-Canada Power System Outage Task Force � Causes of the August 14th Blackout �
Figure 5.13. New York and New England Separate,Multiple Islands Form

From 16:10:49 EDT to 16:10:50 EDT, frequencydeclined below 59.3 Hz, initiating automaticunder-frequency load-shedding in Ontario (2,500MW), eastern New York and southwestern Con-necticut. This load-shedding dropped off about20% of the load across the eastern New Yorkisland and about 10% of Ontario’s remaining load.Between 16:10:50 EDT and 16:10:56 EDT, the iso-lation of the southern Ontario hydro units onto thewestern New York island, coupled withunder-frequency load-shedding in the westernNew York island, caused the frequency in thisisland to rise to 63.0 Hz due to excess generation.
Three of the tripped 230-kV transmission circuitsnear Niagara automatically reconnected Ontarioto New York at 16:10:56 EDT by reclosing. Evenwith these lines reconnected, the main Ontarioisland (still attached to New York and easternMichigan) was then extremely deficient in genera-tion, so its frequency declined towards 58.8 Hz,the threshold for the second stage of under-frequency load-shedding. Within the next two sec-onds another 18% of Ontario demand (4,500 MW)automatically disconnected by under-frequencyload-shedding. At 16:11:10 EDT, these same threelines tripped a second time west of Niagara, andNew York and most of Ontario separated for a finaltime. Following this separation, the frequency inOntario declined to 56 Hz by 16:11:57 EDT. WithOntario still supplying 2,500 MW to the Michi-gan-Ohio load pocket, the remaining ties withMichigan tripped at 16:11:57 EDT. Ontario systemfrequency declined, leading to a widespread shut-down at 16:11:58 EDT and loss of 22,500 MW of
load in Ontario, including the cities of Toronto,Hamilton and Ottawa.
7D) Southwest Connecticut Separated fromNew York City: 16:11:22 EDT
In southwest Connecticut, when the Long Moun-tain-Plum Tree line (connected to the PleasantValley substation in New York) disconnected at16:11:22 EDT, it left about 500 MW of southwestConnecticut demand supplied only through a138-kV underwater tie to Long Island. About twoseconds later, the two 345-kV circuits connectingsoutheastern New York to Long Island tripped,isolating Long Island and southwest Connecticut,which remained tied together by the underwaterNorwalk Harbor to Northport 138-kV cable. Thecable tripped about 20 seconds later, causingsouthwest Connecticut to black out.
Within the western New York island, the 345-kVsystem remained intact from Niagara east to theUtica area, and from the St. Lawrence/Plattsburgharea south to the Utica area through both the765-kV and 230-kV circuits. Ontario’s Beck andSaunders generation remained connected to NewYork at Niagara and St. Lawrence, respectively,and this island stabilized with about 50% of thepre-event load remaining. The boundary of thisisland moved southeastward as a result of thereclosure of Fraser to Coopers Corners 345-kV at16:11:23 EDT.
As a result of the severe frequency and voltagechanges, many large generating units in New Yorkand Ontario tripped off-line. The eastern island of
� U.S.-Canada Power System Outage Task Force � Causes of the August 14th Blackout � 59
Under-frequency Load-Shedding
Since in an electrical system load and generationmust balance, if a system loses a great deal of gen-eration suddenly it will if necessary drop load tobalance that loss. Unless that load drop is man-aged carefully, such an imbalance can lead to avoltage collapse and widespread outages. In anelectrical island with declining frequency, if suf-ficient load is quickly shed, frequency will beginto rise back toward 60 Hz.
After the blackouts of the 1960s, some utilitiesinstalled under-frequency load-shedding mecha-nisms on their distribution systems. Thesesystems are designed to drop pre-designated cus-tomer load automatically if frequency gets toolow (since low frequency indicates too little gen-eration relative to load), starting generally when
frequency reaches 59.2 Hz. Progressively moreload is set to drop as frequency levels fall farther.The last step of customer load shedding is set atthe frequency level just above the set point forgeneration under-frequency protection relays(57.5 Hz), to prevent frequency from falling solow that the generators could be damaged (seeFigure 2.4).
Not every utility or control area handles load-shedding in the same way. In NPCC, followingthe Northeast blackout of 1965, the regionadopted automatic load-shedding criteria to pre-vent a recurrence of the cascade and better pro-tect system equipment from damage due to ahigh-speed system collapse.

New York, including the heavily populated areasof southeastern New York, New York City, andLong Island, experienced severe frequency andvoltage decline. At 16:11:29 EDT, the New Scot-land to Leeds 345-kV circuits tripped, separatingthe island into northern and southern sections.The small remaining load in the northern portionof the eastern island (the Albany area) retainedelectric service, supplied by local generation untilit could be resynchronized with the western NewYork island.
7E) Remaining Transmission Lines BetweenOntario and Eastern Michigan Separated:16:11:57 EDT
Before the blackout, New England, New York,Ontario, eastern Michigan, and northern Ohiowere scheduled net importers of power. When thewestern and southern lines serving Cleveland,Toledo, and Detroit collapsed, most of the loadremained on those systems, but some generationhad tripped. This exacerbated the generation/loadimbalance in areas that were already importingpower. The power to serve this load came throughthe only major path available, through Ontario(IMO). After most of IMO was separated from NewYork and generation to the north and east, much ofthe Ontario load and generation was lost; it tookonly moments for the transmission paths westfrom Ontario to Michigan to fail.
When the cascade was over at about 16:12 EDT,much of the disturbed area was completelyblacked out, but there were isolated pockets thatstill had service because load and generation hadreached equilibrium. Ontario’s large Beck andSaunders hydro stations, along with some Ontarioload, the New York Power Authority’s (NYPA)
Niagara and St. Lawrence hydro stations, andNYPA’s 765-kV AC interconnection with Québec,remained connected to the western New York sys-tem, supporting demand in upstate New York.
Electrical islanding. Once the northeast becameisolated, it grew generation-deficient as more andmore power plants tripped off-line to protectthemselves from the growing disturbance. Thesevere swings in frequency and voltage in the areacaused numerous lines to trip, so the isolated areabroke further into smaller islands. The load/gener-ation mismatch also affected voltages and fre-quency within these smaller areas, causing furthergenerator trips and automatic under-frequencyload-shedding, leading to blackout in most ofthese areas.
Figure 5.14 shows frequency data collected by thedistribution-level monitors of Softswitching Tech-nologies, Inc. (a commercial power quality com-pany serving industrial customers) for the areaaffected by the blackout. The data reveal at leastfive separate electrical islands in the Northeast asthe cascade progressed. The two paths of red dia-monds on the frequency scale reflect the Albanyarea island (upper path) versus the New York cityisland, which declined and blacked out muchearlier.
Cascading Sequence Essentially Complete:16:13 EDT
Most of the Northeast (the area shown in gray inFigure 5.15) was now blacked out. Some isolatedareas of generation and load remained on-line forseveral minutes. Some of those areas in which aclose generation-demand balance could be main-tained remained operational; other generators ulti-mately tripped off line and the areas they servedwere blacked out.
60 � U.S.-Canada Power System Outage Task Force � Causes of the August 14th Blackout �
Figure 5.14. Electric Islands Reflected inFrequency Plot
Figure 5.15. Area Affected by the Blackout
One relatively large island remained in operationserving about 5,700 MW of demand, mostly inwestern New York. Ontario’s large Beck andSaunders hydro stations, along with some Ontarioload, the New York Power Authority’s (NYPA)Niagara and St. Lawrence hydro stations, andNYPA’s 765-kV AC interconnection with Québec,remained connected to the western New York sys-tem, supporting demand in upstate New York.This island formed the basis for restoration in bothNew York and Ontario.
The entire cascade sequence is depicted graphi-cally in Figure 5.16 on the following page.
Why the Blackout StoppedWhere It Did
Extreme system conditions can damage equip-ment in several ways, from melting aluminumconductors (excessive currents) to breaking tur-bine blades on a generator (frequency excursions).The power system is designed to ensure thatif conditions on the grid (excessive or inadequatevoltage, apparent impedance or frequency)threaten the safe operation of the transmissionlines, transformers, or power plants, the threat-ened equipment automatically separates from thenetwork to protect itself from physical damage.Relays are the devices that effect this protection.
Generators are usually the most expensive unitson an electrical system, so system protectionschemes are designed to drop a power plant off thesystem as a self-protective measure if grid condi-tions become unacceptable. When unstable powerswings develop between a group of generators thatare losing synchronization (matching frequency)with the rest of the system, the only way to stopthe oscillations is to stop the flows entirely by sep-arating all interconnections or ties between theunstable generators and the remainder of the sys-tem. The most common way to protect generatorsfrom power oscillations is for the transmissionsystem to detect the power swings and trip at thelocations detecting the swings—ideally before theswing reaches and harms the generator.
On August 14, the cascade became a race betweenthe power surges and the relays. The lines thattripped first were generally the longer lines,because the relay settings required to protect theselines use a longer apparent impedance trippingzone, which a power swing enters sooner, in com-parison to the shorter apparent impedance zone
targets set on shorter, networked lines. On August14, relays on long lines such as the HomerCity-Watercure and the Homer City-Stolle Road345-kV lines in Pennsylvania, that are not highlyintegrated into the electrical network, trippedquickly and split the grid between the sectionsthat blacked out and those that recovered withoutfurther propagating the cascade. This same phe-nomenon was seen in the Pacific Northwest black-outs of 1996, when long lines tripped before morenetworked, electrically supported lines.
Transmission line voltage divided by its currentflow is called “apparent impedance.” Standardtransmission line protective relays continuouslymeasure apparent impedance. When apparentimpedance drops within the line’s protective relayset-points for a given period of time, the relays tripthe line. The vast majority of trip operations onlines along the blackout boundaries between PJMand New York (for instance) show high-speedrelay targets, which indicate that massive powersurges caused each line to trip. To the relays, thismassive power surge altered the voltages and cur-rents enough that they appeared to be faults. Thispower surge was caused by power flowing to thoseareas that were generation-deficient. These flowsoccurred purely because of the physics of powerflows, with no regard to whether the power flowhad been scheduled, because power flows fromareas with excess generation into areas that aregeneration-deficient.
Relative voltage levels across the northeastaffected which areas blacked out and which areasstayed on-line. Within the Midwest, there wererelatively low reserves of reactive power, so asvoltage levels declined many generators in theaffected area were operating at maximum reactivepower output before the blackout. This left thesystem little slack to deal with the low voltage con-ditions by ramping up more generators to higherreactive power output levels, so there was littleroom to absorb any system “bumps” in voltage orfrequency. In contrast, in the northeast—particu-larly PJM, New York, and ISO-New England—operators were anticipating high power demandson the afternoon of August 14, and had already setup the system to maintain higher voltage levelsand therefore had more reactive reserves on-linein anticipation of later afternoon needs. Thus,when the voltage and frequency swings began,these systems had reactive power already orreadily available to help buffer their areas againsta voltage collapse without widespread generationtrips.
� U.S.-Canada Power System Outage Task Force � Causes of the August 14th Blackout � 61

62 � U.S.-Canada Power System Outage Task Force � Causes of the August 14th Blackout �
Figure 5.16. Cascade Sequence
1
16:05:57 EDT
Legend: Yellow arrows represent the overall pattern of electricity flows. Black lines represent approximate points of separationbetween areas within the Eastern Interconnect. Gray shading represents areas affected by the blackout.
2
16:05:58 EDT
3
16:10:37 EDT
4
16:10:39 EDT
8
16:13:00 EDT
7
16:10:45 EDT
6
16:10:44 EDT
5
16:10:40 EDT

Voltage CollapseAlthough the blackout of August 14 has beenlabeled as a voltage collapse, it was not a voltagecollapse as that term has been traditionally usedby power system engineers. Voltage collapse typi-cally occurs on power systems that are heavilyloaded, faulted (reducing the number of availablepaths for power to flow to loads), or have reactivepower shortages. The collapse is initiated whenreactive power demands of loads can no longer bemet by the production and transmission of reac-tive power. A classic voltage collapse occurs whenan electricity system experiences a disturbancethat causes a progressive and uncontrollabledecline in voltage. Dropping voltage causes a fur-ther reduction in reactive power from capacitorsand line charging, and still further voltage reduc-tions. If the collapse continues, these voltagereductions cause additional elements to trip, lead-ing to further reduction in voltage and loss of load.At some point the voltage may stabilize but at amuch reduced level. In summary, the systembegins to fail due to inadequate reactive powersupplies rather than due to overloaded facilities.
On August 14, the northern Ohio electricity sys-tem did not experience a classic voltage collapsebecause low voltage never became the primarycause of line and generator tripping. Althoughvoltage was a factor in some of the events that ledto the ultimate cascading of the system in Ohioand beyond, the event was not a classic reactivepower-driven voltage collapse. Rather, althoughreactive power requirements were high, voltagelevels were within acceptable bounds before indi-vidual transmission trips began, and a shortage ofreactive power did not trigger the collapse. Voltagelevels began to degrade, but not collapse, as earlytransmission lines were lost due to tree-line con-tacts causing ground faults. With fewer lines oper-ational, current flowing over the remaining linesincreased and voltage decreased (current in-creases in inverse proportion to the decrease involtage for a given amount of power flow). Soon,in northern Ohio, lines began to trip out automati-cally on protection from overloads, rather thanfrom insufficient reactive power. As the cascadespread beyond Ohio, it spread due not to insuffi-cient reactive power, but because of dynamicpower swings and the resulting system instability.
On August 14, voltage collapse in some areas wasa result, rather than a cause, of the cascade. Signif-icant voltage decay began after the system wasalready in an N-3 or N-4 contingency situation.
Frequency plots over the course of the cascadeshow areas with too much generation and otherswith too much load as the system attempted toreach equilibrium between generation and load.As the transmission line failures caused load todrop off, some parts of the system had too muchgeneration, and some units tripped off onover-frequency protection. Frequency fell, moreload dropped on under-frequency protection, theremaining generators sped up and then some ofthem tripped off, and so on. For a period, condi-tions see-sawed across the northeast, ending withisolated pockets in which generation and load hadachieved balance, and wide areas that had blackedout before an equilibrium had been reached.
Why the Generators Tripped Off
At least 263 power plants with more than 531 indi-vidual generating units shut down in the August14 blackout. These U.S. and Canadian plants canbe categorized as follows:
By reliability coordination area:
� Hydro Quebec, 5 plants
� Ontario, 92 plants
� ISO-New England, 31 plants
� MISO, 30 plants
� New York ISO, 67 plants
� PJM, 38 plants
By type:
� Conventional steam units, 67 plants (39 coal)
� Combustion turbines, 66 plants (36 combinedcycle)
� Nuclear, 10 plants—7 U.S. and 3 Canadian,totaling 19 units (the nuclear unit outages arediscussed in Chapter 7)
� Hydro, 101
� Other, 19
There were three categories of generatorshutdowns:
1. Excitation system failures during extremely lowvoltage conditions on portions of the powersystem
2. Plant control system actions after major distur-bances to in-plant thermal/mechanical systems
3. Consequential tripping due to total system dis-connection or collapse.
Examples of the three types of separation are dis-cussed below.
� U.S.-Canada Power System Outage Task Force � Causes of the August 14th Blackout � 63

Excitation failures. The Eastlake 5 trip at 1:31p.m. was an excitation system failure—as voltagefell at the generator bus, the generator tried toincrease its production of voltage on the coil (exci-tation) quickly. This caused the generator’s excita-tion protection scheme to trip the plant off toprotect its windings and coils from over-heating.Several of the other generators which trippedearly in the cascade came off under similarcircumstances as excitation systems were over-stressed to hold voltages up.
After the cascade was initiated, huge powerswings across the torn transmission system andexcursions of system frequency put all the units intheir path through a sequence of major distur-bances that shocked several units into tripping.Plant controls had actuated fast governor actionon several of these to turn back the throttle, thenturn it forward, only to turn it back again as somefrequencies changed several times by as much as 3Hz (about 100 times normal). Figure 5.17 is a plotof the MW output and frequency for one large unitthat nearly survived the disruption but trippedwhen in-plant hydraulic control pressure limitswere eventually violated. After the plant controlsystem called for shutdown, the turbine controlvalves closed and the generator electrical outputramped down to a preset value before the fieldexcitation tripped and the generator breakersopened to disconnect the unit from the system.
Plant control systems. The second reason forpower plant trips was actions or failures of plantcontrol systems. One common cause in this cate-gory was a loss of sufficient voltage to in-plantloads. Some plants run their internal cooling and
processes (house electrical load) off the generatoror off small, in-house auxiliary generators, whileothers take their power off the main grid. Whenlarge power swings or voltage drops reached theseplants in the latter category, they tripped off-linebecause the grid could not supply the plant’sin-house power needs reliably.
Consequential trips. Most of the unit separationsfell in the third category of consequential trip-ping—they tripped off-line in response to someoutside condition on the grid, not because of anyproblem internal to the plant. Some generatorsbecame completely removed from all loads;because the fundamental operating principle ofthe grid is that load and generation must balance,if there was no load to be served the power plantshut down in response to over-speed and/orover-voltage protection schemes. Others wereoverwhelmed because they were among a fewpower plants within an electrical island, and weresuddenly called on to serve huge customer loads,so the imbalance caused them to trip onunder-frequency and/or under-voltage protection.A few were tripped by special protection schemesthat activated on excessive frequency or loss ofpre-studied major transmission elements knownto require large blocks of generation rejection.
The maps in Figure 5.18 show the sequence ofpower plants lost in three blocks of time duringthe cascade.
The investigation team is still analyzing data onthe effect of the cascade on the affected generators,to learn more about how to protect generation andtransmission assets and speed system restorationin the future.
Endnotes
64 � U.S.-Canada Power System Outage Task Force � Causes of the August 14th Blackout �
Figure 5.17. Events at One Large Generator Duringthe Cascade
1The extensive computer modeling required to determine theexpansion and cessation of the blackout (line by line, relay byrelay, generator by generator, etc.) has not been performed.2After New England’s separation from the Eastern Intercon-nection occurred, the next several minutes were critical tostabilizing the ISO-NE system. Voltages in New Englandrecovered and over-shot to high due to the combination ofload loss, capacitors still in service, lower reactive losses onthe transmission system, and loss of generation to regulatesystem voltage. Over-voltage protective relays operated to tripboth transmission and distribution capacitors. Operators inNew England brought all fast-start generation on-line by16:16 EDT. Much of the customer process load was automati-cally restored. This caused voltages to drop again, puttingportions of New England at risk of voltage collapse. Operatorsmanually dropped 80 MW of load in southwest Connecticutby 16:39 EDT, another 325 MW in Connecticut and 100 MWin western Massachusetts by 16:40 EDT. These measureshelped to stabilize their island following their separationfrom the rest of the Eastern Interconnection.

� U.S.-Canada Power System Outage Task Force � Causes of the August 14th Blackout � 65
Figure 5.18. Power Plants Tripped During the Cascade


6. The August 14 Blackout Compared WithPrevious Major North American Outages
Incidence and Characteristicsof Power System Outages
Short, localized outages occur on power systemsfairly frequently. System-wide disturbances thataffect many customers across a broad geographicarea are rare, but they occur more frequently thana normal distribution of probabilities would pre-dict. North American power system outagesbetween 1984 and 1997 are shown in Figure 6.1 bythe number of customers affected and the rate ofoccurrence. While some of these were widespreadweather-related events, some were cascadingevents that, in retrospect, were preventable. Elec-tric power systems are fairly robust and are capa-ble of withstanding one or two contingencyevents, but they are fragile with respect to multi-ple contingency events unless the systems arereadjusted between contingencies. With theshrinking margin in the current transmission sys-tem, it is likely to be more vulnerable to cascadingoutages than it was in the past, unless effectivecountermeasures are taken.
As evidenced by the absence of major transmis-sion projects undertaken in North America overthe past 10 to 15 years, utilities have found ways toincrease the utilization of their existing facilitiesto meet increasing demands without adding sig-nificant high-voltage equipment. Without inter-vention, this trend is likely to continue. Pushingthe system harder will undoubtedly increase reli-ability challenges. Special protection schemesmay be relied on more to deal with particular chal-lenges, but the system still will be less able towithstand unexpected contingencies.
A smaller transmission margin for reliabilitymakes the preservation of system reliability aharder job than it used to be. The system is beingoperated closer to the edge of reliability than itwas just a few years ago. Table 6.1 represents someof the changed conditions that make the preserva-tion of reliability more challenging.
If nothing else changed, one could expect anincreased frequency of large-scale events as com-pared to historical experience. The last and mostextreme event shown in Figure 6.1 is the August10, 1996, outage. August 14, 2003, surpassed thatevent in terms of severity. In addition, two signifi-cant outages in the month of September 2003occurred abroad: one in England and one, initiatedin Switzerland, that cascaded over much of Italy.
In the following sections, seven previous outagesare reviewed and compared with the blackout ofAugust 14, 2003: (1) Northeast blackout onNovember 9, 1965; (2) New York City blackout onJuly 13, 1977; (3) West Coast blackout on Decem-ber 22, 1982; (4) West Coast blackout on July 2-3,1996; (5) West Coast blackout on August 10, 1996;(6) Ontario and U.S. North Central blackout onJune 25, 1998; and (7) Northeast outages and non-outage disturbances in the summer of 1999.
� U.S.-Canada Power System Outage Task Force � Causes of the August 14th Blackout � 67
Figure 6.1. North American Power System Outages,1984-1997
Note: The bubbles represent individual outages in NorthAmerica between 1984 and 1997.
Source: Adapted from John Doyle, California Institute ofTechnology, “Complexity and Robustness,” 1999. Data fromNERC.

Outage Descriptionsand Major Causal Factors
November 9, 1965: Northeast Blackout
This disturbance resulted in the loss of over20,000 MW of load and affected 30 million people.Virtually all of New York, Connecticut, Massachu-setts, Rhode Island, small segments of northernPennsylvania and northeastern New Jersey, andsubstantial areas of Ontario, Canada, wereaffected. Outages lasted for up to 13 hours. Thisevent resulted in the formation of the North Amer-ican Electric Reliability Council in 1968.
A backup protective relay operated to open one offive 230-kV lines taking power north from a gener-ating plant in Ontario to the Toronto area. Whenthe flows redistributed instantaneously to theremaining four lines, they tripped out succes-sively in a total of 2.5 seconds. The resultantpower swings resulted in a cascading outage thatblacked out much of the Northeast.
The major causal factors were as follows:
� Operation of a backup protective relay took a230-kV line out of service when the loading onthe line exceeded the 375-MW relay setting.
� Operating personnel were not aware of theoperating set point of this relay.
� Another 230-kV line opened by an overcurrentrelay action, and several 115- and 230-kV linesopened by protective relay action.
� Two key 345-kV east-west (Rochester-Syracuse)lines opened due to instability, and severallower voltage lines tripped open.
� Five of 16 generators at the St. Lawrence(Massena) plant tripped automatically inaccordance with predetermined operatingprocedures.
� Following additional line tripouts, 10 generat-ing units at Beck were automatically shut downby low governor oil pressure, and 5 pumpinggenerators were tripped off by overspeed gover-nor control.
� Several other lines then tripped out onunder-frequency relay action.
July 13, 1977: New York City Blackout
This disturbance resulted in the loss of 6,000 MWof load and affected 9 million people in New YorkCity. Outages lasted for up to 26 hours. A series ofevents triggering the separation of the Consoli-dated Edison system from neighboring systemsand its subsequent collapse began when two345-kV lines on a common tower in NorthernWestchester were struck by lightning and trippedout. Over the next hour, despite Consolidated Edi-son dispatcher actions, the system electricallyseparated from surrounding systems and col-lapsed. With the loss of imports, generation inNew York City was not sufficient to serve the loadin the city.
Major causal factors were:
68 � U.S.-Canada Power System Outage Task Force � Causes of the August 14th Blackout �
Table 6.1. Changing Conditions That Affect System ReliabilityPrevious Conditions Emerging Conditions
Fewer, relatively large resources Smaller, more numerous resources
Long-term, firm contracts Contracts shorter in durationMore non-firm transactions, fewer long-term firm transactions
Bulk power transactions relatively stable and predictable Bulk power transactions relatively variable and less predictable
Assessment of system reliability made from stable base(narrower, more predictable range of potential operatingstates)
Assessment of system reliability made from variable base(wider, less predictable range of potential operating states)
Limited and knowledgable set of utility players More players making more transactions, some with lessinterconnected operation experience; increasing with retailaccess
Unused transmission capacity and high security margins High transmission utilization and operation closer to securitylimits
Limited competition, little incentive for reducing reliabilityinvestments
Utilities less willing to make investments in transmissionreliability that do not increase revenues
Market rules and reliability rules developed together Market rules undergoing transition, reliability rules developedseparately
Limited wheeling More system throughput

� Two 345-kV lines connecting Buchanan Southto Millwood West were subjected to a phase B toground fault caused by a lightning strike.
� Circuit breaker operations at the BuchananSouth ring bus isolated the Indian Point No. 3generating unit from any load, and the unit trip-ped for a rejection of 883 MW of load.
� Loss of the ring bus isolated the 345-kV tie toLadentown, which had been importing 427MW, making the cumulative load loss 1,310MW.
� 18.5 minutes after the first incident, an addi-tional lightning strike caused the loss of two345-kV lines, which connect Sprain Brook toBuchanan North and Sprain Brook to MillwoodWest. These two 345-kV lines share commontowers between Millwood West and SprainBrook. One line (Sprain Brook to MillwoodWest) automatically reclosed and was restoredto service in about 2 seconds. The failure of theother line to reclose isolated the last Consoli-dated Edison interconnection to the Northwest.
� The resulting surge of power from the North-west caused the loss of the Pleasant Valley toMillwood West line by relay action (a bent con-tact on one of the relays at Millwood Westcaused the improper action).
� 23 minutes later, the Leeds to Pleasant Valley345-kV line sagged into a tree due to overloadand tripped out.
� Within a minute, the 345 kV to 138 kV trans-former at Pleasant Valley overloaded and trip-ped off, leaving Consolidated Edison with onlythree remaining interconnections.
� Within 3 minutes, the Long Island Lighting Co.system operator, on concurrence of the pool dis-patcher, manually opened the Jamaica to ValleyStream tie.
� About 7 minutes later, the tap-changing mecha-nism failed on the Goethals phase-shifter,resulting in the loss of the Linden to Goethals tieto PJM, which was carrying 1,150 MW to Con-solidated Edison.
� The two remaining external 138-kV ties to Con-solidated Edison tripped on overload, isolatingthe Consolidated Edison system.
� Insufficient generation in the isolated systemcaused the Consolidated Edison island tocollapse.
December 22, 1982: West Coast Blackout
This disturbance resulted in the loss of 12,350MW of load and affected over 5 million people inthe West. The outage began when high windscaused the failure of a 500-kV transmission tower.The tower fell into a parallel 500-kV line tower,and both lines were lost. The failure of these twolines mechanically cascaded and caused threeadditional towers to fail on each line. When theline conductors fell they contacted two 230-kVlines crossing under the 500-kV rights-of-way, col-lapsing the 230-kV lines.
The loss of the 500-kV lines activated a remedialaction scheme to control the separation of theinterconnection into two pre-engineered islandsand trip generation in the Pacific Northwest inorder to minimize customer outages and speedrestoration. However, delayed operation of theremedial action scheme components occurred forseveral reasons, and the interconnection sepa-rated into four islands.
In addition to the mechanical failure of the trans-mission lines, analysis of this outage cited prob-lems with coordination of protective schemes,because the generator tripping and separationschemes operated slowly or did not operate asplanned. A communication channel componentperformed sporadically, resulting in delayedtransmission of the control signal. The backupseparation scheme also failed to operate, becausethe coordination of relay settings did not antici-pate the power flows experienced in this severedisturbance.
In addition, the volume and format in which datawere displayed to operators made it difficult toassess the extent of the disturbance and what cor-rective action should be taken. Time references toevents in this disturbance were not tied to a com-mon standard, making real-time evaluation of thesituation more difficult.
July 2-3, 1996: West Coast Blackout
This disturbance resulted in the loss of 11,850MW of load and affected 2 million people in theWest. Customers were affected in Arizona, Cali-fornia, Colorado, Idaho, Montana, Nebraska,Nevada, New Mexico, Oregon, South Dakota,Texas, Utah, Washington, and Wyoming in theUnited States; Alberta and British Columbia inCanada; and Baja California Norte in Mexico. Out-ages lasted from a few minutes to several hours.
� U.S.-Canada Power System Outage Task Force � Causes of the August 14th Blackout � 69

The outage began when a 345-kV transmissionline in Idaho sagged into a tree and tripped out. Aprotective relay on a parallel transmission linealso detected the fault and incorrectly tripped asecond line. An almost simultaneous loss of theselines greatly reduced the ability of the system totransmit power from the nearby Jim Bridger plant.Other relays tripped two of the four generatingunits at that plant. With the loss of those twounits, frequency in the entire Western Intercon-nection began to decline, and voltage began to col-lapse in the Boise, Idaho, area, affecting theCalifornia-Oregon AC Intertie transfer limit.
For 23 seconds the system remained in precariousbalance, until the Mill Creek to Antelope 230-kVline between Montana and Idaho tripped by zone3 relay, depressing voltage at Summer Lake Sub-station and causing the intertie to slip out of syn-chronism. Remedial action relays separated thesystem into five pre-engineered islands designedto minimize customer outages and restorationtimes. Similar conditions and initiating factorswere present on July 3; however, as voltage beganto collapse in the Boise area, the operator shedload manually and contained the disturbance.
August 10, 1996: West Coast Blackout
This disturbance resulted in the loss of over28,000 MW of load and affected 7.5 million peoplein the West. Customers were affected in Arizona,California, Colorado, Idaho, Montana, Nebraska,Nevada, New Mexico, Oregon, South Dakota,Texas, Utah, Washington, and Wyoming in theUnited States; Alberta and British Columbia inCanada; and Baja California Norte in Mexico. Out-ages lasted from a few minutes to as long as 9hours.
Triggered by several major transmission line out-ages, the loss of generation from McNary Dam, andresulting system oscillations, the Western Inter-connection separated into four electrical islands,with significant loss of load and generation. Priorto the disturbance, the transmission system fromCanada south through the Northwest into Califor-nia was heavily loaded with north-to-south powertransfers. These flows were due to high Southwestdemand caused by hot weather, combined withexcellent hydroelectric conditions in Canada andthe Northwest.
Very high temperatures in the Northwest causedtwo lightly loaded transmission lines to sag intountrimmed trees and trip out. A third heavilyloaded line also sagged into a tree. Its outage led to
the overload and loss of additional transmissionlines. General voltage decline in the Northwestand the loss of McNary generation due to incor-rectly applied relays caused power oscillations onthe California to Oregon AC intertie. The intertie’sprotective relays tripped these facilities out andcaused the Western Interconnection to separateinto four islands. Following the loss of the first twolightly loaded lines, operators were unaware thatthe system was in an insecure state over the nexthour, because new operating studies had not beenperformed to identify needed system adjustment.
June 25, 1998: Ontario and U.S. NorthCentral Blackout
This disturbance resulted in the loss of 950 MW ofload and affected 152,000 people in Minnesota,Montana, North Dakota, South Dakota, and Wis-consin in the United States; and Ontario, Mani-toba, and Saskatchewan in Canada. Outages lastedup to 19 hours.
A lightning storm in Minnesota initiated a series ofevents, causing a system disturbance that affectedthe entire Mid-Continent Area Power Pool (MAPP)Region and the northwestern Ontario Hydro sys-tem of the Northeast Power Coordinating Council.A 345-kV line was struck by lightning and trippedout. Underlying lower voltage lines began to over-load and trip out, further weakening the system.Soon afterward, lightning struck a second 345-kVline, taking it out of service as well. Following theoutage of the second 345-kV line, the remaininglower voltage transmission lines in the areabecame significantly overloaded, and relays tookthem out of service. This cascading removal oflines from service continued until the entirenorthern MAPP Region was separated from theEastern Interconnection, forming three islandsand resulting in the eventual blackout of thenorthwestern Ontario Hydro system.
Summer of 1999: Northeast U.S. Outagesand Non-outage Disturbances
Load in the PJM system on July 6, 1999, was51,600 MW (approximately 5,000 MW above fore-cast). PJM used all emergency procedures (includ-ing a 5% voltage reduction) except manuallytripping load, and imported 5,000 MW from exter-nal systems to serve the record customer demand.Load on July 19, 1999, exceeded 50,500 MW. PJMloaded all available eastern PJM generation andagain implemented PJM emergency operating pro-cedures from approximately 12 noon into the eve-ning on both days.
70 � U.S.-Canada Power System Outage Task Force � Causes of the August 14th Blackout �

During record peak loads, steep voltage declineswere experienced on the bulk transmission sys-tem. Emergency procedures were implemented toprevent voltage collapse. Low voltage occurredbecause reactive demand exceeded reactive sup-ply. High reactive demand was due to high elec-tricity demand and high losses resulting from hightransfers across the system. Reactive supply wasinadequate because generators were unavailableor unable to meet rated reactive capability due toambient conditions, and because some shuntcapacitors were out of service.
Common or Similar FactorsAmong Major Outages
Among the factors that were either common to themajor outages above and the August 14 blackoutor had similarities among the events are the fol-lowing: (1) conductor contact with trees; (2)underestimation of dynamic reactive output ofsystem generators; (3) inability of system opera-tors or coordinators to visualize events on theentire system; (4) failure to ensure that systemoperation was within safe limits; (5) lack of coordi-nation on system protection; (6) ineffective com-munication; (7) lack of “safety nets;” and (8)inadequate training of operating personnel. Thefollowing sections describe the nature of these fac-tors and list recommendations from previousinvestigations that are relevant to each.
Conductor Contact With Trees
This factor was an initiating trigger in several ofthe outages and a contributing factor in the sever-ity of several more. Unlike lightning strikes, forwhich system operators have fair storm-trackingtools, system operators generally do not havedirect knowledge that a line has contacted a treeand faulted. They will sometimes test the line bytrying to restore it to service, if that is deemed to bea safe operation. Even if it does go back into ser-vice, the line may fault and trip out again as loadheats it up. This is most likely to happen whenvegetation has not been adequately managed, incombination with hot and windless conditions.
In some of the disturbances, tree contactaccounted for the loss of more than one circuit,contributing multiple contingencies to the weak-ening of the system. Lines usually sag intoright-of-way obstructions when the need to retaintransmission interconnection is significant. High
inductive load composition, such as air condition-ing or irrigation pumping, accompanies hotweather and places higher burdens on transmis-sion lines. Losing circuits contributes to voltagedecline. Inductive load is unforgiving when volt-age declines, drawing additional reactive supplyfrom the system and further contributing to volt-age problems.
Recommendations from previous investigationsinclude:
� Paying special attention to the condition ofrights-of-way following favorable growing sea-sons. Very wet and warm spring and summergrowing conditions preceded the 1996 outagesin the West.
� Careful review of any reduction in operationsand maintenance expenses that may contributeto decreased frequency of line patrols or trim-ming. Maintenance in this area should bestrongly directed toward preventive rather thanremedial maintenance.
Dynamic Reactive Output of Generators
Reactive supply is an important ingredient inmaintaining healthy power system voltages andfacilitating power transfers. Inadequate reactivesupply was a factor in most of the events. Shuntcapacitors and generating resources are the mostsignificant suppliers of reactive power. Operatorsperform contingency analysis based on howpower system elements will perform under vari-ous power system conditions. They determine andset transfer limits based on these analyses. Shuntcapacitors are easy to model because they arestatic. Modeling the dynamic reactive output ofgenerators under stressed system conditions hasproven to be more challenging. If the model isincorrect, estimating transfer limits will also beincorrect.
In most of the events, the assumed contribution ofdynamic reactive output of system generators wasgreater than the generators actually produced,resulting in more significant voltage problems.Some generators were limited in the amount ofreactive power they produced by over-excitationlimits, or necessarily derated because of highambient temperatures. Other generators were con-trolled to a fixed power factor and did not contrib-ute reactive supply in depressed voltageconditions. Under-voltage load shedding isemployed as an automatic remedial action in someinterconnections to prevent cascading.
� U.S.-Canada Power System Outage Task Force � Causes of the August 14th Blackout � 71

Recommendations from previous investigationsconcerning voltage support and reactive powermanagement include:
� Communicate changes to generator reactivecapability limits in a timely and accurate man-ner for both planning and operational modelingpurposes.
� Investigate the development of a generatorMVAr/voltage monitoring process to determinewhen generators may not be following reportedMVAr limits.
� Establish a common standard for generatorsteady-state and post-contingency (15-minute)MVAr capability definition; determine method-ology, testing, and operational reportingrequirements.
� Determine the generator service level agree-ment that defines generator MVAr obligation tohelp ensure reliable operations.
� Periodically review and field test the reactivelimits of generators to ensure that reportedMVAr limits are attainable.
� Provide operators with on-line indications ofavailable reactive capability from each generat-ing unit or groups of generators, other VArsources, and the reactive margin at all criticalbuses. This information should assist in theoperating practice of maximizing the use ofshunt capacitors during heavy transfers andthereby increase the availability of systemdynamic reactive reserve.
� For voltage instability problems, consider fastautomatic capacitor insertion (both series andshunt), direct shunt reactor and load tripping,and under-voltage load shedding.
� Develop and periodically review a reactive mar-gin against which system performance shouldbe evaluated and used to establish maximumtransfer levels.
System Visibility Procedures andOperator Tools
Each control area operates as part of a single syn-chronous interconnection. However, the partieswith various geographic or functional responsibil-ities for reliable operation of the grid do not havevisibility of the entire system. Events in neighbor-ing systems may not be visible to an operator orreliability coordinator, or power system datamay be available in a control center but not be
presented to operators or coordinators as informa-tion they can use in making appropriate operatingdecisions.
Recommendations from previous investigationsconcerning visibility and tools include:
� Develop communications systems and displaysthat give operators immediate information onchanges in the status of major components intheir own and neighboring systems.
� Supply communications systems with uninter-ruptible power, so that information on systemconditions can be transmitted correctly to con-trol centers during system disturbances.
� In the control center, use a dynamic line loadingand outage display board to provide operatingpersonnel with rapid and comprehensive infor-mation about the facilities available and theoperating condition of each facility in service.
� Give control centers the capability to display tosystem operators computer-generated alterna-tive actions specific to the immediate situation,together with expected results of each action.
� Establish on-line security analysis capability toidentify those next and multiple facility outagesthat would be critical to system reliability fromthermal, stability, and post-contingency voltagepoints of view.
� Establish time-synchronized disturbance moni-toring to help evaluate the performance of theinterconnected system under stress, and designappropriate controls to protect it.
System Operation Within Safe Limits
Operators in several of the events were unaware ofthe vulnerability of the system to the next contin-gency. The reasons were varied: inaccurate model-ing for simulation, no visibility of the loss of keytransmission elements, no operator monitoring ofstability measures (reactive reserve monitor,power transfer angle), and no reassessment of sys-tem conditions following the loss of an elementand readjustment of safe limits.
Recommendations from previous investigationsinclude:
� Following a contingency, the system must bereturned to a reliable state within the allowedreadjustment period. Operating guides must bereviewed to ensure that procedures exist torestore system reliability in the allowable timeperiods.
72 � U.S.-Canada Power System Outage Task Force � Causes of the August 14th Blackout �

� Reduce scheduled transfers to a safe and pru-dent level until studies have been conducted todetermine the maximum simultaneous transfercapability limits.
� Reevaluate processes for identifying unusualoperating conditions and potential disturbancescenarios, and make sure they are studiedbefore they are encountered in real-time operat-ing conditions.
Coordination of System Protection(Transmission and Generation Elements)
Protective relays are designed to detect abnormalconditions and act locally to isolate faulted powersystem equipment from the system—both to pro-tect the equipment from damage and to protect thesystem from faulty equipment. Relay systems areapplied with redundancy in primary and backupmodes. If one relay fails, another should detect thefault and trip appropriate circuit breakers. Somebackup relays have significant “reach,” such thatnon-faulted line overloads or stable swings may beseen as faults and cause the tripping of a line whenit is not advantageous to do so. Proper coordina-tion of the many relay devices in an intercon-nected system is a significant challenge, requiringcontinual review and revision. Some relays canprevent resynchronizing, making restoration moredifficult.
System-wide controls protect the interconnectedoperation rather than specific pieces of equip-ment. Examples include controlled islanding tomitigate the severity of an inevitable disturbanceand under-voltage or under-frequency load shed-ding. Failure to operate (or misoperation of) one ormore relays as an event developed was a commonfactor in several of the disturbances.
Recommendations developed after previous out-ages include:
� Perform system trip tests of relay schemes peri-odically. At installation the acceptance testshould be performed on the complete relayscheme in addition to each individual compo-nent so that the adequacy of the scheme isverified.
� Continually update relay protection to fitchanging system development and to incorpo-rate improved relay control devices.
� Install sensing devices on critical transmissionlines to shed load or generation automatically ifthe short-term emergency rating is exceeded for
a specified period of time. The time delayshould be long enough to allow the system oper-ator to attempt to reduce line loadings promptlyby other means.
� Review phase-angle restrictions that can pre-vent reclosing of major interconnections duringsystem emergencies. Consideration should begiven to bypassing synchronism-check relays topermit direct closing of critical interconnec-tions when it is necessary to maintain stabilityof the grid during an emergency.
� Review the need for controlled islanding. Oper-ating guides should address the potential forsignificant generation/load imbalance withinthe islands.
Effectiveness of Communications
Under normal conditions, parties with reliabilityresponsibility need to communicate importantand prioritized information to each other in atimely way, to help preserve the integrity of thegrid. This is especially important in emergencies.During emergencies, operators should be relievedof duties unrelated to preserving the grid. A com-mon factor in several of the events describedabove was that information about outages occur-ring in one system was not provided to neighbor-ing systems.
Need for Safety Nets
A safety net is a protective scheme that activatesautomatically if a pre-specified, significant con-tingency occurs. When activated, such schemesinvolve certain costs and inconvenience, but theycan prevent some disturbances from getting out ofcontrol. These plans involve actions such as shed-ding load, dropping generation, or islanding, andin all cases the intent is to have a controlled out-come that is less severe than the likely uncon-trolled outcome. If a safety net had not been takenout of service in the West in August 1996, it wouldhave lessened the severity of the disturbance from28,000 MW of load lost to less than 7,200 MW. (Ithas since been returned to service.) Safety netsshould not be relied upon to establish transfer lim-its, however.
Previous recommendations concerning safety netsinclude:
� Establish and maintain coordinated programsof automatic load shedding in areas not soequipped, in order to prevent total loss of powerin an area that has been separated from the
� U.S.-Canada Power System Outage Task Force � Causes of the August 14th Blackout � 73

main network and is deficient in generation.Load shedding should be regarded as an insur-ance program, however, and should not be usedas a substitute for adequate system design.
� Install load-shedding controls to allow fast sin-gle-action activation of large-block load shed-ding by an operator.
Training of Operating Personnel
Operating procedures were necessary but not suf-ficient to deal with severe power system distur-bances in several of the events. Enhancedprocedures and training for operating personnelwere recommended. Dispatcher training facilityscenarios with disturbance simulation were sug-gested as well. Operators tended to reduce sched-ules for transactions but were reluctant to call forincreased generation—or especially to shedload—in the face of a disturbance that threatenedto bring the whole system down.
Previous recommendations concerning traininginclude:
� Thorough programs and schedules for operatortraining and retraining should be vigorouslyadministered.
� A full-scale simulator should be made availableto provide operating personnel with “hands-on”experience in dealing with possible emergencyor other system conditions.
� Procedures and training programs for systemoperators should include anticipation, recogni-tion, and definition of emergency situations.
� Written procedures and training materialsshould include criteria that system operatorscan use to recognize signs of system stress andmitigating measures to be taken before condi-tions degrade into emergencies.
� Line loading relief procedures should not berelied upon when the system is in an insecure
state, as these procedures cannot be imple-mented effectively within the required timeframes in many cases. Other readjustmentsmust be used, and the system operator musttake responsibility to restore the systemimmediately.
� Operators’ authority and responsibility to takeimmediate action if they sense the system isstarting to degrade should be emphasized andprotected.
� The current processes for assessing the poten-tial for voltage instability and the need toenhance the existing operator training pro-grams, operational tools, and annual technicalassessments should be reviewed to improve theability to predict future voltage stability prob-lems prior to their occurrence, and to mitigatethe potential for adverse effects on a regionalscale.
Comparisons With theAugust 14 Blackout
The blackout on August 14, 2003, had severalcauses or contributory factors in common with theearlier outages, including:
� Inadequate vegetation management
� Failure to ensure operation within secure limits
� Failure to identify emergency conditions andcommunicate that status to neighboringsystems
� Inadequate operator training
� Inadequate regional-scale visibility over thepower system.
New causal features of the August 14 blackoutinclude: inadequate interregional visibility overthe power system; dysfunction of a control area’sSCADA/EMS system; and lack of adequate backupcapability to that system.
74 � U.S.-Canada Power System Outage Task Force � Causes of the August 14th Blackout �

7. Performance of Nuclear Power PlantsAffected by the Blackout
Summary
On August 14, 2003, the northeastern UnitedStates and Canada experienced a widespread elec-trical power outage affecting an estimated 50 mil-lion people. Nine U.S. nuclear power plantsexperienced rapid shutdowns (reactor trips) as aconsequence of the power outage. Seven nuclearpower plants in Canada operating at high powerlevels at the time of the event also experiencedrapid shutdowns. Four other Canadian nuclearplants automatically disconnected from the griddue to the electrical transient but were able to con-tinue operating at a reduced power level and wereavailable to supply power to the grid as it wasrestored by the transmission system operators. Sixnuclear plants in the United States and one inCanada experienced significant electrical distur-bances but were able to continue generating elec-tricity. Non-nuclear generating plants in bothcountries also tripped during the event. Numerousother nuclear plants observed disturbances on theelectrical grid but continued to generate electricalpower without interruption.
The Nuclear Working Group (NWG) is one of thethree Working Groups created to support theU.S.-Canada Power System Outage Task Force.The NWG was charged with identifying all rele-vant actions by nuclear generating facilities inconnection with the outage. Nils Diaz, Chairmanof the U.S. Nuclear Regulatory Commission (NRC)and Linda Keen, President and CEO of the Cana-dian Nuclear Safety Commission (CNSC) areco-chairs of the Working Group, with other mem-bers appointed from various State and federalagencies.
During Phase I of the investigation, the NWGfocused on collecting and analyzing data fromeach plant to determine what happened, andwhether any activities at the plants caused or con-tributed to the power outage or involved a signifi-cant safety issue. To ensure accuracy, NWGmembers coordinated their efforts with the
Electric System Working Group (ESWG) and theSecurity Working Group (SWG). NRC and CNSCstaff developed a set of technical questions toobtain data from the owners or licensees of thenuclear power plants that would enable their staffto review the response of the nuclear plant sys-tems in detail. The plant data was comparedagainst the plant design to determine if the plantresponses were as expected; if they appeared tocause the power outage or contributed to thespread of the outage; and if applicable safetyrequirements were met.
Having reviewed the operating data for each plantand the response of the nuclear power plants andtheir staff to the event, the NWG concludes thefollowing:
� All the nuclear plants that shut down or discon-nected from the grid responded automaticallyto grid conditions.
� All the nuclear plants responded in a mannerconsistent with the plant designs.
� Safety functions were effectively accomplished,and the nuclear plants that tripped were main-tained in a safe shutdown condition until theirrestart.
� The nuclear power plants did not trigger thepower system outage or inappropriately con-tribute to its spread (i.e., to an extent beyond thenormal tripping of the plants at expected condi-tions). Rather, they responded as anticipated inorder to protect equipment and systems fromthe grid disturbances.
� For nuclear plants in the United States:
� Fermi 2, Oyster Creek, and Perry tripped dueto main generator trips, which resulted fromvoltage and frequency fluctuations on thegrid. Nine Mile 1 tripped due to a main tur-bine trip due to frequency fluctuations on thegrid.
� U.S.-Canada Power System Outage Task Force � Causes of the August 14th Blackout � 75

� FitzPatrick and Nine Mile 2 tripped due toreactor trips, which resulted from turbinecontrol system low pressure due to frequencyfluctuations on the grid. Ginna tripped due toa reactor trip which resulted from a large lossof electrical load due to frequency fluctua-tions on the grid. Indian Point 2 and IndianPoint 3 tripped due to a reactor trip on lowflow, which resulted when low grid fre-quency tripped reactor coolant pumps.
� For nuclear plants in Canada:
� At Bruce B and Pickering B, frequency and/orvoltage fluctuations on the grid resulted inthe automatic disconnection of generatorsfrom the grid. For those units that were suc-cessful in maintaining the unit generatorsoperational, reactor power was automaticallyreduced.
� At Darlington, load swing on the grid led tothe automatic reduction in power of the fourreactors. The generators were, in turn, auto-matically disconnected from the grid.
� Three reactors at Bruce B and one at Darling-ton were returned to 60% power. These reac-tors were available to deliver power to thegrid on the instructions of the transmissionsystem operator.
� Three units at Darlington were placed in azero-power hot state, and four units atPickering B and one unit at Bruce B wereplaced in a Guaranteed Shutdown State.
The licensees’ return to power operation follows adeliberate process controlled by plant proceduresand regulations. Equipment and process prob-lems, whether existing prior to or caused by theevent, would normally be addressed prior torestart. The NWG is satisfied that licensees took anappropriately conservative approach to theirrestart activities, placing a priority on safety.
� For U.S. nuclear plants: Ginna, Indian Point 2,Nine Mile 2, and Oyster Creek resumed electri-cal generation on August 17. FitzPatrick andNine Mile 1 resumed electrical generation onAugust 18. Fermi 2 resumed electrical genera-tion on August 20. Perry resumed electrical gen-eration on August 21. Indian Point 3 resumedelectrical generation on August 22. Indian Point3 had equipment issues (failed splices in thecontrol rod drive mechanism power system)that required repair prior to restart. Ginnasubmitted a special request for enforcement
discretion from the NRC to permit modechanges and restart with an inoperable auxil-iary feedwater pump. The NRC granted therequest for enforcement discretion.
� For Canadian nuclear plants: The restart of theCanadian nuclear plants was carried out inaccordance with approved Operating Policiesand Principles. Three units at Bruce B and oneat Darlington were resynchronized with the gridwithin 6 hours of the event. The remainingthree units at Darlington were reconnected byAugust 17 and 18. Units 5, 6, and 8 at PickeringB and Unit 6 at Bruce B returned to servicebetween August 22 and August 25.
The NWG has found no evidence that the shut-down of the nuclear power plants triggered theoutage or inappropriately contributed to its spread(i.e., to an extent beyond the normal tripping ofthe plants at expected conditions). All the nuclearplants that shut down or disconnected from thegrid responded automatically to grid conditions.All the nuclear plants responded in a manner con-sistent with the plant designs. Safety functionswere effectively accomplished, and the nuclearplants that tripped were maintained in a safe shut-down condition until their restart.
Additional details are available in the followingsections. Due to the major design differencesbetween nuclear plants in Canada and the UnitedStates, the decision was made to have separatesections for each country. This also facilitates therequest by the nuclear regulatory agencies in bothcountries to have sections of the report that standalone, so that they can also be used as regulatorydocuments.
Findings of the U.S. NuclearWorking Group
Summary
The U.S. NWG has found no evidence that theshutdown of the nine U.S. nuclear power plantstriggered the outage, or inappropriately contrib-uted to its spread (i.e., to an extent beyond the nor-mal tripping of the plants at expected conditions).All nine plants that experienced a reactor tripwere responding to grid conditions. The severityof the grid transient caused generators, turbines,or reactor systems at the plants to reach a protec-tive feature limit and actuate a plant shutdown.All nine plants tripped in response to thoseconditions in a manner consistent with the plant
76 � U.S.-Canada Power System Outage Task Force � Causes of the August 14th Blackout �

designs. The nine plants automatically shut downin a safe fashion to protect the plants from the gridtransient. Safety functions were effectivelyaccomplished with few problems, and the plantswere maintained in a safe shutdown conditionuntil their restart.
The nuclear power plant outages that resultedfrom the August 14, 2003, power outage were trig-gered by automatic protection systems for thereactors or turbine-generators, not by any manualoperator actions. The NWG has received no infor-mation that points to operators deliberately shut-ting down nuclear units to isolate themselves frominstabilities on the grid. In short, only automaticseparation of nuclear units occurred.
Regarding the 95 other licensed commercialnuclear power plants in the United States: 4 werealready shut down at the time of the power outage,one of which experienced a grid disturbance; 70operating plants observed some level of grid dis-turbance but accommodated the disturbances andremained on line, supplying power to the grid; and21 operating plants did not experience any griddisturbance.
Introduction
In response to the August 14 power outage, theUnited States and Canada established a jointPower System Outage Task Force. Although manynon-nuclear power plants were involved in thepower outage, concerns about the nuclear powerplants are being specifically addressed by theNWG in supporting of the joint Task Force. TheTask Force was tasked with answering twoquestions:
1. What happened on August 14, 2003, to causethe transmission system to fail resulting in thepower outage, and why?
2. Why was the system not able to stop the spreadof the outage?
The NRC, which regulates U.S. commercialnuclear power plants, has regulatory requirementsfor offsite power systems. These requirementsaddress the number of offsite power sources andthe ability to withstand certain transients. Offsitepower is the normal source of alternating current(AC) power to the safety systems in the plantswhen the plant main generator is not in operation.The requirements also are designed to protectsafety systems from potentially damaging varia-tions (in voltage and frequency) in the supplied
power. For loss of offsite power events, the NRCrequires emergency generation (typically emer-gency diesel generators) to provide AC power tosafety systems. In addition, the NRC providesoversight of the safety aspects of offsite powerissues through its inspection program, by moni-toring operating experience, and by performingtechnical studies.
Phase I: Fact Finding
Phase I of the NWG effort focused on collectingand analyzing data from each plant to determinewhat happened, and whether any activities at theplants caused or contributed to the power outageor its spread or involved a significant safety issue.To ensure accuracy, a comprehensive coordina-tion effort is ongoing among the working groupmembers and between the NWG, ESWG, andSWG.
The staff developed a set of technical questions toobtain data from the owners or licensees of thenuclear power plants that would enable them toreview the response of the nuclear plant systemsin detail. Two additional requests for more spe-cific information were made for certain plants.The collection of information from U.S. nuclearpower plants was gathered through the NRCregional offices, which had NRC resident inspec-tors at each plant obtain licensee information toanswer the questions. General design informationwas gathered from plant-specific Updated FinalSafety Analysis Reports and other documents.
Plant data were compared against plant designs bythe NRC staff to determine whether the plantresponses were as expected; whether theyappeared to cause the power outage or contributedto the spread of the outage; and whether applica-ble safety requirements were met. In some casessupplemental questions were developed, andanswers were obtained from the licensees to clar-ify the observed response of the plant. The NWGinterfaced with the ESWG to validate some dataand to obtain grid information, which contributedto the analysis. The NWG has identified relevantactions by nuclear generating facilities in connec-tion with the power outage.
Typical Design, Operational, andProtective Features of U.S. NuclearPower Plants
Nuclear power plants have a number of design,operational, and protective features to ensure that
� U.S.-Canada Power System Outage Task Force � Causes of the August 14th Blackout � 77

the plants operate safely and reliably. This sectiondescribes these features so as to provide a betterunderstanding of how nuclear power plants inter-act with the grid and, specifically, how nuclearpower plants respond to changing grid conditions.While the features described in this section aretypical, there are differences in the design andoperation of individual plants which are notdiscussed.
Design Features of Nuclear Power Plants
Nuclear power plants use heat from nuclear reac-tions to generate steam and use a single steam-driven turbine-generator (also known as the maingenerator) to produce electricity supplied to thegrid.
Connection of the plant switchyard to the grid.The plant switchyard normally forms the interfacebetween the plant main generator and the electri-cal grid. The plant switchyard has multiple trans-mission lines connected to the grid system to meetoffsite power supply requirements for having reli-able offsite power for the nuclear station under alloperating and shutdown conditions. Each trans-mission line connected to the switchyard has ded-icated circuit breakers, with fault sensors, toisolate faulted conditions in the switchyard or theconnected transmission lines, such as phase-to-phase or phase-to-ground short circuits. The faultsensors are fed into a protection scheme for theplant switchyard that is engineered to localizeany faulted conditions with minimum systemdisturbance.
Connection of the main generator to the switch-yard. The plant main generator produces electri-cal power and transmits that power to the offsitetransmission system. Most plants also supplypower to the plant auxiliary buses for normaloperation of the nuclear generating unit throughthe unit auxiliary transformer. During normalplant operation, the main generator typically gen-erates electrical power at about 22 kV. The voltageis increased to match the switchyard voltage bythe main transformers, and the power flows to thehigh voltage switchyard through two power cir-cuit breakers.
Power supplies for the plant auxiliary buses. Thesafety-related and nonsafety auxiliary buses arenormally lined up to receive power from the maingenerator auxiliary transformer, although someplants leave some of their auxiliary buses poweredfrom a startup transformer (that is, from the offsitepower distribution system). When plant powergeneration is interrupted, the power supply
automatically transfers to the offsite power source(the startup transformer). If that is not supplyingacceptable voltage, the circuit breakers to thesafety-related buses open, and the buses arereenergized by the respective fast-starting emer-gency diesel generators. The nonsafety auxiliarybuses will remain deenergized until offsite poweris restored.
Operational Features of Nuclear Power Plants
Response of nuclear power plants to changes inswitchyard voltage. With the main generator volt-age regulator in the automatic mode, the generatorwill respond to an increase of switchyard voltageby reducing the generator field excitation current.This will result in a decrease of reactive power,normally measured as mega-volts-amperes-reac-tive (MVAR) from the generator to the switchyardand out to the surrounding grid, helping to controlthe grid voltage increase. With the main generatorvoltage regulator in the automatic mode, the gen-erator will respond to a decrease of switchyardvoltage by increasing the generator field excitationcurrent. This will result in an increase of reactivepower (MVAR) from the generator to theswitchyard and out to the surrounding grid, help-ing to control the grid voltage decrease. If theswitchyard voltage goes low enough, theincreased generator field current could result ingenerator field overheating. Over-excitation pro-tective circuitry is generally employed to preventthis from occurring. This protective circuitry maytrip the generator to prevent equipment damage.
Under-voltage protection is provided for thenuclear power plant safety buses, and may be pro-vided on nonsafety buses and at individual piecesof equipment. It is also used in some pressurizedwater reactor designs on reactor coolant pumps(RCPs) as an anticipatory loss of RCP flow signal.
Protective Features of Nuclear Power Plants
The main generator and main turbine have protec-tive features, similar to fossil generating stations,which protect against equipment damage. In gen-eral, the reactor protective features are designed toprotect the reactor fuel from damage and to protectthe reactor coolant system from over-pressure orover-temperature transients. Some trip featuresalso produce a corresponding trip in other compo-nents; for example, a turbine trip typically resultsin a reactor trip above a low power setpoint.
Generator protective features typically includeover-current, ground detection, differential relays(which monitor for electrical fault conditions
78 � U.S.-Canada Power System Outage Task Force � Causes of the August 14th Blackout �

within a zone of protection defined by the locationof the sensors, typically the main generator and alltransformers connected directly to the generatoroutput), electrical faults on the transformers con-nected to the generator, loss of the generator field,and a turbine trip. Turbine protective features typ-ically include over-speed (usually set at 1980 rpmor 66 Hz), low bearing oil pressure, high bearingvibration, degraded condenser vacuum, thrustbearing failure, or generator trip. Reactor protec-tive features typically include trips for over-power, abnormal pressure in the reactor coolantsystem, low reactor coolant system flow, low levelin the steam generators or the reactor vessel, or atrip of the turbine.
Considerations on Returning a U.S.Nuclear Power Plant to PowerProduction After Switchyard VoltageIs Restored
The following are examples of the types of activi-ties that must be completed before returning anuclear power plant to power production follow-ing a loss of switchyard voltage.
� Switchyard voltage must be normal and stablefrom an offsite supply. Nuclear power plants arenot designed for black-start capability (the abil-ity to start up without external power).
� Plant buses must be energized from theswitchyard and the emergency diesel genera-tors restored to standby mode.
� Normal plant equipment, such as reactor cool-ant pumps and circulating water pumps, mustbe restarted.
� A reactor trip review report must be completedand approved by plant management, and thecause of the trip must be addressed.
� All plant technical specifications must be satis-fied. Technical specifications are issued to eachnuclear power plant as part of their license bythe NRC. They dictate equipment which mustbe operable and process parameters which mustbe met to allow operation of the reactor. Exam-ples of actions that were required following theevents of August 14 include refilling the dieselfuel oil storage tanks, refilling the condensatestorage tanks, establishing reactor coolant sys-tem forced flow, and cooling the suppressionpool to normal operating limits. Surveillancetests must be completed as required by techni-cal specifications (for example, operability of
the low-range neutron detectors must bedemonstrated).
� Systems must be aligned to support the startup.
� Pressures and temperatures for reactor startupmust be established in the reactor coolant sys-tem for pressurized water reactors.
� A reactor criticality calculation must be per-formed to predict the control rod withdrawalsneeded to achieve criticality, where the fissionchain reaction becomes self-sustaining due tothe increased neutron flux. Certain neutron-absorbing fission products increase in concen-tration following a reactor trip (followed laterby a decrease or decay). At pressurized waterreactors, the boron concentration in the primarycoolant must be adjusted to match the criticalitycalculation. Near the end of the fuel cycle, thenuclear power plant may not have enoughboron adjustment or control rod worth availablefor restart until the neutron absorbers havedecreased significantly (more than 24 hoursafter the trip).
It may require about a day or more before a nuclearpower plant can restart following a normal trip.Plant trips are a significant transient on plantequipment, and some maintenance may be neces-sary before the plant can restart. When combinedwith the infrequent event of loss of offsite power,additional recovery actions will be required.Safety systems, such as emergency diesel genera-tors and safety-related decay heat removal sys-tems, must be restored to normal lineups. Theseadditional actions would extend the time neces-sary to restart a nuclear plant from this type ofevent.
Summary of U.S. Nuclear Power PlantResponse to and Safety During theAugust 14 Outage
The NWG’s review has not identified any activityor equipment issues at nuclear power plants thatcaused the transient on August 14, 2003. Ninenuclear power plants tripped within about 60 sec-onds as a result of the grid disturbance. Addi-tionally, many nuclear power plants experienceda transient due to this grid disturbance.
Nuclear Power Plants That Tripped
The trips at nine nuclear power plants resultedfrom the plant responses to the grid disturbances.Following the initial grid disturbances, voltages inthe plant switchyard fluctuated and reactive
� U.S.-Canada Power System Outage Task Force � Causes of the August 14th Blackout � 79

power flows fluctuated. As the voltage regulatorson the main generators attempted to compensate,equipment limits were exceeded and protectivetrips resulted. This happened at Fermi 2 and Oys-ter Creek. Fermi 2 tripped on a generator field pro-tection trip. Oyster Creek tripped due to agenerator trip on high ratio of voltage relative tothe electrical frequency.
Also, as the balance between electrical generationand electrical load on the grid was disturbed, theelectrical frequency began to fluctuate. In somecases the electrical frequency dropped lowenough to actuate protective features. This hap-pened at Indian Point 2, Indian Point 3, and Perry.Perry tripped due to a generator under-frequencytrip signal. Indian Point 2 and Indian Point 3 trip-ped when the grid frequency dropped low enoughto trip reactor coolant pumps, which actuated areactor protective feature.
In other cases, the electrical frequency fluctuatedand went higher than normal. Turbine control sys-tems responded in an attempt to control the fre-quency. Equipment limits were exceeded as aresult of the reaction of the turbine control sys-tems to large frequency changes. This led to tripsat FitzPatrick, Nine Mile 1, Nine Mile 2, andGinna. FitzPatrick and Nine Mile 2 tripped on lowpressure in the turbine hydraulic control oil sys-tem. Nine Mile 1 tripped on turbine light load pro-tection. Ginna tripped due to conditions in thereactor following rapid closure of the turbine con-trol valves in response to high frequency on thegrid.
The Perry, Fermi 2, Oyster Creek, and Nine Mile 1reactors tripped immediately after the generatortripped, although that is not apparent from thetimes below, because the clocks were not synchro-nized to the national time standard. The IndianPoint 2 and 3, FitzPatrick, Ginna, and Nine Mile 2reactors tripped before the generators. When thereactor trips first, there is generally a short timedelay before the generator output breakers open.The electrical generation decreases rapidly to zeroafter the reactor trip. Table 7.1 provides the timesfrom the data collected for the reactor trip times,and the time the generator output breakers opened(generator trip), as reported by the ESWG. Addi-tional details on the plants that tripped are givenbelow.
Fermi 2. Fermi 2 is located 25 miles northeast ofToledo, Ohio, in southern Michigan on Lake Erie.It was generating about 1,130 megawatts-electric(MWe) before the event. The reactor tripped due to
a turbine trip. The turbine trip was likely theresult of multiple generator field protection trips(over-excitation and loss of field) as the Fermi 2generator responded to a series of rapidly chang-ing transients prior to its loss. This is consistentwith data that shows large swings of the Fermi 2generator MVARs prior to its trip.
Offsite power was subsequently lost to the plantauxiliary buses. The safety buses were de-energized and automatically reenergized from theemergency diesel generators. The operators trip-ped one emergency diesel generator that wasparalled to the grid for testing, after which it auto-matically loaded. Decay heat removal systemsmaintained the cooling function for the reactorfuel.
The lowest emergency declaration, an UnusualEvent, was declared at about 16:22 EDT due to theloss of offsite power. Offsite power was restored toat least one safety bus at about 01:53 EDT onAugust 15. The following equipment problemswere noted: the Combustion Turbine Generator(the alternate AC power source) failed to start fromthe control room; however, it was successfullystarted locally. In addition, the Spent Fuel PoolCooling System was interrupted for approxi-mately 26 hours and reached a maximum temper-ature of 130 degrees Fahrenheit (55 degreesCelsius). The main generator was reconnected tothe grid at about 01:41 EDT on August 20.
FitzPatrick. FitzPatrick is located about 8 milesnortheast of Oswego, NY, in northern New Yorkon Lake Ontario. It was generating about 850 MWebefore the event. The reactor tripped due to lowpressure in the hydraulic system that controls theturbine control valves. Low pressure in this sys-tem typically indicates a large load reject, for
80 � U.S.-Canada Power System Outage Task Force � Causes of the August 14th Blackout �
Table 7.1. U.S. Nuclear Plant Trip TimesNuclear Plant Reactor Trip a Generator Trip b
Perry . . . . . . . . . 16:10:25 EDT 16:10:42 EDT
Fermi 2 . . . . . . . 16:10:53 EDT 16:10:53 EDT
Oyster Creek . . . 16:10:58 EDT 16:10:57 EDT
Nine Mile 1 . . . . 16:11 EDT 16:11:04 EDT
Indian Point 2 . . 16:11 EDT 16:11:09 EDT
Indian Point 3 . . 16:11 EDT 16:11:23 EDT
FitzPatrick . . . . . 16:11:04 EDT 16:11:32 EDT
Ginna. . . . . . . . . 16:11:36 EDT 16:12:17 EDT
Nine Mile 2 . . . . 16:11:48 EDT 16:11:52 EDTaAs determined from licensee data (which may not be syn-
chronized to the national time standard).bAs reported by the Electrical System Working Group (syn-
chronized to the national time standard).

which a reactor trip is expected. In this case thepressure in the system was low because the con-trol system was rapidly manipulating the turbinecontrol valves to control turbine speed, which wasbeing affected by grid frequency fluctuations.
Immediately preceding the trip, both significantover-voltage and under-voltage grid conditionswere experienced. Offsite power was subse-quently lost to the plant auxiliary buses. Thesafety buses were deenergized and automaticallyreenergized from the emergency diesel generators.
The lowest emergency declaration, an UnusualEvent, was declared at about 16:26 EDT due to theloss of offsite power. Decay heat removal systemsmaintained the cooling function for the reactorfuel. Offsite power was restored to at least onesafety bus at about 23:07 EDT on August 14. Themain generator was reconnected to the grid atabout 06:10 EDT on August 18.
Ginna. Ginna is located 20 miles northeast ofRochester, NY, in northern New York on LakeOntario. It was generating about 487 MWe beforethe event. The reactor tripped due to Over-Temperature-Delta-Temperature. This trip signalprotects the reactor core from exceeding tempera-ture limits. The turbine control valves closeddown in response to the changing grid conditions.This caused a temperature and pressure transientin the reactor, resulting in an Over-Temperature-Delta-Temperature trip.
Offsite power was not lost to the plant auxiliarybuses. In the operators’ judgement, offsite powerwas not stable, so they conservatively energizedthe safety buses from the emergency diesel genera-tors. Decay heat removal systems maintained thecooling function for the reactor fuel. Offsite powerwas not lost, and stabilized about 50 minutes afterthe reactor trip.
The lowest emergency declaration, an UnusualEvent, was declared at about 16:46 EDT due to thedegraded offsite power. Offsite power wasrestored to at least one safety bus at about 21:08EDT on August 14. The following equipmentproblems were noted: the digital feedwater controlsystem behaved in an unexpected manner follow-ing the trip, resulting in high steam generator lev-els; there was a loss of RCP seal flow indication,which complicated restarting the pumps; and atleast one of the power-operated relief valves expe-rienced minor leakage following proper operationand closure during the transient. Also, one of themotor-driven auxiliary feedwater pumps was
damaged after running with low flow conditionsdue to an improper valve alignment. The redun-dant pumps supplied the required water flow.
The NRC issued a Notice of Enforcement Discre-tion to allow Ginna to perform mode changes andrestart the reactor with one auxiliary feedwater(AFW) pump inoperable. Ginna has two AFWpumps, one turbine-driven AFW pump, and twostandby AFW pumps, all powered from safety-related buses. The main generator was recon-nected to the grid at about 20:38 EDT on August17.
Indian Point 2. Indian Point 2 is located 24 milesnorth of New York City on the Hudson River. Itwas generating about 990 MWe before the event.The reactor tripped due to loss of a reactor coolantpump that tripped because the auxiliary bus fre-quency fluctuations actuated the under-frequencyrelay, which protects against inadequate coolantflow through the reactor core. This reactor protec-tion signal tripped the reactor, which resulted inturbine and generator trips.
The auxiliary bus experienced the under-frequency due to fluctuating grid conditions.Offsite power was lost to all the plant auxiliarybuses. The safety buses were reenergized from theemergency diesel generators. Decay heat removalsystems maintained the cooling function for thereactor fuel.
The lowest emergency declaration, an UnusualEvent, was declared at about 16:25 EDT due to theloss of offsite power for more than 15 minutes.Offsite power was restored to at least one safetybus at about 20:02 EDT on August 14. The follow-ing equipment problems were noted: the servicewater to one of the emergency diesel generatorsdeveloped a leak; a steam generator atmosphericdump valve did not control steam generator pres-sure in automatic and had to be shifted to manual;a steam trap associated with the turbine-drivenAFW pump failed open, resulting in operatorssecuring the turbine after 2.5 hours; loss of instru-ment air required operators to take manual controlof charging and a letdown isolation occurred; andoperators in the field could not use radios. Themain generator was reconnected to the grid atabout 12:58 EDT on August 17.
Indian Point 3. Indian Point 3 is located 24 milesnorth of New York City on the Hudson River. Itwas generating about 1,010 MWe before the event.The reactor tripped due to loss of a reactor coolantpump that tripped because the auxiliary bus
� U.S.-Canada Power System Outage Task Force � Causes of the August 14th Blackout � 81

frequency fluctuations actuated the under-frequency relay, which protects against inade-quate coolant flow through the reactor core. Thisreactor protection signal tripped the reactor,which resulted in turbine and generator trips.
The auxiliary bus experienced the under-frequency due to fluctuating grid conditions.Offsite power was lost to all the plant auxiliarybuses. The safety buses were reenergized from theemergency diesel generators. Decay heat removalsystems maintained the cooling function for thereactor fuel.
The lowest emergency declaration, an UnusualEvent, was declared at about 16:23 EDT due to theloss of offsite power for more than 15 minutes.Offsite power was restored to at least one safetybus at about 20:12 EDT on August 14. The follow-ing equipment problems were noted: a steam gen-erator safety valve lifted below its desired setpointand was gagged; loss of instrument air, includingfailure of the diesel backup compressor to startand failure of the backup nitrogen system,resulted in manual control of atmospheric dumpvalves and AFW pumps needing to be secured toprevent overfeeding the steam generators; a blownfuse in a battery charger resulted in a longer bat-tery discharge; a control rod drive mechanismcable splice failed, and there were high resistancereadings on 345-kV breaker-1. These equipmentproblems required correction prior to start-up,which delayed the startup. The main generatorwas reconnected to the grid at about 05:03 EDT onAugust 22.
Nine Mile 1. Nine Mile 1 is located 6 miles north-east of Oswego, NY, in northern New York on LakeOntario. It was generating about 600 MWe beforethe event. The reactor tripped in response to a tur-bine trip. The turbine tripped on light load protec-tion (which protects the turbine against a loss ofelectrical load), when responding to fluctuatinggrid conditions. The turbine trip caused fast clo-sure of the turbine valves, which, through acceler-ation relays on the control valves, create a signal totrip the reactor. After a time delay of 10 seconds,the generator tripped on reverse power.
The safety buses were automatically deenergizeddue to low voltage and automatically reenergizedfrom the emergency diesel generators. Decay heatremoval systems maintained the cooling functionfor the reactor fuel.
The lowest emergency declaration, an UnusualEvent, was declared at about 16:33 EDT due to the
degraded offsite power. Offsite power wasrestored to at least one safety bus at about 23:39EDT on August 14. The following additionalequipment problems were noted: a feedwaterblock valve failed “as is” on the loss of voltage,resulting in a high reactor vessel level; fuses blewin fire circuits, causing control room ventilationisolation and fire panel alarms; and operators weredelayed in placing shutdown cooling in service forseveral hours due to lack of procedure guidance toaddress particular plant conditions encounteredduring the shutdown. The main generator wasreconnected to the grid at about 02:08 EDT onAugust 18.
Nine Mile 2. Nine Mile 2 is located 6 miles north-east of Oswego, NY, in northern New York on LakeOntario. It was generating about 1,193 MWebefore the event. The reactor scrammed due to theactuation of pressure switches which detected lowpressure in the hydraulic system that controls theturbine control valves. Low pressure in this sys-tem typically indicates a large load reject, forwhich a reactor trip is expected. In this case thepressure in the system was low because the con-trol system was rapidly manipulating the turbinecontrol valves to control turbine speed, which wasbeing affected by grid frequency fluctuations.
After the reactor tripped, several reactor level con-trol valves did not reposition, and with the mainfeedwater system continuing to operate, a highwater level in the reactor caused a turbine trip,which caused a generator trip. Offsite power wasdegraded but available to the plant auxiliarybuses. The offsite power dropped below the nor-mal voltage levels, which resulted in the safetybuses being automatically energized from theemergency diesel generators. Decay heat removalsystems maintained the cooling function for thereactor fuel.
The lowest emergency declaration, an UnusualEvent, was declared at about 17:00 EDT due to theloss of offsite power to the safety buses for morethan 15 minutes. Offsite power was restored to atleast one safety bus at about 01:33 EDT on August15. The following additional equipment problemwas noted: a tap changer on one of the offsitepower transformers failed, complicating the resto-ration of one division of offsite power. The maingenerator was reconnected to the grid at about19:34 EDT on August 17.
Oyster Creek. Oyster Creek is located 9 milessouth of Toms River, NJ, near the Atlantic Ocean.It was generating about 629 MWe before the event.
82 � U.S.-Canada Power System Outage Task Force � Causes of the August 14th Blackout �

The reactor tripped due to a turbine trip. The tur-bine trip was the result of a generator trip due toactuation of a high Volts/Hz protective trip. TheVolts/Hz trip is a generator/transformer protectivefeature. The plant safety and auxiliary buses trans-ferred from the main generator supply to theoffsite power supply following the plant trip.Other than the plant transient, no equipment orperformance problems were determined to bedirectly related to the grid problems.
Post-trip the operators did not get the mode switchto shutdown before main steam header pressurereached its isolation setpoint. The resulting MSIVclosure complicated the operator’s responsebecause the normal steam path to the main con-denser was lost. The operators used the isolationcondensers for decay heat removal. The plantsafety and auxiliary buses remained energizedfrom offsite power for the duration of the event,and the emergency diesel generators were notstarted. Decay heat removal systems maintainedthe cooling function for the reactor fuel. The maingenerator was reconnected to the grid at about05:02 EDT on August 17.
Perry. Perry is located 7 miles northeast of Paines-ville, OH, in northern Ohio on Lake Erie. It wasgenerating about 1,275 MWe before the event. Thereactor tripped due to a turbine control valve fastclosure trip signal. The turbine control valve fastclosure trip signal was due to a generator under-frequency trip signal that tripped the generatorand the turbine and was triggered by grid fre-quency fluctuations. Plant operators noted voltagefluctuations and spikes on the main transformer,and the Generator Out-of-Step Supervisory relayactuated approximately 30 minutes before thetrip. This supervisory relay senses a ground faulton the grid. The purpose is to prevent a remotefault on the grid from causing a generator out-of-step relay to activate, which would result in a gen-erator trip. Approximately 30 seconds prior to thetrip operators noted a number of spikes on the gen-erator field volt meter, which subsequently wentoffscale high. The MVAR and MW meters likewisewent offscale high.
The safety buses were deenergized and automati-cally reenergized from the emergency diesel gen-erators. Decay heat removal systems maintainedthe cooling function for the reactor fuel. The fol-lowing equipment problems were noted: a steambypass valve opened; a reactor water clean-up sys-tem pump tripped; the off-gas system isolated, anda keep-fill pump was found to be air-bound,
requiring venting and filling before the residualheat removal system loop A and the low pressurecore spray system could be restored to service.
The lowest emergency declaration, an UnusualEvent, was declared at about 16:20 EDT due to theloss of offsite power. Offsite power was restored toat least one safety bus at about 18:13 EDT onAugust 14. The main generator was reconnectedto the grid at about 23:15 EDT on August 21. Afterthe plant restarted, a surveillance test indicated aproblem with one emergency diesel generator. AnNRC special inspection is in progress, reviewingemergency diesel generator performance and thekeep-fill system.
Nuclear Power Plants With a SignificantTransient
The electrical disturbance on August 14 had a sig-nificant impact on seven plants that continued toremain connected to the grid. For this review, sig-nificant impact means that these plants had signif-icant load adjustments that resulted in bypassingsteam from the turbine generator, opening of reliefvalves, or requiring the onsite emergency dieselgenerators to automatically start due to lowvoltage.
Nuclear Power Plants With a Non-SignificantTransient
Sixty-four nuclear power plants experiencednon-significant transients caused by minor distur-bances on the electrical grid. These plants wereable to respond to the disturbances through nor-mal control systems. Examples of these transientsincluded changes in load of a few megawatts orchanges in frequency of a few-tenths Hz.
Nuclear Power Plants With No Transient
Twenty-four nuclear power plants experienced notransient and saw essentially no disturbances onthe grid, or were shut down at the time of thetransient.
General Observations Based on the FactsFound During Phase One
The NWG has found no evidence that the shut-down of U.S. nuclear power plants triggered theoutage or inappropriately contributed to its spread(i.e., to an extent beyond the normal tripping ofthe plants at expected conditions). This review didnot identify any activity or equipment issues thatappeared to start the transient on August 14, 2003.All nine plants that experienced a reactor tripwere responding to grid conditions. The severity
� U.S.-Canada Power System Outage Task Force � Causes of the August 14th Blackout � 83

of the transient caused generators, turbines, orreactor systems to reach a protective feature limitand actuate a plant shutdown.
All nine plants tripped in response to those condi-tions in a manner consistent with the plantdesigns. All nine plants safely shut down. Allsafety functions were effectively accomplished,with few problems, and the plants were main-tained in a safe shutdown condition until theirrestart. Fermi 2, Nine Mile 1, Oyster Creek, andPerry tripped on turbine and generator protectivefeatures. FitzPatrick, Ginna, Indian Point 2 and 3,and Nine Mile 2 tripped on reactor protectivefeatures.
Nine plants used their emergency diesel genera-tors to power their safety-related buses during thepower outage. Offsite power was restored to thesafety buses after the grid was energized and theplant operators, in consultation with the transmis-sion system operators, decided the grid was stable.Although the Oyster Creek plant tripped, offsitepower was never lost to their safety buses and theemergency diesel generators did not start andwere not required. Another plant, Davis-Besse,was already shut down but lost power to the safetybuses. The emergency diesel generators startedand provided power to the safety buses asdesigned.
For the eight remaining tripped plants andDavis-Besse (which was already shut down priorto the events of August 14), offsite power wasrestored to at least one safety bus after a period oftime ranging from about 2 hours to about 14 hours,with an average time of about 7 hours. AlthoughGinna did not lose offsite power, the operatorsjudged offsite power to be unstable and realignedthe safety buses to the emergency diesel genera-tors. The second phase of the Power System Out-age Task Force will consider the implications ofthis in developing recommendations for futureimprovements.
The licensees’ return to power operation follows adeliberate process controlled by plant proceduresand NRC regulations. Ginna, Indian Point 2, NineMile 2, and Oyster Creek resumed electrical gener-ation on August 17. FitzPatrick and Nine Mile 1resumed electrical generation on August 18. Fermi2 resumed electrical generation on August 20.Perry resumed electrical generation on August 21.Indian Point 3 resumed electrical generation onAugust 22. Indian Point 3 had equipment issues(failed splices in the control rod drive mechanismpower system) that required repair prior to restart.
Ginna submitted a special request for enforcementdiscretion from the NRC to permit mode changesand restart with an inoperable auxiliary feedwaterpump. The NRC granted the request for enforce-ment discretion.
Findings of the Canadian NuclearWorking Group
Summary
On the afternoon of August 14, 2003, southernOntario, along with the northeastern UnitedStates, experienced a widespread electrical powersystem outage. Eleven nuclear power plants inOntario operating at high power levels at the timeof the event either automatically shut down as aresult of the grid disturbance or automaticallyreduced power while waiting for the grid to bereestablished. In addition, the Point LepreauNuclear Generating Station in New Brunswickwas forced to reduce electricity production for ashort period.
The Canadian NWG was mandated to: review thesequence of events for each Canadian nuclearplant; determine whether any events caused orcontributed to the power system outage; evaluateany potential safety issues arising as a result of theevent; evaluate the effect on safety and the reli-ability of the grid of design features, operating pro-cedures, and regulatory requirements at Canadiannuclear power plants; and assess the impact ofassociated regulator performance and regulatorydecisions.
In Ontario, 11 nuclear units were operating anddelivering power to the grid at the time of the griddisturbance: 4 at Bruce B, 4 at Darlington, and 3 atPickering B. Of the 11 reactors, 7 shut down as aresult of the event (1 at Bruce B, 3 at Darlington,and 3 at Pickering B). Four reactors (3 at Bruce Band 1 at Darlington) disconnected safely from thegrid but were able to avoid shutting down andwere available to supply power to the Ontario gridas soon as reconnection was enabled by Ontario’sIndependent Market Operator (IMO).
New Brunswick Power’s Point Lepreau GeneratingStation responded to the loss of grid event by cut-ting power to 460 MW, returning to fully stableconditions at 16:35 EDT, within 25 minutes of theevent. Hydro Québec’s (HQ) grid was not affectedby the power system outage, and HQ’s Gentilly-2nuclear station continued to operate normally.
84 � U.S.-Canada Power System Outage Task Force � Causes of the August 14th Blackout �

Having reviewed the operating data for each plantand the responses of the power stations and theirstaff to the event, the Canadian NWG concludesthe following:
� None of the reactor operators had any advancedwarning of impending collapse of the grid.
� Trend data obtained indicate stable condi-tions until a few minutes before the event.
� There were no prior warnings from Ontario’sIMO.
� Canadian nuclear power plants did not triggerthe power system outage or contribute to itsspread. Rather they responded, as anticipated,in order to protect equipment and systems fromthe grid disturbances. Plant data confirm thefollowing.
� At Bruce B and Pickering B, frequency and/orvoltage fluctuations on the grid resulted inthe automatic disconnection of generatorsfrom the grid. For those units that were suc-cessful in maintaining the unit generatorsoperational, reactor power was automaticallyreduced.
� At Darlington, load swing on the grid led tothe automatic reduction in power of the fourreactors. The generators were, in turn, auto-matically disconnected from the grid.
� Three reactors at Bruce B and one at Darling-ton were returned to 60% power. Theseractors were available to deliver power to thegrid on the instructions of the IMO.
� Three units at Darlington were placed in azero-power hot state, and four units atPickering B and one unit at Bruce B wereplaced in a guaranteed shutdown state.
� There were no risks to health and safety ofworkers or the public as a result of the shut-down of the reactors.
� Turbine, generator, and reactor automaticsafety systems worked as designed torespond to the loss of grid.
� Station operating staff and management fol-lowed approved Operating Policies & Princi-ples (OP&Ps) in responding to the loss of grid.At all times, operators and shift supervisorsmade appropriately conservative decisions infavor of protecting health and safety.
The Canadian NWG commends the staff ofOntario Power Generation and Bruce Power fortheir response to the power system outage. At all
times, staff acted in accordance with establishedOP&Ps, and took an appropriately conservativeapproach to decisions.
During the course of its review, the NWG alsoidentified the following secondary issues:
� Equipment problems and design limitations atPickering B resulted in a temporary reduction inthe effectiveness of some of the multiple safetybarriers, although the equipment failure waswithin the unavailability targets found in theOP&Ps approved by the CNSC as part of OntarioPower Generation’s licence.
� Existing OP&Ps place constraints on the use ofadjuster rods to respond to events involvingrapid reductions in reactor power. Whilegreater flexibility with respect to use of adjusterrods would not have prevented the shutdown,some units, particularly those at Darlington,might have been able to return to service lessthan 1 hour after the initiating event.
� Off-site power was unavailable for varying peri-ods of time, from approximately 3 hours atBruce B to approximately 9 hours at PickeringA. Despite the high priority assigned by the IMOto restoring power to the nuclear stations, thestations had some difficulty in obtaining timelyinformation about the status of grid recoveryand the restoration of Class IV power. Thisinformation is important for Ontario PowerGeneration’s and Bruce Power’s responsestrategy.
� Required regulatory approvals from CNSC staffwere obtained quickly and did not delay therestart of the units; however, CNSC staff wasunable to immediately activate the CNSC’sEmergency Operation Centre because of loss ofpower to the CNSC’s head office building.CNSC staff, therefore, established communica-tions with licensees and the U.S. NRC fromother locations.
Introduction
The primary focus of the Canadian NWG duringPhase I was to address nuclear power plantresponse relevant to the power outage of August14, 2003. Data were collected from each powerplant and analyzed in order to determine: thecause of the power outage; whether any activitiesat these plants caused or contributed to the poweroutage; and whether there were any significantsafety issues. In order to obtain reliable and com-parable information and data from each nuclear
� U.S.-Canada Power System Outage Task Force � Causes of the August 14th Blackout � 85

power plant, a questionnaire was developed tohelp pinpoint how each nuclear power plantresponded to the August 14 grid transients. Whereappropriate, additional information was obtainedfrom the ESWG and SWG.
The operating data from each plant were com-pared against the plant design specifications todetermine whether the plants responded asexpected. Based on initial plant responses to thequestionnaire, supplemental questions weredeveloped, as required, to further clarify outstand-ing matters. Supplementary information on thedesign features of Ontario’s nuclear power plantswas also provided by Ontario Power Generationand Bruce Power. The Canadian NWG also con-sulted a number of subject area specialists, includ-ing CNSC staff, to validate the responses to thequestionnaire and to ensure consistency in theirinterpretation.
Typical Design, Operational, andProtective Features of CANDU NuclearPower Plants
There are 22 CANDU nuclear power reactors inCanada—20 located in Ontario at 5 multi-unit sta-tions (Pickering A and Pickering B located inPickering, Darlington located in the Municipalityof Clarington, and Bruce A and Bruce B locatednear Kincardine). There are also single-unitCANDU stations at Bécancour, Québec (Gentilly-2), and Point Lepreau, New Brunswick.
In contrast to the pressurized water reactors usedin the United States, which use enriched uraniumfuel and a light water coolant-moderator, allhoused in a single, large pressure vessel, a CANDUreactor uses fuel fabricated from natural uranium,with heavy water as the coolant and moderator.The fuel and pressurized heavy water coolant arecontained in 380 to 480 pressure tubes housed in acalandria containing the heavy water moderatorunder low pressure. Heat generated by the fuel isremoved by heavy water coolant that flowsthrough the pressure tubes and is then circulatedto the boilers to produce steam from demineral-ized water.
While the use of natural uranium fuel offersimportant benefits from the perspectives of safe-guards and operating economics, one drawback isthat it restricts the ability of a CANDU reactor torecover from a large power reduction. In particu-lar, the lower reactivity of natural uranium fuelmeans that CANDU reactors are designed with a
small number of control rods (called “adjusterrods”) that are only capable of accommodatingpower reductions to 60%. The consequence of alarger power reduction is that the reactor will “poi-son out” and cannot be made critical for up to 2days following a power reduction. By comparison,the use of enriched fuel enables a typical pressur-ized water reactor to operate with a large numberof control rods that can be withdrawn to accom-modate power reductions to zero power.
A unique feature of some CANDU plants—namely, Bruce B and Darlington—is a capability tomaintain the reactor at 60% full power if the gen-erator becomes disconnected from the grid and tomaintain this “readiness” condition if necessaryfor days. Once reconnected to the grid, the unitcan be loaded to 60% full power within severalminutes and can achieve full power within 24hours.
As with other nuclear reactors, CANDU reactorsnormally operate continuously at full powerexcept when shut down for maintenance andinspections. As such, while they provide a stablesource of baseload power generation, they cannotprovide significant additional power in responseto sudden increases in demand. CANDU powerplants are not designed for black-start operation;that is, they are not designed to start up in theabsence of power from the grid.
Electrical Distribution Systems
The electrical distribution systems at nuclearpower plants are designed to satisfy the highsafety and reliability requirements for nuclear sys-tems. This is achieved through flexible busarrangements, high capacity standby power gener-ation, and ample redundancy in equipment.
Where continuous power is required, power issupplied either from batteries (for continuous DCpower, Class I) or via inverters (for continuous ACpower, Class II). AC supply for safety-relatedequipment, which can withstand short interrup-tion (on the order of 5 minutes), is provided byClass III power. Class III power is nominally sup-plied through Class IV; when Class IV becomesunavailable, standby generators are started auto-matically, and the safety-related loads are pickedup within 5 minutes of the loss of Class IV power.
The Class IV power is an AC supply to reactorequipment and systems that can withstand longerinterruptions in power. Class IV power can be sup-plied either from the generator through a
86 � U.S.-Canada Power System Outage Task Force � Causes of the August 14th Blackout �

transformer or from the grid by another trans-former. Class IV power is not required for reactorsto shut down safely.
In addition to the four classes of power describedabove, there is an additional source of powerknown as the Emergency Power System (EPS).EPS is a separate power system consisting of itsown on-site power generation and AC and DC dis-tribution systems whose normal supply is fromthe Class III power system. The purpose of the EPSsystem is to provide power to selected safety-related loads following common mode incidents,such as seismic events.
Protective Features of CANDU Nuclear PowerPlants
CANDU reactors typically have two separate,independent and diverse systems to shut downthe reactor in the event of an accident or transientsin the grid. Shutdown System 1 (SDS1) consists ofa large number of cadmium rods that drop into thecore to decrease the power level by absorbing neu-trons. Shutdown System 2 (SDS2) consists ofhigh-pressure injection of gadolinium nitrate intothe low-pressure moderator to decrease the powerlevel by absorbing neutrons. Although Pickering Adoes not have a fully independent SDS2, it doeshave a second shutdown mechanism, namely, thefast drain of the moderator out of the calandria;removal of the moderator significantly reduces therate of nuclear fission, which reduces reactorpower. Also, additional trip circuits and shutoffrods have recently been added to Pickering A Unit4 (Shutdown System Enhancement, or SDS-E).Both SDS1 and SDS2 are capable of reducing reac-tor power from 100% to about 2% within a fewseconds of trip initiation.
Fuel Heat Removal Features of CANDUNuclear Power Plants
Following the loss of Class IV power and shut-down of the reactor through action of SDS1 and/orSDS2, significant heat will continue to be gener-ated in the reactor fuel from the decay of fissionproducts. The CANDU design philosophy is toprovide defense in depth in the heat removalsystems.
Immediately following the trip and prior to resto-ration of Class III power, heat will be removedfrom the reactor core by natural circulation ofcoolant through the Heat Transport System maincircuit following rundown of the main Heat Trans-port pumps (first by thermosyphoning and later byintermittent buoyancy induced flow). Heat will be
rejected from the secondary side of the steam gen-erators through the atmospheric steam dischargevalves. This mode of operation can be sustainedfor many days with additional feedwater suppliedto the steam generators via the Class III poweredauxiliary steam generator feed pump(s).
In the event that the auxiliary feedwater systembecomes unavailable, there are two alternate EPSpowered water supplies to steam generators,namely, the Steam Generator Emergency CoolantSystem and the Emergency Service Water System.Finally, a separate and independent means ofcooling the fuel is by forced circulation by meansof the Class III powered shutdown cooling system;heat removal to the shutdown cooling heatexchangers is by means of the Class III poweredcomponents of the Service Water System.
CANDU Reactor Response toLoss-of-Grid Event
Response to Loss of Grid
In the event of disconnection from the grid, powerto safely shut down the reactor and maintainessential systems will be supplied from batteriesand standby generators. The specific response of areactor to disconnection from the grid will dependon the reactor design and the condition of the unitat the time of the event.
60% Reactor Power: All CANDU reactors aredesigned to operate at 60% of full power followingthe loss of off-site power. They can operate at thislevel as long as demineralized water is availablefor the boilers. At Darlington and Bruce B, steamcan be diverted to the condensers and recirculatedto the boilers. At Pickering A and Pickering B,excess steam is vented to the atmosphere, therebylimiting the operating time to the available inven-tory of demineralized water.
0% Reactor Power, Hot: The successful transitionfrom 100% to 60% power depends on several sys-tems responding properly, and continued opera-tion is not guaranteed. The reactor may shut downautomatically through the operation of the processcontrol systems or through the action of either ofthe shutdown systems.
Should a reactor shutdown occur following a loadrejection, both Class IV power supplies (from thegenerator and the grid) to that unit will becomeunavailable. The main Heat Transport pumpswill trip, leading to a loss of forced circulation ofcoolant through the core. Decay heat will be con-tinuously removed through natural circulation
� U.S.-Canada Power System Outage Task Force � Causes of the August 14th Blackout � 87

(thermosyphoning) to the boilers, and steam pro-duced in the boilers will be exhausted to theatmosphere via atmospheric steam dischargevalves. The Heat Transport System will be main-tained at around 250 to 265 degrees Celsius duringthermosyphoning. Standby generators will startautomatically and restore Class III power to keysafety-related systems. Forced circulation in theHeat Transport System will be restored onceeither Class III or Class IV power is available.
When shut down, the natural decay of fissionproducts will lead to the temporary buildup ofneutron absorbing elements in the fuel. If the reac-tor is not quickly restarted to reverse this naturalprocess, it will “poison-out.” Once poisoned-out,the reactor cannot return to operation until the fis-sion products have further decayed, a processwhich typically takes up to 2 days.
Overpoisoned Guaranteed Shutdown State: Inthe event that certain problems are identifiedwhen reviewing the state of the reactor after a sig-nificant transient, the operating staff will cooldown and depressurize the reactor, then place it inan overpoisoned guaranteed shutdown state (GSS)through the dissolution of gadolinium nitrate intothe moderator. Maintenance will then be initiatedto correct the problem.
Return to Service Following Loss of Grid
The return to service of a unit following any one ofthe above responses to a loss-of-grid event is dis-cussed below. It is important to note that thedescriptions provided relate to operations on asingle unit. At multi-unit stations, the return toservice of several units cannot always proceed inparallel, due to constraints on labor availabilityand the need to focus on critical evolutions, suchas taking the reactor from a subcritical to a criticalstate.
60% Reactor Power: In this state, the unit can beresynchronized consistent with system demand,and power can be increased gradually to fullpower over approximately 24 hours.
0% Reactor Power, Hot: In this state, after approx-imately 2 days for the poison-out, the turbine canbe run up and the unit synchronized. The reactormay shut down automatically through the opera-tion of the process control systems or through theaction of either of the shutdown systems. Thereaf-ter, power can be increased to high power over thenext day. This restart timeline does not includethe time required for any repairs or maintenancethat might have been necessary during the outage.
Overpoisoned Guaranteed Shutdown State: Plac-ing the reactor in a GSS after it has been shut downrequires approximately 2 days. Once the condi-tion that required entry to the GSS is rectified, therestart requires removal of the guarantee, removalof the gadolinium nitrate through ion exchangeprocess, heatup of the Heat Transport System, andfinally synchronization to the grid. Approximately4 days are required to complete these restart activ-ities. In total, 6 days from shutdown are requiredto return a unit to service from the GSS, and thisexcludes any repairs that might have beenrequired while in the GSS.
Summary of Canadian Nuclear PowerPlant Response to and Safety During theAugust 14 Outage
On the afternoon of August 14, 2003, 15 Canadiannuclear units were operating: 13 in Ontario, 1 inQuébec, and 1 in New Brunswick. Of the 13Ontario reactors that were critical at the time ofthe event, 11 were operating at or near full powerand 2 at low power (Pickering B Unit 7 andPickering A Unit 4). All 13 of the Ontario reactorsdisconnected from the grid as a result of the griddisturbance. Seven of the 11 reactors operating athigh power shut down, while the remaining 4operated in a planned manner that enabled themto remain available to reconnect to the grid at therequest of Ontario’s IMO. Of the 2 Ontario reactorsoperating at low power, Pickering A Unit 4 trippedautomatically, and Pickering B Unit 7 was trippedmanually and shut down. In addition, a transientwas experienced at New Brunswick Power’s PointLepreau Nuclear Generating Station, resulting in areduction in power. Hydro Québec’s Gentilly-2nuclear station continued to operate normally asthe Hydro Québec grid was not affected by the griddisturbance.
Nuclear Power Plants With SignificantTransients
Pickering Nuclear Generating Station. ThePickering Nuclear Generating Station (PNGS) islocated in Pickering, Ontario, on the shores ofLake Ontario, 30 kilometers east of Toronto. Ithouses 8 nuclear reactors, each capable of deliver-ing 515 MW to the grid. Three of the 4 units atPickering A (Units 1 through 3) have been shutdown since late 1997. Unit 4 was restarted earlierthis year following a major refurbishment and wasin the process of being commissioned at the timeof the event. At Pickering B, 3 units were operatingat or near 100% prior to the event, and Unit 7 was
88 � U.S.-Canada Power System Outage Task Force � Causes of the August 14th Blackout �

being started up following a planned maintenanceoutage.
Pickering A. As part of the commissioning process,Unit 4 at Pickering A was operating at 12% powerin preparation for synchronization to the grid. Thereactor automatically tripped on SDS1 due to HeatTransport Low Coolant Flow, when the HeatTransport main circulating pumps ran down fol-lowing the Class IV power loss. The decision wasthen made to return Unit 4 to the guaranteed shut-down state. Unit 4 was synchronized to the grid onAugust 20, 2003. Units 1, 2 and 3 were in lay-upmode.
Pickering B. The Unit 5 Generator Excitation Sys-tem transferred to manual control due to largevoltage oscillations on the grid at 16:10 EDT andthen tripped on Loss of Excitation about 1 secondlater (prior to grid frequency collapse). In responseto the generator trip, Class IV buses transferred tothe system transformer and the reactor setback.The grid frequency collapse caused the SystemService Transformer to disconnect from the grid,resulting in a total loss of Class IV power. Thereactor consequently tripped on the SDS1 LowGross Flow parameter followed by an SDS2 tripdue to Low Core Differential Pressure.
The Unit 6 Generator Excitation System alsotransferred to manual control at 16:10 EDT due tolarge voltage oscillations on the grid and the gen-erator remained connected to the grid in manualvoltage control. Approximately 65 seconds intothe event, the grid under-frequency caused all theClass IV buses to transfer to the Generator ServiceTransformer. Ten seconds later, the generator sep-arated from the Grid. Five seconds later, the gener-ator tripped on Loss of Excitation, which caused atotal loss of Class IV power. The reactor conse-quently tripped on the SDS1 Low Gross Flowparameter, followed by an SDS2 trip due to LowCore Differential Pressure.
Unit 7 was coming back from a planned mainte-nance outage and was at 0.9% power at the time ofthe event. The unit was manually tripped afterloss of Class IV power, in accordance with proce-dures and returned to guaranteed shutdown state.
Unit 8 reactor automatically set back on load rejec-tion. The setback would normally have been ter-minated at 20% power but continued to 2% powerbecause of the low boiler levels. The unit subse-quently tripped on the SDS1 Low Boiler FeedlinePressure parameter due to a power mismatchbetween the reactor and the turbine.
The following equipment problems were noted. AtPickering, the High Pressure Emergency CoolantInjection System (HPECIS) pumps are designed tooperate from a Class IV power supply. As a resultof the shutdown of all the operating units, theHPECIS at both Pickering A and Pickering Bbecame unavailable for 5.5 hours. (The operatinglicenses for Pickering A and Pickering B permitthe HPECIS to be unavailable for up to 8 hoursannually. This was the first unavailability of theyear.) In addition, Emergency High Pressure Ser-vice Water System restoration for all Pickering Bunits was delayed because of low suction pressuresupplying the Emergency High Pressure ServiceWater pumps. Manual operator intervention wasrequired to restore some pumps back to service.
Units were synchronized to the grid as follows:Unit 8 on August 22, Unit 5 on August 23, Unit 6on August 25, and Unit 7 on August 29.
Darlington Nuclear Generating Station. Fourreactors are located at the Darlington Nuclear Gen-eration Station, which is on the shores of LakeOntario in the Municipality of Clarington, 70 kilo-meters east of Toronto. All four of the reactors arelicensed to operate at 100% of full power, andeach is capable of delivering approximately 880MW to the grid.
Unit 1 automatically stepped back to the 60%reactor power state upon load rejection at 16:12EDT. Approval by the shift supervisor to automati-cally withdraw the adjuster rods could not be pro-vided due to the brief period of time for the shiftsupervisor to complete the verification of systemsas per procedure. The decreasing steam pressureand turbine frequency then required the reactor tobe manually tripped on SDS1, as per procedure forloss of Class IV power. The trip occurred at 16:24EDT, followed by a manual turbine trip due tounder-frequency concerns.
Like Unit 1, Unit 2 automatically stepped backupon load rejection at 16:12 EDT. As with Unit 1,there was insufficient time for the shift supervisorto complete the verification of systems, and facedwith decreasing steam pressure and turbine fre-quency, the decision was made to shut down Unit2. Due to under-frequency on the main PrimaryHeat Transport pumps, the turbine was trippedmanually which resulted in an SDS1 trip at 16:28EDT.
Unit 3 experienced a load rejection at 16:12 EDT,and during the stepback Unit 3 was able to sustainoperation with steam directed to the condensers.
� U.S.-Canada Power System Outage Task Force � Causes of the August 14th Blackout � 89
After system verifications were complete, approv-al to place the adjuster rods on automatic wasobtained in time to recover, at 59% reactor power.
The unit was available to resynchronize to thegrid. Unit 4 experienced a load rejection at 16:12EDT, and required a manual SDS1 trip due to theloss of Class II bus. This was followed by a manualturbine trip.
The following equipment problems were noted:Unit 4 Class II inverter trip on BUS A3 and subse-quent loss of critical loads prevented unit recov-ery. The Unit 0 Emergency Power System BUSB135 power was lost until the Class III power wasrestored. (A planned battery bank B135 changeout was in progress at the time of the blackout.)
Units were synchronized to the grid as follows:Unit 3 at 22:00 EDT on August 14; Unit 2 onAugust 17, 2003; Unit 1 on August 18, 2003; andUnit 4 on August 18, 2003.
Bruce Power. Eight reactors are located at BrucePower on the eastern shore of Lake Huron betweenKincardine and Port Elgin, Ontario. Units 5through 8 are capable of generating 840 MW each.Presently these reactors are operating at 90% offull power due to license conditions imposed bythe CNSC. Units 1 through 4 have been shutdownsince December 31, 1997. Units 3 and 4 are in theprocess of startup.
Bruce A. Although these reactors were in guaran-teed shutdown state, they were manually tripped,in accordance with operating procedures. SDS1was manually tripped on Units 3 and 4, as per pro-cedures for a loss of Class IV power event. SDS1was re-poised on both units when the stationpower supplies were stabilized. The emergencytransfer system functioned as per design, with theClass III standby generators picking up stationelectrical loads. The recently installed QualifiedDiesel Generators received a start signal and wereavailable to pick up emergency loads if necessary.
Bruce B. Units 5, 6, 7, and 8 experienced initialgeneration rejection and accompanying stepbackon all four reactor units. All generators separatedfrom the grid on under-frequency at 16:12 EDT.Units 5, 7, and 8 maintained reactor power at 60%of full power and were immediately available forreconnection to the grid.
Although initially surviving the loss of grid event,Unit 6 experienced an SDS1 trip on insufficientNeutron Over Power (NOP) margin. This occurred
while withdrawing Bank 3 of the adjusters in anattempt to offset the xenon transient, resulting in aloss of Class IV power.
The following equipment problems were noted:An adjuster rod on Unit 6 had been identified onAugust 13, 2003, as not working correctly. Unit 6experienced a High Pressure Recirculation Waterline leak, and the Closed Loop DemineralizedWater loop lost inventory to the Emergency WaterSupply System.
Units were synchronized to the grid as follows:Unit 8 at 19:14 EDT on August 14, 2003; Unit 5 at21:04 EDT on August 14; and Unit 7 at 21:14 EDTon August 14, 2003. Unit 6 was resynchronized at02:03 EDT on August 23, 2003, after maintenancewas conducted.
Point Lepreau Nuclear Generating Station. ThePoint Lepreau nuclear station overlooks the Bay ofFundy on the Lepreau Peninsula, 40 kilometerssouthwest of Saint John, New Brunswick. PointLepreau is a single-unit CANDU 6, designed for agross output of 680 MW. It is owned and operatedby New Brunswick Power.
Point Lepreau was operating at 91.5% of fullpower (610 MWe) at the time of the event. Whenthe event occurred, the unit responded to changesin grid frequency as per design. The net impactwas a short-term drop in output by 140 MW, withreactor power remaining constant and excess ther-mal energy being discharged via the unit steamdischarge valves. During the 25 seconds of theevent, the unit stabilizer operated numerous timesto help dampen the turbine generator speed oscil-lations that were being introduced by the grid fre-quency changes. Within 25 minutes of the eventinitiation, the turbine generator was reloaded to610 MW. Given the nature of the event thatoccurred, there were no unexpected observationson the New Brunswick Power grid or at PointLepreau Generating Station throughout the ensu-ing transient.
Nuclear Power Plants With No Transient
Gentilly-2 Nuclear Station. Hydro Québec ownsand operates Gentilly-2 nuclear station, located onthe south shore of the St. Lawrence River oppositethe city of Trois-Rivières, Québec. Gentilly-2 iscapable of delivering approximately 675 MW toHydro Québec’s grid. The Hydro Québec grid wasnot affected by the power system outage andGentilly-2 continued to operate normally.
90 � U.S.-Canada Power System Outage Task Force � Causes of the August 14th Blackout �

General Observations Based on the FactsFound During Phase One
Following the review of the data provided by theCanadian nuclear power plants, the NuclearWorking Group concludes the following:
� None of the reactor operators had any advancedwarning of impending collapse of the grid.
� Canadian nuclear power plants did not triggerthe power system outage or contribute to itsspread.
� There were no risks to the health and safety ofworkers or the public as a result of the concur-rent shutdown of several reactors. Automaticsafety systems for the turbine generators andreactors worked as designed. (See Table 7.2 fora summary of shutdown events for Canadiannuclear power plants.)
The NWG also identified the following secondaryissues:
� Equipment problems and design limitations atPickering B resulted in a temporary reduction inthe effectiveness of some of the multiple safetybarriers, although the equipment failure waswithin the unavailability targets found in theOP&Ps approved by the CNSC as part of OntarioPower Generation’s license.
� Existing OP&Ps place constraints on the use ofadjuster rods to respond to events involvingrapid reductions in reactor power. Whilegreater flexibility with respect to use of adjusterrods would not have prevented the shutdown,some units, particularly those at Darlington,might have been able to return to service lessthan 1 hour after the initiating event.
� Off-site power was unavailable for varying peri-ods of time, from approximately 3 hours atBruce B to approximately 9 hours at PickeringA. Despite the high priority assigned by the IMOto restoring power to the nuclear stations, thestations had some difficulty obtaining timelyinformation about the status of grid recoveryand the restoration of Class IV power. Thisinformation is important for Ontario PowerGeneration’s and Bruce Power’s responsestrategy.
� Required regulatory approvals from CNSC staffwere obtained quickly and did not delay therestart of the units; however, CNSC staff wasunable to immediately activate the CNSC’sEmergency Operation Centre because of loss ofpower to the CNSC’s head office building.CNSC staff, therefore, established communica-tions with licensees and the U.S. NRC fromother locations.
� U.S.-Canada Power System Outage Task Force � Causes of the August 14th Blackout � 91

92 � U.S.-Canada Power System Outage Task Force � Causes of the August 14th Blackout �
Table 7.2. Summary of Shutdown Events for Canadian Nuclear Power Plants
Generating Station Unit
Operating Status at Time ofEvent Response to Event
FullPower Startup
NotOperating
Stepback to60% Power,Available ToSupply Grid
TurbineTrip
Reactor Trip
SDS1 SDS2
Pickering NGS 1 √ (a)
2 √3 √4 √ √ (b)
5 √ √ √6 √ √ √7 √ √8 √ √
Darlington NGS 1 √ √ √2 √ √ √3 √ √4 √ √ √
Bruce Nuclear PowerDevelopment
1 √2 √3 √ √4 √ √5 √ √6 √ √7 √ √8 √ √
aPickering A Unit 1 tripped as a result of electrical bus configuration immediately prior to the event which resulted in a temporaryloss of Class II power.
bPickering A Unit 4 also tripped on SDS-E.Notes: Unit 7 at Pickering B was operating at low power, warming up prior to reconnecting to the grid after a maintenance outage.
Unit 4 at Pickering A was producing at low power, as part of the reactor’s commissioning after extensive refurbishment since beingshut down in 1997.

8. Physical and Cyber Security Aspects of the Blackout
Summary
The objective of the Security Working Group(SWG) is to determine what role, if any, that amalicious cyber event may have played in caus-ing, or contributing to, the power outage of August14, 2003. Analysis to date provides no evidencethat malicious actors are responsible for, or con-tributed to, the outage. The SWG acknowledgesreports of al-Qaeda claims of responsibility for thepower outage of August 14, 2003; however, thoseclaims are not consistent with the SWG’s findingsto date. There is also no evidence, nor is there anyinformation suggesting, that viruses and wormsprevalent across the Internet at the time of the out-age had any significant impact on power genera-tion and delivery systems. SWG analysis to datehas brought to light certain concerns with respectto: the possible failure of alarm software; links tocontrol and data acquisition software; and the lackof a system or process for some operators to viewadequately the status of electric systems outsidetheir immediate control.
Further data collection and analysis will be under-taken by the SWG to test the findings detailed inthis interim report and to examine more fully thecyber security aspects of the power outage. Theoutcome of Electric System Working Group(ESWG) root cause analysis will serve to focus thiswork. As the significant cyber events are identi-fied by the ESWG, the SWG will examine themfrom a security perspective.
Security Working Group:Mandate and Scope
It is widely recognized that the increased relianceon information technology (IT) by critical infra-structure sectors, including the energy sector, hasincreased their vulnerability to disruption viacyber means. The ability to exploit these vulnera-bilities has been demonstrated in North America.The SWG was established to address thecyber-related aspects of the August 14, 2003,power outage. The SWG is made up of U.S. and
Canadian Federal, State, Provincial, and localexperts in both physical and cyber security. Forthe purposes of its work, the SWG has defined a“malicious cyber event” as the manipulation ofdata, software or hardware for the purpose ofdeliberately disrupting the systems that controland support the generation and delivery of electricpower.
The SWG is working closely with the U.S. andCanadian law enforcement, intelligence, andhomeland security communities to examine thepossible role of malicious actors in the power out-age of August 14, 2003. A primary activity to datehas been the collection and review of availableintelligence that may relate to the outage.
The SWG is also collaborating with the energyindustry to examine the cyber systems that controlpower generation and delivery operations, thephysical security of cyber assets, cyber policiesand procedures, and the functionality of support-ing infrastructures-such as communication sys-tems and backup power generation, whichfacilitate the smooth-running operation of cyberassets-to determine whether the operation of thesesystems was affected by malicious activity. Thecollection of information along these avenues ofinquiry is ongoing.
The SWG is coordinating its efforts with those ofthe other Working Groups, and there is a signifi-cant interdependence on the work products andfindings of each group. The SWG’s initial focus ison the cyber operations of those companies in theUnited States involved in the early stages of thepower outage timeline, as identified by the ESWG.The outcome of ESWG analysis will serve to iden-tify key events that may have caused, or contrib-uted to, the outage. As the significant cyber eventsare identified, the SWG will examine them from asecurity perspective. The amount of informationfor analysis is identified by the ESWG as pertinentto the SWG’s analysis is considerable.
Examination of the physical, non-cyber infrastruc-ture aspects of the power outage of August 14,2003, is outside the scope of the SWG’s analysis.
� U.S.-Canada Power System Outage Task Force � Causes of the August 14th Blackout � 93

Nevertheless, if a breach of physical security unre-lated to the cyber dimensions of the infrastructurecomes to the SWG’s attention during the course ofthe work of the Task Force, the SWG will conductthe necessary analysis.
Also outside the scope of the SWG’s work is analy-sis of the cascading impacts of the power outageon other critical infrastructure sectors. Both theCanadian Office of Critical Infrastructure Protec-tion and Emergency Preparedness (OCIPEP) andthe U.S. Department of Homeland Security (DHS)are examining these issues, but not within thecontext of the Task Force. The SWG is closelycoordinating its efforts with OCIPEP and DHS.
Cyber Securityin the Electricity Sector
The generation and delivery of electricity hasbeen, and continues to be, a target of maliciousgroups and individuals intent on disrupting theelectric power system. Even attacks that do notdirectly target the electricity sector can have dis-ruptive effects on electricity system operations.Many malicious code attacks, by their very nature,are unbiased and tend to interfere with operationssupported by vulnerable applications. One suchincident occurred in January 2003, when the“Slammer” Internet worm took down monitoringcomputers at FirstEnergy Corporation’s idledDavis-Besse nuclear plant. A subsequent report bythe North American Electric Reliability Council(NERC) concluded that, although it caused no out-ages, the infection blocked commands that oper-ated other power utilities. The report, “NRC IssuesInformation Notice on Potential of Nuclear PowerPlant Network to Worm Infection,” is available atweb site http://www.nrc.gov/reading-rm/doc-collections/news/2003/03-108.html.
This example, among others, highlights theincreased vulnerability to disruption via cybermeans faced by North America’s critical infra-structure sectors, including the energy sector. Ofspecific concern to the U.S. and Canadian govern-ments are the Supervisory Control and DataAcquisition (SCADA) systems, which containcomputers and applications that perform a widevariety of functions across many industries. Inelectric power, SCADA includes telemetry for sta-tus and control, as well as Energy ManagementSystems (EMS), protective relaying, and auto-matic generation control. SCADA systems were
developed to maximize functionality andinteroperability, with little attention given tocyber security. These systems, many of whichwere intended to be isolated, are now, for a varietyof business and operational reasons, eitherdirectly or indirectly connected to the globalInternet. For example, in some instances, theremay be a need for employees to monitor SCADAsystems remotely. However, connecting SCADAsystems to a remotely accessible computer net-work can present security risks. These risksinclude the compromise of sensitive operatinginformation and the threat of unauthorized accessto SCADA systems’ control mechanisms.
Security has always been a priority for the electric-ity sector in North America; however, it is agreater priority now than ever before. Electric sys-tem operators recognize that the threat environ-ment is changing and that the risks are greaterthan in the past, and they have taken steps toimprove their security postures. NERC’s CriticalInfrastructure Protection Advisory Group hasbeen examining ways to improve both the physi-cal and cyber security dimensions of the NorthAmerican power grid. This group includes Cana-dian and U.S. industry experts in the areas ofcyber security, physical security and operationalsecurity. The creation of a national SCADA pro-gram to improve the physical and cyber security ofthese control systems is now also under discus-sion in the United States. The Canadian ElectricalAssociation Critical Infrastructure Working Groupis examining similar measures.
Information Collectionand Analysis
In addition to analyzing information alreadyobtained from stakeholder interviews, telephonetranscripts, law enforcement and intelligenceinformation, and other ESWG working docu-ments, the SWG will seek to review and analyzeother sources of data on the cyber operations ofthose companies in the United States involved inthe early stages of the power outage timeline, asidentified by the ESWG. Available informationincludes log data from routers, intrusion detectionsystems, firewalls, and EMS; change managementlogs; and physical security materials. Data are cur-rently being collected, in collaboration with theprivate sector and with consideration toward itsprotection from further disclosure where there areproprietary or national security concerns.
94 � U.S.-Canada Power System Outage Task Force � Causes of the August 14th Blackout �

The SWG is divided into six sub-teams to addressthe discrete components of this investigation:Cyber Analysis, Intelligence Analysis, PhysicalAnalysis, Policies and Procedures, SupportingInfrastructure, and Root Cause Liaison. The SWGorganized itself in this manner to create a holisticapproach to each of the main areas of concernwith regard to power grid vulnerabilities. Ratherthan analyze each area of concern separately, theSWG sub-team structure provides a more compre-hensive framework in which to investigatewhether malicious activity was a cause of thepower outage of August 14, 2003. Each sub-team isstaffed with Subject Matter Experts (SMEs) fromgovernment, industry, and academia to providethe analytical breadth and depth necessary tocomplete its objective. A detailed overview of thesub-team structure and activities, those plannedand those taken, for each sub-team is providedbelow.
Cyber Analysis
The Cyber Analysis sub-team is led by the CERT®Coordination Center (CERT/CC) at CarnegieMellon University and the Royal CanadianMounted Police (RCMP). This team is focused onanalyzing and reviewing the electronic media ofcomputer networks in which online communica-tions take place. The sub-team is examining thesenetworks to determine whether they were mali-ciously used to cause, or contribute to, the August14 outage. It is specifically reviewing the existingcyber topology, cyber logs, and EMS logs. Theteam is also conducting interviews with vendorsto identify known system flaws and vulnerabili-ties. The sub-team is collecting, processing, andsynthesizing data to determine whether a mali-cious cyber-related attack was a direct or indirectcause of the outage.
This sub-team has taken a number of steps inrecent weeks, including reviewing NERC reliabil-ity standards to gain a better understanding of theoverall security posture of the electric powerindustry. Additionally, the sub-team participatedin meetings in Baltimore on August 22 and 23,2003. The meetings provided an opportunity forthe cyber experts and the power industry expertsto understand the details necessary to conduct aninvestigation. The cyber data retention requestwas produced during this meeting.
Members of the sub-team also participated in theNERC/Department of Energy (DOE) Fact Findingmeeting held in Newark, New Jersey, on Septem-ber 8, 2003. Each company involved in the outage
provided answers to a set of questions related tothe outage. The meeting helped to provide a betterunderstanding of what each company experi-enced before, during, and after the outage. Addi-tionally, sub-team members participated ininterviews with the control room operators fromFirstEnergy on October 8 and 9, 2003, and fromCinergy on October 10, 2003. These interviewshave identified several key areas for furtherdiscussion.
The Cyber Analysis sub-team continues to gain abetter understanding of events on August 14,2003. Future analysis will be driven by informa-tion received from the ESWG’s Root Cause Analy-sis sub-team and will focus on:
� Conducting additional interviews with controlroom operators and IT staff from the key compa-nies involved in the outage.
� Conducting interviews with the operators andIT staff responsible for the NERC InterchangeDistribution Calculator system. Some reportsindicate that this system may have beenunavailable during the time of the outage.
� Conducting interviews with key vendors for theEMS.
� Analyzing the configurations of routers, fire-walls, intrusion detection systems, and othernetwork devices to get a better understanding ofpotential weaknesses in the control systemcyber defenses.
� Analyzing logs and other information for signsof unauthorized activity.
Intelligence Analysis
The Intelligence Analysis sub-team is led by DHSand the RCMP, which are working closely withFederal, State, and local law enforcement, intelli-gence, and homeland security organizations toassess whether the power outage was the result ofa malicious attack. Preliminary analysis providesno evidence that malicious actors-either individu-als or organizations-are responsible for, or contrib-uted to, the power outage of August 14, 2003.Additionally, the sub-team has found no indica-tion of deliberate physical damage to power gener-ating stations and delivery lines on the day of theoutage, and there are no reports indicating that thepower outage was caused by a computer networkattack.
Both U.S. and Canadian government authoritiesprovide threat intelligence information to theirrespective energy sectors when appropriate. No
� U.S.-Canada Power System Outage Task Force � Causes of the August 14th Blackout � 95

intelligence reports before, during, or after thepower outage indicated any specific terrorist plansor operations against the energy infrastructure.There was, however, threat information of a gen-eral nature relating to the sector, which was pro-vided to the North American energy industry byU.S. and Canadian government agencies in lateJuly 2003. This information indicated thatal-Qaeda might attempt to carry out a physicalattack involving explosions at oil production facil-ities, power plants, or nuclear plants on the U.S.East Coast during the summer of 2003. The type ofphysical attack described in the intelligence thatprompted this threat warning is not consistentwith the events of the power outage; there is noindication of a kinetic event before, during, orimmediately after the August 14 outage.
Despite all the above indications that no terroristactivity caused the power outage, al-Qaeda didpublicly claim responsibility for its occurrence:
� August 18, 2003: Al-Hayat, an Egyptian mediaoutlet, published excerpts from a communiquéattributed to al-Qaeda. Al Hayat claimed to haveobtained the communiqué from the website ofthe International Islamic Media Center. Thecontent of the communiqué asserts that the “bri-gades of Abu Fahes Al Masri had hit two mainpower plants supplying the East of the U.S., aswell as major industrial cities in the U.S. andCanada, ‘its ally in the war against Islam (NewYork and Toronto) and their neighbors.’” Fur-thermore, the operation “was carried out on theorders of Osama bin Laden to hit the pillars ofthe U.S. economy,” as “a realization of binLaden’s promise to offer the Iraqi people a pres-ent.” The communiqué does not specify the wayin which the alleged sabotage was carried out,but it does elaborate on the alleged damage tothe U.S. economy in the areas of finance, trans-portation, energy, and telecommunications.
Additional claims and commentary regarding thepower outage appeared in various Middle Easternmedia outlets:
� August 26, 2003: A conservative Iranian dailynewspaper published a commentary regardingthe potential of computer technology as a toolfor terrorists against infrastructures dependenton computer networks-most notably, water,electric, public transportation, trade organiza-tions, and “supranational companies” in theUnited States.
� September 4, 2003: An Islamist participant in aJihadist chat room forum claimed that sleeper
cells associated with al-Qaeda used the poweroutage as a cover to infiltrate the United Statesfrom Canada.
These claims above, as known, are not consistentwith the SWG’s findings to date. They are also notconsistent with recent congressional testimony bythe U.S. Federal Bureau of Investigation (FBI).Larry A. Mefford, Executive Assistant Director incharge of the FBI’s Counterterrorism andCounterintelligence programs, testified to the U.S.Congress on September 4, 2003, that, “To date, wehave not discovered any evidence indicating thatthe outage was a result of activity by internationalor domestic terrorists or other criminal activity.”He also testified that, “The FBI has received nospecific, credible threats to electronic power gridsin the United States in the recent past and theclaim of the Abu Hafs al-Masri Brigade to havecaused the blackout appears to be no more thanwishful thinking. We have no information con-firming the actual existence of this group.” Mr.Mefford’s Statement for the Record is available atweb site http://www.fbi.gov/congress/congress03/mefford090403.htm.
Current assessments suggest that there are terror-ists and other malicious actors who have the capa-bility to conduct a malicious cyber attack withpotential to disrupt the energy infrastructure.Although such an attack cannot be ruled outentirely, an examination of available informationand intelligence does not support any claims of adeliberate attack against the energy infrastructureon, or leading up to, August 14, 2003. The fewinstances of physical damage that occurred onpower delivery lines were the result of natural actsand not of sabotage. No intelligence reports before,during, or after the power outage indicate any spe-cific terrorist plans or operations against theenergy infrastructure. No incident reports detailsuspicious activity near the power generationplants or delivery lines in question.
Physical Analysis
The Physical Analysis sub-team is led by the U.S.Secret Service and the RCMP. These organizationshave particular expertise in physical securityassessments in the energy sector. The sub-team isfocusing on issues related to how the cyber-relatedfacilities of the energy sector companies aresecured, including the physical integrity of datacenters and control rooms, along with securityprocedures and policies used to limit access tosensitive areas. Focusing on the facilities identi-fied as having a causal relationship to the outage,
96 � U.S.-Canada Power System Outage Task Force � Causes of the August 14th Blackout �

the sub-team is seeking to determine whether thephysical integrity of the cyber facilities wasbreached, either externally or by an insider, beforeor during the outage; and if so, whether such abreach caused or contributed to the power outage.Although the sub-team has analyzed informationprovided to both the EWG and the NuclearWorking Group (NWG), the Physical Analysissub-team is also reviewing information resultingfrom recent face-to-face meetings with energy sec-tor personnel and site visits to energy sector facili-ties, to determine the physical integrity of thecyber infrastructure.
The sub-team has compiled a list of questions cov-ering location, accessibility, cameras, alarms,locks, and fire protection and water systems asthey apply to computer server rooms. Based ondiscussions of these questions during its inter-views, the sub-team is in the process of ascertain-ing whether the physical integrity of the cyberinfrastructure was breached. Additionally, thesub-team is examining access and control mea-sures used to allow entry into command and con-trol facilities and the integrity of remote facilities.
The sub-team is also concentrating on mecha-nisms used by the companies to report unusualincidents within server rooms, command and con-trol rooms, and remote facilities. The sub-team isalso addressing the possibility of an insider attackon the cyber infrastructure.
Policies and Procedures
The Policies and Procedures sub-team is led byDHS and OCIPEP, which have personnel withstrong backgrounds in the fields of electric deliv-ery operations, automated control systems(including SCADA and EMS), and informationsecurity. The sub-team is focused on examiningthe overall policies and procedures that may ormay not have been in place during the events lead-ing up to and during the August 14 power outage.The team is examining policies that are centrallyrelated to the cyber systems of the companiesidentified in the early stages of the power outage.Of specific interest are policies and proceduresregarding the upgrade and maintenance (toinclude system patching) of the command andcontrol (C2) systems, including SCADA and EMS.Also of interest are the procedures for contingencyoperations and restoration of systems in the eventof a computer system failure or a cyber event, suchas an active hack or the discovery of maliciouscode. The group is conducting further interviews
and is continuing its analysis to build solidconclusions about the policies and proceduresrelating to the outage.
Supporting Infrastructure
The Supporting Infrastructure sub-team is led by aDHS expert with experience assessing supportinginfrastructure elements such as water cooling forcomputer systems, backup power systems, heat-ing, ventilation and air conditioning (HVAC), andsupporting telecommunications networks.OCIPEP is the Canadian co-lead for this effort. Thesub-team is analyzing the integrity of the support-ing infrastructure and its role, if any, in the August14 power outage, and whether the supportinginfrastructure was performing at a satisfactorylevel before and during the outage. In addition, theteam is contacting vendors to determine whetherthere were maintenance issues that may haveaffected operations during or before the outage.
The sub-team is focusing specifically on the fol-lowing key issues in visits to each of the desig-nated electrical entities:
� Carrier/provider/vendor for the supportinginfrastructure services and/or systems at selectcompany facilities
� Loss of service before and/or after the poweroutage
� Conduct of maintenance activities before and/orafter the power outage
� Conduct of installation activities before and/orafter the power outage
� Conduct of testing activities before and/or afterthe power outage
� Conduct of exercises before and/or after thepower outage
� Existence of a monitoring process (log, check-list, etc.) to document the status of supportinginfrastructure services.
Root Cause Analysis
The SWG Root Cause Liaison sub-team (SWG/RC)has been following the work of the ESWG to iden-tify potential root causes of the power outage. Asthese root cause elements are identified, thesub-team will assess with the ESWG any potentiallinkages to physical and/or cyber malfeasance.
The root cause analysis work of the ESWG is stillin progress; however, the initial analysis has
� U.S.-Canada Power System Outage Task Force � Causes of the August 14th Blackout � 97

found no causal link between the power outageand malicious activity, whether physical or cyberinitiated. Root cause analysis for an event like theAugust 14 power outage involves a detailed pro-cess to develop a hierarchy of actions and eventsthat suggest causal factors. The process includes:development of a detailed timeline of the events,examination of actions related to the events, andan assessment of factors that initiated or exacer-bated the events. An assessment of the impact ofphysical security as a contributor to the poweroutage is conditional upon discovery of informa-tion suggesting that a malicious physical act initi-ated or exacerbated the power outage. There areno such indications thus far, and no furtherassessment by the SWG in this area is indicated.
Cyber Timeline
The following sequence of events was derivedfrom discussions with representatives ofFirstEnergy and the Midwest Independent Trans-mission System Operator (MISO). All times areapproximate and will need to be confirmed by ananalysis of company log data.
� The first significant cyber-related event ofAugust 14, 2003, occurred at 12:40 EDT at theMISO. At this time, a MISO EMS engineer pur-posely disabled the automatic periodic triggeron the State Estimator (SE) application, whichallows MISO to determine the real-time state ofthe power system for its region. Disabling of theautomatic periodic trigger, a program featurethat causes the SE to run automatically every 5minutes, is a necessary operating procedurewhen resolving a mismatched solution pro-duced by the SE. The EMS engineer determinedthat the mismatch in the SE solution was due tothe SE model depicting Cinergy’s Blooming-ton-Denois Creek 230-kV line as being in ser-vice, when it had actually been out of servicesince 12:12 EDT.
� At 13:00 EDT, after making the appropriatechanges to the SE model and manually trigger-ing the SE, the MISO EMS engineer achievedtwo valid solutions.
� At 13:30 EDT, the MISO EMS engineer went tolunch. He forgot to re-engage the automaticperiodic trigger.
� At 14:14 EDT, FirstEnergy’s “Alarm and EventProcessing Routine” (AEPR)-a key software pro-gram that gives operators visual and audibleindications of events occurring on their portion
of the grid-began to malfunction. FirstEnergysystem operators were unaware that the soft-ware was not functioning properly. This soft-ware did not become functional again untilmuch later that evening.
� At 14:40 EDT, an Ops engineer discovered thatthe SE was not solving. He went to notify anEMS engineer.
� At 14:41 EDT, FirstEnergy’s server running theAEPR software failed to the backup server. Con-trol room staff remained unaware that the AEPRsoftware was not functioning properly.
� At 14:44 EDT, an MISO EMS engineer, afterbeing alerted by the Ops engineer, reactivatedthe automatic periodic trigger and, for speed,manually triggered the program. The SE pro-gram again showed a mismatch.
� At 14:54 EDT, FirstEnergy’s backup serverfailed. AEPR continued to malfunction. TheArea Control Error (ACE) calculations and StripCharting routines malfunctioned, and the dis-patcher user interface slowed significantly.
� At 15:00 EDT, FirstEnergy used its emergencybackup system to control the system and makeACE calculations. ACE calculations and controlsystems continued to run on the emergencybackup system until roughly 15:08 EDT, whenthe primary server was restored.
� At 15:05 EDT, FirstEnergy’s Harding-Chamber-lin 345-kV line tripped and locked out. FE sys-tem operators did not receive notification fromthe AEPR software, which continued to mal-function, unbeknownst to the FE systemoperators.
� At 15:08 EDT, using data obtained at roughly15:04 EDT (it takes about 5 minutes for the SE toprovide a result), the MISO EMS engineer con-cluded that the SE mismatched due to a lineoutage. His experience allowed him to isolatethe outage to the Stuart-Atlanta 345-kV line(which tripped about an hour earlier, at 14:02EDT). He took the Stuart-Atlanta line out of ser-vice in the SE model and got a valid solution.
� Also at 15:08 EDT, the FirstEnergy primaryserver was restored. ACE calculations and con-trol systems were now running on the primaryserver. AEPR continued to malfunction, unbe-knownst to the FirstEnergy system operators.
� At 15:09 EDT, the MISO EMS engineer went tothe control room to tell the operators that hethought the Stuart-Atlanta line was out of ser-vice. Control room operators referred to their
98 � U.S.-Canada Power System Outage Task Force � Causes of the August 14th Blackout �

“Outage Scheduler” and informed the EMSengineer that their data showed the Stu-art-Atlanta line was “up” and that the EMS engi-neer should depict the line as in service in theSE model. At 15:17 EDT, the EMS engineer ranthe SE with the Stuart-Atlanta line “live.” Themodel again mismatched.
� At 15:29 EDT, the MISO EMS Engineer askedMISO operators to call the PJM Interconnect todetermine the status of the Stuart-Atlanta line.MISO was informed that the Stuart-Atlanta linehad tripped at 14:02 EDT. The EMS engineeradjusted the model, which by that time hadbeen updated with the 15:05 EDT Har-ding-Chamberlin 345-kV line trip, and came upwith a valid solution.
� At 15:32 EDT, FirstEnergy’s Hanna-Juniper345-kV line tripped and locked out. The AEPRcontinued to malfunction.
� At 15:41 EDT, the lights flickered atFirstEnergy’s control facility, because the facil-ity had lost grid power and switched over to itsemergency power supply.
� At 15:42 EDT, a FirstEnergy dispatcher realizedthat the AEPR was not working and informedtechnical support staff of the problem.
Findings to Date
The SWG has developed the following findingsvia analysis of collected data and discussions withenergy companies and entities identified by theESWG as pertinent to the SWG’s analysis. SWGanalysis to date provides no evidence that mali-cious actors-either individuals or organiza-tions-are responsible for, or contributed to, thepower outage of August 14, 2003. The SWG con-tinues to coordinate closely with the other TaskForce Working Groups and members of the U.S.and Canadian law enforcement and DHS/OCIPEPcommunities to collect and analyze data to testthis preliminary finding.
No intelligence reports before, during, or after thepower outage indicated any specific terrorist plansor operations against the energy infrastructure.There was, however, threat information of a gen-eral nature related to the sector, which was pro-vided to the North American energy industry by
U.S. and Canadian government agencies in lateJuly 2003. This information indicated thatal-Qaeda might attempt to carry out a physicalattack against oil production facilities, powerplants, or nuclear plants on the U.S. East Coastduring the summer of 2003. The type of physicalattack described in the intelligence that promptedthe threat information was not consistent with theevents of the power outage.
Although there were a number of worms andviruses impacting the Internet and Internet-connected systems and networks in North Amer-ica before and during the outage, the SWG’s pre-liminary analysis provides no indication thatworm/virus activity had a significant effect on thepower generation and delivery systems. FurtherSWG analysis will test this finding.
SWG analysis to date suggests that failure of a soft-ware program-not linked to malicious activ-ity-may have contributed significantly to thepower outage of August 14, 2003. Specifically, keypersonnel may not have been aware of the need totake preventive measures at critical times, becausean alarm system was malfunctioning. The SWGcontinues to work closely with the operators of theaffected system to determine the nature and scopeof the failure, and whether similar software fail-ures could create future system vulnerabilities.The SWG is in the process of engaging system ven-dors and operators to determine whether any tech-nical or process-related modifications should beimplemented to improve system performance inthe future.
The existence of both internal and external linksfrom SCADA systems to other systems introducedvulnerabilities. At this time, however, preliminaryanalysis of information derived from interviewswith operators provides no evidence indicatingexploitation of these vulnerabilities before or dur-ing the outage. Future SWG work will providegreater insight into this issue.
Analysis of information derived from interviewswith operators suggests that, in some cases, visi-bility into the operations of surrounding areas waslacking. Some companies appear to have had onlya limited understanding of the status of the elec-tric systems outside their immediate control. Thismay have been, in part, the result of a failure to usemodern dynamic mapping and data sharing sys-tems. Future SWG work will clarify this issue.
� U.S.-Canada Power System Outage Task Force � Causes of the August 14th Blackout � 99


Appendix A
Description of Outage Investigation andPlan for Development of Recommendations
On August 14, 2003, the northeastern U.S. andOntario, Canada, suffered one of the largest powerblackouts in the history of North America. Thearea affected extended from New York, Massachu-setts, and New Jersey west to Michigan, and fromOhio north to Ontario.
This appendix outlines the process used to inves-tigate why the blackout occurred and was not con-tained, and explains how recommendations willbe developed to prevent and minimize the scopeof future outages. The essential first step in theprocess was the creation of a joint U.S.-CanadaPower System Outage Task Force to provide over-sight for the investigation and the development ofrecommendations.
Task Force Composition andResponsibilities
President George W. Bush and Prime MinisterJean Chrétien created the joint Task Force to iden-tify the causes of the August 14, 2003 power out-age and to develop recommendations to preventand contain future outages. The co-chairs of theTask Force are U.S. Secretary of Energy SpencerAbraham and Minister of Natural Resources Can-ada Herb Dhaliwal. Other U.S. members are Nils J.Diaz, Chairman of the Nuclear Regulatory Com-mission, Tom Ridge, Secretary of Homeland Secu-rity, and Pat Wood, Chairman of the FederalEnergy Regulatory Commission. The other Cana-dian members are Deputy Prime Minister JohnManley, Linda J. Keen, President and CEO of theCanadian Nuclear Safety Commission, and Ken-neth Vollman, Chairman of the National EnergyBoard. The coordinators for the Task Force areJimmy Glotfelty on behalf of the U.S. Departmentof Energy and Dr. Nawal Kamel on behalf of Natu-ral Resources Canada.
U.S. Energy Secretary Spencer Abraham and Min-ister of Natural Resources Canada Herb Dhaliwalmet in Detroit, Michigan on August 20, and agreedon an outline for the Task Force’s activities. Theoutline directed the Task Force to divide its effortsinto two phases. The first phase was to focus onwhat caused the outage and why it was not con-tained, and the second was to focus on the
development of recommendations to prevent andminimize future power outages. On August 27,Secretary Abraham and Minister Dhaliwalannounced the formation of three WorkingGroups to support the work of the Task Force. Thethree Working Groups address electric systemissues, security matters, and questions related tothe performance of nuclear power plants over thecourse of the outage. The members of the WorkingGroups are officials from relevant federal depart-ments and agencies, technical experts, and seniorrepresentatives from the affected states and theProvince of Ontario.
U.S.-Canada-NERC Investigation Team
Under the oversight of the Task Force, a team ofelectric system experts was established to investi-gate the causes of the outage. This team was com-prised of individuals from several U.S. federalagencies, the U.S. Department of Energy’s nationallaboratories, Canadian electric industry, Canada’sNational Energy Board, staff from the North Amer-ican Electric Reliability Council (NERC), and theU.S. electricity industry. The overall investigativeteam was divided into several analytic groupswith specific responsibilities, including data man-agement, determining the sequence of outageevents, system modeling, evaluation of operatingtools and communications, transmission systemperformance, generator performance, vegetationand right-of-way management, transmission andreliability investments, and root cause analysis.The root cause analysis is best understood as ananalytic framework as opposed to a stand-aloneanalytic effort. Its function was to enable the ana-lysts to draw upon and organize information fromall of the other analyses, and by means of a rigor-ously logical and systematic procedure, assessalternative hypotheses and identify the rootcauses of the outage.
Separate teams were established to address issuesrelated to the performance of nuclear power plantsaffected by the outage, and physical and cybersecurity issues related to the bulk powerinfrastructure.
� U.S.-Canada Power System Outage Task Force � Causes of the August 14th Blackout � 101

Function of the Working Groups
The U.S. and Canadian co-chairs of each of thethree Working Groups (i.e., an Electric SystemWorking Group, a Nuclear Working Group, and aSecurity Working Group) designed various workproducts to be prepared by the investigativeteams. Drafts of these work products werereviewed and commented upon by the relevantWorking Groups. These work products were thensynthesized into a single Interim Report reflectingthe conclusions of the three investigative teamsand the Working Groups. Determination of whenthe Interim Report was complete and appropriatefor release to the public was the responsibility ofthe joint Task Force.
Confidentiality of Data and Information
Given the seriousness of the blackout and theimportance of averting or minimizing futureblackouts, it was essential that the Task Force’steams have access to pertinent records and datafrom the regional independent system operators(ISOs) and electric companies affected by theblackout, and for the investigative team to be ableto interview appropriate individuals to learn whatthey saw and knew at key points in the evolutionof the outage, what actions they took, and withwhat purpose. In recognition of the sensitivity ofthis information, Working Group members andmembers of the teams signed agreements affirm-ing that they would maintain the confidentiality ofdata and information provided to them, andrefrain from independent or premature statementsto the media or the public about the activities,findings, or conclusions of the individual WorkingGroups or the Task Force as a whole.
Relevant U.S. and Canadian LegalFramework
United States
The Secretary of Energy directed the Departmentof Energy (DOE) to gather information and con-duct an investigation to examine the cause orcauses of the August 14, 2003 blackout. In initiat-ing this effort, the Secretary exercised his author-ity, including section 11 of the Energy Supply andEnvironmental Coordination Act of 1974, and sec-tion 13 of the Federal Energy Administration Actof 1974, to gather energy-related information andconduct investigations. This authority gives himand the DOE the ability to collect such energyinformation as he deems necessary to assist in the
formulation of energy policy, to conduct investi-gations at reasonable times and in a reasonablemanner, and to conduct physical inspections atenergy facilities and business premises. In addi-tion, DOE can inventory and sample any stock offuels or energy sources therein, inspect and copyrecords, reports, and documents from whichenergy information has been or is being compiledand to question such persons as it deems neces-sary. DOE worked closely with the CanadianDepartment of Natural Resources and NERC onthe investigation.
Canada
Minister Dhaliwal, as the Minister responsible forNatural Resources Canada, was appointed byPrime Minister Chrétien as the Canadian Co-Chairof the Task Force. Minister Dhaliwal works closelywith his American Co-Chair, Secretary of EnergyAbraham, as well as NERC and his provincialcounterparts in carrying out his responsibilities.The Task Force will report to the Prime Ministerand the US President upon the completion of itsmandate.
Under Canadian law, the Task Force is character-ized as a non-statutory, advisory body that doesnot have independent legal personality. The TaskForce does not have any power to compel evi-dence or witnesses, nor is it able to conductsearches or seizures. In Canada, the Task Forcewill rely on voluntary disclosure for obtaininginformation pertinent to its work.
Investigative Process
Collection of Data and Information from ISOs,Utilities, States, and the Province of Ontario
On Tuesday, August 19, 2003, investigators affili-ated with the U.S. Department of Energy (USDOE)began interviewing control room operators andother key officials at the ISOs and the companiesmost directly involved with the initial stages of theoutage. In addition to the information gained inthe interviews, the interviewers sought informa-tion and data about control room operations andpractices, the organization’s system status andconditions on August 14, the organization’s oper-ating procedures and guidelines, load limits on itssystem, emergency planning and procedures, sys-tem security analysis tools and procedures, andpractices for voltage and frequency monitoring.Similar interviews were held later with staff atOntario’s Independent Electricity Market Opera-tor (IMO) and Hydro One in Canada.
102 � U.S.-Canada Power System Outage Task Force � Causes of the August 14th Blackout �

On August 22 and 26, NERC directed the reliabil-ity coordinators at the ISOs to obtain a wide rangeof data and information from the control area coor-dinators under their oversight. The data requestedincluded System Control and Data Acquisition(SCADA) logs, Energy Management System (EMS)logs, alarm logs, data from local digital faultrecorders, data on transmission line and generator“trips” (i.e., automatic disconnection to preventphysical damage to equipment), state estimatordata, operator logs and transcripts, and informa-tion related to the operation of capacitors, phaseshifting transformers, load shedding, static varcompensators, special protection schemes or sta-bility controls, and high-voltage direct current(HVDC) facilities. NERC issued another datarequest to FirstEnergy on September 15 for copiesof studies since 1990 addressing voltage support,reactive power supply, static capacitor applica-tions, voltage requirements, import or transfercapabilities (in relation to reactive capability orvoltage levels), and system impacts associatedwith unavailability of the Davis-Besse plant. Allparties were instructed that data and informationprovided to either DOE or NERC did not have to besubmitted a second time to the other entity—allmaterial provided would go into a common database.
The investigative team held three technical con-ferences (August 22, September 8-9, and October1-3) with the ISOs and key utilities aimed at clari-fying the data received, filling remaining gaps inthe data, and developing a shared understandingof the data’s implications. The team also requestedinformation from the public utility commissionsin the affected states and Ontario on transmissionright-of-way maintenance, transmission planning,and the scope of any state-led investigations con-cerning the August 14 blackout. The team alsocommissioned a study by a firm specializing inutility vegetation management to identify “bestpractices” concerning such management in rightof way areas and to use those practices in gaugingthe performance of companies who had lines goout of service on August 14 due to tree contact.
Data “Warehouse”
The data collected by the investigative teambecame voluminous, so an electronic repositorycapable of storing thousands of transcripts,graphs, generator and transmission data andreports was constructed in Princeton, NJ at theNERC headquarters. At present the data base isover 20 Gigabytes of information. That data
consists of over 10,000 different files some ofwhich contain multiple files. The objective was toestablish a set of validated databases that the sev-eral analytic teams could access independently onan as-needed basis.
The following are the information sources for theElectric System Investigation:
� Interviews conducted by members of theU.S.-Canada Electric Power System OutageInvestigation Team with personnel at all of theutilities, control areas and reliability coordina-tors in the weeks following the blackout.
� Three fact-gathering meetings conducted by theInvestigation Team with personnel from theabove organizations on August 22, September 8and 9, and October 1 to 3, 2003.
� Materials provided by the above organizationsin response to one or more data requests fromthe Investigation Team.
� Extensive review of all taped phone transcriptsbetween involved operations centers.
� Additional interviews and field visits with oper-ating personnel on specific issues in October,2003.
� Field visits to examine transmission lines andvegetation at short-circuit locations.
� Materials provided by utilities and state regula-tors in response to data requests on vegetationmanagement issues.
� Detailed examination of thousands of individ-ual relay trips for transmission and generationevents.
� Computer simulation and modeling conductedby groups of experts from utilities, reliabilitycoordinators, reliability councils, and the U.S.and Canadian governments.
Sequence of Events
Establishing a precise and accurate sequence ofoutage-related events was a critical building blockfor the other parts of the investigation. One of thekey problems in developing this sequence wasthat although much of the data pertinent to anevent was time-stamped, there was some variancefrom source to source in how the time-stampingwas done, and not all of the time-stamps were syn-chronized to the National Institute of Standardsand Technology (NIST) standard clock in Boulder,CO. Validating the timing of specific events
� U.S.-Canada Power System Outage Task Force � Causes of the August 14th Blackout � 103

became a large, important, and sometimes diffi-cult task. This work was also critical to the issu-ance by the Task Force on September 12 of a“timeline” for the outage. The timeline brieflydescribed the principal events, in sequence, lead-ing up to the initiation of the outage’s cascadephase, and then in the cascade itself. The timelinewas not intended, however, to address the causalrelationships among the events described, or toassign fault or responsibility for the blackout. Alltimes in the chronology are in Eastern DaylightTime.
System Modeling and Simulation Analysis
The system modeling and simulation team repli-cated system conditions on August 14 and theevents leading up to the blackout. While thesequence of events provides a precise descriptionof discrete events, it does not describe the overallstate of the electric system and how close it was tovarious steady-state, voltage stability, and powerangle stability limits. An accurate computermodel of the system, benchmarked to actual con-ditions at selected critical times on August 14,allowed analysts to conduct a series of sensitivitystudies to determine if the system was stable andwithin limits at each point in time leading up tothe cascade. The analysis also confirmed when thesystem became unstable, and allowed analysts totest whether measures such as load-sheddingwould have prevented the cascade.
This team consisted of a number of NERC staff andpersons with expertise in areas necessary to readand interpret all of the data logs, digital faultrecorder information, sequence of events record-ers information, etc. The team consisted of about36 people involved at various different times withadditional experts from the affected areas tounderstand the data.
Assessment of Operations Tools, SCADA/EMS,Communications, and Operations Planning
The Operations Tools, SCADA/EMS, Communica-tions, and Operations Planning Team assessed theobservability of the electric system to operatorsand reliability coordinators, and the availabilityand effectiveness of operational (real-time andday-ahead) reliability assessment tools, includingredundancy of views and the ability to observe the“big picture” regarding bulk electric system condi-tions. The team investigated operating practicesand effectiveness of operating entities and reliabil-ity coordinators in the affected area. This teaminvestigated all aspects of the blackout related to
operator and reliability coordinator knowledge ofsystem conditions, action or inactions, andcommunications.
Frequency/ACE Analysis
The Frequency/ACE Team analyzed potential fre-quency anomalies that may have occurred onAugust 14, as compared to typical interconnectionoperations. The team also determined whetherthere were any unusual issues with control perfor-mance and frequency and any effects they mayhave had related to the cascading failure, andwhether frequency related anomalies were con-tributing factors or symptoms of other problemsleading to the cascade.
Assessment of Transmission SystemPerformance, Protection, Control,Maintenance, and Damage
This team investigated the causes of all transmis-sion facility automatic operations (trips andreclosings) leading up to and through to the end ofthe cascade on all facilities greater than 100 kV.Included in the review were relay protection andremedial action schemes and identification of thecause of each operation and any misoperationsthat may have occurred. The team also assessedtransmission facility maintenance practices in theaffected area as compared to good utility practiceand identified any transmission equipment thatwas damaged in any way as a result of the cascad-ing outage. The team reported patterns and con-clusions regarding what caused transmissionfacilities to trip; why did the cascade extend as faras it did and not further into other systems; anymisoperations and the effect those misoperationshad on the outage; and any transmission equip-ment damage. Also the team reported on the trans-mission facility maintenance practices of entitiesin the affected area compared to good utilitypractice.
Assessment of Generator Performance,Protection, Controls, Maintenance, andDamage
This team investigated the cause of generator tripsfor all generators with a 10 MW or greater name-plate rating leading to and through the end of thecascade. The review included the cause for thegenerator trips, relay targets, unit power runbacks,and voltage/reactive power excursions. The teamreported any generator equipment that was dam-aged as a result of the cascading outage. The teamreported on patterns and conclusions regardingwhat caused generation facilities to trip. The team
104 � U.S.-Canada Power System Outage Task Force � Causes of the August 14th Blackout �

identified any unexpected performance anomaliesor unexplained events. The team assessed genera-tor maintenance practices in the affected area ascompared to good utility practice. The teamanalyzed the coordination of generator under-frequency settings with transmission settings,such as under-frequency load shedding. The teamgathered and analyzed data on affected nuclearunits and worked with the Nuclear RegulatoryCommission to address U.S. nuclear unit issues.
Assessment of Right of Way (ROW)Maintenance
The Vegetation/ROW Team investigated the prac-tices of transmission facilities owners in theaffected areas for vegetation management andROW maintenance. These practices were com-pared to accepted utility practices in generalacross the Eastern Interconnection. Also, the teaminvestigated historical patterns in the area relatedto outages caused by contact with vegetation.
Root Cause Analysis
The investigation team used an analytic techniquecalled root cause analysis to help guide the overallinvestigation process by providing a systematic
approach to evaluating root causes and contribut-ing factors leading to the start of the cascade onAugust 14. The root cause analysis team workedclosely with the technical investigation teams pro-viding feedback and queries on additional infor-mation. Also, drawing on other data sources asneeded, the root cause analysis verified factsregarding conditions and actions (or inactions)that contributed to the blackout.
Oversight and Coordination
The Task Force’s U.S. and Canadian coordinatorsheld frequent conference calls to ensure that allcomponents of the investigation were makingtimely progress. They briefed both Secretary Abra-ham and Minister Dhaliwal regularly and pro-vided weekly summaries from all components onthe progress of the investigation. The leadership ofthe electric system investigation team held dailyconference calls to address analystical and pro-cess issues through the investigation. The threeWorking Groups held weekly conference calls toenable the investigation team to update theWorking Group members on the state of the over-all analysis.
� U.S.-Canada Power System Outage Task Force � Causes of the August 14th Blackout � 105
Root Cause Analysis
Root cause analysis is a systematic approach toidentifying and validating causal linkages amongconditions, events, and actions (or inactions)leading up to a major event of interest—in thiscase the August 14 blackout. It has been success-fully applied in investigations of events such asnuclear power plant incidents, airplane crashes,and the recent Columbia space shuttle disaster.
Root cause analysis is driven by facts and logic.Events and conditions that may have helped tocause the major event in question must bedescribed in factual terms. Causal linkages mustbe established between the major event and ear-lier conditions or events. Such earlier conditionsor events must be examined in turn to determinetheir causes, and at each stage the investigatorsmust ask whether a particular condition or eventcould have developed or occurred if a proposedcause (or combination of causes) had not been
present. If the particular event being consideredcould have occurred without the proposed cause(or combination of causes), the proposed cause orcombination of causes is dropped from consider-ation and other possibilities are considered.
Root cause analysis typically identifies several oreven many causes of complex events; each of thevarious branches of the analysis is pursued untileither a “root cause” is found or a non-correctablecondition is identified. (A condition might beconsidered as non-correctable due to existinglaw, fundamental policy, laws of physics, etc.).Sometimes a key event in a causal chain leadingto the major event could have been prevented bytimely action by one or another party; if suchaction was feasible, and if the party had a respon-sibility to take such action, the failure to do sobecomes a root cause of the major event.


Appendix B
List of Electricity Acronyms
BPA Bonneville Power Administration
CNSC Canadian Nuclear Safety Commission
DOE Department of Energy (U.S.)
ECAR East Central Area Reliability Coordination Agreement
ERCOT Electric Reliability Council of Texas
FERC Federal Energy Regulatory Commission (U.S.)
FRCC Florida Reliability Coordinating Council
GW, GWh Gigawatt, Gigawatt-hour
kV, kVAr Kilovolt, Kilovolt-amperes-reactive
kW, kWh Kilowatt, Kilowatt-hour
MAAC Mid-Atlantic Area Council
MAIN Mid-America Interconnected Network
MAPP Mid-Continent Area Power Pool
MVA, MVAr Megavolt-amperes, Megavolt-amperes-reactive
MW, MWh Megawatt, Megawatt-hour
NERC North American Electric Reliability Council
NPCC Northeast Power Coordination Council
NRC Nuclear Regulatory Commission (U.S.)
NRCan Natural Resources Canada
OTD Office of Transmission and Distribution (U.S. DOE)
PUC Public Utility Commission (state)
RTO Regional Transmission Organization
SERC Southeast Electric Reliability Council
SPP Southwest Power Pool
TVA Tennessee Valley Authority (U.S.)
� U.S.-Canada Power System Outage Task Force � Causes of the August 14th Blackout � 107


Appendix C
Electricity Glossary
AC: Alternating current; current that changes peri-odically (sinusoidally) with time.
ACE: Area Control Error in MW. A negative valueindicates a condition of under-generation relativeto system load and imports, and a positive valuedenotes over-generation.
Active Power: Also known as “real power.” Therate at which work is performed or that energy istransferred. Electric power is commonly measuredin watts or kilowatts. The terms “active” or “real”power are often used in place of the term poweralone to differentiate it from reactive power. Therate of producing, transferring, or using electricalenergy, usually expressed in kilowatts (kW) ormegawatts (MW).
Adequacy: The ability of the electric system tosupply the aggregate electrical demand and energyrequirements of customers at all times, taking intoaccount scheduled and reasonably expectedunscheduled outages of system elements.
AGC: Automatic Generation Control is a computa-tion based on measured frequency and computedeconomic dispatch. Generation equipment underAGC automatically respond to signals from anEMS computer in real time to adjust power outputin response to a change in system frequency,tie-line loading, or to a prescribed relationbetween these quantities. Generator output isadjusted so as to maintain a target system fre-quency (usually 60 Hz) and any scheduled MWinterchange with other areas.
Apparent Power: The product of voltage and cur-rent phasors. It comprises both active and reactivepower, usually expressed in kilovoltamperes(kVA) or megavoltamperes (MVA).
Automatic Operating Systems: Special protectionsystems, or remedial action schemes, that requireno intervention on the part of system operators.
Blackstart Capability: The ability of a generatingunit or station to go from a shutdown condition toan operating condition and start delivering powerwithout assistance from the electric system.
Bulk Electric System: A term commonly appliedto the portion of an electric utility system that
encompasses the electrical generation resourcesand bulk transmission system.
Bulk Transmission: A functional or voltage classi-fication relating to the higher voltage portion ofthe transmission system, specifically, lines at orabove a voltage level of 115 kV.
Bus: Shortened from the word busbar, meaning anode in an electrical network where one or moreelements are connected together.
Capacitor Bank: A capacitor is an electrical devicethat provides reactive power to the system and isoften used to compensate for reactive load andhelp support system voltage. A bank is a collectionof one or more capacitors at a single location.
Capacity: The rated continuous load-carryingability, expressed in megawatts (MW) ormegavolt-amperes (MVA) of generation, transmis-sion, or other electrical equipment.
Cascading: The uncontrolled successive loss ofsystem elements triggered by an incident at anylocation. Cascading results in widespread serviceinterruption, which cannot be restrained fromsequentially spreading beyond an area predeter-mined by appropriate studies.
Circuit: A conductor or a system of conductorsthrough which electric current flows.
Circuit Breaker: A switching device connected tothe end of a transmission line capable of openingor closing the circuit in response to a command,usually from a relay.
Control Area: An electric power system or combi-nation of electric power systems to which a com-mon automatic control scheme is applied in orderto: (1) match, at all times, the power output of thegenerators within the electric power system(s) andcapacity and energy purchased from entities out-side the electric power system(s), with the load inthe electric power system(s); (2) maintain, withinthe limits of Good Utility Practice, scheduledinterchange with other Control Areas; (3) main-tain the frequency of the electric power system(s)within reasonable limits in accordance withGood Utility Practice; and (4) provide sufficient
� U.S.-Canada Power System Outage Task Force � Causes of the August 14th Blackout � 109

generating capacity to maintain operating reservesin accordance with Good Utility Practice.
Contingency: The unexpected failure or outage ofa system component, such as a generator, trans-mission line, circuit breaker, switch, or other elec-trical element. A contingency also may includemultiple components, which are related by situa-tions leading to simultaneous component outages.
Control Area Operator: An individual or organi-zation responsible for controlling generation tomaintain interchange schedule with other controlareas and contributing to the frequency regulationof the interconnection. The control area is an elec-tric system that is bounded by interconnectionmetering and telemetry.
Current (Electric): The rate of flow of electrons inan electrical conductor measured in Amperes.
DC: Direct current; current that is steady and doesnot change with time.
Dispatch Operator: Control of an integrated elec-tric system involving operations such as assign-ment of levels of output to specific generatingstations and other sources of supply; control oftransmission lines, substations, and equipment;operation of principal interties and switching; andscheduling of energy transactions.
Distribution Network: The portion of an electricsystem that is dedicated to delivering electricenergy to an end user, at or below 69 kV. The dis-tribution network consists primarily of low-voltage lines and transformers that “transport”electricity from the bulk power system to retailcustomers.
Disturbance: An unplanned event that producesan abnormal system condition.
Electrical Energy: The generation or use of elec-tric power by a device over a period of time,expressed in kilowatthours (kWh), megawatt-hours (MWh), or gigawatthours (GWh).
Electric Utility Corporation: Person, agency,authority, or other legal entity or instrumentalitythat owns or operates facilities for the generation,transmission, distribution, or sale of electricenergy primarily for use by the public, and isdefined as a utility under the statutes and rules bywhich it is regulated. An electric utility can beinvestor-owned, cooperatively owned, or govern-ment-owned (by a federal agency, crown corpora-tion, State, provincial government, municipalgovernment, and public power district).
Emergency: Any abnormal system condition thatrequires automatic or immediate manual action toprevent or limit loss of transmission facilities orgeneration supply that could adversely affect thereliability of the electric system.
Emergency Voltage Limits: The operating voltagerange on the interconnected systems that isacceptable for the time, sufficient for systemadjustments to be made following a facility outageor system disturbance.
EMS: An Energy Management System is a com-puter control system used by electric utility dis-patchers to monitor the real time performance ofvarious elements of an electric system and to con-trol generation and transmission facilities.
Fault: A fault usually means a short circuit, butmore generally it refers to some abnormal systemcondition. Faults occur as random events, usuallyan act of nature.
Federal Energy Regulatory Commission (FERC):Independent Federal agency within the U.S.Department of Energy that, among other responsi-bilities, regulates the transmission and wholesalesales of electricity in interstate commerce.
Flashover: A plasma arc initiated by some eventsuch as lightning. Its effect is a short circuit on thenetwork.
Flowgate: A single or group of transmission ele-ments intended to model MW flow impact relatingto transmission limitations and transmission ser-vice usage.
Forced Outage: The removal from service avail-ability of a generating unit, transmission line, orother facility for emergency reasons or a conditionin which the equipment is unavailable due tounanticipated failure.
Frequency: The number of complete alternationsor cycles per second of an alternating current,measured in Hertz. The standard frequency in theUnited States is 60 Hz. In some other countries thestandard is 50 Hz.
Frequency Deviation or Error: A departure fromscheduled frequency. The difference betweenactual system frequency and the scheduled sys-tem frequency.
Frequency Regulation: The ability of a ControlArea to assist the interconnected system in main-taining scheduled frequency. This assistance caninclude both turbine governor response and auto-matic generation control.
110 � U.S.-Canada Power System Outage Task Force � Causes of the August 14th Blackout �

Frequency Swings: Constant changes in fre-quency from its nominal or steady-state value.
Generation (Electricity): The process of produc-ing electrical energy from other forms of energy;also, the amount of electric energy produced, usu-ally expressed in kilowatt hours (kWh) or mega-watt hours (MWh).
Generator: Generall, an electromechanical deviceused to convert mechanical power to electricalpower.
Grid: An electrical transmission and/or distribu-tion network.
Grid Protection Scheme: Protection equipmentfor an electric power system, consisting of circuitbreakers, certain equipment for measuring electri-cal quantities (e.g., current and voltage sensors)and devices called relays. Each relay is designed toprotect the piece of equipment it has beenassigned from damage. The basic philosophy inprotection system design is that any equipmentthat is threatened with damage by a sustainedfault is to be automatically taken out of service.
Ground: A conducting connection between anelectrical circuit or device and the earth. A groundmay be intentional, as in the case of a safetyground, or accidental, which may result in highovercurrents.
Imbalance: A condition where the generation andinterchange schedules do not match demand.
Impedance: The total effects of a circuit thatoppose the flow of an alternating current consist-ing of inductance, capacitance, and resistance. Itcan be quantified in the units of ohms.
Independent System Operator (ISO): An organi-zation responsible for the reliable operation of thepower grid under its purview and for providingopen transmission access to all market partici-pants on a nondiscriminatory basis. An ISO isusually not-for-profit and can advise other utilitieswithin its territory on transmission expansion andmaintenance but does not have the responsibilityto carry out the functions.
Interchange: Electric power or energy that flowsacross tie-lines from one entity to another,whether scheduled or inadvertent.
Interconnected System: A system consisting oftwo or more individual electric systems that nor-mally operate in synchronism and have connect-ing tie lines.
Interconnection: When capitalized, any one of thefive major electric system networks in NorthAmerica: Eastern, Western, ERCOT (Texas), Qué-bec, and Alaska. When not capitalized, the facili-ties that connect two systems or Control Areas.Additionally, an interconnection refers to thefacilities that connect a nonutility generator to aControl Area or system.
Interface: The specific set of transmission ele-ments between two areas or between two areascomprising one or more electrical systems.
Island: A portion of a power system or severalpower systems that is electrically separated fromthe interconnection due to the disconnection oftransmission system elements.
Kilovar (kVAr): Unit of alternating current reac-tive power equal to 1,000 VArs.
Kilovolt (kV): Unit of electrical potential equal to1,000 Volts.
Kilovolt-Amperes (kVA): Unit of apparent powerequal to 1,000 volt amperes. Here, apparent poweris in contrast to real power. On ac systems the volt-age and current will not be in phase if reactivepower is being transmitted.
Kilowatthour (kWh): Unit of energy equaling onethousand watthours, or one kilowatt used overone hour. This is the normal quantity used formetering and billing electricity customers. Theprice for a kWh varies from approximately 4 centsto 15 cents. At a 100% conversion efficiency, onekWh is equivalent to about 4 fluid ounces of gaso-line, 3/16 pound of liquid petroleum, 3 cubic feetof natural gas, or 1/4 pound of coal.
Line Trip: Refers to the automatic opening of theconducting path provided by a transmission lineby the circuit breakers. These openings or “trips”are designed to protect the transmission line dur-ing faulted conditions.
Load (Electric): The amount of electric powerdelivered or required at any specific point orpoints on a system. The requirement originates atthe energy-consuming equipment of the consum-ers. Load should not be confused with demand,which is the measure of power that a load receivesor requires. See “Demand.”
Load Shedding: The process of deliberatelyremoving (either manually or automatically) pre-selected customer demand from a power system inresponse to an abnormal condition, to maintainthe integrity of the system and minimize overallcustomer outages.
� U.S.-Canada Power System Outage Task Force � Causes of the August 14th Blackout � 111

Lockout: A state of a transmission line followingbreaker operations where the condition detectedby the protective relaying was not eliminated bytemporarily opening and reclosing the line, possi-bly multiple times. In this state, the circuit break-ers cannot generally be reclosed without resettinga lockout device.
Market Participant: An entity participating in theenergy marketplace by buying/selling transmis-sion rights, energy, or ancillary services into, outof, or through an ISO-controlled grid.
Megawatthour (MWh): One million watthours.
NERC Interregional Security Network (ISN): Acommunications network used to exchange elec-tric system operating parameters in near real timeamong those responsible for reliable operations ofthe electric system. The ISN provides timely andaccurate data and information exchange amongreliability coordinators and other system opera-tors. The ISN, which operates over the frame relayNERCnet system, is a private Intranet that is capa-ble of handling additional applications betweenparticipants.
Normal (Precontingency) Operating Procedures:Operating procedures that are normally invokedby the system operator to alleviate potential facil-ity overloads or other potential system problemsin anticipation of a contingency.
Normal Voltage Limits: The operating voltagerange on the interconnected systems that isacceptable on a sustained basis.
North American Electric Reliability Council(NERC): A not-for-profit company formed by theelectric utility industry in 1968 to promote thereliability of the electricity supply in North Amer-ica. NERC consists of nine Regional ReliabilityCouncils and one Affiliate, whose membersaccount for virtually all the electricity supplied inthe United States, Canada, and a portion of BajaCalifornia Norte, Mexico. The members of theseCouncils are from all segments of the electricitysupply industry: investor-owned, federal, ruralelectric cooperative, state/municipal, and provin-cial utilities, independent power producers, andpower marketers. The NERC Regions are: EastCentral Area Reliability Coordination Agreement(ECAR); Electric Reliability Council of Texas(ERCOT); Mid-Atlantic Area Council (MAAC);Mid-America Interconnected Network (MAIN);Mid-Continent Area Power Pool (MAPP); North-east Power Coordinating Council (NPCC);
Southeastern Electric Reliability Council (SERC);Southwest Power Pool (SPP); Western SystemsCoordinating Council (WSCC); and Alaskan Sys-tems Coordination Council (ASCC, Affiliate).
Operating Criteria: The fundamental principlesof reliable interconnected systems operation,adopted by NERC.
Operating Guides: Operating practices that a Con-trol Area or systems functioning as part of a Con-trol Area may wish to consider. The application ofGuides is optional and may vary among ControlAreas to accommodate local conditions and indi-vidual system requirements.
Operating Policies: The doctrine developed forinterconnected systems operation. This doctrineconsists of Criteria, Standards, Requirements,Guides, and instructions, which apply to all Con-trol Areas.
Operating Procedures: A set of policies, practices,or system adjustments that may be automaticallyor manually implemented by the system operatorwithin a specified time frame to maintain theoperational integrity of the interconnected electricsystems.
Operating Requirements: Obligations of a ControlArea and systems functioning as part of a ControlArea.
Operating Standards: The obligations of a ControlArea and systems functioning as part of a ControlArea that are measurable. An Operating Standardmay specify monitoring and surveys forcompliance.
Outage: The period during which a generatingunit, transmission line, or other facility is out ofservice.
Post-contingency Operating Procedures: Oper-ating procedures that may be invoked by the sys-tem operator to mitigate or alleviate systemproblems after a contingency has occurred.
Protective Relay: A device designed to detectabnormal system conditions, such as electricalshorts on the electric system or within generatingplants, and initiate the operation of circuit break-ers or other control equipment.
Power/Phase Angle: The angular relationshipbetween an ac (sinusoidal) voltage across a circuitelement and the ac (sinusoidal) current through it.The real power that can flow is related to thisangle.
112 � U.S.-Canada Power System Outage Task Force � Causes of the August 14th Blackout �

Power: See “Active Power.”
Reactive Power: The portion of electricity thatestablishes and sustains the electric and magneticfields of alternating-current equipment. Reactivepower must be supplied to most types of magneticequipment, such as motors and transformers. Italso must supply the reactive losses on transmis-sion facilities. Reactive power is provided by gen-erators, synchronous condensers, or electrostaticequipment such as capacitors and directly influ-ences electric system voltage. It is usuallyexpressed in kilovars (kVAr) or megavars (MVAr).The mathematical product of voltage and currentconsumed by reactive loads. Examples of reactiveloads include capacitors and inductors. Thesetypes of loads, when connected to an ac voltagesource, will draw current, but because the currentis 90 degrees out of phase with the applied voltage,they actually consume no real power in the idealsense.
Real Power: See “Active Power.”
Regional Transmission Operator (RTO): An orga-nization that is independent from all generationand power marketing interests and has exclusiveresponsibility for electric transmission grid opera-tions, short-term electric reliability, and transmis-sion services within a multi-State region. Toachieve those objectives, the RTO manages trans-mission facilities owned by different companiesand encompassing one, large, contiguous geo-graphic area.
Relay: A device that controls the opening and sub-sequent reclosing of circuit breakers. Relays takemeasurements from local current and voltagetransformers, and from communication channelsconnected to the remote end of the lines. A relayoutput trip signal is sent to circuit breakers whenneeded.
Relay Setting: The parameters that determinewhen a protective relay will initiate operation ofcircuit breakers or other control equipment.
Reliability: The degree of performance of the ele-ments of the bulk electric system that results inelectricity being delivered to customers withinaccepted standards and in the amount desired.Reliability may be measured by the frequency,duration, and magnitude of adverse effects on theelectric supply. Electric system reliability can beaddressed by considering two basic and func-tional aspects of the electric system Adequacy andSecurity.
Reliability Coordinator: An individual or organi-zation responsible for the safe and reliable
operation of the interconnected transmission sys-tem for their defined area, in accordance withNERC reliability standards, regional criteria, andsubregional criteria and practices.
Resistance: The characteristic of materials torestrict the flow of current in an electric circuit.Resistance is inherent in any electric wire, includ-ing those used for the transmission of electricpower. Resistance in the wire is responsible forheating the wire as current flows through it andthe subsequent power loss due to that heating.
Restoration: The process of returning generatorsand transmission system elements and restoringload following an outage on the electric system.
Safe Limits: System limits on quantities such asvoltage or power flows such that if the system isoperated within these limits it is secure andreliable.
SCADA: Supervisory Control and Data Acquisi-tion system; a system of remote control and telem-etry used to monitor and control the electricsystem.
Scheduling Coordinator: An entity certified bythe ISO for the purpose of undertaking schedulingfunctions.
Security: The ability of the electric system to with-stand sudden disturbances such as electric shortcircuits or unanticipated loss of system elements.
Security Coordinator: An individual or organiza-tion that provides the security assessment andemergency operations coordination for a group ofControl Areas.
Short Circuit: A low resistance connection unin-tentionally made between points of an electricalcircuit, which may result in current flow far abovenormal levels.
Single Contingency: The sudden, unexpected fail-ure or outage of a system facility(s) or element(s)(generating unit, transmission line, transformer,etc.). Elements removed from service as part of theoperation of a remedial action scheme are consid-ered part of a single contingency.
Special Protection System: An automatic protec-tion system designed to detect abnormal or prede-termined system conditions, and take correctiveactions other than and/or in addition to the isola-tion of faulted components.
Stability: The ability of an electric system to main-tain a state of equilibrium during normal andabnormal system conditions or disturbances.
� U.S.-Canada Power System Outage Task Force � Causes of the August 14th Blackout � 113

Stability Limit: The maximum power flow possi-ble through a particular point in the system whilemaintaining stability in the entire system or thepart of the system to which the stability limitrefers.
State Estimator: Computer software that takesredundant measurements of quantities related tosystem state as input and provides an estimate ofthe system state (bus voltage phasors). It is used toconfirm that the monitored electric power systemis operating in a secure state by simulating the sys-tem both at the present time and one step ahead,for a particular network topology and loading con-dition. With the use of a state estimator and itsassociated contingency analysis software, systemoperators can review each critical contingency todetermine whether each possible future state iswithin reliability limits.
Station: A node in an electrical network whereone or more elements are connected. Examplesinclude generating stations and substations.
Substation: Facility equipment that switches,changes, or regulates electric voltage.
Subtransmission: A functional or voltage classifi-cation relating to lines at voltage levels between69kV and 115kV.
Supervisory Control and Data Acquisition(SCADA): See SCADA.
Surge: A transient variation of current, voltage, orpower flow in an electric circuit or across an elec-tric system.
Surge Impedance Loading: The maximumamount of real power that can flow down alossless transmission line such that the line doesnot require any VArs to support the flow.
Switching Station: Facility equipment used to tietogether two or more electric circuits throughswitches. The switches are selectively arranged topermit a circuit to be disconnected, or to changethe electric connection between the circuits.
Synchronize: The process of connecting two pre-viously separated alternating current apparatusesafter matching frequency, voltage, phase angles,etc. (e.g., paralleling a generator to the electricsystem).
System: An interconnected combination of gener-ation, transmission, and distribution componentscomprising an electric utility and independent
power producer(s) (IPP), or group of utilities andIPP(s).
System Operator: An individual at an electric sys-tem control center whose responsibility it is tomonitor and control that electric system in realtime.
System Reliability: A measure of an electric sys-tem’s ability to deliver uninterrupted service atthe proper voltage and frequency.
Thermal Limit: A power flow limit based on thepossibility of damage by heat. Heating is caused bythe electrical losses which are proportional to thesquare of the active power flow. More precisely, athermal limit restricts the sum of the squares ofactive and reactive power.
Tie-line: The physical connection (e.g. transmis-sion lines, transformers, switch gear, etc.) betweentwo electric systems that permits the transfer ofelectric energy in one or both directions.
Time Error: An accumulated time differencebetween Control Area system time and the timestandard. Time error is caused by a deviation inInterconnection frequency from 60.0 Hertz.
Time Error Correction: An offset to the Intercon-nection’s scheduled frequency to correct for thetime error accumulated on electric clocks.
Transfer Limit: The maximum amount of powerthat can be transferred in a reliable manner fromone area to another over all transmission lines (orpaths) between those areas under specified systemconditions.
Transformer: A device that operates on magneticprinciples to increase (step up) or decrease (stepdown) voltage.
Transient Stability: The ability of an electric sys-tem to maintain synchronism between its partswhen subjected to a disturbance of specifiedseverity and to regain a state of equilibrium fol-lowing that disturbance.
Transmission: An interconnected group of linesand associated equipment for the movement ortransfer of electric energy between points of sup-ply and points at which it is transformed for deliv-ery to customers or is delivered to other electricsystems.
Transmission Loading Relief (TLR): A procedureused to manage congestion on the electric trans-mission system.
114 � U.S.-Canada Power System Outage Task Force � Causes of the August 14th Blackout �
Transmission Margin: The difference betweenthe maximum power flow a transmission line canhandle and the amount that is currently flowingon the line.
Transmission Operator: NERC-certified personresponsible for monitoring and assessing localreliability conditions, who operates the transmis-sion facilities, and who executes switching ordersin support of the Reliability Authority.
Transmission Overload: A state where a transmis-sion line has exceeded either a normal or emer-gency rating of the electric conductor.
Transmission Owner (TO) or Transmission Pro-vider: Any utility that owns, operates, or controlsfacilities used for the transmission of electricenergy.
Trip: The opening of a circuit breaker or breakerson an electric system, normally to electrically iso-late a particular element of the system to prevent itfrom being damaged by fault current or otherpotentially damaging conditions. See Line Trip forexample.
Voltage: The electrical force, or “pressure,” thatcauses current to flow in a circuit, measured inVolts.
Voltage Collapse (decay): An event that occurswhen an electric system does not have adequatereactive support to maintain voltage stability.Voltage Collapse may result in outage of systemelements and may include interruption in serviceto customers.
Voltage Control: The control of transmission volt-age through adjustments in generator reactive out-put and transformer taps, and by switchingcapacitors and inductors on the transmission anddistribution systems.
Voltage Limits: A hard limit above or below whichis an undesirable operating condition. Normallimits are between 95 and 105 percent of the nomi-nal voltage at the bus under discussion.
Voltage Reduction: A procedure designed todeliberately lower the voltage at a bus. It is oftenused as a means to reduce demand by lowering thecustomer’s voltage.
Voltage Stability: The condition of an electric sys-tem in which the sustained voltage level is con-trollable and within predetermined limits.
Watthour (Wh): A unit of measure of electricalenergy equal to 1watt of power supplied to, ortaken from, an electric circuit steadily for 1 hour.
� U.S.-Canada Power System Outage Task Force � Causes of the August 14th Blackout � 115


Appendix D
Transmittal Letters from the Three Working Groups
� U.S.-Canada Power System Outage Task Force � Causes of the August 14th Blackout � 117
Mr. James W. Glotfelty Director, Office of Electric Transmission and Distribution U.S. Department of Energy 1000 Independence Avenue SW Washington, DC 20585 Dr. Nawal Kamel Special Assistant to the Deputy Minister Natural Resources Canada 580 Booth Street Ottawa, ON K1A 0E4 Dear Mr. Glotfelty and Dr. Kamel: Enclosed is the Interim Report of the Electric System Working Group (ESWG) supporting the United States - Canada Power System Outage Task Force. This report presents the results of an intensive and thorough investigation by a bi-national team of the causes of the blackout that occurred on August 14, 2003. The report was written largely by four members of the Working Group (Joe Eto, David Meyer, Alison Silverstein, and Tom Rusnov), with important assistance from many members of the Task Force’s investigative team. Other members of the ESWG reviewed the report in draft and provided valuable suggestions for its improvement. Those members join us in this submittal and have signed on the attached page. Due to schedule conflicts, one member of the ESWG was not able to participate in the final review of the report and has not signed this transmittal letter for that reason. Sincerely,

118 � U.S.-Canada Power System Outage Task Force � Causes of the August 14th Blackout �
2
(not able to participate in review) William D. McCarty, Chairman Indiana Utility Regulatory Commission
David McFadden Chair, National Energy and Infrastructure Industry Group Gowlings, Lafleur, Henderson LLP Ontario
David O’Connor, Commissioner Div. of Energy Resources Massachusetts Office of Consumer Affairs And Business Regulation
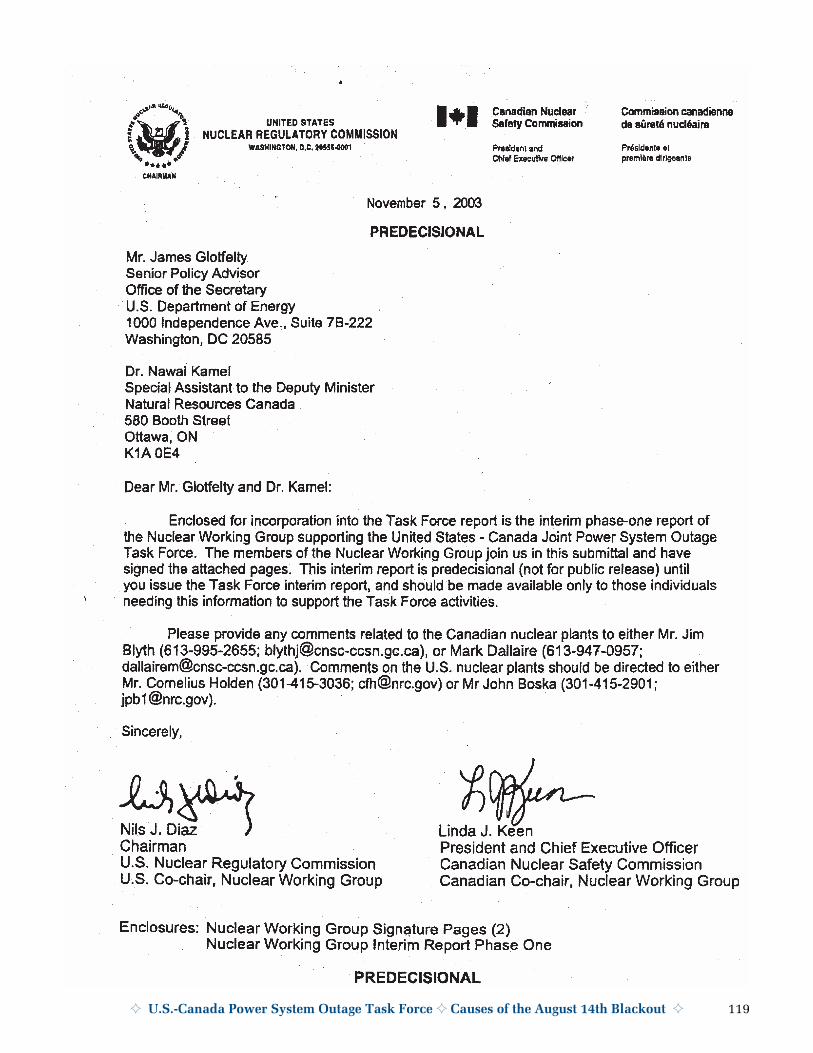
� U.S.-Canada Power System Outage Task Force � Causes of the August 14th Blackout � 119

120 � U.S.-Canada Power System Outage Task Force � Causes of the August 14th Blackout �

� U.S.-Canada Power System Outage Task Force � Causes of the August 14th Blackout � 121

122 � U.S.-Canada Power System Outage Task Force � Causes of the August 14th Blackout �

� U.S.-Canada Power System Outage Task Force � Causes of the August 14th Blackout � 123
Mr. James W. Glotfelty Director, Office of Electric Transmission and Distribution U.S. Department of Energy 1000 Independence Avenue SW Washington, DC 20585 Dr. Nawal Kamel Special Assistant to the Deputy Minister Natural Resources Canada 580 Booth Street Ottawa, ON K1A 0E4 Dear Mr. Glotfelty and Dr. Kamel: Enclosed is the Interim Report of the Security Working Group (SWG) supporting the United States - Canada Power System Outage Task Force. The SWG Interim Report presents the results of the Working Group`s analysis to date of the security aspects of the power outage that occurred on August 14, 2003. This report comprises input from public sector, private sector, and academic members of the SWG, with important assistance from many members of the Task Force’s investigative team. As co-chairs of the Security Working Group, we represent all members of the SWG in this submittal and have signed below. Sincerely,

124 � U.S.-Canada Power System Outage Task Force � Causes of the August 14th Blackout �
Attachment 1: U.S.-Canada Power System Outage Task Force SWG Steering Committee members:
Bob Liscouski, Assistant Secretary for Infrastructure Protection, Department of Homeland Security (U.S. Government) (Co-Chair)
William J.S. Elliott, Assistant Secretary to the Cabinet, Security and Intelligence, Privy Council Office (Government of Canada) (Co-Chair)
U.S. Members
Andy Purdy, Deputy Director, National Cyber Security Division, Department of Homeland Security
Hal Hendershot, Acting Section Chief, Computer Intrusion Section, FBI
Steve Schmidt, Section Chief, Special Technologies and Applications, FBI
Kevin Kolevar, Senior Policy Advisor to the Secretary, DoE
Simon Szykman, Senior Policy Analyst, U.S. Office of Science &Technology Policy, White House
Vincent DeRosa, Deputy Commissioner, Director of Homeland Security (Connecticut)
Richard Swensen, Under-Secretary, Office of Public Safety and Homeland Security (Massachusetts)
Colonel Michael C. McDaniel (Michigan)
Sid Caspersen, Director, Office of Counter-Terrorism (New Jersey)
James McMahon, Senior Advisor (New York)
John Overly, Executive Director, Division of Homeland Security (Ohio)
Arthur Stephens, Deputy Secretary for Information Technology, (Pennsylvania)
Kerry L. Sleeper, Commissioner, Public Safety (Vermont)
Canada Members
James Harlick, Assistant Deputy Minister, Office of Critical Infrastructure Protection and Emergency Preparedness
Michael Devaney, Deputy Chief, Information Technology Security Communications Security Establishment
Peter MacAulay, Officer, Technological Crime Branch of the Royal Canadian Mounted Police
Gary Anderson, Chief, Counter-Intelligence – Global, Canadian Security Intelligence Service
Dr. James Young, Commissioner of Public Security, Ontario Ministry of Public Safety and Security