Embed Size (px)
Citation preview

Interim report
April - June 2015
July 16th 2015
Lars Wollung, CEO
Erik Forsberg, CFO

© Intrum Justitia AB 2014. All rights reserved.
Q2 Key highlights
• Continued strong financial performance
‒ EBIT excluding revaluations and fx-impact +11%
‒ All three financial targets met, with EPS growth last 12 months at 37%
• Financial performance driven by strength of our hybrid business model
‒ CMS: earnings growth and solid margins
‒ Purchased Debt: continued increase in PD Book Value at increasing RoIs
‒ Success of each service area continues to reinforce each other
• Development of new services
‒ Promising start for Avarda, client pipeline growing
• Operational excellence initiatives deliver results
‒ Good uptake in collections, increased performance vs forecast
2(25)

© Intrum Justitia AB 2014. All rights reserved.
Q2 Key financials
3(25)
11% EBIT growth (adjusted for currency and debt portfolio revaluations)
37% RTM EPS growth
30% Growth in operating cash flow
24% Return on purchased debt
509 MSEK investments in purchased debt
7% Growth in purchased debt book value
© Intrum Justitia AB 2014. All rights reserved.
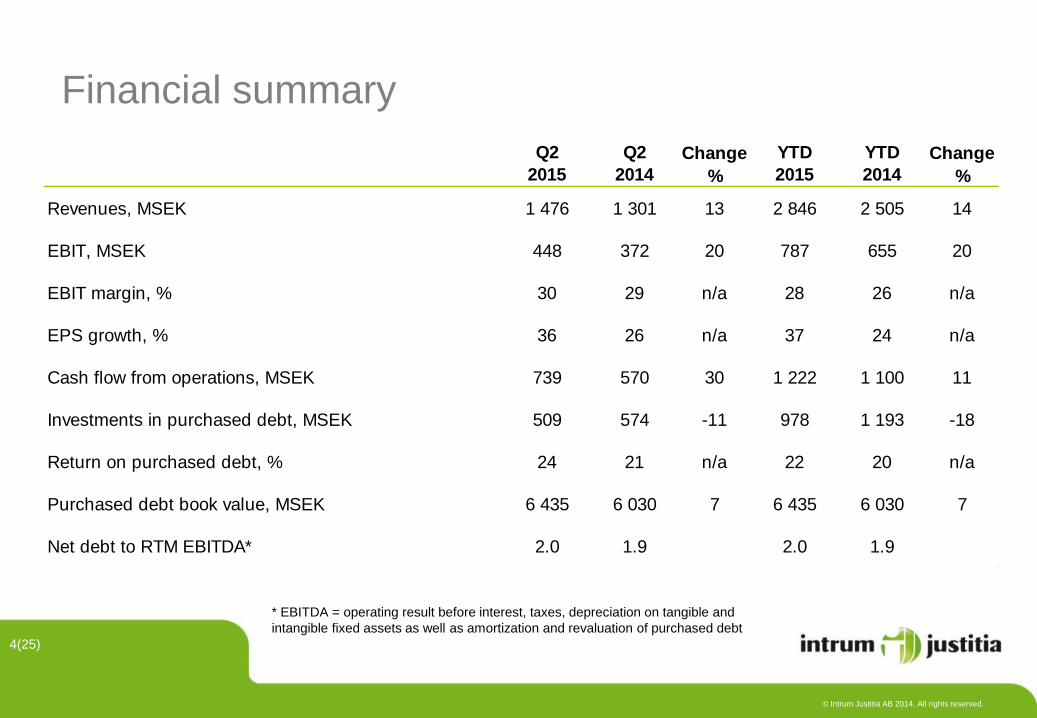
Financial summary
4(25)
* EBITDA = operating result before interest, taxes, depreciation on tangible and
intangible fixed assets as well as amortization and revaluation of purchased debt
Q2 Q2 YTD YTD
2015 2014 2015 2014
Revenues, MSEK 1 476 1 301 13 2 846 2 505 14
EBIT, MSEK 448 372 20 787 655 20
EBIT margin, % 30 29 n/a 28 26 n/a
EPS growth, % 36 26 n/a 37 24 n/a
Cash flow from operations, MSEK 739 570 30 1 222 1 100 11
Investments in purchased debt, MSEK 509 574 -11 978 1 193 -18
Return on purchased debt, % 24 21 n/a 22 20 n/a
Purchased debt book value, MSEK 6 435 6 030 7 6 435 6 030 7
Net debt to RTM EBITDA* 2.0 1.9 2.0 1.9
Change
%
Change
%
© Intrum Justitia AB 2014. All rights reserved.
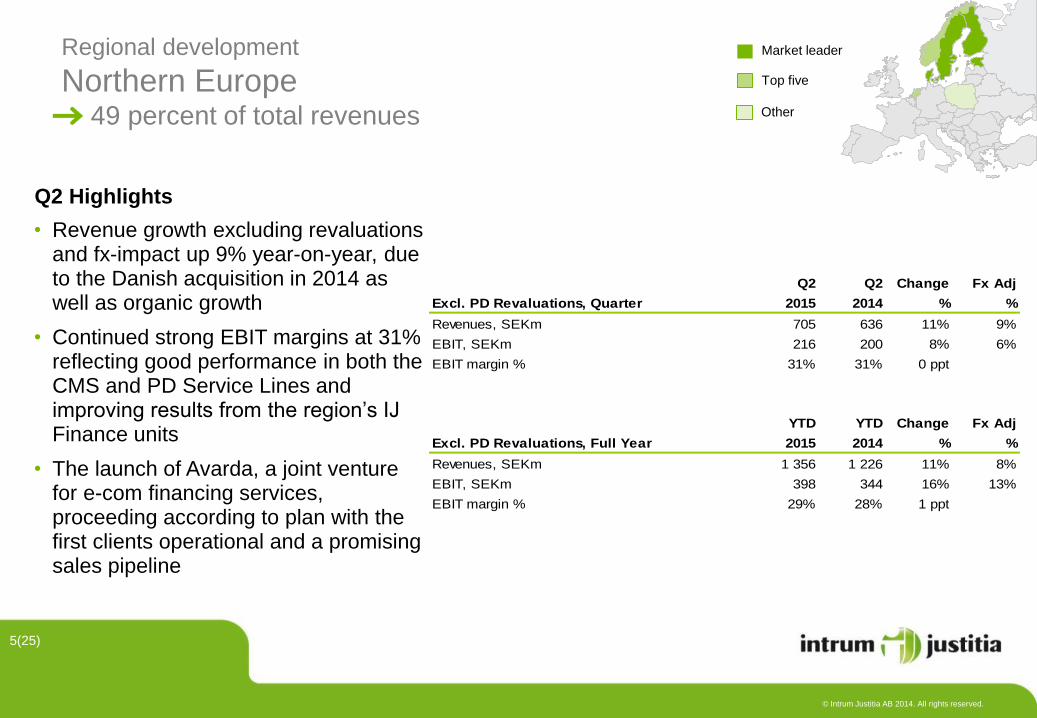
Regional development
Northern Europe 49 percent of total revenues
• Revenue growth excluding revaluations and fx-impact up 9% year-on-year, due to the Danish acquisition in 2014 as well as organic growth
• Continued strong EBIT margins at 31% reflecting good performance in both the CMS and PD Service Lines and improving results from the region’s IJ Finance units
• The launch of Avarda, a joint venture for e-com financing services, proceeding according to plan with the first clients operational and a promising sales pipeline
Q2 Highlights
5(25)
Market leader
Top five
Other
Q2 Q2 Change Fx Adj
Excl. PD Revaluations, Quarter 2015 2014 % %
Revenues, SEKm 705 636 11% 9%
EBIT, SEKm 216 200 8% 6%
EBIT margin % 31% 31% 0 ppt
YTD YTD Change Fx Adj
Excl. PD Revaluations, Full Year 2015 2014 % %
Revenues, SEKm 1 356 1 226 11% 8%
EBIT, SEKm 398 344 16% 13%
EBIT margin % 29% 28% 1 ppt

© Intrum Justitia AB 2014. All rights reserved.
• Continued good revenue growth excluding fx-effects, mainly from strong collections for the PD service line
• Operational excellence programs contributes to improved returns from PD, generating good growth in EBIT and EBIT margins
• Integration of the acquired CMS unit in Switzerland during Q1 developing according to plan
• Significant positive fx-impact from appreciation of CHF/SEK
6(25)
Regional development
Central Europe 29 percent of total revenues
Market leader
Top five
Other
Q2 Highlights
Q2 Q2 Change Fx Adj
Excl. PD Revaluations, Quarter 2015 2014 % %
Revenues, SEKm 414 337 23% 11%
EBIT, SEKm 121 87 39% 26%
EBIT margin % 29% 26% 3 ppt
YTD YTD Change Fx Adj
Excl. PD Revaluations, Full Year 2015 2014 % %
Revenues, SEKm 824 674 22% 10%
EBIT, SEKm 246 182 35% 22%
EBIT margin % 30% 27% 3 ppt

© Intrum Justitia AB 2014. All rights reserved.
Regional development
Western Europe 22 percent of total revenues
• Revenue development approximately flat year-on-year, with growth in PD offset by slight decline for CMS
• Improvement in profitability mainly due to increased share of PD revenues
• Harry Vranjes, acting Regional Managing Director since March, appointed to this role on a permanent basis as of early July
Q2 Highlights
7(25)
Market leader
Top five
Other
Q2 Q2 Change Fx Adj
Excl. PD Revaluations, Quarter 2015 2014 % %
Revenues, SEKm 312 305 2% -1%
EBIT, SEKm 66 62 6% 3%
EBIT margin % 21% 20% 1 ppt
YTD YTD Change Fx Adj
Excl. PD Revaluations, Full Year 2015 2014 % %
Revenues, SEKm 628 592 6% 1%
EBIT, SEKm 105 116 -9% -13%
EBIT margin % 17% 20% -3 ppt
© Intrum Justitia AB 2014. All rights reserved.
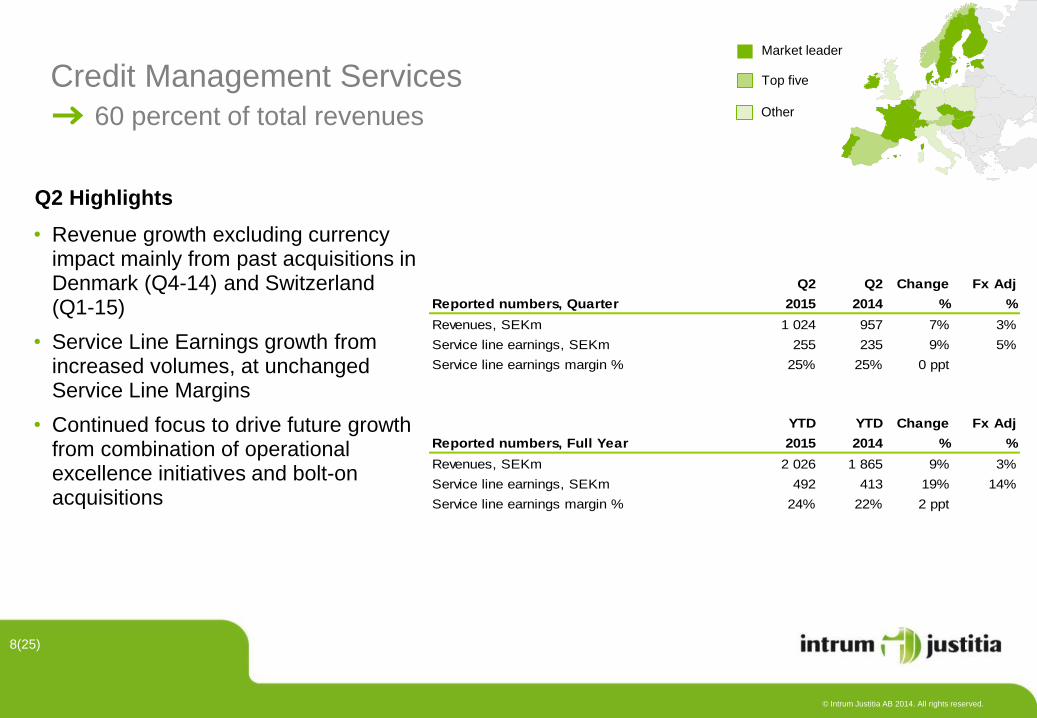
Credit Management Services
60 percent of total revenues
Q2 Highlights
• Revenue growth excluding currency impact mainly from past acquisitions in Denmark (Q4-14) and Switzerland (Q1-15)
• Service Line Earnings growth from increased volumes, at unchanged Service Line Margins
• Continued focus to drive future growth from combination of operational excellence initiatives and bolt-on acquisitions
8(25)
Market leader
Top five
Other
Q2 Q2 Change Fx Adj
Reported numbers, Quarter 2015 2014 % %
Revenues, SEKm 1 024 957 7% 3%
Service line earnings, SEKm 255 235 9% 5%
Service line earnings margin % 25% 25% 0 ppt
YTD YTD Change Fx Adj
Reported numbers, Full Year 2015 2014 % %
Revenues, SEKm 2 026 1 865 9% 3%
Service line earnings, SEKm 492 413 19% 14%
Service line earnings margin % 24% 22% 2 ppt

© Intrum Justitia AB 2014. All rights reserved.
Financial Services 40 percent of total revenues
• PD Book Value growth at 7% (5% fx-adjusted) coupled with strong collections generated good revenue growth and improved Service Line earnings.
• Financial performance further improved due to positive revaluations at 45 MSEK (Q2-14: 23 MSEK). PD RoI excluding revaluations were 21% (Q2-14: 20%)
• Market conditions for PD investments remain similar to previous quarters, with good supply in many markets but also significant price competition
Q2 Highlights
9(25)
Market leader
Top five
Other
Q2 Q2 Change Fx Adj
Reported numbers, Quarter 2015 2014 % %
Revenues, SEKm 672 554 21% 15%
Service line earnings, SEKm 381 312 22% 17%
Service line earnings margin % 57% 56% 1 ppt
Investments in PD, SEKm 509 574 -11%
ROI 24% 21% 3 ppt
PD Book Value closing balance 6 435 6 030 7%
YTD YTD Change Fx Adj
Reported numbers, Full Year 2015 2014 % %
Revenues, SEKm 1 246 1 039 20% 13%
Service line earnings, SEKm 689 576 20% 13%
Service line earnings margin % 55% 55% 0 ppt
Investments in PD, SEKm 978 1 193 -18%
ROI 22% 20% 2 ppt
PD Book Value closing balance 6 435 6 030 7%
© Intrum Justitia AB 2014. All rights reserved.
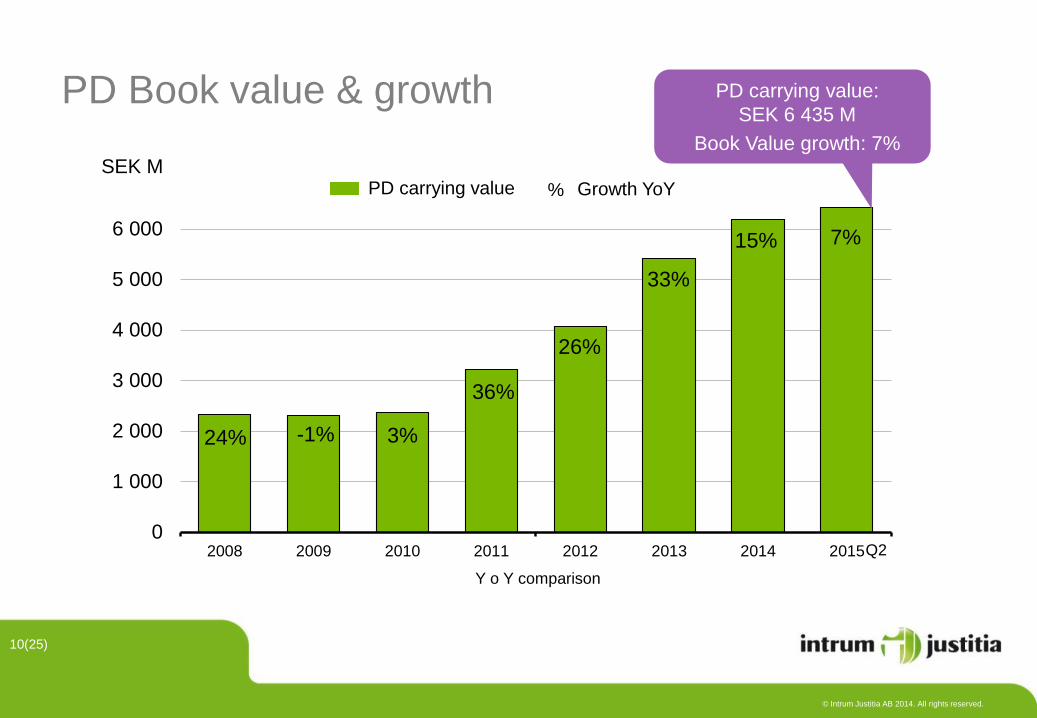
24% 3%
36%
26%
33%
15% 7%
0%
5%
10%
15%
20%
25%
30%
35%
40%
45%
50%
0
1 000
2 000
3 000
4 000
5 000
6 000
2008 2009 2010 2011 2012 2013 2014 2015
PD Book value & growth
10(25)
SEK M
PD carrying value:
SEK 6 435 M
Book Value growth: 7%
PD carrying value Growth YoY %
Q2
Y o Y comparison
-1%

© Intrum Justitia AB 2014. All rights reserved.
Purchased debt, investments & ROI 2008–2015
11(25)
872 871 1050
1804 2014
2475
619 469
574 509
267
477
0%
5%
10%
15%
20%
25%
0
500
1 000
1 500
2 000
2 500
2008 2009 2010 2011 2012 2013 2014 2015
266
978
KSEK
SEK M
Q1
Q2
Q3
Q4
FY
1 937
KSEK
PD ROI RTM excl revaluation
1) 2008 – 2013 paid investments
2) 2014 – 2015 booked investments

© Intrum Justitia AB 2014. All rights reserved.
Purchased debt - revaluations
12(25)
Q2 YTD Q2 YTD
PD revaluations, SEK m 2015 2015 2014 2014
Northern Europe 12 -21 12 0
Central Europe 19 37 8 10
Western Europe 14 22 3 3
Total 45 38 23 13
© Intrum Justitia AB 2014. All rights reserved.
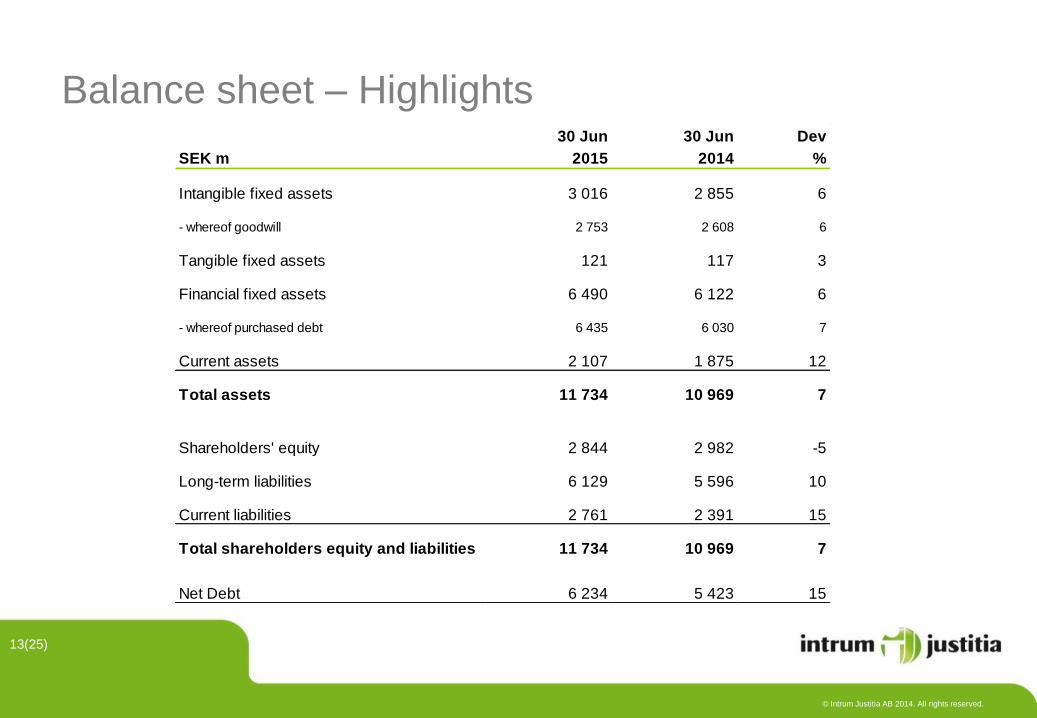
Balance sheet – Highlights
13(25)
30 Jun 30 Jun Dev
SEK m 2015 2014 %
Intangible fixed assets 3 016 2 855 6
- whereof goodwill 2 753 2 608 6
Tangible fixed assets 121 117 3
Financial fixed assets 6 490 6 122 6
- whereof purchased debt 6 435 6 030 7
Current assets 2 107 1 875 12
Total assets 11 734 10 969 7
Shareholders' equity 2 844 2 982 -5
Long-term liabilities 6 129 5 596 10
Current liabilities 2 761 2 391 15
Total shareholders equity and liabilities 11 734 10 969 7
Net Debt 6 234 5 423 15

© Intrum Justitia AB 2014. All rights reserved.
Cash flow statement
14(25)
Q2 Q2 Dev YTD YTD Dev
SEK m 2015 2014 % 2015 2014 %
Operating earnings (EBIT) 448 372 20 787 655 20
Depreciation 40 40 0 81 78 4
Amortization and revaluation of purchased debt 345 337 2 712 697 2
Income tax paid -21 -56 -63 -161 -101 59
Changes in factoring receivables -25 -24 4 -45 -25 80
Other changes in working capital 12 -63 n/a -33 -104 -68
Financial net & other non-cash items -60 -36 67 -119 -100 19
Cash flow from operating activities (CFFO) 739 570 30 1 222 1 100 11
Purchases of tangible and intangible fixed assets (CAPEX) -37 -32 16 -68 -60 13
Purchases of debt -589 -537 10 -1 067 -1 225 -13
Acquisitions and other cash flow from investing activities -14 -7 100 -51 17 n/a
Cash flow from investing activities (CFFI) -640 -576 11 -1 186 -1 268 -6
Free cash flow (CFFO - CFFI) 99 -6 n/a 36 -168 n/a

© Intrum Justitia AB 2014. All rights reserved.
Funding base
• Syndicated bank loan facility (up to SEK 5bn)
‒ About SEK 2,4 bn utilized per Jun 2015
‒ Loan facility allows a total financing of up to SEK 10 bn
• Corporate bonds (up to SEK 5 bn under MTN program)
‒ SEK 1 bn, 5Y note, issued in March 2012 (margin of 3,10%)
‒ SEK 1 bn, 5Y note, issued in June 2013 (margin of 2,22%)
‒ SEK 1 bn, 5Y note, issued in May 2014 (margin of 1,60%)
• Commercial Paper (up to SEK 1,5bn)
‒ SEK 0,8 bn outstanding per Jun 2015
• Co-Investors – for large portfolios of receivables
‒ Typically participate by 50-75% of total investment
15(25)
0
500
1000
1500
2000
2500
3000
3500
2015 2016 2017 2018 2019
Debt Maturity Schedule (SEK million)
Commercial Paper Bank Loan Bonds

© Intrum Justitia AB 2014. All rights reserved.
Financial targets
16(25)
Financial targets Q2 15 Q2 15 RTM FY 2014
1. EPS growth to exceed 10% per year 36% 37% 31%
2. Return on PD investments to exceed 15% per year 24% 20% 20%
3. Net Debt/EBITDA should be between 2.0 and 3.0 2.0 2.0 1.9
© Intrum Justitia AB 2014. All rights reserved.
17(25)
Q&A

© Intrum Justitia AB 2014. All rights reserved.
18(25)
Appendix

© Intrum Justitia AB 2014. All rights reserved.
This is Intrum Justitia
19(25)
Delivering consistent, strong financial returns
Proven hybrid business model serving the full
credit management value chain
European market leader in an attractive growth
market
Diversification of risk through broad base of clients,
sources and countries
2014 2013
Revenue 5 184 4 566
EBIT 1 430 1 207
# Average Nr
of Employees 3 801 3 530
Market leader
Top five
Other

© Intrum Justitia AB 2014. All rights reserved.
0
5
10
15
20
25
30
0
500
1 000
1 500
2 000
2 500
3 000
3 500
4 000
4 500
5 000
5 500
6 000
2008 2009 2010 2011 2012 2013 2014 2015
Revenues
EBIT
EBIT-margin (RHS)
Revenues and EBIT margin, rolling 12 months
20(25)
%
Revenues: SEK 5 525 M
EBIT margin: 28% SEK M
Q2

© Intrum Justitia AB 2014. All rights reserved.
Gross Collections vs. Active Forecast - R12
21(25)
0%
2%
4%
6%
8%
10%
Q111 Q211 Q311 Q411 Q112 Q212 Q312 Q412 Q113 Q213 Q313 Q413 Q114 Q214 Q314 Q414 Q115 Q215
© Intrum Justitia AB 2014. All rights reserved.
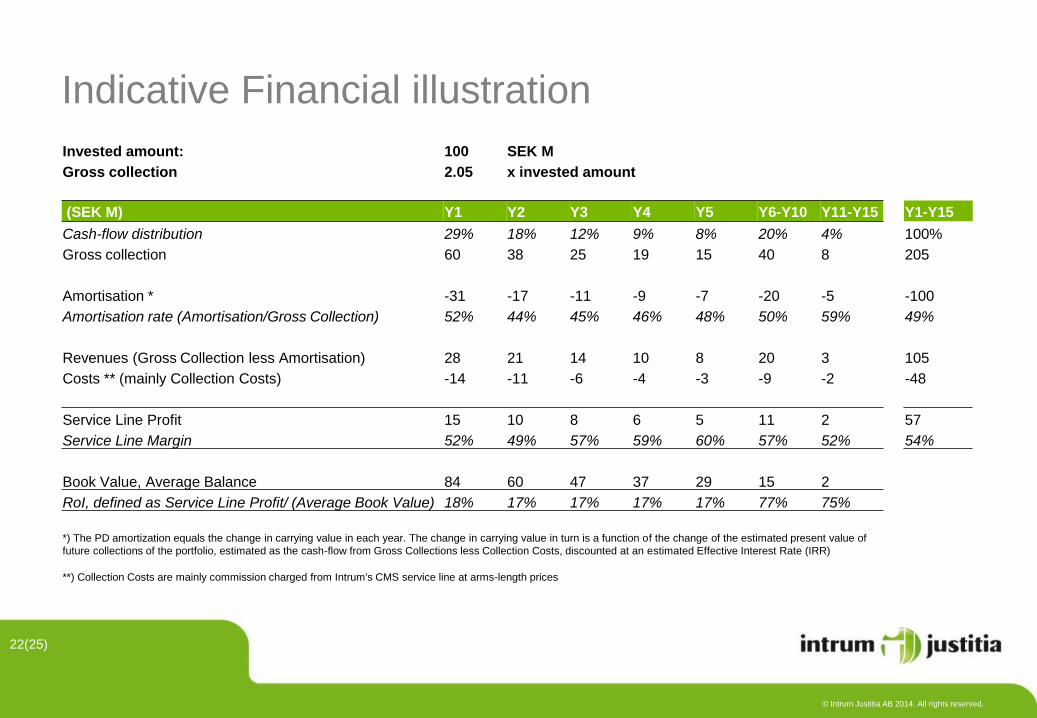
Indicative Financial illustration
22(25)
Invested amount: 100 SEK M
Gross collection 2.05 x invested amount
(SEK M) Y1 Y2 Y3 Y4 Y5 Y6-Y10 Y11-Y15 Y1-Y15
Cash-flow distribution 29% 18% 12% 9% 8% 20% 4% 100%
Gross collection 60 38 25 19 15 40 8 205
Amortisation * -31 -17 -11 -9 -7 -20 -5 -100
Amortisation rate (Amortisation/Gross Collection) 52% 44% 45% 46% 48% 50% 59% 49%
Revenues (Gross Collection less Amortisation) 28 21 14 10 8 20 3 105
Costs ** (mainly Collection Costs) -14 -11 -6 -4 -3 -9 -2 -48
Service Line Profit 15 10 8 6 5 11 2 57
Service Line Margin 52% 49% 57% 59% 60% 57% 52% 54%
Book Value, Average Balance 84 60 47 37 29 15 2
RoI, defined as Service Line Profit/ (Average Book Value) 18% 17% 17% 17% 17% 77% 75%
*) The PD amortization equals the change in carrying value in each year. The change in carrying value in turn is a function of the change of the estimated present value of
future collections of the portfolio, estimated as the cash-flow from Gross Collections less Collection Costs, discounted at an estimated Effective Interest Rate (IRR)
**) Collection Costs are mainly commission charged from Intrum's CMS service line at arms-length prices
© Intrum Justitia AB 2014. All rights reserved.
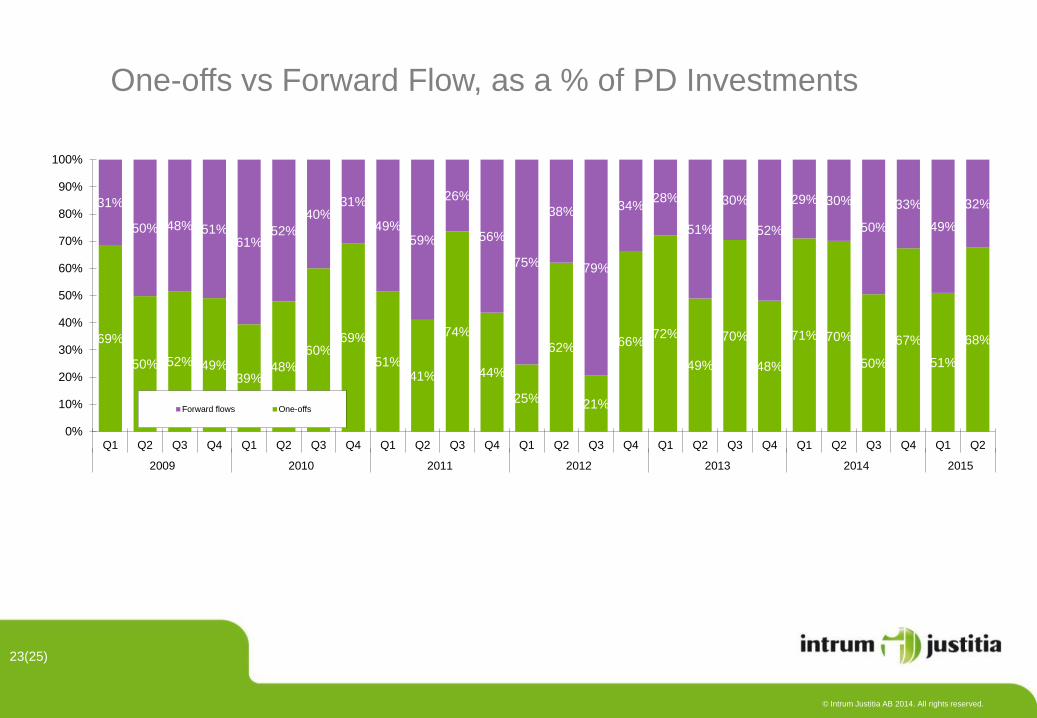
One-offs vs Forward Flow, as a % of PD Investments
23(25)
69%
50% 52% 49%39%
48%
60%69%
51%41%
74%
44%
25%
62%
21%
66%72%
49%
70%
48%
71% 70%
50%
67%
51%
68%
31%
50% 48% 51%61%
52%
40%31%
49%59%
26%
56%
75%
38%
79%
34%28%
51%
30%
52%
29% 30%
50%
33%
49%
32%
0%
10%
20%
30%
40%
50%
60%
70%
80%
90%
100%
Q1 Q2 Q3 Q4 Q1 Q2 Q3 Q4 Q1 Q2 Q3 Q4 Q1 Q2 Q3 Q4 Q1 Q2 Q3 Q4 Q1 Q2 Q3 Q4 Q1 Q2
2009 2010 2011 2012 2013 2014 2015
Forward flows One-offs
© Intrum Justitia AB 2014. All rights reserved.
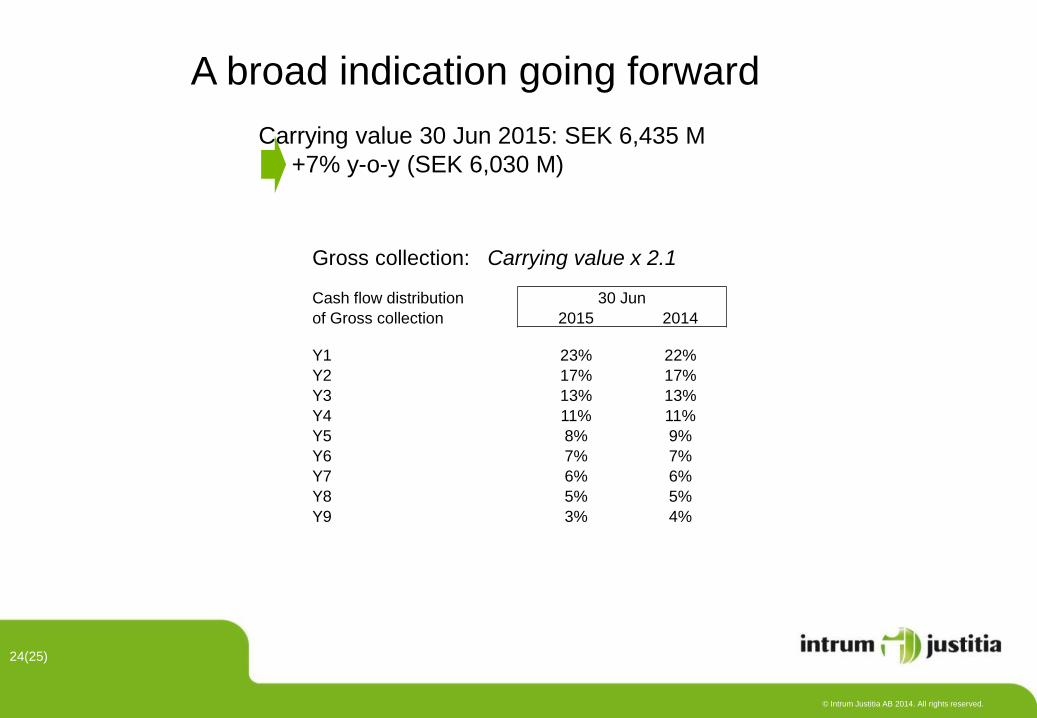
A broad indication going forward
Carrying value 30 Jun 2015: SEK 6,435 M
+7% y-o-y (SEK 6,030 M)
24(25)
Gross collection: Carrying value x 2.1
Cash flow distribution 30 Jun
of Gross collection 2015 2014
Y1 23% 22%
Y2 17% 17%
Y3 13% 13%
Y4 11% 11%
Y5 8% 9%
Y6 7% 7%
Y7 6% 6%
Y8 5% 5%
Y9 3% 4%