Embed Size (px)
Citation preview

INTERIM MANAGEMENT STATEMENT January-September 2016

2 Braas Monier Building Group S.A. Interim Management Statement
January – September 2016
RevenueS By pRoduct GRoup (euR MIllIon) Q3 2016 Q3 2015 Change 9M 2016 9M 2015 Change
concrete roof tiles 131.3 139.3 -5.8 % 346.8 370.3 -6.3 %clay roof tiles 87.7 84.1 4.4 % 230.9 221.1 4.5 %components 72.8 74.1 -1.8 % 204.3 204.9 -0.3 %chimneys & energy Systems 51.5 50.6 1.6 % 130.5 129.6 0.8 %other 5.3 4.2 24.8 % 14.8 12.5 18.3 %Total revenues 348.5 352.4 -1.1 % 927.4 938.4 -1.2 %
(1) Non-IFRS-GAAP figure(2) Profit (loss) for the period (attributable to equity holders of the parent company) divided by the number of shares outstanding 39,166,667 of 30 September 2016(3) Defined as additions to property, plant & equipment(4) Defined as twelve months intangible assets plus tangible assets plus inventories plus trade and other receivables minus total payables(5) Defined as repayable amount of senior debt, other financial liabilities and short-term loans, excl. accrued interest and capitalised finance fees and liabilities related to earn-out clauses(6) Calculated as external financial debt minus cash and cash equivalentsDue to rounding, slight discrepancies in totals and percentage figures may occur.
otheR key fInAncIAl fIGuReS (euR MIllIon) Q3 2016 Q3 2015 Change 9M 2016 9M 2015 Change
Net cash from operating activities 73.6 73.4 0.3 % 1.0 27.9 -96.5 %Capital expenditure(1) / (3) 12.0 11.4 5.4 % 28.7 26.0 10.4 %
30 Sep 2016 30 Sep 2015 Change
Equity 87.6 121.4 -27.9 %Invested Capital(1) / (4) 1,033.4 1,023.0 1.0 %Cash and cash equivalents 83.6 133.9 -37.6 %External financial debt(5) 499.1 518.3 -3.7 %Net debt(6) 415.5 384.5 8.1 %Net debt / Operating EBITDA (LTM)(1) 2,1 x 2,0 x n.a.Employees, full-time equivalents (FTE) at the end of the period
7,911
7,547
4.8 %
key fInAncIAl InfoRMAtIon
pRofIt And loSS (euR MIllIon) Q3 2016 Q3 2015 Change 9M 2016 9M 2015 Change
Revenues 348.5 352.4 -1.1 % 927.4 938.4 -1.2 %thereof Western europe 76.0 83.0 -8.4 % 231.9 243.0 -4.6 %thereof Central, Northern & Eastern Europe 128.1 128.7 -0.5 % 322.9 319.7 1.0 %thereof Southern europe 65.5 64.2 1.9 % 161.9 157.3 2.9 %thereof Asia & Africa 29.0 30.1 -3.6 % 83.8 99.2 -15.6 %thereof chimneys & energy Systems 50.5 49.6 1.8 % 128.4 127.2 0.9 %thereof Central Products & Services 27.2 26.9 1.0 % 81.7 76.0 7.4 %Reconciliation / inter-segment revenues -27.8 -30.2 8.1 % -83.2 -84.1 1.1 %Gross profit 103.5 106.5 -2.8 % 266.7 268.8 -0.8 % in % of revenues 29.7 % 30.2 % 28.8 % 28.6 %Operating EBITDA(1) 65.3 68.8 -5.2 % 145.2 146.4 -0.9 % in % of revenues 18.7 % 19.5 % 15.7 % 15.6 %thereof Western europe 8.5 12.0 -29.2 % 32.2 36.3 -11.3 %thereof Central, Northern & Eastern Europe 26.8 28.2 -5.2 % 54.5 53.7 1.4 %thereof Southern europe 14.3 14.6 -2.0 % 25.8 26.3 -1.6 %thereof Asia & Africa 4.6 4.3 8.4 % 13.7 14.7 -6.5 %thereof chimneys & energy Systems 10.1 10.2 -0.6 % 18.8 17.9 5.3 %thereof Central Products & Services 0.9 -0.5 n.a. 0.1 -2.4 n.a.Operating income(1) 43.2 47.9 -9.8 % 79.6 81.7 -2.5 % in % of revenues 12.4 % 13.6 % 8.6 % 8.7 %non-operating result(1) -1.4 0.1 n.a. -5.3 1.1 n.a.EBIT 41.8 48.0 -12.9 % 74.3 82.7 -10.3 % in % of revenues 12.0 % 13.6 % 8.0 % 8.8 %Net financial result -6.1 -13.3 54.1 % -55.2 -33.8 -63.4 %Income taxes -11.7 -11.2 -4.9 % -6.1 -15.8 61.2 %Profit (Loss) for the period 24.0 23.5 1.8 % 12.9 33.2 -61.0 %net income per share in euR(2) 0.61 0.60 1.8 % 0.33 0.85 -61.0 %

3Braas Monier Building Group S.A. Interim Management Statement
January – September 2016
content
content
Letter to the shareholders 4
Interim Group Management Report 6
Interim Consolidated Financial Statements 27
foRMAt of QuARteRly RepoRtInG
Pursuant to Art. 5 of the Luxembourg Law on Transparency Requirements for Issuers of Securities an issuer whose shares are admitted to trading on a regulated market and for which Luxembourg is the home Member State have the choice to either voluntarily prepare a Quartely financial Report or a shortened Interim Management Statement / Quarterly Statement for the first and third quarter of each financial year. Likewise, pursuant to Sect. 51a of the Exchange Rules for the Frankfurt Stock Exchange (‚BörsO FWB‘), all issuers in the Prime Standard have the choice to either voluntarily prepare a Quartely financial Report or a shortened Interim Management Statement / Quarterly Statement for the first and third quarter of each financial year.
Braas Monier has decided to provide a shortened Interim Management Statement pursuant to Art. 5 of the Law on Transparency Requirements for Issuers of Securities and Sect. 51a of the BörsO FWB for Q1/9M reports from Q1 2016 onwards.

4 Braas Monier Building Group S.A. Interim Management Statement
January – September 2016
DEAR ShAREhOLDERS,
In the third quarter 2016, Braas Monier has again delivered a growing adjusted free cash flow of more than EUR 70 million, despite operating in a quarter with mildly declining volumes. This performance clearly demonstrates the resilience of our business model even when dealing with short-term fluctuations.
However, in the three months from July to September, topline development as well as the Operating EBITDA did not live-up to our expectations. To a good extent, this was due to negative transactional effects due to the devaluation of the British Pound and some short-term operating issues in some of our UK plants. Two production lines, on which we produce metric tiles, have been running at full capacity for two consecutive years to meet the needs of the UK housing market and increased output by 30 %. Following the extended period of full utilisation necessary accumulated maintenance required overhaul activities to put us in a position to be able to manage the likely continuing demands of the UK market. Measures to significantly improve the operating performance in the identified plants have already been taken and are expected to show their full benefit from 2017 onwards. The markets however showed a reasonably positive development with improved price levels across all our European reporting segments.
We believe to have a strong basis and to be very well positioned to benefit from any recovery in our European markets. We are expecting positive revenue growth in 2017. Effective sales and marketing activities in all our countries and the provision of value-adding products and services to our customers, will allow us to grow faster than the markets. Earnings and operating cash flows are expected to benefit from our high operating leverage and our strict cost discipline.
In this context we have decided to adjust Braas Monier’s progressive dividend policy and link it more directly to the Company’s adjusted free cash flow with a payout ratio in the range of 30 % - 50 %. The Board of Directors will propose a dividend of EUR 0.70 per share in respect of the financial year 2016 at the Annual General Meeting to be held on 10 May 2017.
Luxembourg, 30 September 2016

5Braas Monier Building Group S.A. Interim Management Statement
January – September 2016
letter to the shareholders
GeoRG hARRASSeRChief Operating Officer
MAttheW RuSSellChief Financial Officer
pIeRRe-MARIe de leeneRChief Executive Officer

6 Braas Monier Building Group S.A. Interim Management Statement
January – September 2016
GRoup MAnAGeMent InfoRMAtIon
Refinancing to improve cash flows by more than euR 12 million p.a.In June 2016 we refinanced and reduced our external debt including the issuance of EUR 435.0 million Senior Secured Fixed Rate Notes with a coupon of 3.00 % per annum and a new Revolving Credit Facility of EUR 200.0 million. The proceeds, together with available cash, were foremost used to redeem in full the EUR 315.0 million Senior Secured Floating Rate Notes due 2020, to fully repay the Term Loan B of EUR 200.0 million and to pay down the amount drawn under the old Revolving Credit Facility (euR 15.0 million).
Due to the refinancing, we expect that our cash interest charge was reduced by more than EUR 10 million on an annualised basis. In the context of the refinancing, interest rate swaps that were entered into in connection with the former financing were closed out. Cash interest on the interest rate swaps amounted to EUR 2.2 million in 2015.
In addition, the extended Revolving Credit Facility increases the financial flexibility and improves the capital allocation throughout the business cycle. Down-payments of the currently drawn Revolving Credit Facility during the third quarter and an expected con-tinuation of this in the fourth quarter 2016 will lead to an expected gross deleveraging of approx. EUR 80 million at year-end.
Consistent bolt-on M&A strategy continued
In January 2016 we acquired J.A. Plastindustri S/A (JA Plast), a Danish roofing components company. JA Plast’s product range covers components for roofing materials such as tiles, metal, fibre cement and asphalt shingles. It focuses on sanitary and roof space ventilation, skylights and complementary accessories such as flashings, end pieces and special vents.
In May we acquired a concrete tile plant in South Africa, operating under the brand name of Technicrete and ultimately owned by Infrastructure Specialist Group Proprietary Ltd. Through the acquisition of the plant, we take an active step to consolidate the local market and gain additional potential for selling roofing components to a wider customer base. It also complements our regional footprint, enabling the company to better service the northern part of South Africa at lower transport costs.
In July, we acquired Ontop B.V. (Ontop), a well-established European manufacturer of stainless steel flue systems, with end-product applications ranging from industrial bakery ovens, diesel and gas engines, boilers, fire places and stoves. Ontop, headquar tered in Middelburg, the Netherlands, serves the European markets with one production location each in the Netherlands and Poland as well as a distribution centre in Germany and a sales office in France.

7Braas Monier Building Group S.A. Interim Management Statement
January – September 2016
Group Management Information
Including the acquisitions of Golden Clay Industries (Golden Clay), Malaysia, and Ceprano Coperture (Ceprano), Italy, which were both closed in the fourth quarter 2015, newly acquired businesses generated revenues in the third quarter 2016 of EUR 10.6 million and an Operating EBITDA of EUR 2.6 million. For the first nine months of 2016, the revenue contribution amounted to EUR 24.0 million and to EUR 4.9 million for operating eBItdA.
In September we continued our bolt-on M&A strategy by signing an agreement to acquire a concrete tile plant in Craiova, Romania. This transaction is expected to generate in 2019 revenues of approximately RON 22 million and an Operating EBITDA of approximately RON 7.5 million, leading to a strong cash flow profile. The total investment for the acquisition of the assets amounts to approximately RON 33 million, equivalent to approximately EUR 8 million 1), including the purchase price, cost related to the acquisition including its integration, the financing of additional working capital needs and additional capital expenditure (discounted). The acquisition will be financed from free cash flow and is expected to close over the next weeks.
For the full year 2016, we expect the first-time inclusion of the mentioned acquisitions to generate around 3 % of revenue growth and approximately 4 % in Operating EBITDA growth.
We continue to actively search for and evaluate a sizeable number of potential targets in our M&A pipeline to fur ther strengthen our operations, consolidate markets and thereby profit fur ther from a future market recovery.
Major changes in shareholder structure
End of June 2016, 40 North Latitude SPV-F LLC, a privately-held investment firm and affiliate of Standard Industries Inc., acquired a participation of c. 29.11 % of the shares in Braas Monier Building Group S.A. (Braas Monier) from the former major shareholder, Monier holdings S.C.A. (Monier holdings). Subsequently 40 North Latitude SPV-F LLC transferred its holding of c. 29.11 % in Braas Monier to 40 n latitude Spv-f holdings S.à r.l. (40 north).
On 16 September 2016, Anchorage Capital Group L.L.C., an US-based institutional investor, informed us that they had acquired 5.26 % of the shares in Braas Monier held through their two investment vehicles AIO IV S.à r.l. and AIO V S.à r.l.
In the third quarter 2016, Wellington Management Group, LLP, temporarily fell below the 5 % threshold. On 18 October 2016, Wellington Management Group, LLP, crossed the 5 % threshold again, following an increase of its position in Braas Monier to 5.00 %.
Shares tendererd during the acceptance period following the takeover offer by Standard Industries do not impact the shareholder structure before the transaction becomes effective.
1 Based on exchange rate of 1 EUR = 4.4525 RON (as of 2 September 2016)

8 Braas Monier Building Group S.A. Interim Management Statement
January – September 2016
Shareholder Structure
Shareholder Structure according to Voting Rights Announcements, Directors‘ Dealings and other publicly available information as of 1 November 2016:
40N LatitudeSPV-F Holdings S.à r.l.
29.11
Monier Holdings S. C. A.10.77
Board of Directors/Group Management0.46Wellington
Management Group, LLP
5.00
Lucerne Capital
Management, LP5.05
AIO IV S.à r.l. &AIO V S.à r.l. (Anchorage
Capital Group LLC) 5.26
RemainingFree Float
44.35
in %
Industry experience in the Board of Directors strengthenedWith the election of Emmanuelle Picard and Christopher Davies as Non-Executive Directors at the Annual General Meeting in May 2016, Braas Monier further strengthens the industry experience in its Board of Directors. Emmanuelle Picard served until 2016 as General Manager for the Industrial Fabrics Europe at Adfors, a subsidiary of Saint-Gobain with operations in Spain, the Netherlands, the Czech Republic and Poland. Christopher Davies was employed at SIG plc from 1994 to 2013, serving for the last five years as Group ceo.
Following the sale of the 29.11% stake in Braas Monier by Monier holdings and the resulting reduction of their voting rights to 10.77%, Fabrice Nottin (Apollo) and Winston Ginsberg (Towerbrook) resigned from the Board of Directors. Board members proposed by 40 North in accordance with Braas Monier’s articles of association have not yet entered the Board of Directors. As of 2 November 2016, the Board of Directors therefore constitutes of six independent members and the Chairman of the Board, pierre-Marie de leener.
Change of Dividend Policy and Dividend for 2016
The Board of Directors of Braas Monier has previously stated its commitment to focus on generating high sustainable free cash flows and allocating them wisely. In this context the Board of Directors of Braas Monier has undertaken a review of its dividend policy with the aim of paying a dividend which appropriately reflects the Company’s financial condi-tion, results of operations, capital requirements and investment opportunities.

9Braas Monier Building Group S.A. Interim Management Statement
January – September 2016
Group Management Information
Accordingly the Board of Directors of Braas Monier has decided on 28 October 2016 to adjust Braas Monier’s progressive dividend policy and link it more directly to the Company’s adjusted free cash flow which the Board of Directors of Braas Monier deems to be more appropriate for a well-balanced capital allocation. Therefore the Board of Directors of Braas Monier has adopted a dividend policy with a total annual dividend payout ratio in the range of 30 % – 50 % of Braas Monier’s adjusted free cash flow. Adjusted free cash flow is defined as Net cash from operating and investing activities excluding growth capital expenditure (such as M&A) and significant one-off items incurred in the relevant period. Braas Monier retains its commitment to a Net debt / Operating EBITDA ratio of no greater than 2.0x.
As a consequence of the Company’s current operating and financial position and future prospects, the Board of Directors of Braas Monier will propose to shareholders a total dividend of EUR 0.70 per ordinary share in respect of the financial year ending 31 December 2016 at the Annual General Meeting to be held on 10 May 2017.
Takeover Offer by Standard Industries
On 15 September 2016, Standard Industries announced its intention to launch a voluntary public takeover offer for all outstanding shares in Braas Monier Building Group S.A. for a cash consideration of EUR 25 per share. The corresponding offer document was published by Standard Industries on 14 October 2016.
the Board of directors of Braas Monier unanimously recommends that shareholders reject the takeover offer of EUR 25 per share because it contains no premium for control; it does not reflect the value of the significant synergies which would accrue to Standard Industries by Braas Monier being part of the same group as Icopal; it is at a significant discount to the EBITDA multiple paid by Standard Industries for Icopal, does not reflect the unrecognised value in the German pensions schemes, and overall significantly undervalues the Company and its future prospects.
The Board of Directors is focused on maximising the value and position of all stakehold-ers over time. To the extent that the Board of Directors receives a takeover or merger proposal which offers fair and appropriate value, such a proposal would receive full con-sideration.
the Board of directors further detailed its recommendation not to accept this offer in its Reasoned Opinion pursuant to section 27 (1) of the German Securities Acquisition and Takeover Act (WpÜG) released on 28 October 2016, following a careful and extensive analysis and assessment of the offer document.
The Board of Directors points out that Braas Monier will incur additional costs in connection with the Takeover Offer, which the Board of Directors expects to amount to approximately euR 13 million.
The Reasoned Opinion in respect to the takeover offer is available at www.offer.braas-monier.com.

10 Braas Monier Building Group S.A. Interim Management Statement
January – September 2016
Financial Review
earnings Situation
Revenue developMent SuBdued In Q3 2016
Revenues decreased in the third quarter 2016 by 1.1 % or EUR 3.8 million to EUR 348.5 million (Q3 2015: EUR 352.4 million). Revenues from January to September 2016 amounted to EUR 927.4 million compared to EUR 938.4 million in the previous year’s period (-1.2 %).
Negative foreign exchange effects during the quarter amounted to EUR -8.4 million, stemming predominantly from a strengthening of the euro against the British pound and the South African Rand. In the nine months of 2016, negative currency effects mounted to EUR -27.2 million (-2.9 % of revenues).
The first-time inclusion of acquisitions such as Ontop in the chimneys business (consoli-dated as of August 2016), Technicrete in South Africa (consolidated as of June 2016), J.A. Plastindustri in Denmark (consolidated as of January 2016), Ceprano Coperture in Italy (consolidated as of December 2015) and Golden Clay Industries in Malaysia (consolidated as of October 2015), had a positive effect on revenues in the third quarter 2016 of EUR 10.6 million or 3.0 %. From January to September 2016, the contribution of these businesses to revenues amounted to EUR 24.0 million (2.6 % of revenues).
200
400
600
800
1,000
1,200
1,400
0
REVENUES(EUR MILLION)
Revenues per quarter
Cumulative revenues
H12014
315
565
335
586
H12015
329
579
H12016
9M2014
342
908
352
938
9M2015
349
927
9M2016
304
1,211
FY2014
318
1,257
FY2015
250
Q12014
251
Q12015
250
Q12016

11Braas Monier Building Group S.A. Interim Management Statement
January – September 2016
Group Management Information
On a like-for-like basis, excluding effects from foreign exchange and newly included businesses, revenues in the third quarter 2016 were 1.8 % below the previous year’s level due to lower volumes, particularly in the UK, Italy, China and some Scandinavian countries. European tile volumes decreased by 2.1 % on a like-for-like basis in the third quarter, driven by a negative development in the beginning of the quarter. While July already showed an improving trend compared to the strong declines at the end of the second quarter 2016 it was still negative, impacted by a lower number of trading days. The like-for-like volume trend in Europe then turned positive in the combined period of August and September (+1.0 %). Volumes in Asia & Africa still decreased in the third quarter of 2016, albeit at notably lower rates in Malaysia and China compared to the first half of 2016. For the first nine months 2016, the like-for-like revenue decline amounted to 0.8 %.
-6
-4
-2
0
2
4
6
-8
BRAAS MONIER'S EUROPEAN TILE VOLUMES (LIKE-FOR-LIKE)(YEAR-ON-YEAR CHANGE, IN %)
Quarterly development
Q12015
-6.6
Q22015
0.7
Q32015
0.9
Q12016
3.5
Q42015
4.1
Q32016
-2.1
Q22016
-0.3
Average selling prices were clearly positive in the third quarter and the first nine months 2016 with improvements in all European tile segments.
The components business continued its solid performance in the first nine months 2016 and showed a particularly strong performance in Germany. The KPI for European Compo-nents, which measures the amount of component revenues 2) per square metre roof tiles sold, reached EUR 2.28 per square metre in the first nine months of 2016, exceeding the level of last year’s period by 1.3 % on a like-for-like basis.
Revenues of the Chimneys & Energy Systems business were 1.8 % above previous year’s level in the third quarter 2016, rising to EUR 50.5 million (Q3 2015: EUR 49.6 million). Negative volumes and foreign exchange effects of EUR -1.3 million were more than offset by positive pricing and the first-time inclusion of Ontop. On a like-for-like basis, revenues
2 excluding the components-only brand Klöber and J.A. Plastindustri
12 Braas Monier Building Group S.A. Interim Management Statement
January – September 2016
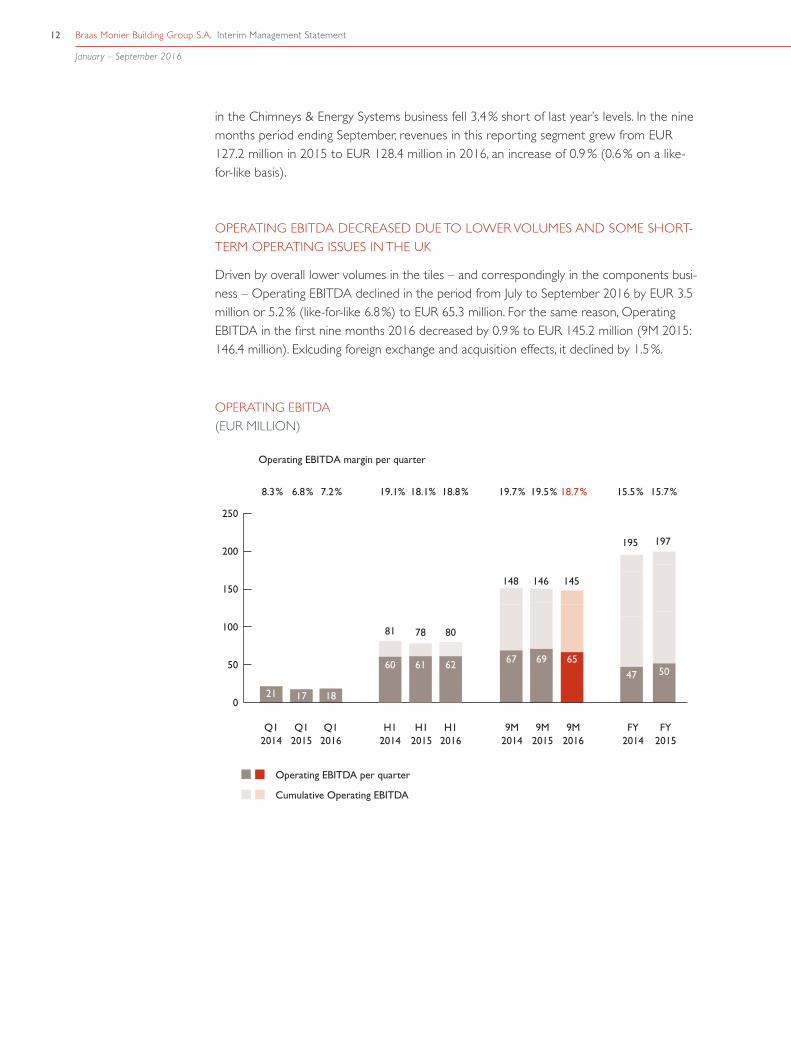
in the Chimneys & Energy Systems business fell 3.4 % short of last year’s levels. In the nine months period ending September, revenues in this reporting segment grew from EUR 127.2 million in 2015 to EUR 128.4 million in 2016, an increase of 0.9 % (0.6 % on a like-for-like basis).
opeRAtInG eBItdA decReASed due to loWeR voluMeS And SoMe ShoRt-teRM opeRAtInG ISSueS In the uk
Driven by overall lower volumes in the tiles – and correspondingly in the components busi-ness – Operating EBITDA declined in the period from July to September 2016 by EUR 3.5 million or 5.2 % (like-for-like 6.8 %) to EUR 65.3 million. For the same reason, Operating EBITDA in the first nine months 2016 decreased by 0.9 % to EUR 145.2 million (9M 2015: 146.4 million). Exlcuding foreign exchange and acquisition effects, it declined by 1.5 %.
148
67
9M2014
9M2015
146
69
9M2016
145
65
0
50
100
150
200
250
OPERATING EBITDA(EUR MILLION)
Operating EBITDA margin per quarter
19.1% 18.1% 18.8% 19.7% 19.5% 18.7%
195
47
FY2014
197
50
FY2015
15.5% 15.7%
21
Q12014
17
Q12015
18
Q12016
7.2%6.8%8.3%
Operating EBITDA per quarter
Cumulative Operating EBITDA
H12015
H12016
81
60
H12014
78
61
80
62

13Braas Monier Building Group S.A. Interim Management Statement
January – September 2016
Group Management Information
The Operating EBITDA margin of 18.7 % in the third quarter 2016 was kept at a high level, even though not fully reaching last year’s quarter’s 19.5 %. On a nine month basis, Operating EBITDA margins improved slightly to 15.7 % (9M 2015: 15.6 %).
Currency effects in the third quarter 2016 of EUR -1.5 million were compensated for by the Operating EBITDA contribution of EUR 2.6 million from the recently acquired busi-nesses. Also from January to September 2016, acquisition effects of EUR 4.9 million exceeded foreign exchange effects of EUR -4.0 million.
Average selling prices increased in all European reporting segments and more than com-pensated for all variable and fixed cost inflation observed in the third quarter 2016. This very positive development was however dampened by negative transactional effects in the components business from the devaluation of the British Pound against the Euro and some short-term operating issues in the UK, together affecting Operating EBITDA in the third quarter 2016 by approximately EUR 2 million. Two production lines, on which we produce metric tiles, have been running at full capacity for two consecutive years to meet the needs of the UK housing market and increased output by 30 %. Following the extended period of full utilisation necessary accumulated maintenance required overhaul activities to put us in a position to be able to manage the likely continuing demands of the UK market. Measures to significantly improve the operating performance in the identified plants have already been taken and are expected to show their full benefit from 2017 onwards. In Asia & Africa, where pricing was marginally down, cost measures and efficiency gains overcompensated this effect and additionally neutralised part of the volume decline in the third quarter 2016. Also in the nine months period, fixed and variable cost inflation was at least offset by positive pricing and efficiency rate gains.
Depreciation and amortisation were relatively stable, amounting to EUR 22.3 million in the third quarter 2016 (Q3 2015: 21.1 EUR million) and to EUR 66.9 million in the first nine months 2016 (9M 2015: EUR 65.5 million). From January to September 2016, the Non-operating result amounted to EUR -5.3 million (Q3 2016: EUR -1.4 million), including costs in relation to management changes, strategic projects and acquisition related account-ing impacts. In the first nine months of 2015, a Non-operating result of EUR 1.1 million was reported (Q3 2015: EUR 0.1 million), positively impacted primarily by effects in connection with the acquisition of Cobert in Spain and Portugal in the first quarter 2015.
Earnings before interests and taxes (EBIT) decreased in the third quarter from EUR 48.0 million in 2015 to EUR 41.8 million in 2016. In particular due to the swing in the Non- operating result of EUR -6.4 million in the first nine months 2016, EBIT of EUR 74.3 million in the first nine months fell short of previous year’s levels (EUR 82.7 million).

14 Braas Monier Building Group S.A. Interim Management Statement
January – September 2016
The Net financial result in the third quarter 2016 amounted to EUR -6.1 million. The improvement of EUR 7.2 million compared to the third quarter 2015 (EUR -13.3 million) was driven by lower interest payments following the successful refinancing in June 2016 and exchange gains. In the first nine months 2016, the Net financial result amounted to EUR -55.2 million. The change by EUR -21.4 million compared to the first nine months 2015 (EUR -33.8 million) was driven by one-time costs related to the refinancing in June 2016, in particular the full amortisation effect stemming from transaction cost in relation to the former financing (EUR -15.0 million) and the close-out of the interest rate swaps (EUR -14.3 million), masking the underlying improvement in interest expenses.
Applying a consolidated effective tax rate for the Group of 32.9 % (Q3 2015: 32.2 %), the Net income amounted to EUR 24.0 million for the third quarter 2016 (Q3 2015: EUR 23.5 million). Net income for the first nine months 2016 amounted to EUR 12.9 million (9M 2015: EUR 33.2 million). Divided by the number of shares outstanding at 30 September 2016 (39,166,667), the earnings per share for the third quarter 2016 amounted to EUR 0.61 (Q3 2015: EUR 0.60) and to EUR 0.33 for the first nine months 2016 (9M 2015: EUR 0.85).
0
-50
50
PROFIT (LOSS) FOR THE PERIOD(EUR MILLION)
Cumulative Profit (Loss)
9M2014
9M2015
9M2016
2833
13
Q1 2014
Q12015
Q12016
-7-13-16
FY2014
40
55
FY2015
H12014
H12015
H12016
510
-11

15Braas Monier Building Group S.A. Interim Management Statement
January – September 2016
Group Management Information
Cash Flow
Operating cash flow improved in the third quarter 2016 to EUR 73.6 million (Q3 2015: EUR 73.4 million). A lower contribution from the operating business (EBIT) was more than offset by an improvement in the working capital (Q3 2016: EUR 28.0 million vs. Q3 2015: EUR 20.4 million). The positive working capital development in the third quarter also reflects the seasonal patterns of the business. Due to the seasonal working capital built-up in the first half-year, working capital in the first nine months of the year was still negative (9M 2016: EUR -62.5 million vs. 9M 2015: EUR -63.9 million). This seasonality will also lead to a significant positive cash contribution from further reductions of working capital in the fourth quarter of the year. Operating cash flow in the first nine months 2016 in total was marginally positive (EUR 1.0 million) overshadowed by the described working capital effect and one-time effects in relation to the refinancing in June 2016, in particular transaction costs (EUR 9.7 million cash effective in Q2 and Q3 2016) and the close out of the interest rate swaps (EUR -14.3 million). In the nine months to September 2015, without similar one-time effects, operating cash flow amounted to EUR 27.9 million.
on an ltM 3) basis, cash generated from operating businesses rose during the third quarter to EUR 76 million (LTM h1 2016: EUR 72 million). From the additional future cash flow benefit of about EUR 12 million per annum resulting from the refinancing in June 2016, approximately EUR 6 million have been realised during the third quarter 2016.
Net cash used in investing activities for the period of July to September 2016 amounted to EUR -21.3 million, compared to EUR -12.6 million in the third quarter 2015. Cash out-flows for investments in intangible assets and property, plant and equipment in the third quarter 2016 of EUR 12.2 million were EUR 0.8 million below the previous year’s level (Q3 2015: EUR -13.0 million). In the first nine months of 2016 they reached EUR 35.8 million (9M 2015: EUR 38.7 million). The acquisition of Ontop in July 2016 resulted in cash outflows in the third quarter of EUR 10.4 million. Together with the acquisition of JA Plast in January 2016 and the acquisition of Technicrete in May 2016 cash outflows for acquisitions in the first nine months 2016 amounted to EUR 31.4 million. In the previous year’s period, the acquisition of GCI in Malaysia had led to cash outflows of EUR 1.6 million in the second quarter 2015 and the acquisition of Cobert in Spain and Portugal to cash outflows of EUR 27.0 million in the first quarter 2015 (9M 2015: EUR 28.6 million). Proceeds from the disposal of property, plant and equipment amounted to EUR 4.2 million in the first nine months 2016 mainly reflecting the sale of a subsidiary containing property assets in the second quarter 2016 in the context of a plant closure in China. In the first nine months 2016, Net cash used in investing activities improved from EUR -63.5 million in the first nine months 2015 to EUR -59.7 million in the first nine months 2016.
Net cash used in financing activities amounted to EUR -52.7 million in the third quarter 2016 reflecting the partial repayment of our new Revolving Credit Facility from the drawn amount at the end of June (EUR 108.0 million) to EUR 55.0 million at end of September 2016. In the previous year’s period, the then existing Revolving Credit Facility was repaid in an amount of EUR 10.0 million. For the first nine months 2016, Net cash used in
3 Last twelve months

16 Braas Monier Building Group S.A. Interim Management Statement
January – September 2016
financing activities amounted to EUR -40.9 million which compared to EUR -11.9 million in the first nine months 2015. The higher amount of this year was mainly due to one-time expenses related to the refinancing undertaken in June 2016.
Adjusted free cash flow in the third quarter 2016 increased by 7.8 % compared to the previous year’s period to EUR 70.4 million. This excludes one-time effects of EUR 18.1 million, which were mainly related to the acquisition of Ontop (EUR 10.4 million) in July 2016 and the refinancing (EUR 4.8 million cash effective in Q3 2016). In the third quarter 2015, we generated an adjusted free cash flow of EUR 65.4 million, before one-time effects of EUR 4.6 million. For the first nine months 2016, adjusted free cash flow amounted to EUR 7.9 million. Excluded one-time effects of EUR 66.6 million primarily related to the refinancing as well as to the acquisition of JA Plast, Technicrete and Ontop (EUR 31.4 million). Other adjustments included changes in the management, post-merger integration costs and strategic growth projects such as 'WrapTec' and ‘Aerlox’. In the first nine months 2015, we generated an adjusted free cash flow of EUR 11.3 million before one-time effects of EUR 46.9 million (including EUR 28.6 million, primarily related to the acquisition of Cobert).
Cash and cash equivalents at end of September 2016 stood at EUR 83.6 million and thus EUR 50.3 million below the corresponding figure for end of September 2015 (EUR 133.9 million). The reduction reflects the gross deleveraging in form of redeeming the Revolving
cASh floW And AdjuSted fRee cASh floW
(EUR million) Q3 2016 Q3 2015 Change 9M 2016 9M 2015 Change
Net cash from operating activties 73.6 73.4 0.3 % 1.0 27.9 -96.5 %Net cash used in / (from) investing activities -21.3 -12.6 68.9 % -59.7 -63.5 -6.0 %Free Cash Flow 52.4 60.8 -13.9 % -58.7 -35.6 65.0 %
Net cash used in financing activities -52.7 -10.4 >-100 % -40.9 -11.9 >-100 %Net Cash Flow -0.4 50.4 >-100 % -99.6 -47.5 >-100 %
Cash and cash equivalents at the beginning of the period 82.4 85.9 -4.0 % 183.4 180.9 1.4 %Effect of exchange rate fluctuations on cash and cash equivalents 1.5 -2.4 >100 % -0.3 0.4 >-100 %Cash and cash equivalents at the end of the period 83.6 133.9 -37.6 % 83.6 133.9 -37.6 %
Adjustments on 'Free Cash Flow' (above):
Acquisitions and dispositions 10.4 0.0 n/a 31.4 28.6 9.8 %Refinancing / IPO 4.8 0.0 >100 % 23.9 1.3 >100 %operational restructuring 1.2 1.5 -20.2 % 2.8 7.3 -61.1 %Warranty 0.5 2.1 -74.0 % 1.7 2.9 -41.9 %post-merger costs 0.8 0.6 30.2 % 1.8 1.1 60.8 %other 0.5 0.4 23.5 % 5.0 5.7 -12.6 %Adjusted Free Cash Flow 70.4 65.4 7.8 % 7.9 11.3 -29.8 %

17Braas Monier Building Group S.A. Interim Management Statement
January – September 2016
Group Management Information
Credit Facility by EUR 53.0 million in the third quarter, a flexible and more effective cash management which was not possible in the former financing structure before the refinancing in June 2016.
Net debt at the end of September 2016 stood at EUR 415.5 million, compared to EUR 384.5 million at the end of the third quarter 2015. The increase mainly relates to one-time expenses in relation to the refinancing in June 2016 (EUR 23.9 million). Pension liabilities, accrued interest, capitalised fees and liabilities related to earn-out clauses are not part of our Net debt definition. Operating EBITDA of the last twelve months reached EUR 195.5 million at 30 September 2016. Net debt to Operating EBITDA (LTM) remained relatively stable at 2.1 x in September 2016 compared to 2.0 x in September 2015. Operating EBITDA (LTM) in relation to Net interest expense improved to 8.0 x at the end of the third quarter (6.7 x at the end of September 2015). Both ratios show significant head-room to maintain covenants included in the financial documentation.
The current external financing is based on Senior Secured Fixed Rate Notes in an aggre-gate principal amount of EUR 435 million, maturing in June 2021. The Senior Secured Fixed Rate Notes bear interest at a rate of 3.00 % per annum, with interest to be paid half-yearly (June / December) in arrears. In addition, a Revolving Credit Facility of EUR 200.0 million (thereof EUR 55.0 million drawn at 30 September 2016) is mainly used to cover the working capital swing and other seasonal finance needs. It bears interest at the rate of EURIBOR plus a margin of up to 300 bps depending on the Group’s financial leverage. Based on the available headroom under current external financing agreements with their long-term maturity profile and the expected cash inflows from operating activities, we have a comfortable liquidity position.
Balance Sheet
The balance sheet total decreased by 2.0% compared to the end of 2015 (EUR 1,517.5 million) to EUR 1,487.1 million. Non-current assets at the end of September 2016 of EUR 983.1 million were rather unchanged in total compared to year-end 2015 (EUR 982.5 million). Deferred tax assets including the accounting for pension liabilities increased by EUR 27.8 million, Goodwill and Other intangible assets rose by EUR 6.6 million as a result of recent acquisitions. Property, plant and equipment decreased by EUR 23.4 million compared to December 2015 due to regular depreciation. Other financial assets declined by EUR 9.3 million following the close out of derivates relating to the former financing.
tReASuRy RAtIoS
30 Sep 2016 30 Sep 2015 31 Dec 2015
Net debt / Operating EBITDA (LTM) (1) 2.1 x 2.0 x 1.7 xoperating eBItdA (ltM) (1) / Net interest expense (LTM) (1) 8.0 x 6.7 x 6.8 x
(1) Non-IFRS-GAAP figure

18 Braas Monier Building Group S.A. Interim Management Statement
January – September 2016
Depreciation and amortisation in the first nine months 2016 amounted to EUR 66.9 million (9M 2015: EUR 65.5 million), thereof EUR 54.6 million relating to property, plant and equipment and EUR 12.3 million relating to intangible assets (9M 2015: EUR 55.1 million and EUR 10.4 million, respectively). In the first nine months of 2016, we added property, plant and equipment in the amount of EUR 27.6 million as well as intangible assets in the amount of EUR 1.4 million (9M 2015: EUR 24.6 million and EUR 1.4 million respectively). In total, the Group added fixed assets in the amount of EUR 87.8 million in the first nine months 2016 (mostly related to the acquisitions of JA Plast in January 2016 and Ontop in July 2016) compared to EUR 60.3 million in the first nine months of 2015 (mostly related to the acquisition of Cobert in January 2015).
Current assets decreased compared to year-end 2015 by EUR 31.0 million to EUR 504.0 million (December 2015: EUR 535.0 million). Cash and cash equivalents declined by EUR 99.8 million, in-line with the pay-out for acquisitions, one-time cash effects resulting from the refinancing in June 2016 and the following gross deleveraging and the seasonal build-up of working capital.
Compared with year-end figures (2015: EUR 147.0 million), total equity declined by EUR 59.5 million to EUR 87.6 million, strongly impacted by the increase in long-term provisions for pension liabilities, resulting from the IFRS accounting treatment of such liabilities in connection with lower interest, as well as by accounting effects resulting from negative foreign exchange rate movements.
Non-current liabilities stood at the end of the first nine months 2016 at EUR 987.2 million, EUR 31.7 million less than at year-end 2015 (EUR 1,018.9 million). Long-term provisions for pension liabilities and similar obligations increased by EUR 61.1 million to EUR 446.2 million (December 2015: EUR 385.1 million) driven by the accounting treatment described above. Long-term financial liabilities were reduced by EUR 76.7 million in the context of the refinancing in June 2016, with amounts drawn under the Revolving Credit Facility (EUR 55.0 million at 30 September 2016) being shown as short-term financial liabilities in the current liabilities. This is also the main driver behind the EUR 60.7 million increase of current liabilities from EUR 351.6 million at the end of 2015 to EUR 412.3 million at the end of the third quarter 2016. Trade account payables decreased by EUR 24.5 million as part of the seasonal working capital development, while short-term tax liabilities increased by roughly the same amount (EUR 24.4 million).

19Braas Monier Building Group S.A. Interim Management Statement
January – September 2016
Group Management Information
Segment Reporting
Revenues in Western Europe decreased in the third quarter 2016 by 8.4 % or EUR 7.0 million to EUR 76.0 million (Q3 2015: EUR 83.0 million), as the strong growth in the Netherlands was not able to compensate for the declines in the larger countries such as the UK. To a large extent, those declines were related to negative currency effects of EUR 5.6 million, predominantly resulting from a strengthening of the Euro against the British Pound. On a like-for-like basis, the revenue decline was more moderate with -1.7 % in the third quarter and -0.2 % for the first nine months 2016. Volumes still notably decreased in July before achieving a more stable level in August/September. Average selling prices developed positively during the third quarter in all countries within the reporting segment, bringing price levels above previous year’s levels also in the nine months period in all countries.
Operating EBITDA in the third quarter 2016 decreased by EUR 3.5 million (like-for-like -21.0 %) to EUR 8.5 million (Q3 2015: EUR 12.0 million). Negative currency effects amounted to EUR 1.0 million. The remaining decline in operating earnings was mostly related to measures taken in order to significantly improve the operating performance in the UK and negative transactional effects in the components business from the devaluation of the British Pound against the Euro. Together these effects amounted to approximately EUR 2 million. Operating EBITDA margin thus declined by 3.2 percentage points to 11.2 % (Q3 2015: 14.4 %) in the third quarter. Operating EBITDA for the nine months ending September 2016 declined by EUR 4.1 million to EUR 32.2 million (like-for-like -6.4 %). With 13.9 %, Operating EBITDA margin in the first nine months 2016 was 1.1 percentage points below the previous year’s number (9M 2015: 15.0 %).
WeSteRn euRope(1)
(EUR million) Q3 2016 Q3 2015 ChangeChange
like-for-like 9M 2016 9M 2015 ChangeChange
like-for-like
Revenues 76.0 83.0 -8.4 % -1.7 % 231.9 243.0 -4.6 % -0.2 %
Operating EBITDA(2) 8.5 12.0 -29.2 % -21.0 % 32.2 36.3 -11.3 % -6.4 %
in % of revenues 11.2 % 14.4 % 13.9 % 15.0 %
Operating income(2) 3.0 6.3 -52.6 % 15.6 19.2 -19.0 %
in % of revenues 3.9 % 7.5 % 6.7 % 7.9 %
non-operating result(2) -0.3 0.0 n.a. -0.3 0.0 n.a.EBIT 2.7 6.3 -57.2 % 15.3 19.3 -20.8 %
Capital expenditure(3) 3.8 2.8 34.2 % 8.1 5.6 42.9 %volumes sold tiles (in million m2) 5.2 5.4 -3.9 % 15.6 15.7 -0.5 %employees as of period ended 1,327 1,322 0.4 % 1,327 1,322 0.4 %
(1) incl. France, the UK, the Netherlands, Belgium(2) Non-IFRS-GAAP figure(3) Represents additions to intangible assets and property, plant and equipment

20 Braas Monier Building Group S.A. Interim Management Statement
January – September 2016
Central, Northern & Eastern Europe showed a flat revenue development in the third quarter 2016. Revenues decreased by 0.5 % to EUR 128.1 million (like-for-like +0.2 %). Strong growth in Poland and a moderate one in Germany were offset by shrinking reve-nues in Nordic countries such as Sweden and Norway, which in particular in Sweden relate to a high comparable basis following anticipation effects in the renovation market in the second half of 2015. the strengthening of the euro against local currencies caused a negative effect of EUR 0.8 million from July to September and of EUR 3.5 million from January to September. On a nine-months-basis, revenues in Central, Northern & Eastern Europe grew by 2.1 %.
Volumes overall fell short of previous year’s level in the third quarter but still increased in the first nine months 2016 driven by growth in Germany and Poland. Average selling prices increased in both periods and components showed an encouraging performance in particular in Germany.
From July to September 2016, Operating EBITDA reached EUR 26.8 million compared to EUR 28.2 million in the third quarter 2015. The decline by EUR 1.5 million was mostly due to negative currency effects (EUR 0.2 million) and the absence of asset disposals that added to Operating EBITDA in the previous year (EUR 0.9 million). Over the nine months period, Operating EBITDA increased by 1.4 % (like-for-like 2.0 %) to EUR 54.5 million.
CENTRAL, NORThERN & EASTERN EUROPE(1)
(EUR million) Q3 2016 Q3 2015 ChangeChange
like-for-like 9M 2016 9M 2015 ChangeChange
like-for-like
Revenues 128.1 128.7 -0.5 % 0.2 % 322.9 319.7 1.0 % 2.1 %
Operating EBITDA(2) 26.8 28.2 -5.2 % -4.4 % 54.5 53.7 1.4 % 2.0 %
in % of revenues 20.9 % 21.9 % 16.9 % 16.8 %
Operating income(2) 22.1 23.8 -6.9 % 40.7 40.0 1.7 %
in % of revenues 17.3 % 18.5 % 12.6 % 12.5 %
non-operating result(2) 0.0 0.0 n.a. 0.0 0.0 n.a.EBIT 22.2 23.8 -6.9 % 40.7 39.9 1.7 %
Capital expenditure(3) 2.9 2.9 -0.5 % 6.8 8.0 -14.3 %volumes sold tiles (in million m2) 8.5 8.6 -1.4 % 21.0 20.8 1.1 %employees as of period ended 1,542 1,504 2.5 % 1,542 1,504 2.5 %
(1) incl; Germany, Norway, Sweden, Denmark, Finland, Estonia, Latvia, Lithuania, Poland, Russia(2) Non-IFRS-GAAP figure(3) Represents additions to intangible assets and property, plant and equipment

21Braas Monier Building Group S.A. Interim Management Statement
January – September 2016
Group Management Information
The operating performance of Southern Europe continued to be burdened by an unim-proved market environment with sizeable declines in Italy. Revenues in the third quarter 2016 increased by 1.9 % to EUR 65.5 million (Q3 2015: EUR 64.2 million), due to the first time inclusion of recent acquisitions in Italy, accounting for EUR 2.3 million in the quarter and for EUR 7.5 million in the first nine months of 2016. Currency effects in the third quarter were negligible and impacted the region’s revenues from January to September only mildly by EUR -0.5 million. On a like-for-like basis, revenues declined in the third quarter by 1.7 % (-1.5 % for 9M 2016). Ongoing double-digit percentage volume declines in Italy were only offset by improvements in South-Eastern Europe in August/September, but not in the full quarter. Pricing in the region was slightly positive in the third quarter and in the first nine months.
Operating EBITDA from July to September 2016 declined by EUR 0.3 million or 2.0 % from EUR 14.6 million to EUR 14.3 million as the EBITDA impact of lower volumes was not completely offset by average price increases and cost measures. Recently acquired businesses added EUR 0.8 million of Operating EBITDA in the third quarter and EUR 1.1 million in the first nine months. Changes in foreign exchange rates marginally impacted only the nine months period by EUR -0.1 million. On a like-for-like basis, Operating EBITDA declined during the third quarter by 7.7 % and in the first nine months by 5.5 %. Positive pricing and strict cost measures, in particular in Italy, offset part of the volume decline in the tiles and components business. Operating EBITDA margin in the third quarter was thus kept relatively stable at 21.9 % (Q3 2015: 22.8 %) and at 16.0 % in the first nine months (9M 2015: 16.7 %).
SoutheRn euRope (1)
(EUR million) Q3 2016 Q3 2015 ChangeChange
like-for-like 9M 2016 9M 2015 ChangeChange
like-for-like
Revenues 65.5 64.2 1.9 % -1.7 % 161.9 157.3 2.9 % -1.5 %
Operating EBITDA(2) 14.3 14.6 -2.0 % -7.7 % 25.8 26.3 -1.6 % -5.5 %
in % of revenues 21.9 % 22.8 % 16.0 % 16.7 %
Operating income(2) 8.9 9.6 -6.5 % 9.5 9.8 -2.8 %
in % of revenues 13.7 % 14.9 % 5.9 % 6.2 %
non-operating result(2) -0.3 0.0 n.a. -0.8 -1.2 36.7 %EBIT 8.7 9.6 -9.6 % 8.7 8.6 2.0 %
Capital expenditure(3) 2.1 1.8 11.7 % 4.9 4.0 23.5 %volumes sold tiles (in million m2) 7.0 6.8 2.5 % -1.7 % 16.9 16.3 4.0 % -1.2 %employees as of period ended 1,297 1,272 2.0 % 1,297 1,272 2.0 %
(1) incl. Spain and Portugal, Italy, Austria, the Czech Republic, Slovakia, hungary, Slovenia, Bosnia-herzegowina, Croatia, Serbia, Romania, Bulgaria, Albania and Turkey(2) Non-IFRS-GAAP figure(3) Represents additions to intangible assets and property, plant and equipment

22 Braas Monier Building Group S.A. Interim Management Statement
January – September 2016
Following a difficult first half-year, not unexpectedly, revenues in Asia & Africa showed further sizeable declines in the third quarter of 2016. however, with -3.6 % on a reported basis (like-for-like -7.6 %), they were notably less pronounced compared to the first three months of the year (reported -24.7 %, like-for-like -18.3 %) and the second quarter (reported -17.3 %, like-for-like -12.2 %). Revenues in the third quarter reached EUR 29.0 million, EUR 1.1 million less than in the third quarter of 2015 (EUR 30.1 million). Foreign exchange rates were overall balanced in the Asian countries in the third quarter, while South Africa showed a negative impact (EUR -0.9 million). In the first nine months nega-tive currency effects amounted to EUR 9.1 million, mainly related to the devaluation of the South African Rand and the Malaysian Ringgit. The first time inclusion of GCI and the recently acquired concrete plant in South Africa accounted for revenues of EUR 2.1 million in the third quarter and EUR 5.5 million in the first nine months of 2016.
Volume declines in the third quarter were still sizeable, but with -3.5 % (reported) and -5.9 % (like-for-like) a clear impropvement against -10.2 % and -12.7 %, respectively, at half-year stage. Components sales and average selling prices were flat in the third quarter but still down after nine months, negatively affected by the difficult market environments in Asia.
Operating EBITDA increased from July to September by 8.4 % to EUR 4.6 million despite revenue declines (Q3 2015: EUR 4.3 million). On a like-for-like basis, i.e. excluding negative currency effects of EUR 1.2 million in the first nine months as well as the Operating EBITDA contribution of GCI and the new plant in South-Africa (Q3 2016: EUR 0.6 million, 9M 2016: EUR 1.0 million), Operating EBITDA declined by 4.3 % in the third quarter and by 4.8 % in the nine months period. In the first nine months, cost measures particularly in SG&A helped to mitigate the negative volume and pricing effect. In addition, gains from the disposal of an entity containing property assets in China positively impacted Operating EBITDA in the first nine months by EUR 1.5 million.
ASIA & AfRIcA (1)
(EUR million) Q3 2016 Q3 2015 ChangeChange
like-for-like 9M 2016 9M 2015 ChangeChange
like-for-like
Revenues 29.0 30.1 -3.6 % -7.6 % 83.8 99.2 -15.6 % -11.5 %
Operating EBITDA(2) 4.6 4.3 8.4 % -4.3 % 13.7 14.7 -6.5 % -4.8 %
in % of revenues 16.0 % 14.2 % 16.4 % 14.8 %
Operating income(2) 1.9 2.2 -13.3 % 6.2 7.9 -20.8 %
in % of revenues 6.6 % 7.4 % 7.4 % 7.9 %
non-operating result(2) 0.0 0.3 n.a. -1.3 -0.4 >-100 %EBIT 1.9 2.5 -24.0 % 4.9 7.4 -34.4 %
Capital expenditure(3) 1.6 2.5 -35.2 % 5.7 4.4 28.0 %volumes sold tiles (in million m2) 6.0 6.2 -3.5 % -5.9 % 17.9 19.5 -8.1 % -10.7 %employees as of period ended 1,884 1,858 1.4 % 1,884 1,858 1.4 %
(1) incl. Malaysia, China, Indonesia, India and South Africa(2) Non-IFRS-GAAP figure(3) Represents additions to intangible assets and property, plant and equipment

23Braas Monier Building Group S.A. Interim Management Statement
January – September 2016
Group Management Information
Revenues with Chimneys & Energy Systems in the third quarter 2016 reached EUR 50.5 million, 1.8 % up compared to the previous year’s quarter of EUR 49.6 million (like-for-like -3.4 %). From January to September revenues rose by 0.9 % on a reported and by 0.6 % on a like-for-like basis to EUR 128.4 million.
Negative currency effects amounted to EUR 1.3 million in the third quarter 2016 (EUR -3.4 million in 9M 2016). The first time inclusion of Ontop in the third quarter 2016 added EUR 3.8 million. Volumes declined in the third quarter by 7.0 %, with a particularly challenging market environment in Austria. Volume trends were positive in countries such as Germany, Poland and Norway. Positive mix effects and higher average selling prices were sufficient to offset volume declines in the first nine months completely, but not fully so in the third quarter 2016.
Operating EBITDA decreased by EUR 0.1 million from EUR 10.2 million in the third quarter 2015 to EUR 10.1 million in the third quarter 2016. Negative currency effects in the quarter of EUR -0.3 million balanced out with the Operating EBITDA contribu-tion of Ontop in the same amount. The positive pricing development together with cost improvements were sufficient to vastly neutralise effects from declining volumes in the third quarter 2016. For the first nine month, the same equasion ended with a slight surplus, allowing for an increase in Operating EBITDA margin of 0.6 percentage points to 14.6 % (9M 2015: 14.0 %). In the third quarter the Operating EBITDA margin of 20.0 % came slightly short of the 20.5 % achieved in the previous year.
chIMneyS & eneRGy SySteMS
(EUR million) Q3 2016 Q3 2015 ChangeChange
like-for-like 9M 2016 9M 2015 ChangeChange
like-for-like
Revenues 50.5 49.6 1.8 % -3.4 % 128.4 127.2 0.9 % 0.6 %
Operating EBITDA(1) 10.1 10.2 -0.6 % -0.6 % 18.8 17.9 5.3 % 6.5 %
in % of revenues 20.0 % 20.5 % 14.6 % 14.0 %
Operating income(1) 7.7 7.7 -0.7 % 11.4 10.5 8.3 %
in % of revenues 15.2 % 15.6 % 8.9 % 8.3 %
non-operating result(1) -0.5 -0.1 >-100 % -0.7 -0.1 >-100 %EBIT 7.1 7.7 -6.7 % 10.7 10.5 2.2 %
Capital expenditure(2) 0.8 0.5 46.5 % 1.6 2.2 -24.5 %chimneys sold (in million m) 0.6 0.6 -7.0 % 1.6 1.6 -3.1 %employees as of period ended 1,397 1,178 18.6 % 1,397 1,178 18.6 %
(1) Non-IFRS-GAAP figure(2) Represents additions to intangible assets and property, plant and equipment

24 Braas Monier Building Group S.A. Interim Management Statement
January – September 2016
Revenues in Central Products & Services, which mainly resulted from components centrally produced and sold to other segments, were up 1.0 % to EUR 27.2 million in the third quarter 2016 (Q3 2015: EUR 26.9 million), including the contribution of JA Plast. On a like-for-like basis, revenues were down 8.1 % in the third quarter and down 2 % over the nine months period. Exchange rate effects had no impact on revenues in the third quarter or the first nine months of 2016.
From July to September 2016, Operating EBITDA turned positive, reaching EUR 0.9 million, an improvement over the third quarter 2015 of EUR 1.4 million. The increase is mostly related to the first time contribution of JA Plast, which, together with the underlying profit contribution of the components business within this reporting segment overcompensated holding and R&D costs that are also accounted for in this segment. For the first nine months, Operating EBITDA improved by EUR 2.5 million to EUR 0.1 million for the same reasons.
From January to September 2016, the non-operating result amounted to EUR -2.2 million, including costs in relation to management changes and strategic projects. In the previous year’s period, the non-operating result amounted to EUR 2.8 million as similar expenses for strategic projects were more than offset by a positive effect of EUR 5.5 million, related to the acquisition of Cobert in Spain and Portugal in the first quarter 2015.
centRAl pRoductS & SeRvIceS
(EUR million) Q3 2016 Q3 2015 ChangeChange
like-for-like 9M 2016 9M 2015 ChangeChange
like-for-like
Revenues 27.2 26.9 1.0 % -8.1 % 81.7 76.0 7.4 % -2.0 %
Operating EBITDA(1) 0.9 -0.5 n.a. n.a. 0.1 -2.4 n.a. n.a.
in % of revenues 3.4 % -1.8 % 0.2 % -3.2 %
Operating income(1) -0.4 -1.6 75.1 % -3.8 -5.7 33.5 %
in % of revenues -1.5 % -6.0 % -4.6 % -7.5 %
non-operating result(1) -0.4 -0.2 >-100 % -2.2 2.8 n.a.EBIT -0.8 -1.8 57.5 % -6.0 -3.0 >-100 %
Capital expenditure(2) 0.9 0.8 9.5 % 1.6 1.8 -11.8 %employees as of period ended 464 413 12.3 % 464 413 12.3 %
(1) Non-IFRS-GAAP figure(2) Represents additions to intangible assets and property, plant and equipment

25Braas Monier Building Group S.A. Interim Management Statement
January – September 2016
Group Management Information
Outlook for 2016
Lead indicators for the European new-build and renovation business, such as building permits or consumer confidence, are generally positive for the majority of countries. Research institutes correspondingly expect the construction activity in Europe to further pick up in the current business year. For Asia, the expectations are less positive, particularly regarding the Chinese market, which is expected to decline strongly. We are positive overall with regard to the residential market development in 2016 for our businesses and expect slight volume growth in the key markets we are active in, barring any extraneous events driven by major geopolitical instability.
The German market is expected to grow sligthly with positive momentum in new build being dampened by a less favourable development of the renovation market. In the UK, markets are expected to show further growth in the short-term due to strong order books, albeit at a slower rate following the referendum in June 2016. The French market is expected to develop flattish in 2016. Further market growth is expected for a number of other European countries, such as Poland, the Netherlands, Denmark and several South-Eastern European markets. The Italian market is expected to remain difficult during the remainder of the year after a very weak first half 2016. The Chinese market will most likely show a further strong contraction in 2016. The Malaysian market continues to face some challenges albeit declining at a lower rate. The components business is expected to show an improvement in performance supported by rising national and international building standards, especially with regard to energy efficiency and safety. With regard to the Chimneys & Energy Systems business, expectations are for a similar development as to the roofing business in the respective markets.
Compared to the beginning of the year, overall volume growth expectations are damp-ened by uncertainties following the UK referendum, a weak development of the Italian and some Scandinavian market as well as a slower stabilisation in Malaysia and further declines in China. Those effects are expected to be only partially offset by a presumably better market development in Germany and South-Eastern Europe in particular. Average selling prices are expected to increase slightly to cover increasing input costs. The first-time inclusion of acquisitions in Malaysia, Italy, Denmark, South Africa, the Netherlands and Romania is expected to generate around 3 % of revenue growth and approximately 4 % in Operating EBITDA growth. Based on these assumptions, we expect revenues (reported and like-for-like) to be around previous year’s level.
From a cost perspective, we expect very slight increases in input costs (raw materials and wage inflation). The currently low energy prices should have the potential to ease some variable cost inflation if they were to stay at these levels throughout the year. Average selling price increases together with efficiency improvements, mainly in the production area, are expected to at least offset variable and fixed cost inflation.
Negative transactional effects in the components business from the devaluation of the British Pound against the Euro and some short-term operating issues in the UK have affected Operating EBITDA development throughout the year. Measures to significantly improve the operating performance in the identified plants have already been taken and are expected to show their full benefit from 2017 onwards. Following the developments

26 Braas Monier Building Group S.A. Interim Management Statement
January – September 2016
in the third quarter, management does not believe that the UK business will be able to make up for these effects in the remainder of the year. Together with the negative transac-tional effects this is expected to result in a shortfall of Operating EBITDA compared to the original expectations at the beginning of the year of approximately EUR 5 million.
Braas Monier expects revenues (reported and like-for-like) to stay on last year’s level in 2016. Average selling prices are expected to increase slightly to cover increasing input costs. The first-time inclusion of acquisitions in Malaysia, Italy, Denmark, South Africa, the Netherlands and Romania are contributing to revenues and Operating EBITDA, which is expected to increase slightly compared to full-year Operating EBITDA 2015 of EUR 196.8 million.
Sustaining Capex is expected to be at a level of around EUR 65 million, including Capex in acquired companies. In addition, approximately EUR 5 million are being invested in future growth projects in 2016. The strong cash flow potential of the operating business allows the Group to strive for consistent and ambitious growth, both organically and through acquisitions, with an unerring focus on return on invested capital while being ever mindful of the Group’s Net debt ratio and its dividend policy.
We will continue to strive for above-market growth. Management is confident to achieve this goal in the coming years through the Group-wide ‘Top Line Growth’ programme, focusing on customer oriented sales and marketing initiatives, value-adding services, the development of innovative products and solutions, such as 'WrapTec' and the recently launched tile with ‘Aerlox’ technology, and further opportunistic bolt-on acquisitions.
We will continue to invest in profitable growth. Our product innovations have the potential to further enrich our product mix and we continue to actively search for and evaluate further potential M&A targets to strengthen our operations, consolidate markets and thereby profit further from a future market recovery.
Growth expected for 2017
Based on positive lead indicators for residential new build and renovation markets in 2017, Management expects overall like-for-like revenues to increase in its European markets, already factoring in some declines in the UK. This growth is expected to result in improving earnings and operating cash flows, further backed by the first-time contribution of recent acquisitions and by the lower interest payments following the refinancing in june 2016.
Pierre-Marie De Leener Georg harrasser Matthew Russell (ceo and (coo) (cfo) chairman of the Board of directors)

27Braas Monier Building Group S.A. Interim Management Statement
January – September 2016
consolidated financial Statements
conSolIdAted fInAncIAl StAteMentS conSolIdAted IncoMe StAteMent foR the fIRSt nIne MonthS 2016
(EUR thousand) Q3 2016 Q3 2015 9M 2016 9M 2015
Revenues 348,535 352,353 927,420 938,355cost of sales -245,059 -245,901 -660,764 -669,557Gross profit 103,476 106,452 266,656 268,798
Selling expenses -37,490 -36,314 -118,919 -115,707Administrative expenses -22,883 -24,254 -72,664 -73,911other operating income 694 2,901 4,715 9,739Other operating expenses -2,321 -986 -6,827 -6,165Impairments 0 0 0 -665Result from associates and joint ventures 320 211 1,289 658Earnings before interest and taxes (EBIT) 41,796 48,010 74,250 82,747
finance income 3,102 1,571 10,665 3,175finance costs -9,211 -14,867 -65,859 -36,952Earnings before taxes (EBT) 35,687 34,714 19,056 48,970
Income taxes -11,737 -11,192 -6,127 -15,788Profit (loss) for the year 23,950 23,522 12,929 33,182
Thereof attributable to:
Equity holders of the parent company 23,882 23,458 12,990 33,223non-controlling interests 68 64 -61 -41
Basic earnings per share (in euR) 0.61 0.60 0.33 0.85diluted earnings per share (in euR) 0.61 0.60 0.33 0.85
conSolIdAted StAteMent of coMpRehenSIve IncoMe foR the fIRSt nIne MonthS 2016
(EUR thousand) Q3 2016 Q3 2015 9M 2016 9M 2015
Profit (loss) for the period 23,950 23,522 12,929 33,182Other comprehensive income
Items that will never be reclassified to profit or loss:
Actuarial gains and losses on pension plans -12,924 -3,400 -61,389 13,600 Income tax effect 4,228 1,081 19,737 -4,400
Items that are or may be reclassified to profit or loss:
Foreign exchange differences -6,963 -17,703 -23,385 -2,330 Foreign exchange differences from at-equity accounted investments 312 -918 605 -620 Income tax effect foreign exchange differences 469 168 1,121 235 Cash flow hedges – reclassified to profit or loss 0 -3,061 7,954 397 Income tax effect cash flow hedge 0 894 -2,325 -117Other comprehensive income for the period, net of tax -14,878 -22,939 -57,682 6,765
Total comprehensive income for the period, net of tax 9,072 583 -44,753 39,947
Thereof attributable to: Equity holders of the parent company 8,996 805 -44,864 40,045 non-controlling interests 76 -222 111 -98

28 Braas Monier Building Group S.A. Interim Management Statement
January – September 2016
conSolIdAted cASh floW StAteMent foR the fIRSt nIne MonthS 2016
(EUR thousand) Q3 2016 Q3 2015 9M 2016 9M 2015
Profit (loss) for the period 23,950 23,522 12,929 33,182
Income taxes 11,737 11,192 6,127 15,788financial result 6,109 13,296 55,194 33,777EBIT 41,796 48,010 74,250 82,747
Adjustments for : Amortisation, depreciation 22,334 21,083 66,914 65,450 (Reversal of) Impairment losses on non-current assets, net 0 0 0 665 (Gains) / losses on the disposal of non-current assets -1,061 -302 -1,596 -558 (Gains) / losses on the sale of equity investments 6 0 -2,251 -1,683 Result from associates and joint ventures -320 -211 -1,289 -658 Dividends received 1 0 598 570Interest and finance fees paid -6,338 -7,499 -43,637 -26,252Interest received 90 99 328 465Net income tax paid -6,939 -1,448 -15,615 -9,358Change in provisions -3,923 -6,694 -14,258 -19,548Change in working capital Change in inventories 21,844 14,768 -12,979 -20,542 Change in trade and other receivables -11,040 -8,105 -51,432 -59,484 Change in trade and other payables 17,196 13,714 1,942 16,098Net cash from operating activities 73,646 73,415 975 27,912
Investments in intangible assets and property, plant and equipment -12,212 -13,024 -35,784 -38,743Acquisition of consolidated companies less cash received -10,353 0 -31,395 -28,584Acquisition of other financial assets 16 0 0 0Proceeds from the disposal of property, plant and equipment and intangible assets 1,143 427 4,198 2,163Proceeds from the disposal of subsidiaries and other financial assets 134 0 3,316 1,685Net cash used in investing activities -21,272 -12,597 -59,665 -63,479
Net cash from / (used in) operating and investing activities 52,374 60,818 -58,690 -35,567
Repayment of borrowings -52,730 -10,427 -583,201 -10,427Proceeds from loans and borrowings 0 0 558,000 10,267Dividends paid 0 0 -15,666 -11,750Net cash used in financing activities -52,730 -10,427 -40,867 -11,910
Change in cash and cash equivalents -356 50,391 -99,557 -47,477
Cash and cash equivalents at the beginning of the period 82,443 85,871 183,395 180,940
Effect of exchange rate fluctuations on cash and cash equivalents 1,487 -2,397 -264 402Cash and cash equivalents at the end of the period 83,574 133,865 83,574 133,865

29Braas Monier Building Group S.A. Interim Management Statement
January – September 2016
consolidated financial Statements
conSolIdAted StAteMent of fInAncIAl poSItIon AS of 30 SepteMBeR 2016
(EUR thousand) 30 Sep 2016 31 Dec 2015
Non-current assets
Goodwill 47,368 45,219Other intangible assets 244,620 240,126Property, plant and equipment 616,347 639,731Investments accounted for using the equity method 9,305 8,077Other financial assets 2,240 11,516other non-current assets 2,309 4,780Deferred tax assets 60,880 33,047Total non-current assets 983,069 982,496
Current assets
Inventories 237,449 222,076Trade accounts receivables 153,850 94,078other current assets 27,127 31,050Cash and cash equivalents 83,574 183,395Assets held-for-sale 2,007 4,407Total current assets 504,007 535,006
Total assets 1,487,076 1,517,502
Equity
Subscribed capital 392 392Additional paid-in capital 375,604 391,270Reserves -44,910 -28,708Retained earnings -245,096 -217,391Total equity attributable to the shareholders of the parent company 85,990 145,563
non-controlling interests 1,594 1,483Total equity 87,584 147,046
Non-current liabilities
Long-term provisions for pension liabilities and similar obligations 446,227 385,100Deferred tax liabilities 15,700 15,152Long-term portion of provisions for other risks 81,732 84,564Long-term loans and borrowings 435,011 511,716Long-term tax liabilities 4,872 12,090Other long-term liabilities 3,666 10,278Total non-current liabilities 987,208 1,018,900
Current liabilities
Trade accounts payable 102,498 126,955Short-term tax liabilities 65,639 41,240Short-term portion of provisions for other risks 31,613 34,464Short-term loans and borrowings 61,388 6,949Other short-term liabilities 151,146 141,948Total current liabilities 412,284 351,556
Total equity and liabilities 1,487,076 1,517,502

30 Braas Monier Building Group S.A. Interim Management Statement
January – September 2016
conSolIdAted StAteMent of chAnGeS In eQuIty foR the fIRSt nIne MonthS 2016
Attributable to equity holders of the parent company
(EUR thousand)
Sub- scribedcapital
Addi-tional
paid-incapital
hedgingreserve
foreign currency
trans-lation
reserveRetainedearnings Total
non- con-
trolling interests
Total equity
Balance as of 1 January 2016 392 391,270 -5,629 -23,079 -217,391 145,563 1,483 147,046
Actuarial gains and losses 0 0 0 0 -41,652 -41,652 0 -41,652
Cash flow hedges - reclassified to profit or loss 0 0 5,629 0 0 5,629 0 5,629
Foreign exchange effects 0 0 0 -21,831 0 -21,831 172 -21,659
Other comprehensive income 0 0 5,629 -21,831 -41,652 -57,854 172 -57,682
consolidated income for the period 0 0 0 0 12,990 12,990 -61 12,929
Total comprehensive income 0 0 5,629 -21,831 -28,662 -44,864 111 -44,753
Equity-settled share-based payments 0 0 0 0 957 957 0 957
Dividends paid 0 -15,666 0 0 0 -15,666 0 -15,666
Balance as of 30 September 2016 392 375,604 0 -44,910 -245,096 85,990 1,594 87,584
conSolIdAted StAteMent of chAnGeS In eQuIty foR the fIRSt nIne MonthS 2015
Attributable to equity holders of the parent company
(EUR thousand)
Sub- scribedcapital
Addi-tional
paid-incapital
hedgingreserve
foreign currency
trans-lation
reserveRetainedearnings Total
non- con-
trolling interests
Total equity
Balance as of 1 January 2015 392 403,020 -5,717 -24,384 -282,010 91,301 1,625 92,926
Actuarial gains and losses 0 0 0 0 9,200 9,200 0 9,200
Cash flow hedges – effective portion of changes in fair value 0 0 280 0 0 280 0 280
Foreign exchange effects 0 0 0 -2,658 0 -2,658 -57 -2,715
Other comprehensive income 0 0 280 -2,658 9,200 6,822 -57 6,765
consolidated income for the period 0 0 0 0 33,223 33,223 -41 33,182
Total comprehensive income 0 0 280 -2,658 42,423 40,045 -98 39,947
Equity-settled share-based payments 0 0 0 0 315 315 0 315
Dividends paid 0 -11,750 0 0 0 -11,750 0 -11,750
Balance as of 30 September 2015 392 391,270 -5,437 -27,042 -239,272 119,911 1,527 121,438

31Braas Monier Building Group S.A. Interim Management Statement
January – September 2016
consolidated financial Statements
InfoRMAtIon ABout RepoRtABle SeGMentS
Information related to each reportable segment is set out in the following tables:
Western EuropeCentral, Northern &
Eastern Europe
(EUR thousand) 9M 2016 9M 2015 2015 9M 2016 9M 2015 2015
External revenues 228,873 239,073 316,101 315,382 312,293 419,535Inter-segment revenues 3,064 3,940 4,728 7,550 7,379 9,918Revenues 231,937 243,013 320,829 322,932 319,672 429,453 year-to-year change -4.6 % 5.1 % 5.5 % 1.0 % -1.3 % 0.5 %
operating eBItdA(1) 32,216 36,337 48,324 54,464 53,726 72,184 in % of revenues 13.9 % 15.0 % 15.1 % 16.9 % 16.8 % 16.8 %
depreciation & amortisation 16,703 16,974 22,675 13,810 13,761 19,158Result from associates and joint ventures 88 -114 -42 0 0 0operating income(1) 15,600 19,248 25,606 40,654 39,965 53,025 in % of revenues 6.7 % 7.9 % 8.0 % 12.6 % 12.5 % 12.3 %
non-operating result(1) -339 24 1,112 2 -25 964eBIt 15,261 19,273 26,718 40,656 39,940 53,989
Capital expenditure(2) 8,071 5,649 12,405 6,836 7,979 15,669volumes sold tiles in million m²(1) / (4) 15.6 15.7 20.8 21.0 20.8 28.2Average number of employees(1) / (3) 1,332 1,318 1,320 1,526 1,511 1,511employees as of period ended(1) 1,327 1,322 1,323 1,542 1,504 1,505
Southern Europe Asia & Africa
(EUR thousand) 9M 2016 9M 2015 2015 9M 2016 9M 2015 2015
External revenues 160,991 156,020 213,857 83,695 99,130 130,839Inter-segment revenues 913 1,322 1,690 59 62 61Revenues 161,904 157,342 215,547 83,754 99,192 130,900 year-to-year change 2.9 % 16.4 % 16.8 % -15.6 % 1.7 % -3.9 %
operating eBItdA(1) 25,842 26,274 36,835 13,735 14,695 21,600 in % of revenues 16.0 % 16.7 % 17.1 % 16.4 % 14.8 % 16.5 %
depreciation & amortisation 16,341 16,502 21,791 7,519 6,844 9,442Result from associates and joint ventures 0 0 0 0 0 0operating income(1) 9,502 9,772 15,044 6,215 7,852 12,157 in % of revenues 5.9 % 6.2 % 7.0 % 7.4 % 7.9 % 9.3 %
non-operating result(1) -756 -1,195 -3,489 -1,325 -402 4,318eBIt 8,745 8,577 11,556 4,890 7,449 16,475
Capital expenditure(2) 4,901 3,968 13,918 5,664 4,425 8,370volumes sold tiles in million m²(1) / (4) 16.9 16.3 22.1 17.9 19.5 26.1Average number of employees(1) / (3) 1,291 1,238 1,244 1,929 1,910 1,902employees as of period ended(1) 1,297 1,272 1,267 1,884 1,858 2,050
(1) Non-IFRS-GAAP figure(2) Represents additions to intangible assets and property, plant and equipment(3) Average number of employees determined on a monthly basis (also considering the beginning of the period)(4) unaudited supplementary information

32 Braas Monier Building Group S.A. Interim Management Statement
January – September 2016
Chimneys & Energy Systems Central Products & Services
(EUR thousand) 9M 2016 9M 2015 2015 9M 2016 9M 2015 2015
External revenues 126,893 125,657 168,362 11,586 6,182 8,036Inter-segment revenues 1,505 1,556 2,007 70,092 69,847 90,088Revenues 128,398 127,213 170,369 81,678 76,029 98,124 year-to-year change 0.9 % -2.3 % -1.5 % 7.4 % -4.2 % -1.2 %
operating eBItdA(1) 18,796 17,856 23,020 144 -2,446 -5,195 in % of revenues 14.6 % 14.0 % 13.5 % 0.2 % -3.2 % -5.3 %
depreciation & amortisation 7,397 7,330 9,583 5,144 4,039 4,670Result from associates and joint ventures 0 0 0 1,201 772 1,175operating income(1) 11,399 10,526 13,437 -3,798 -5,713 -8,690 in % of revenues 8.9 % 8.3 % 7.9 % -4.6 % -7.5 % -8.9 %
non-operating result(1) -699 -55 0 -2,205 2,750 10,070eBIt 10,701 10,470 13,438 -6,003 -2,963 1,380
Capital expenditure(2) 1,623 2,151 4,711 1,620 1,836 4,335chimneys sold in million m(1) / (4) 1.6 1.6 2.2 n/a n/a n/aAverage number of employees(1) / (3) 1,199 1,171 1,173 457 411 411employees as of period ended(1) 1,397 1,178 1,180 464 413 409
(1) Non-IFRS-GAAP figure(2) Represents additions to intangible assets and property, plant and equipment(3) Average number of employees determined on a monthly basis (also considering the beginning of the period)(4) unaudited supplementary information
33Braas Monier Building Group S.A. Interim Management Statement
January – September 2016
consolidated financial Statements
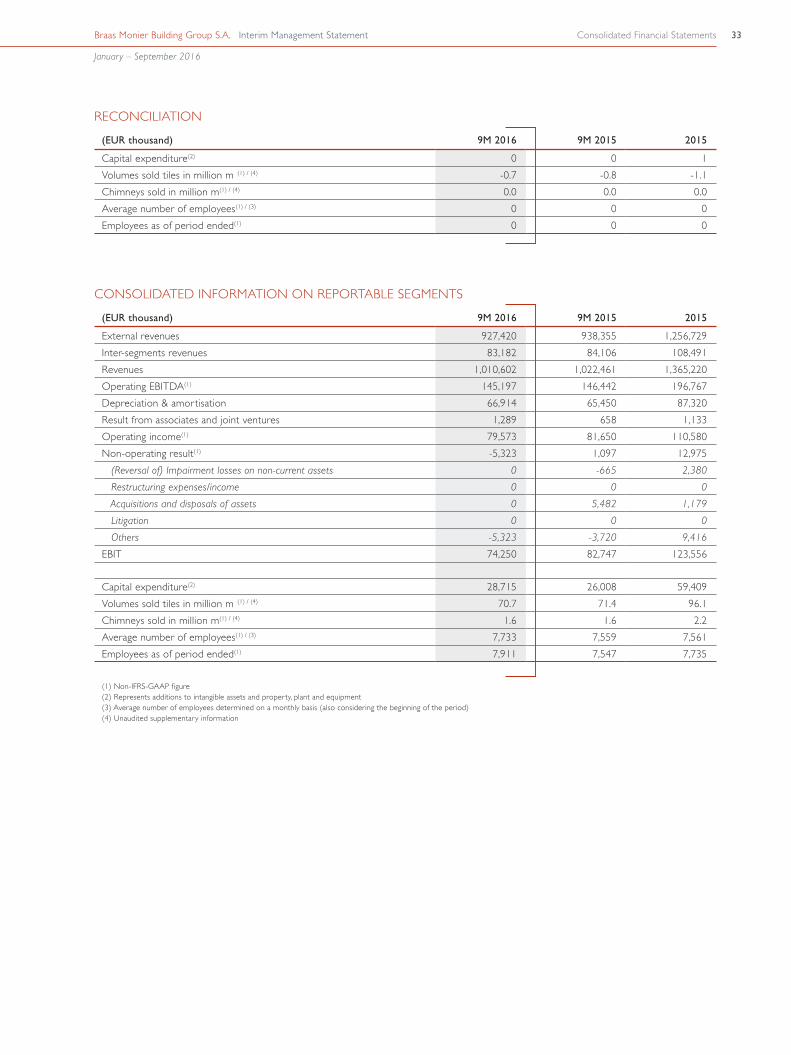
ReconcIlIAtIon
(EUR thousand) 9M 2016 9M 2015 2015
Capital expenditure(2) 0 0 1volumes sold tiles in million m²(1) / (4) -0.7 -0.8 -1.1chimneys sold in million m(1) / (4) 0.0 0.0 0.0Average number of employees(1) / (3) 0 0 0employees as of period ended(1) 0 0 0
conSolIdAted InfoRMAtIon on RepoRtABle SeGMentS
(EUR thousand) 9M 2016 9M 2015 2015
External revenues 927,420 938,355 1,256,729Inter-segments revenues 83,182 84,106 108,491Revenues 1,010,602 1,022,461 1,365,220operating eBItdA(1) 145,197 146,442 196,767depreciation & amortisation 66,914 65,450 87,320Result from associates and joint ventures 1,289 658 1,133operating income(1) 79,573 81,650 110,580non-operating result(1) -5,323 1,097 12,975 (Reversal of) Impairment losses on non-current assets 0 -665 2,380
Restructuring expenses/income 0 0 0
Acquisitions and disposals of assets 0 5,482 1,179
Litigation 0 0 0
Others -5,323 -3,720 9,416
eBIt 74,250 82,747 123,556
Capital expenditure(2) 28,715 26,008 59,409volumes sold tiles in million m²(1) / (4) 70.7 71.4 96.1chimneys sold in million m(1) / (4) 1.6 1.6 2.2Average number of employees(1) / (3) 7,733 7,559 7,561employees as of period ended(1) 7,911 7,547 7,735
(1) Non-IFRS-GAAP figure(2) Represents additions to intangible assets and property, plant and equipment(3) Average number of employees determined on a monthly basis (also considering the beginning of the period)(4) unaudited supplementary information

34 Braas Monier Building Group S.A. Interim Management Statement
January – September 2016
fInAncIAl cAlendAR15 December 2016 Interest payment on Senior Secured Fixed Rate Notes (FRN)
March 2017 Publication of the 2016 Annual Report
May 2017 three-Month and first Quarter Results for 2017
10 May 2017 Annual General Meeting, Luxembourg
11 May 2017 Dividend Payment for the Fiscal Year 2016 (Ex-Dividend Date)
15 June 2017 Interest payment on Senior Secured Fixed Rate Notes (FRN)
August 2017 Six-Month and Second Quarter Results for 2017
November 2017 Nine-Month and Third Quarter Results for 2017
15 December 2017 Interest payment on Senior Secured Fixed Rate Notes (FRN)
contAct InfoRMAtIon
Achim SchreckDirector Group Communications / Investor Relations Telephone: +49 6171 612859E-Mail: [email protected]
BRAAS MonIeR fInAncIAl StAteMentS & ReleASeS
http://www.braas-monier.com/Braas Monier Building Group >> Investor Relations >> financial Statements & presentations

35Braas Monier Building Group S.A. Interim Management Statement
January – September 2016
dISclAIMeR
Forward-Looking Statement
This document contains forward-looking statements relating to the business, financial per-formance and results of Braas Monier Building Group S.A. (the ‘company’) and/or the industry in which the Company operates. The words ‘anticipate’, ‘assume’, ‘believe’, ‘estimate’, ‘expect’, ‘foresee’, ‘intend’, ‘may’, ‘plan’, ‘project’, ‘should’ and similar expressions are used to identify forward-looking statements. Forward-looking statements are statements that are not historical facts; they include statements about the Company’s beliefs and expectations and the assumptions underlying them. These statements are based on plans, estimates and projections as they are currently available to the management of the Company. For-ward-looking statements therefore speak only as of the date they are made, and the Company undertakes no obligation to update any of them in light of new information or future events.
By their very nature, forward-looking statements involve risks and uncertainties. These state-ments are based on the Company’s management’s current expectations and are subject to a number of factors and uncertainties that could cause actual results to differ materially from those described in the forward-looking statements. Actual results may differ from those set forth in the forward-looking statements as a result of various factors (including, but not limited to, future global economic conditions, changed market conditions affecting the building materials industry, intense competition in the markets in which we operate and costs of compliance with applicable laws, regulations and standards, diverse political, legal, economic and other conditions affecting our markets, and other factors beyond our control).
This document is intended to provide a general overview of the Company’s business and does not purport to deal with all aspects and details regarding the Company. Neither the Company nor any of its directors, officers, employees or advisors nor any other person shall have any liability whatsoever for any errors or omissions or any loss howsoever arising, directly or indirectly, from any use of this information or its contents or otherwise arising in connection therewith.
This document speaks as of its date and the material contained in this presentation reflects current legislation and the business and financial affairs of the Company which are subject to change and audit.
Roundings
Percentages and figures in this release may include roundings.
© Braas Monier Building Group S.A., 2016 4, rue Lou hemmerL-1748 Senningerberg R.C.S. Luxembourg B 14855
consolidated financial Statements