Embed Size (px)
Citation preview
1
INTERIM FINANCIAL REPORT
AT MARCH 31, 2019

2
PIRELLI & C. Società per Azioni (Joint Stock Company)
Milan Office
Viale Piero e Alberto Pirelli n. 25
Share Capital Euro 1,904,374,935.66
Register of Companies of Milan No. 00860340157
REA (Economic Administrative Index) No. 1055
3
PIRELLI & C. S.p.A. – MILAN
TABLE OF CONTENTS
MACROECONOMIC AND MARKET SCENARIO ........................................................................... 7
SIGNIFICANT EVENTS OF THE FIRST THREE MONTHS OF 2019 ........................................... 10
GROUP PERFORMANCE AND RESULTS .................................................................................. 11
OUTLOOK FOR 2019 ................................................................................................................... 26
SIGNIFICANT EVENTS SUBSEQUENT TO THE END OF THE QUARTER ................................ 28
ALTERNATIVE PERFORMANCE INDICATORS .......................................................................... 29
OTHER INFORMATION ............................................................................................................... 33
FINANCIAL STATEMENTS .......................................................................................................... 39
DECLARATION OF THE CORPORATE FINANCIAL REPORTING MANAGER PURSUANT TO
THE PROVISIONS OF ARTICLE 154-BIS, PARAGRAPH 2, OF LEGISLATIVE DECREE No.
58/1998 ......................................................................................................................................... 49

4
Board of Directors1
Chairman Ning Gaoning
Executive Vice Chairman
and Chief Executive Officer Marco Tronchetti Provera
Director Yang Xingqiang
Director Bai Xinping
Director Giorgio Luca Bruno
Independent Director Laura Cioli
Independent Director Domenico De Sole
Independent Director Fan Xiaohua
Director Ze'ev Goldberg
Independent Directo Giovanni Lo Storto
Independent Director Marisa Pappalardo
Independent Director Cristina Scocchia
Independent Director Tao Haisu
Director Giovanni Tronchetti Provera
Independent Director Wei Yintao
Secretary of the Board Alberto Bastanzio
Board of Statutory Auditors2
Chairman Francesco Fallacara
Statutory Auditors Fabio Artoni
Antonella Carù
Luca Nicodemi
Alberto Villani
1Appointment: August 1, 2017 effective as of August 31, 2017. Expiry: Shareholders’ Meeting convened for the approval of the Financial
Statements at December 31, 2019. The Director Giovanni Lo Storto was appointed by the Shareholders' Meeting held on May 15, 2018. Ning Gaoning was co-opted by the Board of Directors on August 7, 2018, replacing Ren Jianxin, who resigned on July 30, 2018. Chairman Ning Gaoning shall remain in office until the next Meeting. 2 Appointment: May 15, 2018 Expiry: Shareholders’ Meeting convened for the approval of the Financial Statements at December 31,
2020.

5
Alternate Auditors Elenio Bidoggia
Franca Brusco
Giovanna Oddo
Audit, Risk, Sustainability and Corporate Governance Committee
Chairman – Independent Director Fan Xiaohua
Independent Director Laura Cioli
Independent Directo Giovanni Lo Storto
Independent Director Cristina Scocchia
Committee for Related Party Transactions
Chairman – Independent Director Domenico De Sole
Independent Director Marisa Pappalardo
Independent Director Cristina Scocchia
Nominations and Successions Committee
Chairman Marco Tronchetti Provera
Director Ning Gaoning
Director Bai Xinping
Director Giovanni Tronchetti Provera
Remuneration Committee
Chairman – Independent Director Tao Haisu
Director Bai Xinping
Independent Director Laura Cioli
Independent Director Giovanni Lo Storto

6
Strategies Committee
Chairman Marco Tronchetti Provera
Director Yang Xinqiang
Director Bai Xinping
Director Giorgio Luca Bruno
Independent Director Domenico De Sole
Director Ze’ev Goldberg
Independent Director Wei Yintao
Independent Auditing Firm3 PricewaterhouseCoopers S.p.A.
Corporate Financial Reporting Manager4 Francesco Tanzi
The Supervisory Board (as provided for by Organisational Model 231 adopted by the Company)
is chaired by Prof. Carlo Secchi.
3 Appointment: August 1, 2017, effective as of the date of the commencement of trading of Pirelli shares on the Mercato Telematico
Azionario (screen-based stock exchange) which is organised and managed by Borsa Italiana S.p.A. (October 4, 2017). Expiry: Shareholders’ Meeting convened for the approval of the Financial Statements at December 31, 2025. 4 Appointment: Board of Directors Meeting on August 31, 2017. Expiry: jointly with the current Board of Directors.
7
MACROECONOMIC AND MARKET SCENARIO
Macroeconomic Performance
The macroeconomic scenario during the first quarter of 2019 was characterised by improved
performances in Europe, the USA and China, while emerging countries, particularly Brazil and
Russia, continued to record economic slowdowns.
There was a slight improvement in the European Union's GDP, which grew by +0.5% for the first
quarter of 2019 compared to +0.3% for the fourth quarter of 2018, with a low level of inflation which
led the European Central Bank to announce stable rates and a more accommodative monetary
policy for 2019.
The American economy grew by +3.2% for the first quarter of 2019, overcoming expectations of a
slowdown in consumption due to the government shutdown. The more accommodative stance of
the Federal Reserve also reduced expectations of further interest rate hikes during the course of
2019.
The Chinese economy recorded a growth of +6.4% in GDP for the first quarter of 2019, which was
better than expected but consistent with the trend recorded for the previous quarter.
Brazil’s economy recorded a different trend, where uncertainty regarding economic policy weighed
on consumers and companies.
Even growth in Russia - according to the main indicators – was modest for the first quarter of the
year, mainly influenced by the negative impact of sanctions.
Trend in Exchange Rates
For the first quarter, the Euro vs. US Dollar exchange rate stood at 1.14, a slight fall (-0.5%)
compared to the average for the fourth quarter of 2018, but with the US Dollar revalued by +8.2%
compared to the first quarter of 2018.
For the first quarter the British Pound Sterling recorded an average price of Euro 0.873 with an
appreciation of +2% compared to the previous quarter, and of +1% year-on-year.
At the beginning of 2019, in the wake of indications of a reduction in trade tensions between the
USA and China, the Chinese Renminbi regained ground against the US Dollar. For the first quarter
its average price equalled USD 6.75, an appreciation of +3% compared to the average of USD
6.92 for the fourth quarter of 2018, but at levels still lower by -6% compared to the average of USD
6.36 for the first quarter of 2018.
There was high volatility for the main currencies of emerging countries. The Russian Rouble was
evidently stable against the US Dollar for the first quarter of 2019, compared to the last quarter of
2018. The average for the quarter was RUB 66.0 per USD, which was substantially consistent with

8
the average of USD 66.5 for the fourth quarter of 2018, while year-on-year depreciation reached -
14% due to the tightening of international sanctions.
During the first quarter of 2019, the Brazilian Real recorded an average price of 3.77 against the
US Dollar, an appreciation of +1% on the previous quarter but a depreciation of -14% compared to
the first quarter of 2018.
The currency crises that have hit Argentina and Turkey since 2018 intensified during the first
quarter of 2019. By late March, the price of the Argentine Peso was lower by -13% compared to
the end of 2018, and by -55% compared to March 2018. The Turkish Lira attained an average
price of 5.37 with an appreciation of +2.6% against the US Dollar compared to the previous
quarter, but a depreciation of -29% year-on-year.
Trend in Raw Materials
Prices for energy sources and butadiene were lower for the first quarter of 2019 compared to the
end of 2018, while natural rubber demonstrated an opposite trend.
The average price of Brent stood at USD 64 per barrel for the first quarter of 2019, down by -6%
compared to the fourth quarter of 2018, and by -5% year-on-year. This performance was
influenced by the increase in crude oil production in the USA, and by the slowdown in global
demand.
The price of butadiene was also influenced by the fall in global demand. Its average price stood at
Euro 865 per tonne for the first quarter, a contraction of -18% compared to the previous quarter
(Euro 1,058 per tonne), but had risen by +7% year-on-year.
For the first quarter of 2019, the average price of natural rubber equalled USD 1,397 per tonne, an
increase of +10% compared to the previous quarter, but a contraction of -5% year-on-year. Despite
a slowdown in demand, prices were sustained by a reduction in supply due to the effects of
adverse weather conditions in Asia.
Trend in Car Tyre Markets
During the first quarter of 2019, the Car market recorded a global contraction -1.8%, impacted by a
strong decline in motor vehicle production, with a -6.8% performance for Car tyres on the Original
Equipment channel.
The New Premium segment (tyres with a rim diameter ≥18 inches) recorded the highest growth,
with +5.2% at global level, driven by the good performance of the Replacement channel (+10.5%)
in all markets, while Original Equipment recorded a contraction -0.9% mainly in EMEA (-1.9%, -2.9
% for Europe) and APAC (-2.5%), partially offset by the performance of North America (+1.3%).

9
The Standard segment (tyres with a rim diameter ≤17 inches) contracted by -3.1% for the first
quarter of 2019, with the Original Equipment channel down by -8.5% and the Replacement channel
down by -0.9%.
In more detail:
EMEA closed the first quarter with Car tyre volumes in decline by -3.5%, highlighting the
different dynamics between the New Premium and Standard segments, respectively
performing at +5.2% and -4.8%. On the Replacement channel (-1.5%) sales for Car New
Premium tyres recorded a growth of +10.6%, while sales on the Standard segment were
down by -2.8%. The Original Equipment channel (-9.5%) was impacted by the fall in motor
vehicle production, with New Premium recording -1.9% and Standard -11.8%;
North America recorded a growth of +2.5% for the first quarter of 2019, driven by the New
Premium segment which recorded an increase in sales of +7% (+0.6% for Standard
segment sales). On the Replacement channel (+4.2%) sales for New Premium Car tyres
recorded a growth of +10.6% compared to +2.1% for the Standard segment. Original
Equipment channel sales which fell by -2.7% were impacted by the contraction of the
Standard segment (-5.9%) but partially offset by the growth of the New Premium segment
(+1.3%);
in APAC sales of Car tyres saw a -2.2% market contraction, but with opposite dynamics
between the two channels, with +2.4% for the Replacement channel and -7.6% for Original
Equipment. The New Premium segment (+1.4%) recorded sustained growth on the
Replacement channel (+10.7%) while Original Equipment (-2.5%) was impacted by the fall
in motor vehicle production. Sales on the Standard segment contracted (-2.7%) with a fall in
Original Equipment sales (-8.6%) which was partially offset by the Replacement channel
(+1.9%);
The LatAm market reflected the difficult macroeconomic scenario. The Car tyre market
contracted by a total of -7% during the first quarter of 2019 (-4.7% for Original Equipment,
and -7.5% for the Replacement channel);
The Russia & Nordic market (-2.4%) contracted but with different performances for the two
channels, with -3.5% for the Replacement channel and +6.8% for Original Equipment.

10
SIGNIFICANT EVENTS OF THE FIRST THREE MONTHS OF 2019 It should be noted that there were no significant events for the first quarter.

11
GROUP PERFORMANCE AND RESULTS
In this document, in addition to the financial measures as provided for by the International Financial
Reporting Standards (IFRS), alternative performance indicators derived from the IFRS were used
in order to allow for a better assessment of the of the Group's operating and financial performance.
Reference should be made to the paragraph “Alternative Performance Indicators” for a more
analytical description of these indicators.
* * *
The Interim Financial Report at March 31, 2019 was prepared by applying the new accounting
standard IFRS 16 – Leases, which came into force as of January 1, 2019 (transition date).
Following the application of this standard, at the transition date the Group accounted for the
following estimated impacts in relation to lease contracts previously classified as operational:
- a financial liability of euro 490.0 million, equal to the present value of residual future payments
at the transition date, discounted using the incremental borrowing rate applicable at the
transition date for each contract. Financial liabilities at March 31, 2019 amounted to euro 474.3
million;
- a right of use included under assets of euro 490.4 million, equal to the value of the financial
liability at the transition date, net of any accruals and deferrals relative to the lease, and
recognised in the Statement of Financial Position at the transition date. The right of use at
March 31, 2019 amounted to euro 472.4 million.
As of January 1, 2019, lease payments previously included in the EBITDA, were recognised as a
reduction of lease obligations (for the capital portion) and under financial expenses (for the interest
portion). At the same time, the amortisation of the rights of use of leasing assets, which had initially
been recorded under assets in the Statement of Financial Position in respect of leasing obligations,
were recognised in the EBIT. The Income Statement, Statement of Financial Position and Financial
Statement figures at March 31, 2019 include the impacts deriving from the application of the new
standard, while the comparative data for 2018 has not been restated. With the transition, the Group
did in fact adopt the modified retrospective method, and has recognised the cumulated effects
deriving from the first application at January 1, 2019.

12
* * *
Pirelli's results for the first quarter of 2019 confirmed the resilience of the business model
focused on the High Value segment, in a market environment characterised by a slowdown in the
demand for tyres - particularly on the Original Equipment channel - and by increased cost of
production factors. In particular:
revenues equal to euro 1,313.8 million, with a growth of +0.3% (+1.2% excluding the
exchange rate effect) distinguished by the strengthening of Pirelli's leadership position in
the high end product range in all regions. High Value revenues grew by +7.3% and
represented approximately 68.1% of total sales;
an EBIT adjusted of euro 219.2 million (euro 218.4 million for the first quarter of 2018), and
a margin equal to 16.7% which was stable compared to the first quarter of 2018. This result
was supported by internal levers (price/mix, efficiencies, costs rationalisation) which offset
the impacts of the external scenario (exchange rate volatility, increase in the costs of
production factors, weakness in the market demand for Original Equipment) and the
contraction in Standard segment sales;
net income related to continuing operations which amounted to euro 101.4 million, had
grown by +9.7% compared to euro 92.4 million for the first quarter of 2018.
the Net Financial Position was negative at euro 4,387.3 million. Excluding the impact of
leasing obligations, recorded following the introduction of IFRS 16 to the amount of euro
474.3 million, the net financial position equalled euro 3,913.0 million, and had grown
compared to euro 3,180.1 million at December 31, 2018 due to the usual seasonality of
working capital, but had improved compared to euro 3,938.9 million at March 31, 2018,
when it had benefited from the impact of investment disposals and extraordinary
transactions to the amount of euro 141.8 million. Net cash flow before extraordinary
transactions equalled euro -700 million, recording a cash absorption which was lower by
euro 162.2 million compared to the first quarter of 2018 (for the first quarter of 2018 net
cash flow before extraordinary transactions had amounted to euro -862 million). This
improvement was mainly linked to working capital, whose performance benefited from the
continued improvement of payment conditions with suppliers, and the start of recovery
actions for trade receivables (the realignment of payment terms with dealers in Brazil), and
for Standard inventories.
The main actions underlying these results can be summarised as follows:
strengthening of the High Value segment which represented 68.1% of revenues (up by
+4.5 percentage points compared to 63.6% for 2018). High Value volumes recorded a
growth of +4.5% impacted by the fall in Car tyre production and the slowdown in the
Premium motorcycle market. Given this market environment, Pirelli did in any case improve
its market share for the Car New Premium segment (sales volumes grew by +6.7% for Car
tyres ≥18” compared to the +5.2% growth of the market), particularly on the Replacement
13
channel (a growth of +12.1% in volumes for Pirelli ≥18" tyres compared to +10.5% for the
market).
reduction of exposure on the Standard segment with a -16.6% contraction in volumes
driven by the progressive exit from products with lower rim diameters and profitability, given
the general slowdown of the Standard market.The combination of High Value and Standard
segment performances resulted in an overall change in volumes of -6.5%;
improvement in the price/mix component: +7.7% for the first quarter of 2019 due to the
increasing share of high-end range products, the continued improvement of the product mix
and channels, and the price increases put in place in emerging countries and North
America to offset the volatility of exchange rates;
implementation of the efficiencies program (euro 16.4 million for the first quarter of
2019, equalling 1.2% of revenues, with a target for the year set at euro 70 million), which
more than offset costs inflation (euro -14.9 million for the first quarter). These programs
involved product and industrial activities: from the optimisation of raw materials costs and
the simplification of products to improved productivity, thanks to the increasing digitalisation
of processes.
continued implementation of costs recovery (an additional target for the year of
approximately euro 50 million, euro 12.8 million for the first quarter, mainly for marketing
budget and advertising costs, consultancy fees, and general and administrative expenses)
in response to the worsening market trends for the Standard segment in general, and
particularly in emerging countries.
14
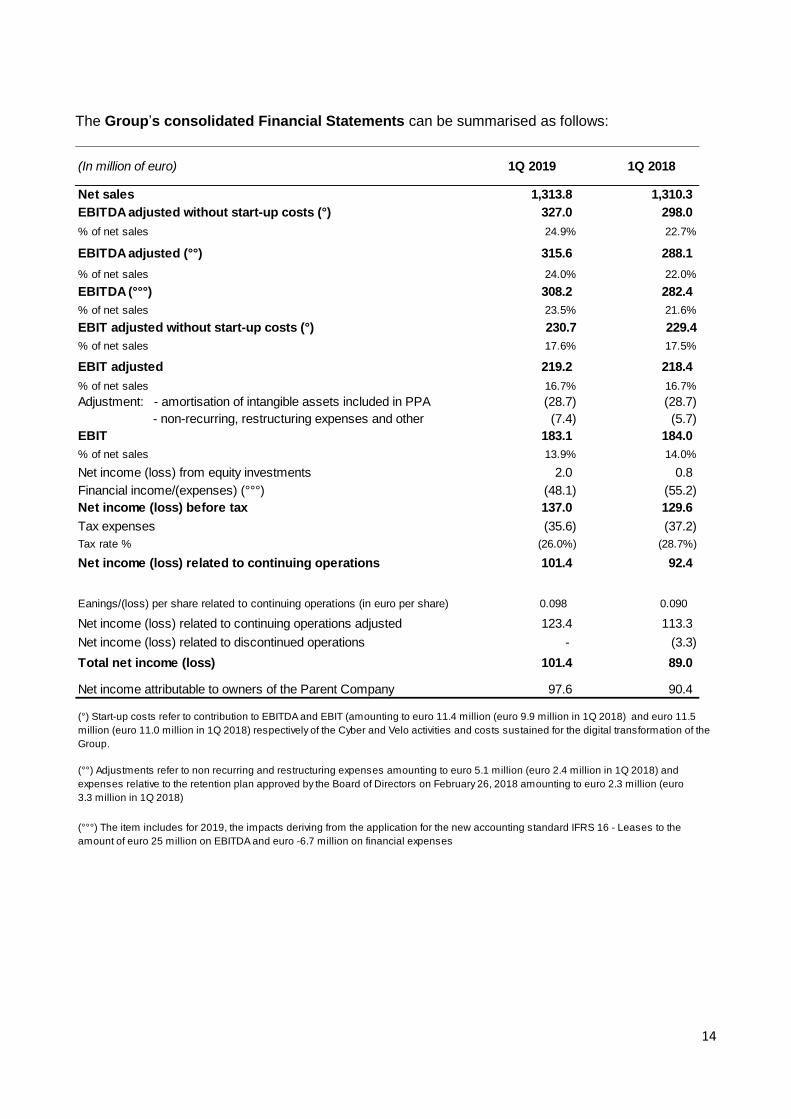
The Group’s consolidated Financial Statements can be summarised as follows:
(In million of euro) 1Q 2019 1Q 2018
Net sales 1,313.8 1,310.3
EBITDA adjusted without start-up costs (°) 327.0 298.0
% of net sales 24.9% 22.7%
EBITDA adjusted (°°) 315.6 288.1
% of net sales 24.0% 22.0%
EBITDA (°°°) 308.2 282.4
% of net sales 23.5% 21.6%
EBIT adjusted without start-up costs (°) 230.7 229.4
% of net sales 17.6% 17.5%
EBIT adjusted 219.2 218.4
% of net sales 16.7% 16.7%
Adjustment: - amortisation of intangible assets included in PPA (28.7) (28.7)
- non-recurring, restructuring expenses and other (7.4) (5.7)
EBIT 183.1 184.0
% of net sales 13.9% 14.0%
Net income (loss) from equity investments 2.0 0.8
Financial income/(expenses) (°°°) (48.1) (55.2)
Net income (loss) before tax 137.0 129.6
Tax expenses (35.6) (37.2)
Tax rate % (26.0%) (28.7%)
Net income (loss) related to continuing operations 101.4 92.4
Eanings/(loss) per share related to continuing operations (in euro per share) 0.098 0.090
Net income (loss) related to continuing operations adjusted 123.4 113.3
Net income (loss) related to discontinued operations - (3.3)
Total net income (loss) 101.4 89.0
Net income attributable to owners of the Parent Company 97.6 90.4
(°) Start-up costs refer to contribution to EBITDA and EBIT (amounting to euro 11.4 million (euro 9.9 million in 1Q 2018) and euro 11.5
million (euro 11.0 million in 1Q 2018) respectively of the Cyber and Velo activities and costs sustained for the digital transformation of the
Group.
(°°) Adjustments refer to non recurring and restructuring expenses amounting to euro 5.1 million (euro 2.4 million in 1Q 2018) and
expenses relative to the retention plan approved by the Board of Directors on February 26, 2018 amounting to euro 2.3 million (euro
3.3 million in 1Q 2018)
(°°°) The item includes for 2019, the impacts deriving from the application for the new accounting standard IFRS 16 - Leases to the
amount of euro 25 million on EBITDA and euro -6.7 million on financial expenses

15
Net sales amounted to euro 1,313.8 million and recorded an organic growth of +1.2% compared to
the previous financial year, or +0.3% including the combined impact of the exchange rate effect
and the adoption of hyper-inflation accounting in Argentina (totalling -0.9%).
High Value revenues for the first quarter of 2019 amounted to euro 895 million, a growth of +7.3%
(+5.3% excluding the positive impact of the exchange rate effect of +2.0%) which accounted for
68.1% of turnover (+4.5 percentage points compared to the first quarter of 2018).
(In million of euro) 03/31/2019 12/31/2018 03/31/2018
Fixed assets related to continuing operations without IFRS 16 9,069.7 9,017.8 8,958.2
Right of use IFRS 16 472.4 n/a n/a
Fixed assets related to continuing operations 9,542.1 9,017.8 8,958.2
Inventories 1,165.5 1,128.5 940.2
Trade receivables 858.4 628.0 875.9
Trade payables (1,142.5) (1,604.7) (1,062.5)
Operating working capital related to continuing operations 881.4 151.8 753.6
% of net sales (*) 16.8% 2.9% 14.4%
Other receivables/other payables 133.3 34.3 89.9
Net working capital related to continuing operations 1,014.7 186.1 843.5
% of net sales (*) 19.3% 3.6% 16.1%
Net invested capital held for sale 0.8 10.7 51.3
Net invested capital 10,557.6 9,214.6 9,853.0
Equity 4,687.9 4,550.9 4,267.6
Provisions 1,482.4 1,483.6 1,646.5
Net financial (liquidity)/debt position without IFRS 16 3,913.0 3,180.1 3,938.9
Lease obligations IFRS 16 474.3 n/a n/a
Total Net financial (liquidity)/debt position 4,387.3 3,180.1 3,938.9
Equity attributable to owners of the Parent Company 4,603.9 4,468.1 4,205.7
Investments in property, plant and equipment and intangible assets without IFRS16 78.0 463.4 85.3
Investments in property, plant and equipment and intangible assets IFRS16 3.2 n/a n/a
Research and development expenses 62.6 219.0 56.3
% of net sales 4.8% 4.2% 4.3%
Research and development expenses - High Value 57.3 202.9 51.3
% on sales High Value 6.4% 6.1% 6.2%
Employees (headcount at end of period) 31,697 31,489 31,267
Industrial sites (number) 19 19 19
(°) during interim periods net sales are annualised
(In million of euro) 1Q 2019 % of total 1Q 2018 % of totalChange
YoY
Organic change
YoY
High Value 895.0 68.1% 833.9 63.6% 7.3% 5.3%
Standard 418.8 31.9% 476.4 36.4% -12.1% -6.0%
Total net sales 1,313.8 100.0% 1,310.3 100.0% 0.3% 1.2%
16
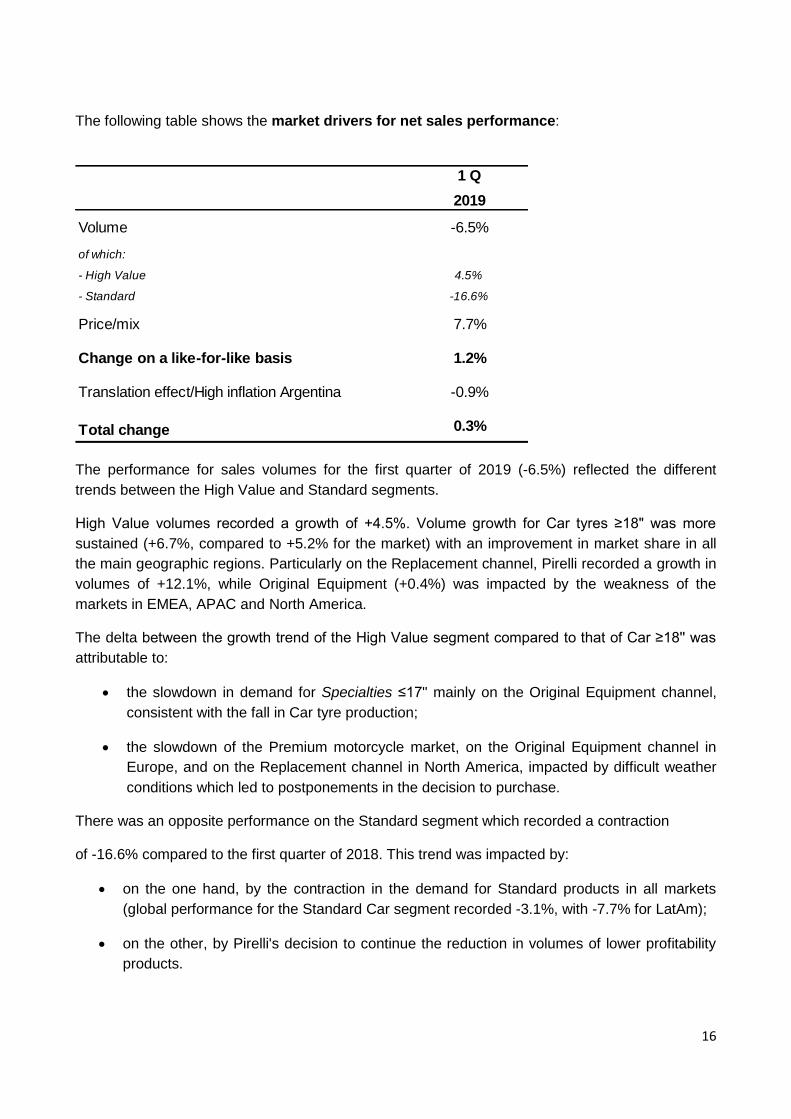
The following table shows the market drivers for net sales performance:
The performance for sales volumes for the first quarter of 2019 (-6.5%) reflected the different
trends between the High Value and Standard segments.
High Value volumes recorded a growth of +4.5%. Volume growth for Car tyres ≥18" was more
sustained (+6.7%, compared to +5.2% for the market) with an improvement in market share in all
the main geographic regions. Particularly on the Replacement channel, Pirelli recorded a growth in
volumes of +12.1%, while Original Equipment (+0.4%) was impacted by the weakness of the
markets in EMEA, APAC and North America.
The delta between the growth trend of the High Value segment compared to that of Car ≥18'' was
attributable to:
the slowdown in demand for Specialties ≤17" mainly on the Original Equipment channel,
consistent with the fall in Car tyre production;
the slowdown of the Premium motorcycle market, on the Original Equipment channel in
Europe, and on the Replacement channel in North America, impacted by difficult weather
conditions which led to postponements in the decision to purchase.
There was an opposite performance on the Standard segment which recorded a contraction
of -16.6% compared to the first quarter of 2018. This trend was impacted by:
on the one hand, by the contraction in the demand for Standard products in all markets
(global performance for the Standard Car segment recorded -3.1%, with -7.7% for LatAm);
on the other, by Pirelli's decision to continue the reduction in volumes of lower profitability
products.
2019
Volume -6.5%
of which:
- High Value 4.5%
- Standard -16.6%
Price/mix 7.7%
Change on a like-for-like basis 1.2%
Translation effect/High inflation Argentina -0.9%
Total change 0.3%
1 Q

17
The strong price/mix improvement (+7.7%) was the result of the implementation of Pirelli's value
strategy, supported by the growing share of High Value products, by the improvement of the mix
for the Standard segment, and by price increases put in place in emerging countries and in North
America, to offset the volatility of exchange rates and the rise in the costs of raw materials.
The exchange rate performance was negative (-0.9%) due to the volatility of exchange rates in
emerging countries (LatAm -15%, Russia – 6%) versus the Euro, mitigated by the revaluation of
the US Dollar (+8%) compared to the first quarter of 2018, and the adoption of high inflation
accounting in Argentina.
With the objective to accelerate the implementation of the business model focused on the High
Value segment, Pirelli has adopted a new organisational model at regional level composed of five
regions instead of six.
In addition to APAC, North America (previously called NAFTA) and LatAm, two new macro
geographic regions have been created:
EMEA, which includes Europe, the Middle East and Africa. The Gulf countries fall under
this area, that is, markets with increasing exposure to the High Value segment;
Russia and Nordic, which are markets with a high similarity. The objective is to create a
productive and commercial synergy, particularly for Winter products.
The apportionment of net sales by geographic region was composed as follows:
EMEA (45.6% of sales) closed the first quarter with an organic change in revenues of -1.6% (-2.3%
including the negative exchange rate effect of -0.7 percentage points), impacted by the fall in Car
and Motorcycle registrations in Europe during the first quarter.
Given this context, Pirelli nevertheless improved its market share, both for the Original Equipment
channel for Car tyres ≥18” thanks to a diversified homologations portfolio, and for the Replacement
channel thanks to the pull-through effect.
The performance of Car Specialties ≤17" was instead negative, as were Premium Motorcycle
volumes which were affected by the fall in motor vehicle and motorcycle production in Europe.
Euro\mln % yoy Organic
Yoy*%
EMEA 598.7 45.6% -2.3% -1.6% 46.8%
North America 269.8 20.5% 10.8% 2.8% 18.6%
APAC 214.2 16.3% 6.8% 4.4% 15.3%
South America 167.2 12.7% -11.7% 3.3% 14.4%
Russia and Nordic 63.9 4.9% -0.8% 5.0% 4.9%
Total 1,313.8 100.0% 0.3% 1.2% 100.0%* before exchange rate effect and high inflation accounting in Argentina
**data for the f irst quarter 2018 have been restated according to the new regional aggregation
1Q 2019 1Q 2018 **
18
Despite the difficulties of the Original Equipment market, High Value revenues recorded an organic
growth of +2.0%.
For the Standard segment, however, there was the continued reduction of exposure to the less
profitable products. This segment recorded an organic contraction in revenues of -10.8%.
Profitability in the mid-teens range, contracted slightly compared to the first quarter of 2018, due to
the impact of the previously mentioned slowdown on the Original Equipment channel.
North America (20.5% of sales) recorded an organic growth in revenues of +2.8% (+10.8%
including the positive exchange rate effect of +8.0 percentage points) driven by the High Value
segment (an organic growth of +6.4%), particularly on the Replacement channel where Pirelli
recorded an increase in market share thanks to the success of Specialties tyres ≥18’’ and All
Season products.
Profitability (EBIT margin adjusted) improved by more than +2 percentage points to twenties levels
(high-teens for the first quarter of 2018), thanks to the increasing turnover share of the high-end
range, to costs efficiencies efforts and to the progressive strengthening of the US Dollar.
APAC (16.3% of sales) which recorded an organic growth in revenues of +4.4% (+6.8% including
the positive exchange rate effect of +2.4 percentage points) was the region with the highest growth
and profitability (an EBIT margin adjusted in the twenties range), representing an improvement
compared to the previous financial year. Revenues recorded organic growth driven by the High
Value segment (+6.1%), mainly on the Replacement channel, thanks to the pull-through effect and
to an ever wider commercial presence which counted over 4,500 points of sale.
Sales on the Standard segment contracted with an organic change of -1.5%, with a fall in sales for
≤17“ rim diameters in a weak market environment for this segment.
South America (12.7% of sales) recorded an organic change in revenues of +3.3% (-11.7%
including the exchange rate effect, and the adoption of inflation accounting in Argentina which
totalled a negative -15.0 percentage points), mainly due to a drop in volumes of -16.6% as a result
of:
market weakness (a -7% performance for the total car market, -7.5% for the Replacement
channel and -4.7% for the Original Equipment market);
the continued focus on the mix, with the progressive reduction in sales of less profitable
Standard segment products with lower rim diameters;
the destination of a portion of production for export to North America in view of the growing
demand for High Value Pirelli products, and the continuing growth of the mix recorded by
the Brazilian factories.
The price/mix saw a marked improvement (+20.0% for the first quarter of 2019 compared to the
corresponding period of 2018), thanks to price increases in Brazil as of the fourth quarter, and to
the strong improvement of the product mix.
19
Profitability (EBIT margin adjusted) in the high single-digits range represented a slight growth
compared to the first quarter of 2018, due to continued efforts aimed at costs efficiencies and to
the improvement and conversion of the mix.
Russia and Nordic (4.9% of sales) recorded an organic change in revenues of +5.0% (-0.8%
including the negative exchange rate effect of -5.8 percentage points). The strategy of focusing on
the most profitable segments and the recovery of the market favourably impacted the results of the
quarter with an organic growth in High Value revenues of +37.4% (+32.4% growth including the
impact of the negative exchange rate effect of -5 percentage points), and an organic reduction of
Standard revenues by -5.3% (-11.2% including the exchange rate effect).
Significant improvement in profitability compared to the first quarter of 2018 (a double-digit EBIT
margin adjusted, compared to mid-single-digit levels for 2018).
An EBIT adjusted without start-up costs equal to euro 230.7 million (euro 229.4 million for the
first quarter of 2018). The EBIT margin adjusted without start-up costs stood at 17.6% (17.5% for
the first quarter of 2018).
An EBIT adjusted of euro 219.2 million (218.4 for the first quarter of 2018) with a margin of 16.7%
which was stable compared to the first quarter of 2018. Internal levers (price mix, efficiencies and
the costs reduction program) offset the impacts tied to the deterioration of the external scenario
(raw materials, exchange rates, inflation, weakness of the Original Equipment market in EMEA,
APAC and North America), and to the contraction in volumes on the Standard segment.
In more detail:
the improvement in the price/mix (euro 62.7 million) contributed in reducing the impact
deriving from the rise in raw materials prices (euro -27 million), from exchange rate volatility
(euro -2.1 million), as well as from the aforementioned fall in volumes (euro -37.7 million);
industrial efficiencies (euro 16.4 million, 1.2% of revenues) which more than offset costs
inflation (euro -14.9 million);
the costs reduction plan achieved a total of euro 12.8 million to offset the contraction in
sales on the Standard segment especially in Brazil, more than offset the increased
amortisation, depreciation and other costs linked to the development of the High Value
segment (euro -8.9 million);
start-up costs which increased slightly (an impact of euro +0.5 million on the EBIT, went
from euro -11 million euro for the first quarter of 2018 to euro -11.5 million for the first
quarter of 2019) and were mainly relative to Cyber activities and the digital transformation
of the Group.

20
The EBIT which amounted to euro 183.1 million (compared to euro 184.0 million for the first
quarter of 2018) included:
the amortisation of intangible assets identified during the Purchase Price Allocation of euro
28.7 million (consistent with the first quarter of 2018);
non-recurring and restructuring expenses to the amount of euro 5.1 million (euro 2.4 million
for the first quarter of 2018) and expenses relative to the retention plan approved by the
Board of Directors on February 26, 2018 to the amount of euro 2.3 million (euro 3.3 million
for the first semester of 2018).
Net income from equity investments was positive to the amount of euro 2 million (positive to the
amount of euro 0.8 million for the first quarter of 2018), mainly due to the positive pro-rata result of
the Indonesian Joint Venture PT Evoluzione Tyres, evaluated using the equity method.
Net financial expenses fell by euro 7.1 million (from euro 55.2 million for the first quarter of 2018
to euro 48.1 million for the first quarter of 2019) due to lower foreign currency translation losses
(which had impacted the first quarter of 2018 as a result of the impairment in Argentina), and lower
financial expenses linked to hedging operations in Brazil, which further offset the higher leasing
expenses (euro 6.7 million) deriving from the application of the new accounting standard IFRS 16 -
Leases.
The cost of debt year-on-year (last 12 months) for expenses relative to the Group's net financial
debt without IFRS 16 stood at 3.06% compared to 2.95% at December 31, 2018, where the latter
had borne the accounting impact of one-off transactions which had occurred during the first quarter
of 2018, amongst which, in particular, was the repricing of the Group's main credit facility.
(In million of euro) 1 Q
2018 EBIT Adjusted 218.4
- Internal levers:
Volumes (37.7)
Price/mix 62.7
Amortisation, depreciation and other costs 3.4
Efficiencies 16.4
- External levers:
Cost of production factors (commodities) (27.0)
Cost of production factors (labour/energy/others) (14.9)
Difference from foreign currency translation (2.1)
Total change 0.8
2019 EBIT adjusted 219.2
21
Excluding the benefits deriving from the repricing, which are amortised over the duration of the
loan, the cost of debt at December 31, 2018 equalled 3.37%.
Tax expenses for the first quarter of 2019 amounted to euro 35.6 million against a net income
before tax of euro 137 million, with a tax rate which at 26% was consistent with the expected tax
rate for the 2019 financial year.
Net income related to continuing operations, which amounted to euro 101.4 million compared
to earnings of euro 92.4 million for the first quarter of 2018, had grown by +9.7%.
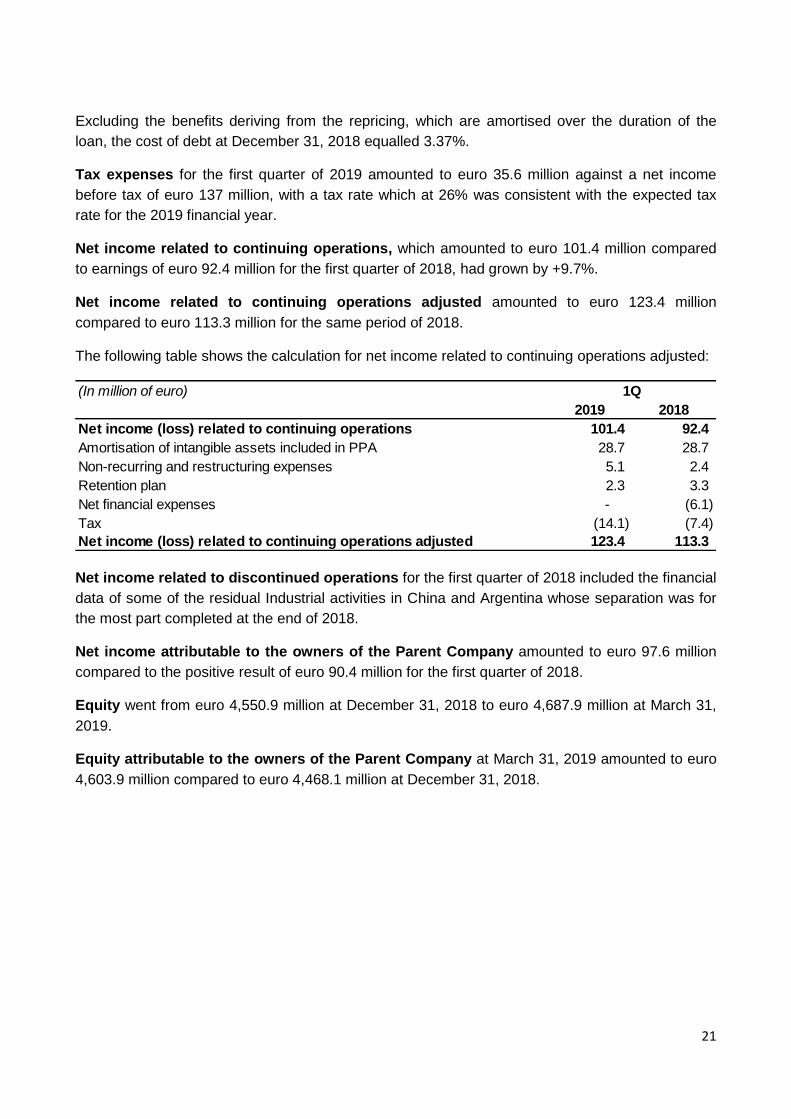
Net income related to continuing operations adjusted amounted to euro 123.4 million
compared to euro 113.3 million for the same period of 2018.
The following table shows the calculation for net income related to continuing operations adjusted:
Net income related to discontinued operations for the first quarter of 2018 included the financial
data of some of the residual Industrial activities in China and Argentina whose separation was for
the most part completed at the end of 2018.
Net income attributable to the owners of the Parent Company amounted to euro 97.6 million
compared to the positive result of euro 90.4 million for the first quarter of 2018.
Equity went from euro 4,550.9 million at December 31, 2018 to euro 4,687.9 million at March 31,
2019.
Equity attributable to the owners of the Parent Company at March 31, 2019 amounted to euro
4,603.9 million compared to euro 4,468.1 million at December 31, 2018.
(In million of euro)
2019 2018
Net income (loss) related to continuing operations 101.4 92.4
Amortisation of intangible assets included in PPA 28.7 28.7
Non-recurring and restructuring expenses 5.1 2.4
Retention plan 2.3 3.3
Net financial expenses - (6.1)
Tax (14.1) (7.4)
Net income (loss) related to continuing operations adjusted 123.4 113.3
1Q

22
The change is shown in the table below:
The Net Financial Position was negative to the amount of euro 4,387.3 million (euro 3,913.0
million excluding leasing obligations pursuant to IFRS 16 to the amount of euro 474.3 million),
compared to euro 3,180.1 million at December 31, 2018. It was composed as follows:
(In million of euro) GroupNon-controlling
interestsTotal
Equity at 12/31/2018 4,468.1 82.8 4,550.9
Translation differences 30.5 5.3 35.8
Net income (loss) 97.6 3.8 101.4
Dividends approved - (8.2) (8.2)
High inflation accounting Argentina 7.6 - 7.6
Other 0.1 0.3 0.4
Total changes 135.8 1.2 137.0
Equity at 03/31/2019 4,603.9 84.0 4,687.9
(In million of euro) 03/31/2019 12/31/2018
Current borrowings from banks and other financial institutions without IFRS 16 964.2 800.1
Current derivative financial instruments 27.2 53.5
Non-Current borrowings from banks and other financial institutions without IFRS 16 4,123.9 3,929.1
Non-Current derivative financial instruments 20.0 13.8
Lease obligations IFRS 16 474.3 -
Total gross debt 5,609.6 4,796.5
Cash and cash equivalents (963.0) (1,326.9)
Other financial assets at fair value through Income Statement (8.5) (27.2)
Current financial receivables and other assets** (21.9) (27.4)
Current derivative financial instruments (79.5) (91.2)
Net financial debt * 4,536.7 3,323.8
Non-Current derivative financial instruments (36.6) (20.1)
Non-current financial receivables and other assets** (112.8) (123.6)
Total net financial (liquidity)/debt position 4,387.3 3,180.1
Lease obligations IFRS 16 (474.3) -
Total net financial (liquidity)/debt position without IFRS 16 3,913.0 3,180.1
* Pursuant to Consob Notice of July 28, 2006 and in compliance with ESMA/2013/319 Recommendations.
** The amount for "financial receivables and other assets" is reported net of the relative provision for impairment amounting to euro 6,1
million as at March 31, 2019 and December 31, 2018.

23
The structure of gross financial debt which amounted to euro 5,609.6 million, was as follows:
At March 31, 2019 the Group had a liquidity margin equal to euro 1,671.5 million composed of euro
700.0 million in the form of non-utilised committed credit facilities, and euro 963.0 million in cash
and cash equivalents, in addition to financial assets at fair value through the Income Statement to
the amount of euro 8.5 million.
The following is the reconciliation between the net financial position at December 31, 2018, not
including the effects deriving from the application of IFRS 16, and the net financial position at
March 31, 2019, which includes these effects:
2019 2020 2021 2022 20232024 and
beyond
Use of unsecured financing ("Facilities") 2,233.9 - 498.8 - 1,735.1 - -
Bond EURIBOR +0,70% - 2018/2020 199.6 - 199.6 - - - -
Bond 1,375% - 2018/2023 546.9 - - - - 546.9 -
Schuldschein 523.5 - - 81.8 - 421.7 20.0
Bilateral long term borrowing 596.4 - - - - - 596.4
ISP short term borrowing 200.0 200.0 - - - - -
Other loans 835.0 574.2 222.3 8.3 20.0 10.2 -
Lease obligations IFRS 16 474.3 76.8 91.5 58.7 50.6 34.5 162.2
Total gross debt 5,609.6 851.0 1,012.2 148.8 1,805.7 1,013.3 778.6
15.2% 18.0% 2.7% 32.2% 18.0% 13.9%
Maturity date
(In million of euro) 03/31/2019
(In million of euro)
Total net financial (liquidity)/debt position 12.31.2018 3,180.1
Net cash flow without IFRS 16 732.9
Total net financial (liquidity)/debt position 03.31.2019 without IFRS 16 3,913.0
Lease obligations IFRS 16 at transition date (01.01.2019) 490.0
Net cash flow from lease obligations IFRS 16 (15.7)
Total net financial (liquidity)/debt position 03.31.2019 4,387.3
24
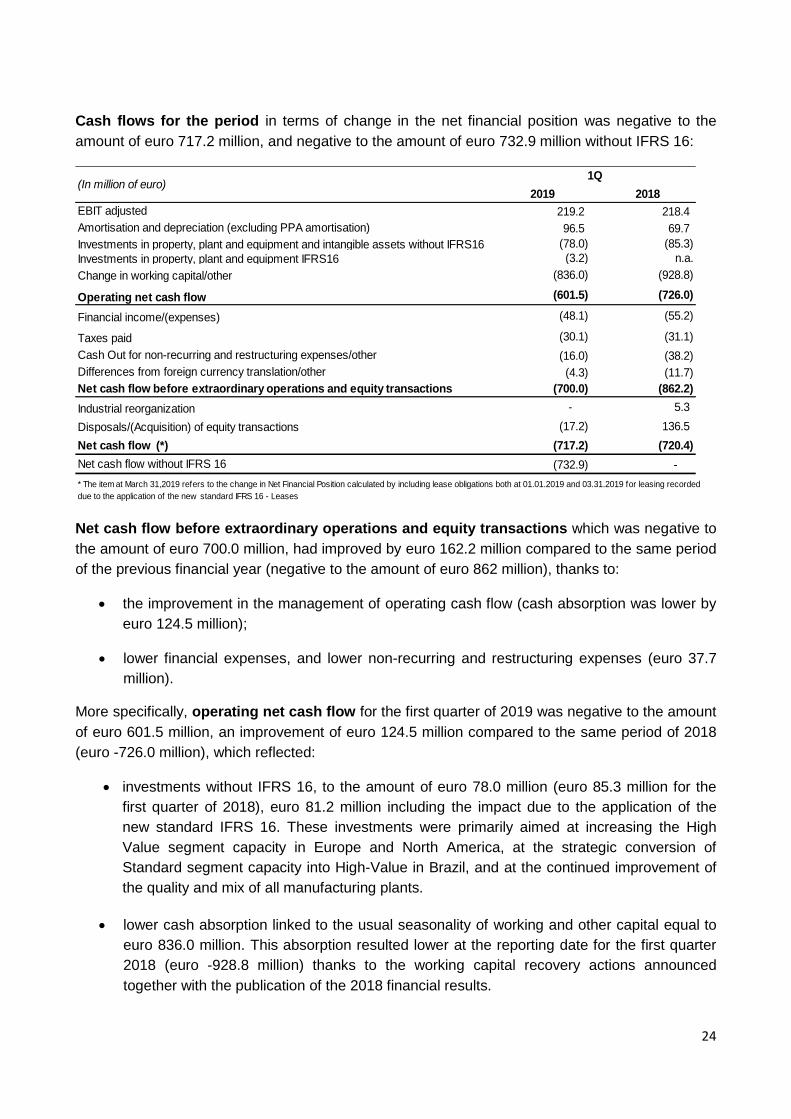
Cash flows for the period in terms of change in the net financial position was negative to the
amount of euro 717.2 million, and negative to the amount of euro 732.9 million without IFRS 16:
Net cash flow before extraordinary operations and equity transactions which was negative to
the amount of euro 700.0 million, had improved by euro 162.2 million compared to the same period
of the previous financial year (negative to the amount of euro 862 million), thanks to:
the improvement in the management of operating cash flow (cash absorption was lower by
euro 124.5 million);
lower financial expenses, and lower non-recurring and restructuring expenses (euro 37.7
million).
More specifically, operating net cash flow for the first quarter of 2019 was negative to the amount
of euro 601.5 million, an improvement of euro 124.5 million compared to the same period of 2018
(euro -726.0 million), which reflected:
investments without IFRS 16, to the amount of euro 78.0 million (euro 85.3 million for the
first quarter of 2018), euro 81.2 million including the impact due to the application of the
new standard IFRS 16. These investments were primarily aimed at increasing the High
Value segment capacity in Europe and North America, at the strategic conversion of
Standard segment capacity into High-Value in Brazil, and at the continued improvement of
the quality and mix of all manufacturing plants.
lower cash absorption linked to the usual seasonality of working and other capital equal to
euro 836.0 million. This absorption resulted lower at the reporting date for the first quarter
2018 (euro -928.8 million) thanks to the working capital recovery actions announced
together with the publication of the 2018 financial results.
2019 2018
EBIT adjusted 219.2 218.4
Amortisation and depreciation (excluding PPA amortisation) 96.5 69.7
Investments in property, plant and equipment and intangible assets without IFRS16 (78.0) (85.3)
Investments in property, plant and equipment IFRS16 (3.2) n.a.
Change in working capital/other (836.0) (928.8)
Operating net cash flow (601.5) (726.0)
Financial income/(expenses) (48.1) (55.2)
Taxes paid (30.1) (31.1)
Cash Out for non-recurring and restructuring expenses/other (16.0) (38.2)
Differences from foreign currency translation/other (4.3) (11.7)
Net cash flow before extraordinary operations and equity transactions (700.0) (862.2)
Industrial reorganization - 5.3
Disposals/(Acquisition) of equity transactions (17.2) 136.5
Net cash flow (*) (717.2) (720.4)
Net cash flow without IFRS 16 (732.9) -
(In million of euro)1Q
* The item at March 31,2019 refers to the change in Net Financial Position calculated by including lease obligations both at 01.01.2019 and 03.31.2019 for leasing recorded
due to the application of the new standard IFRS 16 - Leases

25
During the first quarter of 2019, the performance of working and other capital in fact benefitted:
from the continued improvement of payment conditions with suppliers, and
the start of recovery actions for trade receivables, through the realignment of payment
terms with the main dealers in Brazil, which had temporarily been extended to the end of
2018,due to the difficult market conditions.
In particular, inventories recorded a reduction in volumes of -2%, with:
a contraction of -11% in Standard products, consistent with the recovery plan announced at
the beginning of the year, and
a slight in increase of +5% in High Value products to ensure a better level of service to the
end customer.
This improvement in the inventory mix and in the impact of the exchange rate effect led to a slight
increase in the value of inventories.
Total net cash flow which was negative to the amount of euro 717.2 million included the impact of
extraordinary and equity transactions carried out during the quarter (euro -17.2 million), mainly
attributable to the recapitalisation operation for the Indonesian Joint Venture PT Evoluzione Tyres.
During the first quarter of 2018, the impact of equity transactions and extraordinary transactions
had been positive to the amount of euro 141.8 million (mainly attributable to the disposal of
Mediobanca).

26
OUTLOOK FOR 2019
The market’s performance for the first months of the year demonstrated a prolonged weakness in
demand in Original Equipment. In particular, in the New Premium segment (tyres with rim sizes of
≥18 inches), the Original Equipment market in 2019 is expected to grow by between +2% and
+3%, compared with the previous estimate of +5%. For the Replacement market ≥18 inches,
however, double-digit growth (+10%) is confirmed. Given these dynamics, the New Premium
market is expected to post total growth of around 7% (previous estimated +8%).
On the basis of this scenario, Pirelli is revising its estimates for High Value volumes which are now
expected to grow by over 9% (previous indication around +11%), a level that is however above the
market’s growth:
in Original Equipment thanks to a diversified portfolio of homologations and new supply
contract in North America and APAC in the second half;
in Replacement leveraging the pull-through effect (83% in 2018).
Standard segment volumes have also been revised, with the decline foreseen at -11% (prior
indication -9%/-10%), given the market’s weakness and the accelerated exit from less profitable
products.
Total volumes are expected to decrease by about -1% (prior guidance +0%, +1%).
The company confirms expectations of improved price/mix (+5%/+5.5%) and exchange rates
(-1%/-0.5%).
The forecasts for 2019 hence are:
revenue growth of between 3% and 4% (previous indication +4% to +6%) compared with
5,194.5 million euro in 2018, supported by the strengthening of High Value (confirmed at
~67% of revenues);
profitability growth, with an adjusted Ebit margin foreseen at ≥19% (previous indication
19%) compared with 18.4% in 2018, supported by improvement in internal levers
(price/mix and cost efficiencies);
Euro million 2018 2019
Revenues 5,194.5 ~+3%/+4%
Weight of High Value on revenues ~64% ~67%
Volumes -3.1% ~ -1%
Volumes High Value +11% >+9%
Volumes Standard -14% ~ -11%
Price/Mix +6.8% 5%/5.5%
Forex -5.9% -1%/-0.5%
Ebit margin adjusted 18.4% ≥19%
Start-up costs 48 ~40
Net financial position/Ebitda Adjusted without start-up costs 2.49X~2.1X
~ 2.3X incl. IFRS16
CapEx 463 ~400

27
weight of l’High Value on adjusted Ebit before start-up costs at ~85% (in line with the prior
indication);
debt reduction with a ratio between Net Financial Debt and adjusted Ebitda before start-up
costs at around 2.1x (2.49 at end 2018), around 2.3x including the impact of the adoption
of the new IFRS16 accounting principle;
investments of around 400 million euro (previous indication 430 million euro), consistent
with the new market scenario.
28
SIGNIFICANT EVENTS SUBSEQUENT TO THE END OF THE QUARTER
On 8 April 2019, the sentence of the Federal Regional Tribunal of the First Region (T.R.F.-1 with
headquarters in Brasilia) - which recognized the right of Pirelli’s Brazilian subsidiary Pirelli Pneus
Ltda. to exclude the ICMS (State Tax on Operations levied on the delivery of goods and interstate
and inter-municipal transport and communication services) from the calculation basis of the PIS
and COFINS social contributions for the period 2003-2014 - became final (res judicata).
Following the sentence, of which the market was informed on 1 April 2019, there will be a positive
non-recurring impact in the income statement on the net result of approximately 107 million euro,
made up of:
- positive impact on the Operating Result (Ebit) of around 80 million euro
- positive impact on Financial Proceeds of about 82 million euro
- negative fiscal impact of around -55 million euro
The benefits in terms of group cash flow are expected in the 5-year period 2020-2024.
On May 13, 2019, Pirelli announced the reorganization of its production footprint in Brazil to
improve competitiveness in the Country through the creation of a hub for the production of High
Value Car, Motorsport and Moto tyres in Campinas, to which the production of moto tyres will be
transferred from Gravataì. The Company foresees an investment plan of 120 million euro in the
period 2019-2021 for the modernization and reconversion of production plants from Standard to
High Value, and the ongoing improvement of the mix and quality of the factories of Campinas (San
Paolo), and Feira de Santana (Bahia). The resources relative to the reorganization are mainly
derived from the signing of the fiscal agreement for the Patent Box, in October of 2018, which, as
then announced, go towards the further focus on High Value and a quicker reduction of the
standard segment. The strengthening of Campinas will permit the hiring of around 300 people by
2022 and, with the goal of finding an agreement with unions during the period of the production
transfer from Gravataì to Campinas, all possible actions will be taken to mitigate the social impacts
at Gravataì, which today employs around 900 people.
29
ALTERNATIVE PERFORMANCE INDICATORS
This document, in addition to the financial measures provided for by the International Financial
Reporting Standards (IFRS), also includes measures derived from the latter even though not
provided for by the IFRS (Non-GAAP Measures). These measures are presented in order to allow
for a better assessment of the results of the Group's operations and should not be considered as
alternatives to those required by the IFRS.
In particular, the Non-GAAP Measures used were as follows:
- EBITDA: is equal to the EBIT, but which excludes the depreciation and amortisation of
property, plant and equipment and intangible assets. The EBITDA is used to measure the
ability to generate earnings from operations, excluding the impact of investments;
- EBITDA adjusted: is an alternative measure to the EBITDA which excludes non-recurring and
restructuring expenses, and expenses relative to the retention plan approved by the Board of
Directors on February 26, 2018;
- EBITDA adjusted without start-up costs: is equal to the EBITDA adjusted but excludes the
contribution to the EBITDA (start-up costs) of the Cyber and Velo Activities and costs
sustained for the digital transformation of the Group. The EBITDA adjusted without start-up
costs is an alternative measure to the EBITDA adjusted which excludes start-up costs;
- EBITDA adjusted without start-up costs without IFRS 16: is equal to the EBITDA adjusted
without start-up costs but excludes the impact deriving from the application of the new
accounting standard IFRS – Leases;
- EBITDA margin: this is calculated by dividing the EBITDA by revenues from sales and
services (net sales). This measure is used to evaluate operational efficiency, excluding the
impacts arising from investment activities;
- EBITDA margin adjusted: this is calculated by dividing the EBITDA adjusted by revenues
from sales and services (net sales). This measure is used to evaluate operational efficiency,
excluding the impacts arising from investments, operating costs attributable to non-recurring
and restructuring expenses, and expenses relative to the retention plan approved by the Board
of Directors on February 26, 2018;
- EBITDA margin adjusted without start-up costs: this is calculated by dividing the EBITDA
adjusted without start-up costs by revenues from sales and services (net sales). This is an
alternative measure to the EBITDA margin adjusted which excludes start-up costs;
- EBIT: is an intermediate measure, which is derived from the net income (loss) which excludes
the net income (loss) from discontinued operations, taxes, financial income, financial expenses
and net income (loss) from equity investments. The EBIT is used to measure the ability to
generate earnings from operations, including the impact arising from investments;
- EBIT adjusted: is an alternative measure to the EBIT which excludes the amortisation of
intangible assets relative to assets recognised as a consequence of Business Combinations,
30
operational costs attributable to non-recurring and restructuring expenses, and expenses
relative to the retention plan approved by the Board of Directors on February 26, 2018;
- EBIT adjusted without start-up costs: is equal to the EBIT adjusted but excludes the
contribution to the EBIT (start-up costs) of the Cyber and Velo Activities and costs sustained
for the digital transformation of the Group. The EBIT adjusted without start-up costs is an
alternative measure to the EBIT adjusted which excludes start-up costs;
- EBIT margin: this is calculated by dividing the EBIT by revenues from sales and services (net
sales). This measure is used to evaluate operational efficiency;
- EBIT margin adjusted: this is calculated by dividing the EBIT adjusted by revenues from
sales and services (net sales). This measure is used to evaluate operational efficiency, but
excludes the amortisation of intangible assets relative to assets recognised as a consequence
of Business Combinations, operating costs attributable to non-recurring and restructuring
expenses, and expenses relative to the retention plan approved by the Board of Directors on
February 26, 2018;
- EBIT margin adjusted without start-up costs: this is calculated by dividing the EBIT
adjusted without start-up costs by revenues from sales and services (net sales). This is an
alternative measure to the EBIT margin adjusted which excludes start-up costs;
- Net income (loss) related to continuing operations adjusted: this is calculated by
excluding the following items from the net income (loss) related to continuing operations;
o the amortisation of intangible assets relative to assets recognised as a consequence
of Business Combinations, operating costs attributable to non-recurring and
restructuring expenses and expenses relative to the retention plan approved by the
Board of Directors on February 26, 2018;
o non-recurring income/costs recognised under financial income and expenses;
o non-recurring costs/income recognised as a tax item, as well as the tax impact
relative to the adjustments referred to in the previous points.

31
This is used to measure net profitability, excluding the impact of the items referred to in the
previous points.
- Fixed assets related to continuing operations: this measure is constituted of the sum of the
items, "Property, plant and equipment", "Intangible assets", "Investments in Associates and
Joint Ventures" and "Other financial assets at fair value through other Comprehensive Income”
and "Other financial assets at fair value through the Income Statement". Fixed assets related
to continuing operations represent non-current assets included in the net invested capital;
- Fixed assets related to continuing operations without IFRS 16: this measure is calculated
by excluding the rights of use detected in the application of the new standard IFRS 16 -
Leases, from fixed assets related to continuing operations;
- Net operating working capital related to continuing operations: this measure is
constituted by the sum of the items, "Inventories", "Trade receivables" and "Trade payables". It
is used to measure the financial stability of commercial activities.
- Net working capital related to continuing operations: this measure consists of the
operating working capital and of other receivables and payables and derivative financial
instruments not included in the net financial (liquidity)/debt position. The measure represents
short-term assets and liabilities included in the net invested capital, and is used to measure
short-term financial stability;
- Net invested capital assets held for sale: this measure is constituted by the difference
between "Assets held for sale" and "Liabilities held for sale". Net invested capital assets held
for sale is used to measure net assets relative to assets held for sale;
- Net invested capital: this measure is constituted by the sum of (i) fixed assets related to
continuing operations, (ii) net working capital related to continuing operations, and (iii) net
invested capital assets held for sale. Net invested capital is used to represent the investment
of financial resources;
- Average net invested capital: this measure consists of the average between the net invested
capital at the beginning and end of the period, excluding investments in Associated companies
and Joint Ventures, “Other financial assets at fair value through other Comprehensive
Income”, “Other non-current financial assets at fair value through the Income Statement” and
the intangible assets relative to assets recognised as a consequence of Business
Combinations. This measure is used to calculate the ROI;
- Provisions: this measure is constituted by the sum of "Provisions for liabilities and charges
(current and non-current)", "Employee benefit obligations (current and non-current)" and
"Provisions for deferred taxes". The item provisions represents the total amount of liabilities
due to obligations of a probable but not certain nature;
- ROI: this is calculated as the ratio between the EBIT adjusted and the average net invested
capital. The ROI is used as to measure the profitability of invested capital;

32
- Net financial debt: this is calculated pursuant to the CONSOB Communication dated July 28,
2006, and in compliance with Recommendations ESMA/2013/319. Net financial debt
represents the borrowings from banks and other financial institutions net of cash and cash
equivalents, "Other financial assets at fair value through the Income Statement”, “Current
financial receivables” (included in the item “Other receivables”) and, current derivative financial
instruments included in the total net financial (liquidity)/debt position (included under current
assets as “Derivative financial instruments”);
- Total net financial (liquidity)/debt position: this measure represents the net financial debt
less “Non-current financial receivables” (included in the non-current assets item “Other
receivables”) and non-current derivative financial instruments included in the net financial
position (included under non-current assets as “Derivative financial instruments”). Total net
financial (liquidity)/debt position is an alternative measure to net financial debt which includes
non-current financial assets;
- Net financial (liquidity)/debt position without IFRS 16: this measure is calculated by
excluding leasing obligations detected during the application of the new standard IFRS 16 –
Leases, from the total net financial (liquidity)/debt position;
- Net financial (liquidity)/debt position without IFRS 16 / EBITDA adjusted without start-up
costs without IFRS 16: this is calculated as the ratio between the total net financial
(liquidity)/debt position without IFRS 16 and the EBITDA adjusted without start-up costs
without IFRS. This is used to measure the sustainability of debt;
- CapEx (Capital Expenditures) or Investments in property, plant & equipment and
intangible assets without IFRS 16 and Investments in property, plant & equipment IFRS
16: these are respectively calculated as the (i) sum of investments (increases) in intangible
assets and investments (increases) in property, plant and equipment, excluding the increases
relative to the rights of use and (ii) the increases relative to the rights of use detected during
the application of the new standard IFRS 16 – Leases. This measure represents the total
amount of investments in property, plant and equipment and intangible assets;
- Impact of depreciation on investments: is calculated by dividing the investments
(increases) in property, plant and equipment with the depreciation for the period. The ratio of
investments to depreciation is used to measure the ability to maintain or restore amounts for
property, plant and equipment.

33
OTHER INFORMATION
The Board of Directors, taking into account the simplification of regulatory requirements introduced
by CONSOB in the Issuer's Regulation No: 11971/99, resolved to exercise the power to derogate,
pursuant to the provisions of Article 70, paragraph 8, and Article 71, paragraph 1-bis of the said
Regulation, the obligations to publish the disclosure documents required at the time of significant
mergers, de-mergers, capital increases by contributions in kind, acquisitions and disposals.
ROLE OF THE BOARD OF DIRECTORS
The Board of Directors is responsible for the strategic guidance and supervision of the overall
business activities, has the power to address the administration as a whole, and is empowered in
the undertaking of the most important financial/strategic decisions and decisions which have a
structural impact on operations, or are functional decisions, as well as to exercise the control and
direction of Pirelli.
The Chairman is endowed with the legal representation of the Company including in the legal
proceedings of the Company, as well as all other powers attributable to the Chairman in
accordance with the Articles of Association.
The Executive Vice Chairman and Chief Executive Officer are exclusively delegated powers for the
ordinary management of the Company and the Group, as well as the power to make proposals
regarding the Industrial Plan and Budgets to the Board of Directors, as well as any resolutions
concerning any strategic industrial partnerships and joint ventures of which Pirelli is a part.
The Board has internally instituted the following Committees with advisory tasks:
Audit, Risk, Sustainability and Corporate Governance Committee
Remuneration Committee
Committee for Related Party Transactions
Nominations and Successions Committee
Strategies Committee

34
INFORMATION ON THE SHARE CAPITAL AND OWNERSHIP STRUCTURE
The subscribed and paid up share capital at the date of approval of this Financial Report amounted
to euro 1,904,374,935.66 and was represented by 1,000,000,000 registered ordinary shares
without indication of their nominal value.
The shareholder Marco Polo International Italy S.r.l. - pursuant to Article 93 of Legislative Decree
58/1998 - controls the Company with a 45.52% share of the capital, but does not exercise
management and coordination activities.
Updated extracts are available on the Company’s website of the existing agreements between
some of the shareholders, including indirect shareholders, of the Company, which contain the
provisions of the Shareholders' Agreements relative, amongst other things, to the governance of
Pirelli.
For more details on the governance and ownership structure of the Company reference should be
made to the “Report on Corporate Governance and Ownership Structure" included in the Annual
Report, and other additional information, published in the Governance and Investor Relations
section of the Company's website (www.pirelli.com).
RELATED-PARTY TRANSACTIONS
Related party transactions, including intra-group transactions, do not qualify as either unusual or
exceptional, but are part of the ordinary course of business for the companies of the Group. Such
transactions, when not concluded under standard conditions or dictated by specific regulatory
conditions, are in any case governed by conditions consistent with those of the market, and carried
out in compliance with the provisions of the Procedure for Related Party Transactions that the
Company has adopted.
The effects of the Related Party Transactions contained in the Income Statement and in the
Statement of Financial Position, on the consolidated financial data were as follows:
TRANSACTIONS WITH ASSOCIATES AND JOINT VENTURES

35
Statement of Financial Position Transactions
The item other non-current receivables at December 31, 2018 had referred to a loan granted by
Pirelli Tyre S.p.A. to the Indonesian Joint Venture PT Evoluzione Tyres. During the course of the
first quarter of 2019, Pirelli Tyre S.p.A. converted the outstanding loans at December 31, 2018
(euro 12.6 million classified under other non-current receivables, and euro 6.1 million classified
under other current receivables) into advance payments towards a future share capital increase
which is part of the recapitalisation operation for the the Indonesian Joint Venture.
The item trade receivables mainly includes receivables for services rendered to PT Evoluzione
Tyres for the amount of euro 3.2 million, and to the Joint Stock Company Kirov Tyre Plant for the
amount of euro 0.8 million.
The item other current receivables mainly refers to receivables for, advances from Pirelli Tyre
S.p.A. to PT Evoluzione Tyres to the amount of euro 14.8 million for the supply of motorcycle
products, for the sale of materials and moulds to the Joint Stock Company Kirov Tyre Plant to the
amount of euro 7.5 million, and for the recovery of costs by Pirelli Tyre Co. from Jining Shenzhou
Tyres Co., Ltd to the amount of euro 3.6 million.
The item trade payables mainly refers to payables for the purchase of energy from
Industriekraftwerk Breuberg GmbH, and trade payables towards the Joint Stock Company Kirov
Tyre Plant.
Income Statement Transactions
The item revenues from sales and services mainly refers to sales of materials and services
rendered to the Joint Stock Company Kirov Tyre Plant to the amount of euro 1.2 million.
This item other costs mainly refers to costs for the purchase of energy and machine hire from
Industriekraftwerk Breuberg GmbH to the amount of euro 5.9 million, and costs for the purchase of
products from PT Evoluzione Tyres to the amount of euro 6.6 million

36
TRANSACTIONS WITH OTHER RELATED PARTIES
The transactions detailed below refer mainly to transactions with the Aeolus Tyre Co., Ltd, and to
transactions with the Prometeon Group, which are companies subject to common control.5
Statement of Financial Position Transactions
The item trade receivables refers to receivables from companies of the Prometeon Group to the
amount of euro 11.9 million.
The item other trade receivables refers to receivables for royalties from the Aeolus Tyre Co., Ltd.
to the amount of euro 6 million, trade receivables to the amount of euro 12 million from companies
of the Prometeon Group, and receivables from the Aeolus Tyre Co., Ltd for equipment hire to the
amount of euro 3.6 million.
The item trade payables refers to payables towards companies of the Prometeon Group to the
amount of euro 78 million, and payables for utilities and services towards the Aeolus Tyre Co., Ltd.
to the amount of euro 4.9 million.
The item other current payables mainly refers to other current payables to companies of the
Prometeon Group to the amount of euro 8.1 million.
Income Statement Transactions
The item other operating income for the first quarter of 2019 includes royalties recognised from
the Aeolus Tyre Co., Ltd. to the amount of euro 1.8 thousand - in respect of the license agreement
5 On February 14, 2019, the Company's Board of Directors approved the renegotiation of some of the terms of the existing license
agreements with the Prometeon Tyre Group S.r.l. and the Aeolus Tyre Co., Ltd. For a description of the aforementioned remodulations and the financial effects of the same (attributable in part to the 2018 financial year) reference should be made to the 2018 Financial Statements, as well as to the Disclosure Documents on transactions published (on a prudent and voluntary basis) by the Company on February 20, 2019 which are both available on the Pirelli website at www.pirelli.com

37
stipulated in 2016 and subjected to the renegotiation of some of the terms and conditions in
February 2019. The item also includes income from companies of the Prometeon Group mainly
relative to:
- royalties arising from the trademark license agreement to the amount of euro 4.0 million;
- the sale of finished and semi-finished products for the total amount of euro 4.9 million of
which euro 4.4 million from Pirelli Pneus Ltda;
- the Long Term Service Agreement, to the amount of euro 2.5 million of which euro 1.0
million was from Pirelli Sistemi Informativi S.r.l., euro 0.3 million from Pirelli Pneus Ltda, and
euro 1.2 million from other Group companies;
- logistics services for the total amount of euro 0.8 million of which euro 0.4 million was
carried out by the Brazilian company Total Logistic Management Serviços del Logistica
Ltda;
- royalties arising from the licence agreement for know-how charged by Pirelli Tyre S.p.A. to
the amount of euro 2.5 million;
- other, to the amount of euro 0.8 million.
The item raw and consumable materials used refers to costs payable to companies of the
Prometeon Group for the purchase of direct materials, of consumables and compounds for the
total amount of euro 0.8 million.
The item other costs includes contributions to the Fondazione Hangar Bicocca (Hangar Bicocca
Foundation) and the Fondazione Pirelli (Pirelli Foundation) to the amount of euro 0.3 million, and
costs payable to companies of the Prometeon Group mainly for:
- the purchase of truck products for a total amount of euro 24.7 million of which euro 21.1
million was carried out by the Brazilian company Comercial e Importadora de Pneus Ltda for
the Brazilian sales network, euro 1.3 million carried out by the German company Driver
Reifen und KFZ-Technik GmbH, and purchases by other companies of the Group to the
amount of euro 2.3 million;
- the purchase of finished and semi-finished Car/Motorcycle products for a total amount of
euro 13.8 million, of which 12.9 million was carried out by the Turkish company Pirelli
Otomobil Latikleri A.S. as part of the Off-Take contract, and euro 0.9 million by Pirelli Pneus
Ltda for the purchase of inner tubes for tyres;
- costs to the amount of euro 2.9 million incurred by Pirelli Pneus Ltda for services for the
transformation of raw materials as a result of activities pertinent to the Toll manufacturing
contract.
- other, to the amount of euro 2.7 million.

38
EXCEPTIONAL AND/OR UNUSUAL OPERATIONS
Pursuant to CONSOB Communication No. 6064293 of July 28, 2006, it is hereby specified that
during the course of the first quarter, that no exceptional and/or unusual transactions as defined in
the aforesaid Notice were carried out by the Company.
The Board of Directors
Milan, May 14, 2019

39
FINANCIAL STATEMENTS

40
CONSOLIDATED STATEMENT OF FINANCIAL POSITION (In thousands of euro)
Property, plant and equipment 3,621,036 3,092,927
Intangible assets 5,753,354 5,783,338
Investments in associates and J.V. 92,110 72,705
Other financial assets at fair value through other comprehensive income 75,650 68,781
Other financial assets at fair value through income statement - -
Deferred tax assets 59,250 74,118
Other receivables 214,340 225,707
Tax receivables 15,335 16,169
Derivative financial instruments 36,637 20,134
Non-current assets 9,867,712 9,353,879
Inventories 1,165,512 1,128,466
Trade receivables 858,442 627,968
Other receivables 482,345 416,651
Other financial assets at fair value through income statement 8,501 27,196
Cash and cash equivalents 962,957 1,326,900
Tax receivables 42,248 41,393
Derivative financial instruments 84,471 98,567
Current assets 3,604,476 3,667,141
Assets held for sale 796 10,677
Total Assets 13,472,984 13,031,697
Equity attributable to the owners of the Parent Company: 4,603,896 4,468,121
Share capital 1,904,375 1,904,375
Reserves 2,601,907 2,132,140
Net income (loss) 97,614 431,606
Equity attributable to non-controlling interests: 84,012 82,806
Reserves 80,190 72,040
Net income (loss) 3,822 10,766
Total Equity 4,687,908 4,550,927
Borrowings from banks and other financial institutions 4,521,423 3,929,079
Other payables 82,237 83,287
Provisions for liabilities and charges 131,648 138,327
Provisions for deferred tax liabilities 1,087,594 1,081,605
Employee benefit obligations 218,875 224,312
Tax payables 2,123 2,091
Derivative financial instruments 23,313 16,039
Non-current liabilities 6,067,213 5,474,740
Borrowings from banks and other financial institutions 1,041,022 800,145
Trade payables 1,142,538 1,604,677
Other payables 401,425 436,752
Provisions for liabilities and charges 36,534 33,876
Employee benefit obligations 7,787 5,475
Tax payables 54,011 65,503
Derivative financial instruments 34,546 59,602
Current liabilities 2,717,863 3,006,030
Total Liabilities and Equity 13,472,984 13,031,697
03/31/2019 12/31/2018

41
Revenues from sales and services 1,313,804 1,310,257
Other income 99,049 112,999
Changes in inventories of unfinished, semi-finished and finished
products 29,810 9,154
Raw materials and consumables used (net of change in inventories) (457,327) (446,737)
Personnel expenses (265,513) (265,442)
Amortisation, depreciation and impairment (124,885) (98,204)
Other costs (410,304) (438,985)
Net impairment loss on financial assets (2,613)
Increase in fixed assets for internal work 1,052 1,002
Operating income (loss) 183,073 184,044
Net income (loss) from equity investments 2,012 773
- share of net income (loss) of associates and j.v. 330 (3,237)
- gains on equity investments 1,682 4,010
- losses on equity investments - -
- dividends - -
Financial income 18,867 41,860
Financial expenses (66,918) (97,045)
Net income (loss) before tax 137,034 129,632
Tax (35,598) (37,178)
Net income (loss) from continuing operations 101,436 92,454
Net income (loss) from discontinued operations - (3,339)
Total net income (loss) 101,436 89,115
Attributable to:
Owners of the parent company 97,614 90,369
Non-controlling interests 3,822 (1,254)
Total earnings/(loss) per share (in euro per share) 0.098 0.091
Earnings/(loss) per share related to continuing operations (in euro per share) 0.098 0.094
Earnings/(loss) per share related to discontinued operations (in euro per
share) - (0.003)
01/01 - 03/31/2019 01/01 - 03/31/2018
CONSOLIDATED INCOME STATEMENT (In thousands of euro)

42
CONSOLIDATED STATEMENT OF COMPREHENSIVE INCOME (In thousands of euro)
1/1 - 03/31/2019 1/1 - 03/31/2018
A Net income (loss) for the period 101,436 89,115
B - Items that will not be reclassified to income statement:
- Net actuarial gains (losses) on employee benefits - -
- Fair value adjustment of financial assets at fair value through other comprehensive
income 6,846 (676)
Total B 6,846 (676)
C - Items reclassified / that will be reclassified to income statement:
Exchange differences from translation of foreign financial statements
- Gains / (losses) for the period 37,373 (1,222)
- (Gains) / losses reclassified to income statement (1,567) -
Fair value adjustment of derivatives designated as cash flow hedges:
- Gains / (losses) for the period 42,101 (47,431)
- (Gains) / losses reclassified to income statement (47,177) 48,408
- Tax effect 1,502 (225)
Cost of hedging
- Gains / (losses) for the period 296 5,010
- (Gains) / losses reclassified to income statement (1,676) -
- Tax effect 255 (478)
Total C 31,107 4,062
D Total other comprehensive income (B+C) 37,953 3,386
A+D Total comprehensive income (loss) for the period 139,389 92,501
Attributable to:
- Owners of the parent company 130,276 91,735
- Non-controlling interests 9,113 766
Attributable to owners of the parent company:
- Continuing operations 130,276 95,074
- Discontinued operations - (3,339)
Total attributable to owners of the parent company 130,276 91,735
Other components of comprehensive income:
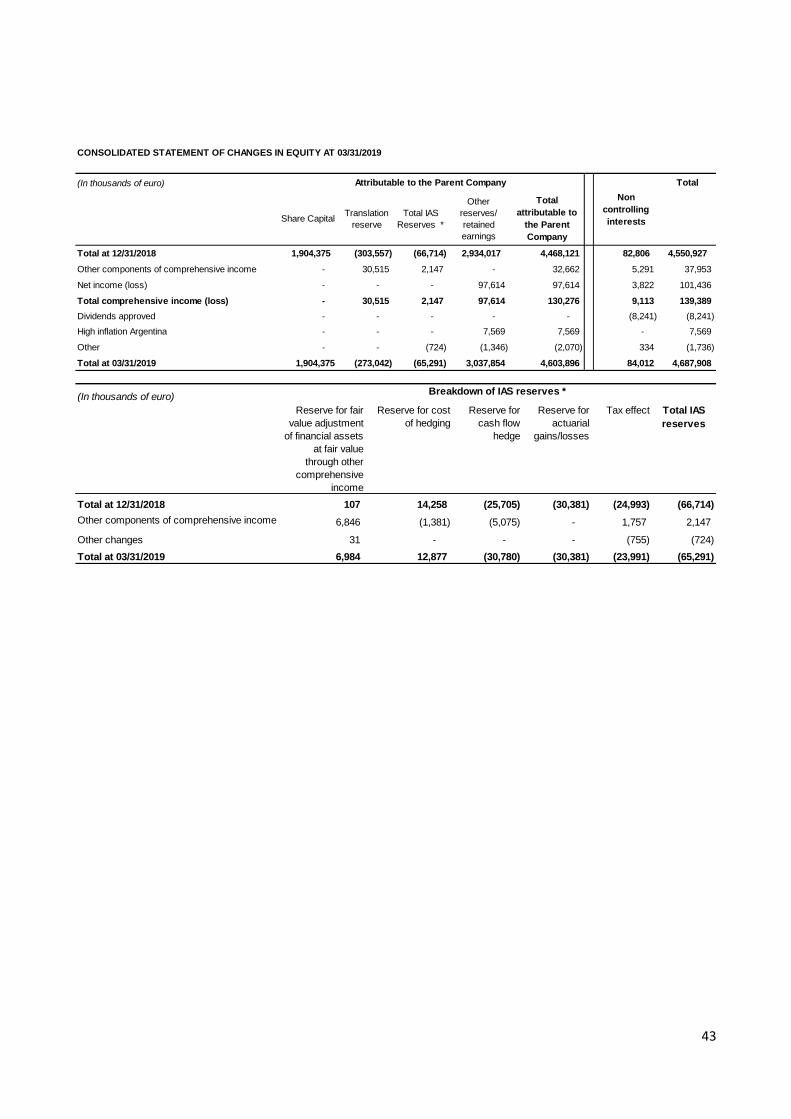
43
CONSOLIDATED STATEMENT OF CHANGES IN EQUITY AT 03/31/2019
(In thousands of euro) Total
Share CapitalTranslation
reserve
Total IAS
Reserves *
Other
reserves/
retained
earnings
Total
attributable to
the Parent
Company
Total at 12/31/2018 1,904,375 (303,557) (66,714) 2,934,017 4,468,121 82,806 4,550,927
Other components of comprehensive income - 30,515 2,147 - 32,662 5,291 37,953
Net income (loss) - - - 97,614 97,614 3,822 101,436
Total comprehensive income (loss) - 30,515 2,147 97,614 130,276 9,113 139,389
Dividends approved - - - - - (8,241) (8,241)
High inflation Argentina - - - 7,569 7,569 - 7,569
Other - - (724) (1,346) (2,070) 334 (1,736)
Total at 03/31/2019 1,904,375 (273,042) (65,291) 3,037,854 4,603,896 84,012 4,687,908
Attributable to the Parent Company
Non
controlling
interests
(In thousands of euro)
Reserve for fair
value adjustment
of financial assets
at fair value
through other
comprehensive
income
Reserve for cost
of hedging
Reserve for
cash flow
hedge
Reserve for
actuarial
gains/losses
Tax effect Total IAS
reserves
Total at 12/31/2018 107 14,258 (25,705) (30,381) (24,993) (66,714)
Other components of comprehensive income 6,846 (1,381) (5,075) - 1,757 2,147
Other changes 31 - - - (755) (724)
Total at 03/31/2019 6,984 12,877 (30,780) (30,381) (23,991) (65,291)
Breakdown of IAS reserves *
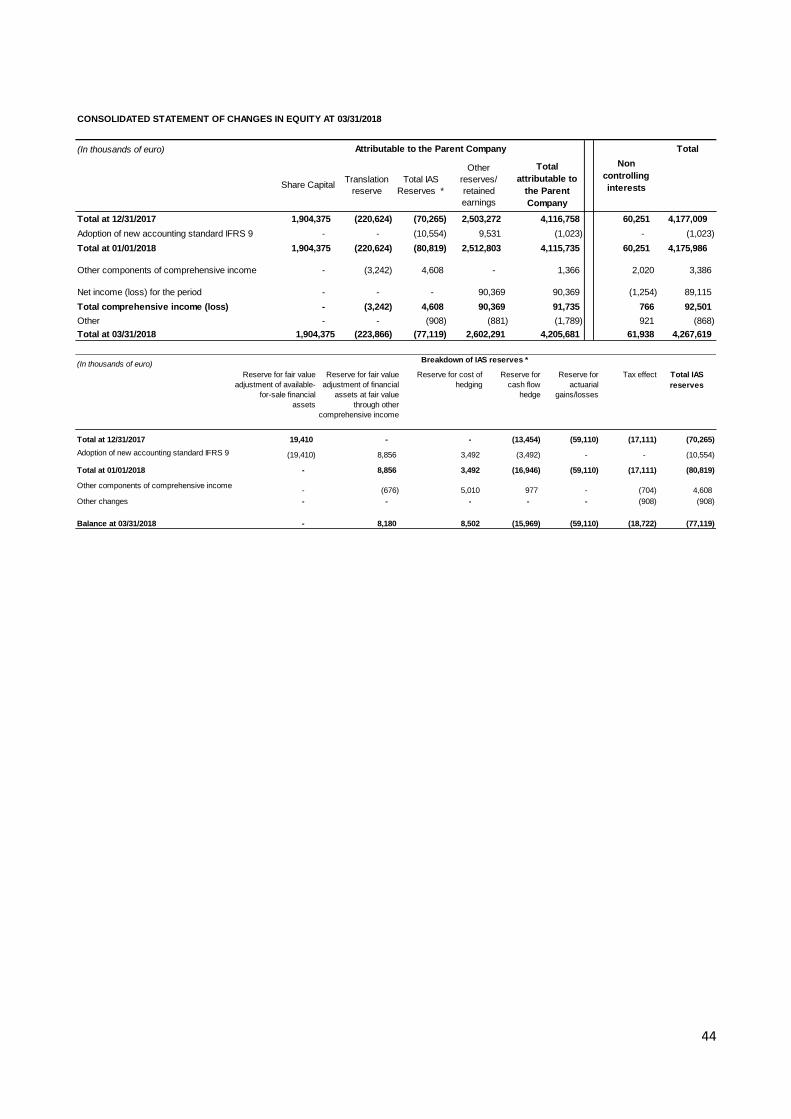
44
CONSOLIDATED STATEMENT OF CHANGES IN EQUITY AT 03/31/2018
(In thousands of euro) Total
Share CapitalTranslation
reserve
Total IAS
Reserves *
Other
reserves/
retained
earnings
Total
attributable to
the Parent
Company
Total at 12/31/2017 1,904,375 (220,624) (70,265) 2,503,272 4,116,758 60,251 4,177,009
Adoption of new accounting standard IFRS 9 - - (10,554) 9,531 (1,023) - (1,023)
Total at 01/01/2018 1,904,375 (220,624) (80,819) 2,512,803 4,115,735 60,251 4,175,986
Other components of comprehensive income - (3,242) 4,608 - 1,366 2,020 3,386
Net income (loss) for the period - - - 90,369 90,369 (1,254) 89,115
Total comprehensive income (loss) - (3,242) 4,608 90,369 91,735 766 92,501
Other - - (908) (881) (1,789) 921 (868)
Total at 03/31/2018 1,904,375 (223,866) (77,119) 2,602,291 4,205,681 61,938 4,267,619
Attributable to the Parent Company
Non
controlling
interests
(In thousands of euro)
Reserve for fair value
adjustment of available-
for-sale financial
assets
Reserve for fair value
adjustment of financial
assets at fair value
through other
comprehensive income
Reserve for cost of
hedging
Reserve for
cash flow
hedge
Reserve for
actuarial
gains/losses
Tax effect Total IAS
reserves
Total at 12/31/2017 19,410 - - (13,454) (59,110) (17,111) (70,265)
Adoption of new accounting standard IFRS 9 (19,410) 8,856 3,492 (3,492) - - (10,554)
Total at 01/01/2018 - 8,856 3,492 (16,946) (59,110) (17,111) (80,819)
Other components of comprehensive income- (676) 5,010 977 - (704) 4,608
Other changes - - - - - (908) (908)
Balance at 03/31/2018 - 8,180 8,502 (15,969) (59,110) (18,722) (77,119)
Breakdown of IAS reserves *

45
CONSOLIDATED STATEMENT OF CASH FLOWS (in thousands of euro)
Net income (loss) before taxes 137,034 129,632
Reversals of amortisation, depreciation, impairment losses and restatement of
property, plant and equipment and intangible assets124,885 98,204
Reversal of Financial expenses 66,918 97,045
Reversal of Financial income (18,867) (41,860)
Reversal of Dividends - -
Reversal of gains/(losses) on equity investments (1,682) (4,010)
Reversal of share of net income from associates and joint ventures (330) 3,237
Taxes paid (30,147) (31,078)
Change in Inventories (22,037) (5,297)
Change in Trade receivables (223,314) (232,499)
Change in Trade payables (483,468) (553,100)
Change in Other receivables/Other payables (84,422) (122,944)
Change in Provisions for employee benefit obligations and Other provisions (10,741) (13,990)
Other changes 10,521 (9,657)
A Net cash flows provided by / (used in) operating activities (535,650) (686,316)
Investments in property, plant and equipment (97,983) (84,666)
Disposal of property, plant and equipment/intangible assets 1,939 4,180
Investments in intangible assets (521) (584)
Disposals (Acquisition) of investments in subsidiaries 10,700 -
Acquisition of minorities - (18,492)
Repayment of share capital and reserves from associates - 2,224
Disposals (Acquisition) of investments in associates and JV (8,925) -
Disposals (Acquisition) of other non current financial assets at fair value through
income statement - Other financial assets - 152,808
B Net cash flows provided by / (used in) investing activities (94,790) 55,470
Change in Financial payables 328,166 137,628
Change in Financial receivables/Other current financial assets at fair value through
income statement - Assets held for trading18,765 89,461
Financial income / (expenses) (59,421) (82,725)
Cash outflow for lease obligations (22,673) -
C Net cash flows provided by / (used in) financing activities 264,837 144,364
D Net cash flows provided by (used in) discontinued operations - (22,675)
E Total cash flows provided / (used) during the period (A+B+C+D) (365,603) (509,157)
F Cash and cash equivalents at the beginning of the financial year 1,303,852 1,109,640
G Exchange rate differences from translation of cash and cash equivalents 9,211 (12,413)
H Cash and cash equivalents at the end of the period (E+F+G) (°) 947,460 588,070
(°) of which:
cash and cash equivalents 962,957 592,136
bank overdrafts (15,497) (4,066)
01/01 - 03/31/2019 01/01 - 03/31/2018

46
FORM AND CONTENT
The publication of the Interim Financial Report is carried out on a voluntary basis. The publication
of Interim Financial Reports covers the quarters which close at March 31 and September 30 of
each financial year.
For the evaluation and measurement of the accounting figures, the standards applied were the
International Accounting Standards (IAS) and the International Financial Reporting Standards
(IFRS) issued by the International Accounting Standards Board (IASB) and their relative
interpretations issued by the International Financial Reporting Interpretations Committee (IFRIC),
as approved by the European Commission, and in force at the time of approval of this report.
The accounting standards adopted were the same used for the preparation of the consolidated
Financial Statements at December 31, 2018 to which, reference should be made for more details,
with the exception of:
the new accounting standards or amendments to existing standards, which became applicable
as of January 1, 2019:
IFRS 16 - Leases: following the application of this standard, at the transition date the Group
accounted for the following in relation to lease contracts previously classified as operational:
a financial liability, equal to the present value of residual future payments at the
transition date, discounted using the incremental borrowing rate applicable at the
transition date for each contract;
a right of use equal to the value of the financial liability at the transition date, net of any
accruals and deferrals relative to the lease and recognised in the Statement of Financial
Position at the transition date.
The comparable financial figures for the first quarter of 2018 have not been restated.
IFRIC 23 – Uncertainty over Income Tax Treatments: there were no impacts on the Group's
Financial Statements arising from the application of this interpretation;
Amendments to IFRS 9 - Financial Instruments: prepayment features with negative
compensation and changes in financial liabilities: there were no impacts on the Group's
Financial Statements arising from the application of these amendments;
Amendments to IAS 28 - Investments in Associates and Joint Ventures Long-term interests in
Associates and Joint Ventures: there were no impacts on the Group's Financial Statements
arising from the application of this amendment;
Improvements to the IFRS 2015 - 2017 cycle (issued by the IASB in December 2017): there
were no impacts on the Group's Financial Statements;
Amendments to IAS 19 - “Employee Benefits”: there were no impacts on the Group's
Financial Statements arising from the application of these amendments;
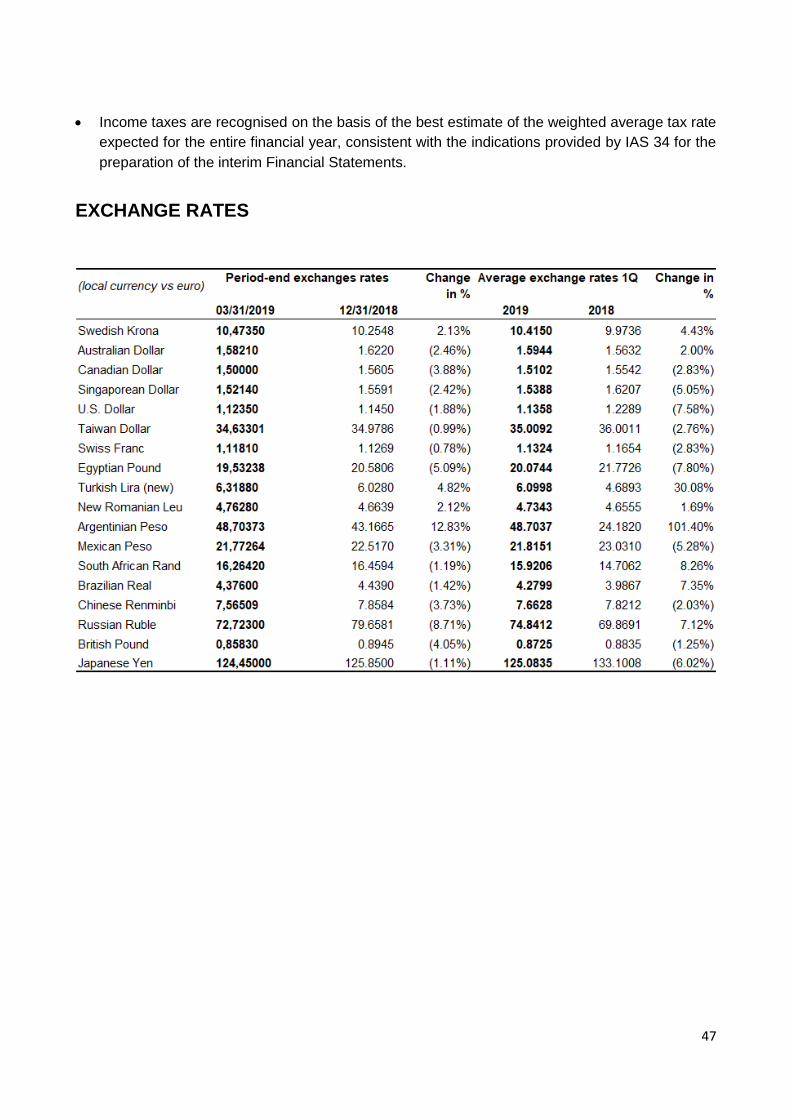
47
Income taxes are recognised on the basis of the best estimate of the weighted average tax rate
expected for the entire financial year, consistent with the indications provided by IAS 34 for the
preparation of the interim Financial Statements.
EXCHANGE RATES

48
NET FINANCIAL POSITION

49
DECLARATION OF THE CORPORATE FINANCIAL REPORTING
MANAGER PURSUANT TO THE PROVISIONS OF ARTICLE 154-BIS,
PARAGRAPH 2, OF LEGISLATIVE DECREE NO. 58/1998
The Corporate Financial Reporting Manager, Francesco Tanzi declares, pursuant to Article 154-
bis, paragraph 2 of the Finance Consolidation Act, that the accounting information contained in this
consolidated Interim Financial Report at March 31, 2019, is compliant with the documented results,
books and accounting records.
Milan, May 14, 2019
_________________________
Francesco Tanzi