Embed Size (px)
Citation preview

1
Interaction of Anti-Lock Braking Systems with Tire
Torsional Dynamics
John Adcox*
Clemson University – International Center for Automotive Research
4 Research Dr., CGEC, Greenville, SC, 29607, USA
Dr. Beshah Ayalew
Clemson University – International Center for Automotive Research
4 Research Dr., Room 342 CGEC, Greenville, SC, 29607, USA
Dr. Tim Rhyne
Michelin America Research Corporation
515 Michelin Rd, Greenville, SC 29605, USA
Steve Cron
Michelin America Research Corporation
515 Michelin Rd, Greenville, SC 29605, USA
Mike Knauff
Michelin America Research Corporation
515 Michelin Rd, Greenville, SC 29605, USA
Presented at the
September 2011
Meeting of the Tire Society
*Presenter / Corresponding Author

2
J. Adcox, B. Ayalew, T. Rhyne, S. Cron, M. Knauff
Interaction of Anti-Lock Braking Systems with Tire
Torsional Dynamics
REFERENCE: J. Adcox, B. Ayalew, T. Rhyne, S. Cron, M. Knauff, "Interaction of Anti-Lock Braking Systems
with Tire Torsional Dynamics", submitted for presentation at the 2011 Tire Society meeting and for consideration
for publication in the journal Tire Science and Technology.
ABSTRACT: A tire’s torsional dynamics couple the responses of wheel/hub inertia to that of the ring/belt inertia.
Depending on the effective stiffness, damping and mass distribution of the tire, the ensuing deflections between the
wheel and the ring can cause significant errors in the estimation of the tire’s longitudinal slip from wheel speed
measurements. However, this remains the established approach for constructing anti-lock braking (ABS) control
algorithms. Under aggressive braking events, the errors introduced by torsional dynamics may significantly affect
the ABS algorithm and result in less than optimal braking performance.
This paper investigates the interaction of tire-torsional dynamics and ABS control using a comprehensive
system model that incorporates sidewall flexibility, transient and hysteretic tread-ground friction effects, and the
dominant dynamics of a hydraulic braking system. It considers a wheel/hub acceleration-based ABS controller that
mimics the working steps of a commercial ABS algorithm. Results from multiple sensitivity studies show a strong
correlation of stopping distances and ABS control activity with design parameters governing tire/wheel torsional
response, and the filter cutoff frequency of the wheel acceleration signals used by the controller.
KEY WORDS: Anti-locking Braking systems, tire torsional dynamics, wheel acceleration control, LuGre tread-
friction model
Introduction
ABS control algorithms have been commercially available on vehicles for years and have
been researched for even longer. Most of the published research on ABS algorithms is based on
simplified rigid wheel dynamics models where the primary focus is on accommodating tire-
ground slip conditions on various road surfaces. With advances in tire/wheel technology,
including available aftermarket choices, the different torsional dynamic properties of the
tire/wheel systems cannot be sufficiently captured using rigid wheel assumptions for the entire
tire/wheel system. For example, there are drastic differences in torsional dynamic properties
between an inflated or deflated run-flat tire. ABS algorithms that embed rigid wheel assumptions
are likely to give compromised performance in terms of achievable stopping distances when
working with such drastically different tire/wheel designs. However, there remains very little
published research that looks into how these design variations interact with and influence the
performance of ABS controllers.
3
Various tire models have been developed in order to better approximate the transient
dynamics of a tire [1][2][3][4]. And multiple authors [5][6][7] have modeled and simulated ABS
control structures that are combined with these various flexible tire models in order to see their
effect on braking performance. These works did not put emphasis on the analysis of the
robustness of ABS controller’s achievable stopping distance to changes in the tire/wheel
parameters. However, there has been some anecdotal experimental evidence that suggests ABS
interacts differently with different tire designs during hard braking events. For example, testing
performed at Michelin showed that, on a wet asphalt surface, a tire that has a low torsional
stiffness performed approximately 30% worse than a tire with a standard torsional stiffness when
fitted to the same vehicle with ABS. However, when the ABS was deactivated the stopping
distance for the two tires were almost equal.
In light of the above, the objective of this work is to study the interactions of tire/wheel
designs with the workings of a typical commercial ABS control system. To this end, a detailed
simulation model of the braking system dynamics of a small passenger vehicle is developed. It
includes tire sidewall torsional deflection, dynamic tread-ground friction effects, and brake
hydraulics. This integrated model is used to conduct sensitivity studies on the achievable braking
performance by changing the parameters of the ABS control algorithm and the various tire and
wheel design parameters, namely, sidewall flexibility and damping, and inertia distributions.
This paper is organized as follows. First, the system model adopted for the ensuing analysis is
briefly described. Then, the open-loop (i.e. without an ABS algorithm) response of the coupled
system is analyzed. This is followed by a brief description of a wheel-acceleration based ABS
controller. The closed-loop system is then used to perform a series of sensitivity studies
considering changes in the tire’s torsional characteristics and controller settings. The conclusions
drawn from these sensitivity studies are summarized at the end of the paper.
System Modeling
Tire Model
The tire/wheel model that is used throughout this paper only includes the torsional deflection
of the sidewall, as this is considered to be the dominant effect on the response of the tire/wheel
system onto which the braking inputs are applied. As such, a two-inertia model representing the

4
ring and hub is considered as shown in in Figure 1. The sidewall’s torsional stiffness and
damping coefficient are denoted by and , respectively. A tangential tread-deflection model
is also incorporated using the Average Lumped Parameter LuGre friction model detailed in [8]
and also discussed in [9][10][11][12]. The schematic for this model is shown in Figure 2, where
and are stiffness and damping coefficients appearing in the LuGre model [16].
Figure 1: Hub/Tire Model Figure 2: Schematic for the LuGre Friction Model
Considering a quarter vehicle model along with the above tire/wheel and tread/ground friction
model, the equations describing the system reduce to the following:
( ) ( ) (1)
( ) ( ) (2)
(3)
( ) (4)
(5)
| |
( ) | | (6)
( ) ( ) |
⁄ |
(7)
Here, Equation 1 and Equation 2 represent the hub and ring dynamics, respectively. and
designate the hub/wheel and ring inertias, designates the sidewall stiffness, designates the
5
damping coefficient of the sidewall, designates the braking torque, and designates the
ground force. Equation 3 gives the longitudinal braking dynamics of the quarter vehicle, where
aerodynamic and rolling resistance contributions have been neglected. In this work, vehicle
parameters for a small passenger vehicle (1991 Mazda Miata) are considered.
Equations 4-7 represent the equations for the Average Lumped Parameter LuGre friction
model [8][9][10][11][12]. In Equation 4, the ground force ( ) equals the sum of effective tread
stiffness and tread damping forces times the normal force ( ) on the tire, where z represents the
effective or average tread/bristle deflection in the contact zone. Equation 5 shows the
relationship between the relative sliding velocity ( ) , and the vehicle velocity ( ), and the
tangential velocity of the ring. Equation 6 represents the tread deflection rate as a function of the
relative sliding velocity, the tread stiffness, a load distribution factor for the contact patch ( ) and
the sliding/Stribeck friction function ( ). Equation 7 defines this Stribeck friction function for
the friction coefficient of the tread/ground interface as a function of the sliding velocity. In this
equation, and represent the static and coulomb friction coefficients, respectively, is the
Stribeck sliding velocity, and α is a shaping factor that is used to capture the shape of the
friction-slip curve. For the investigations in this work, the ‘Stribeck’ friction curve has been
extrapolated from experimental data for a wet surface where the static ( ) and kinetic ( )
coefficients of friction are 0.75 and 0.4, respectively, and the shaping factor (α) has been
determined as 0.75.
Basic Responses of Tire Model
It is useful to quantify certain linearized characteristics, such as the natural frequency and
damping ratio, by analyzing the tire/wheel system in a free-free state where the nonlinear friction
forces and the tread dynamics are ignored. These are given as follows [18]:
√ ( )
(8)
√
( ) (9)
Table 1 below shows computed values of these parameters for two tire designs for the same
vehicle. The torsional stiffness values for the two designs are experimentally determined, and the
torsional damping coefficient was merely selected to keep the damping ratio at the typical value

6
of 0.05. Tire 1 is a low torsional stiffness tire (lower torsional natural frequency), and Tire 2 is a
tire with the torsional stiffness of a stock pneumatic tire.
Table 1: Various Tire Parameters
[
] [
]
Tire 1 7616 2.5 1 0.093 47.6 0.05
Tire 2 19438 4 1 0.093 76.1 0.05
Brake Hydraulics Model
Figure 3 shows the main components of such a hydraulic braking system configured for ABS
[13]. In the model adopted, the hydraulic dynamics before the inlet and outlet valves have been
ignored, assuming that the valve responses and pressure (compressibility effects) dynamics
dominate the hydraulic dynamics. This is equivalent to assuming that the build-up phase for the
master cylinder pressure is neglected and that the oil pump is ideal. Equations 10-14 list the
equations derived for describing the dynamics of the brake system under these assumptions.
1. Oil Reservoir Tank
2. Master Cylinder
3. Oil Pump
4. Check Valve
5. Inlet Valve
6. Outlet Valve
7. Disk Brake
8. Wheel/Tire Assembly
Figure 3: Schematic of Brake Hydraulics [13]

7
( ) (10)
√
( ) (11)
√
( ) (12)
(13)
( ) (14)
Equation 10 represents the caliper cylinder pressure dynamics as a function of the bulk
modulus and volume of the fluid and the flow rate through the brake lines. Equation 11
and Equation 12 represent the flow rates through the inlet and outlet valves, respectively.
Equation 13 models how the effective valve area changes with the valve input, the gain of
the valve, delays and its time constant. And lastly, Equation 14 converts the pressure from
the brake lines into the torque that is applied by the caliper on the wheel hub given two
brake pads at a given radius from the wheel center at a given pad friction coefficient. A
more detailed model of the hydraulic brake system is given in reference [13].
The brake system parameters have been determined from both physical measurements
and a reference [17] to represent typical characteristics of a hydraulic braking system for a
small passenger car (the 1991 Mazda Miata). The following values were used throughout
the simulations: .
The time constant for the caliper pressure dynamics is found to be of the order of 15 ms.
When cascaded with the valve dynamics, which has a time constant of 10 ms, this
produces an overall brake caliper pressure response (to valve input) on the order of 20 ms.
Open-Loop Response of Tire and Brake System
The tire and brake system models presented above are connected together and the
responses of the combined system to step changes in valve voltage (input, and output
valves) are analyzed. Figure 4 shows this transient response in terms of the longitudinal

8
force coefficient (μ) vs. the wheel and ring slip ratios ( lw , lr ) at each instant during this
simulated hard braking event. These quantities are defined as:
It can be seen that for the low torsional stiffness tire (Tire 1), the force coefficient
builds up to the Stribeck curve, at approximately 10% ring slip ratio, and then smoothly
follows just under the Stribeck friction curve until it reaches full lockup. It also shows that
for a given value of the force coefficient, the wheel slip ratio lags the ring slip ratio during
the force build up phase and once it reaches the peak force coefficient, the wheel slip ratio
exhibits oscillations around the ring slip ratio. We can make parallel observations on the
effect of sidewall flexibility by referring to the right side of Figure 4, which shows the
torsional angle between the wheel and the ring during the same hard braking event. During
initial force build up, there is an increase in the relative torsional angle until a peak value
of μ is achieved. Then the wheel and ring oscillate relative to each other with an average
twist of around 0.029 radians until the wheel locks-up and the ring continues to oscillate
dramatically about the wheel.
These results confirm that, in the presence of tire torsional flexibility, there is a distinction
between the behavior of the ring and wheel slip ratios during a hard braking event and one
m =Ft
Fzlw =1-
wwR
Vand lr =1-
wrR
V
Figure 4: Open-Loop Response with Torsional Dynamics

9
should therefore expect some interaction with an ABS controls system that attempts to
influence this very dynamics.
Acceleration-based ABS Controller
For this work, an acceleration-based ABS controller has been modeled after the ABS
control algorithm outlined by the ABS system supplier Bosch [14]. The ABS controller
cycles through various control phases is designed around a set of predetermined thresholds
that are highlighted in Figure 5. While a brief description of the cycles and thresholds is
given below, the reader is referred to sources [14][15] for details.
Figure 5: Bosch Wheel-Acceleration Based ABS Algorithm
When the ABS is triggered it enters the first phase of the controller where the brake
pressure increases until the peripheral wheel acceleration crosses the threshold (-a). The
controller then switches to holding the brake pressure (Phase 2), to ensure that the tire
friction has become fully saturated. Once the slip switching threshold ( ) has been
reached, the controller will reduce the brake pressure (Phase 3) until the wheel peripheral
acceleration exceeds the threshold (-a). Phase 4 represents a pressure holding phase where
the wheel begins to accelerate again as the ring slip enters the stable region of the μ-slip
curve. Phases 5 through 7 then represent various stages of pressure holding and pressure
increases in order to approach the maximum friction coefficient. Once the peripheral
wheel acceleration again crosses the threshold (-a) then the ring slip is assumed to be in

10
the unstable region. The controller then immediately returns to Phase 3, where the brake
pressure is decreased, and the cycle is repeated. Once the estimated vehicle velocity has
fallen below a set minimum speed then the controller is deactivated and the brake pressure
is allowed to increase, up to the master cylinder pressure, until the vehicle reaches a
complete stop.
Construction of Acceleration Signals (Filtering)
Since the controller acts upon wheel acceleration thresholds, it is instructive to analyze
the open-loop acceleration responses for a tire (Tire 1) following a step increase in valve
voltage, as shown in Figure 6. It can be seen that the unfiltered wheel acceleration exhibits
large magnitude oscillations before it begins to converge on a specific acceleration. The
unfiltered ring acceleration shows oscillations that are smaller, but similar.
Figure 6: Step-Response of Unfiltered & Filtered Tangential Accelerations for Open-Loop
Hub/Tire Model
Figure 6 also shows the open-loop response for Tire 1, with a natural frequency of
48Hz, under different filter settings. For the investigations in this work, the filter type was
chosen to be 4th
-order Butterworth filter due to its good balance between a reasonable roll-
off of and minimal added phase lag. It can be seen that the 80Hz filter
will do little to affect the acceleration signal. However, the 15Hz filter, which will roll off

11
to -20dB at approximately 27Hz, is decent at filtering out the tire/wheel dynamics. In fact,
it is interesting to note that with the 15Hz filter the signal is similar to the unfiltered ring
accelerations, but with fewer oscillations, as it is filtering out the torsional dynamics
attributed to the sidewall (and the high frequency tread dynamics). The controller is
designed to act upon these gradual filtered acceleration changes so that there is a smooth
flow between the controller phases.
Sensitivity Studies
In the following sub-sections, the interaction between the ABS controller and the tire
torsional dynamics will be studied considering changes in the ABS controller filter cutoff
frequency, the sidewall damping and stiffness coefficients, and the ring and wheel inertias.
Effect of Filter Cutoff Frequency
To analyze the effect of the filter cutoff frequency, the nominal ABS control thresholds
are first determined (tuned) for a nominal filter cutoff frequency, and then the filter cutoff
frequency is varied while the controller thresholds are held constant. The selected
thresholds are those that maintain a sequential flow of the control phases (i.e. the
controller should not jump from phase 3 to phase 6, etc…) and minimize both the stopping
distance and the control activity. The filter cutoff frequency is varied for a range of tire
parameters and the stopping distance and the control activity are analyzed.
Figure 7 shows the sensitivity results where the controller was nominally designed for
Tire 1 ( 47 𝐻 ) with a 15Hz filter cutoff frequency, as represented by the black
dot. The filter cutoff frequency was then varied between 1.5Hz and 120Hz. The figure also
presents a constant ideal stopping distance line that is based on a peak friction coefficient
of approximately 0.65, as shown in Figure 4. As expected, the stopping distance and
control activity are minimized at the nominal cutoff frequency of 15Hz. It is interesting to
note that if the filter cutoff frequency is lowered, below approximately 15 Hz, the stopping
distance dramatically increases while the control activity remains small. This can be
attributed to a low cutoff frequency filter removing most of the tire-wheel dynamics from
the system and resulting in an ABS system that responds too slowly to increases in the

12
wheel slip. On the other hand, if the cutoff frequency of the filter is increased significantly
above the nominal frequency then the control activity begins to increase. This is explained
by noting that at these settings, the tire-wheel torsional dynamics have not been
sufficiently filtered. This causes the controller to become more active as the most extreme
thresholds (+A and –a) are easily crossed causing the controller to quickly switch between
pressure-increase and pressure-decrease states.
Figure 8 shows the results for the stiffer Tire 2 ( 7 𝐻 ) with a nominal filter
cutoff frequency of 25Hz. It can be seen that the control activity will remain relatively
small until the filter cutoff frequency reaches approximately 40Hz at which point it begins
to increase. This is due to the fact that the torsional stiffness, and thus the natural
frequency, is much higher for Tire 2 than for the Tire 1. As such, the filter cutoff
frequency can be set at a higher frequency without attenuating much of the tire/wheel
sidewall dynamics. If the filter cutoff frequency is lowered below the nominal frequency,
then the stopping distance begins to increase because the controller is no longer optimized.
However, once the filter cutoff frequency falls below approximately 15Hz then, similar to
the Tire 1 case, the stopping distance begins to dramatically increase since most of the
tire-wheel dynamics have been removed.
Figure 7: Cutoff Filter Frequency
Sensitivity Study for Tire 1 Parameters
Figure 8: Cutoff Filter Frequency
Sensitivity Study for Tire 2 Parameters

13
The above analyses suggest that even if the torsional stiffness of the tire is varied, the
controller will continue to perform well as long as the cutoff filter frequency satisfies two
conditions:
The filter cutoff frequency must remain above some minimum frequency, in this
case approximately 15Hz, for the controller to achieve good performance (stopping
distance) with minimal activity.
The filter cutoff frequency must be set low enough that it will effectively remove the
tire/wheel sidewall dynamics from the wheel accelerations used by the controller.
Therefore, when designing the controller and filter parameters, it makes sense to set the
filter cutoff frequency close to the lower limit in order to accommodate the largest range
of tire torsional stiffnesses, as will be demonstrated further in the following subsection.
Sensitivity to Sidewall Torsional Stiffness and Damping
Next we consider the sensitivity of the controller to changes in the sidewall torsional
stiffness and the torsional damping coefficient . In each case, the controller and
filter parameters have been designed for a nominal tire/wheel set. Then, the tire torsional
stiffness and damping coefficients are varied while the controller and filter parameters are
held constant. Figure 9 shows the sensitivity results where the controller thresholds are
optimized for Tire 2, using a 30Hz cutoff filter frequency. The figure shows that as long as
the torsional stiffness remains above a certain value, the controller has good performance.
If the torsional stiffness is converted into the free-free natural frequency of the system
(using Equation 8 and assuming constant inertias), it is found that the stopping distance
and control activity begin to increase as the natural frequency of the system approaches
the cutoff filter frequency of 30Hz. It can also be seen that the only time there is any
significant sensitivity to the damping coefficient is when the controller is already
performing poorly due to small values of the torsional stiffness. However, when the
torsional stiffness is sufficiently high, the dynamics that are introduced from an over or
under-damped system are filtered out of the data and thus will have no effect on the
controller. As such, this sensitivity will only be noticed when the system is already not
effectively filtering out the natural frequency dynamics due to sidewall flexibility, and
thus remains only a secondary concern relative to the sidewall stiffness.

14
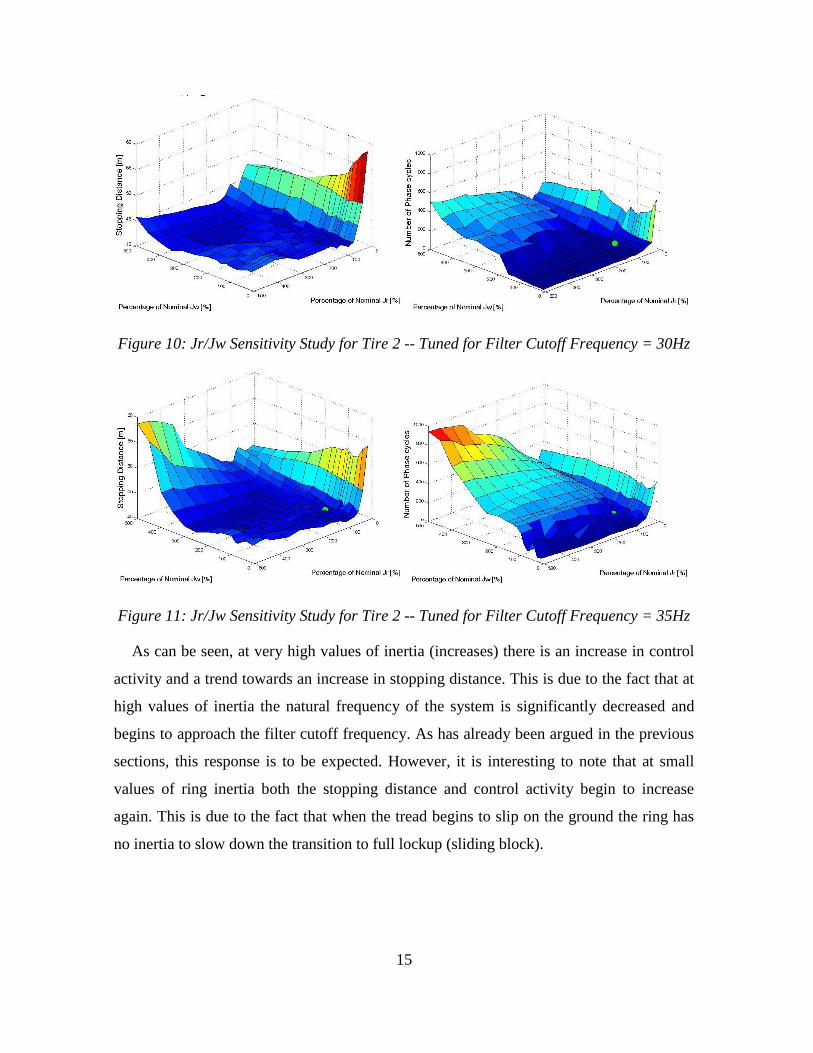
Sensitivity to Wheel and Ring Inertia
It has been shown that the relative value of free-free natural frequency with respect to
the filter cutoff frequency has a strong effect on the achievable stopping distance and
control activity. It is therefore important to look at all of the factors that affect the natural
frequency, including the inertia values of the wheel and the tire ring. Here, this is
completed by first tuning the controller to the nominal Tire 2 parameters listed in Table 1,
for selected filter cutoff frequencies. The inertias are then varied and the corresponding
stopping distance and control activity are recorded. These results are presented in the
following plots (Figure 10-Figure 11), where the inertia values are represented as
percentage differences from the nominal. Note that the green point represents the nominal
inertia values (i.e. = 100% and = 100%).
Figure 9: Kt/Ct Sensitivity Study for Tire 2 Parameters
15
Figure 10: Jr/Jw Sensitivity Study for Tire 2 -- Tuned for Filter Cutoff Frequency = 30Hz
Figure 11: Jr/Jw Sensitivity Study for Tire 2 -- Tuned for Filter Cutoff Frequency = 35Hz
As can be seen, at very high values of inertia (increases) there is an increase in control
activity and a trend towards an increase in stopping distance. This is due to the fact that at
high values of inertia the natural frequency of the system is significantly decreased and
begins to approach the filter cutoff frequency. As has already been argued in the previous
sections, this response is to be expected. However, it is interesting to note that at small
values of ring inertia both the stopping distance and control activity begin to increase
again. This is due to the fact that when the tread begins to slip on the ground the ring has
no inertia to slow down the transition to full lockup (sliding block).

16
Conclusions
This work set out to identify and explain influences of ABS controller settings on
achievable performance (in stopping distance) as the tire torsional characteristics are
changed. It has been identified that filter cutoff frequencies embedded in acceleration-
based ABS control strategies play a significant role in influencing the interaction between
ABS control activity and tire torsional dynamics.
To summarize these findings:
The filter cutoff frequency must remain above a certain minimum limit (e.g. 15 Hz
for this ABS control algorithm) and yet be set sufficiently low enough to filter out
the dynamics from the dominate torsional mode.
The larger the difference between the filter cutoff frequency and the open-loop
free-free natural frequency of the tire-wheel system, the more robust the system
becomes to variations in inertia and sidewall stiffness
At low values of ring inertia ( ) the controller is unable to control the system and
the stopping distance increases sharply.
Accounting for all the potential variations (OEM and aftermarket) in the wheel and tire
parameters is vital to ensuring sufficient robustness of the ABS control system in
achieving short stopping distances. This can be accomplished by designing the controller
around the smallest possible filter cutoff frequency, which will allow for the largest
envelope of good performance for various wheel and tire parameters.

17
References
[1] Bakker, L.E. and Pacejka, H., 1989, A new tire model with an application in vehicle
dynamics studies. SAE Technical Paper 890087
[2] Canudas-de-Wit, C., Olsson, H., Astrom, K.J. and Lischinsky, P., 1995, A new
model for control of systems with friction. IEEE Transactions on Automatic Control,
40, 419-425
[3] Tsotras, Achillefs and Mavros, George (2010) ‘Frictional contact behavior of the tyre: the
effect of tread slip on the in-plane structural deformation and stress field development’,
Vehicle Systems Dynamics, 48: 8, 891-921
[4] P.W.A. Zegelaar,S. Gong,H.B. Pacejka: Tyre Models for the Study of In-Plane Dynamics,
Vehicle System Dynamics, 23-S1,578/590(1994)
[5] Braghin, F., & Sabbioni, E. (April - June 2010). A dynamic Tire Model for ABS Maneuver
Simulatoins. Tire Society and Technology, TSCTCA, Vol. 30, No. 2, pp. 137-154.
[6] J.P. Pauwelussen, L. G.-U. (2003). Full vehicle ABS braking using the SWIFT rigid ring
tyre model. Control Engineering Practice, 199-207.
[7] Rangelov, K. Z. (2004). SIMULINK Model of a Quarter-Vehicle with an Anti-lock Braking
System. ISBN: 90-444-0377-X: Eindhoven University of Technology.
[8] Canudas-De-Wit, C., Tsiotras, P., Velenis, E., & Sorine, M. (2003). Dynamics Tire Friction
Models for Combined Longitudinal and Lateral Vehicle Motion. Vehicle System Dynamics.
[9] Canudas-De-Wit, C., Tsiotras, P., Velenis, E., Basset, M., & Gissinger, G. (2002).
Dynamic Friction Models for Road/Tire Longitudinal Interaction. Vehicle System Dynamics.
[10] Astrom, Karl Johan, Canudas-de-Wit, Carlos, (2008), ‘Revisiting the LuGre Friction
Model’, IEEE Control Systems Magazine, December 2008
[11] Clover, C., & Bernard, J. (1998). Longitudinal Tire Dynamics. Vehicle System Dynamics,
231-259.
[12] Liang, W., Medanic, J., & Ruhl, R. (2008). Analytical dynamics tire model. Vehicle System
Dynamics, 46: 3, 197-227.
[13] Wu, M.-c., & Shih, M.-c. (2003). Simulated and experimental study of hydraulic anti-lock
braking system using sliding-mode PWM control. Mechatronics 13, 331-351.
[14] Bosch, R. (2007). Bosch Automotive Handbook (7th ed.). SAE.
[15] Day, T. D., & Roberts, S. G. (2002). A Simulation Model for Vehicle Braking Systems
Fitted with ABS. SAE Technical Paper Series, SAE 2002-01-0559.
[16] Deur, Josko , Ivanovic, Vladimir , Pavkovic, Danijel , Hrovat, Davor , Asgari, Jahan ,
Troulis, Markos and Miano, Carlo(2005) 'Experimental analysis and modeling of
longitudinal tyre friction dynamics for abrupt transients', Vehicle System Dynamics, 43: S1,
525 — 539
[17] Hiller, Martin (2006), ‘Correlation between Parameters of the Tribosystem and Automotive
Disk Brake Squeal’, Dissertation, Universität Paderborn, Doc. No. 20.12.2006
[18] Palm, W. J. (2005). System Dynamics. New York: McGraw-Hill.
[19] Gert Heinrich, M. K. (2008). Rubber friction, tread deformation and tire traction. Wear
265, 1052-1060.
[20] Steur, E. (2004). Study on improvement of ABS performance using additional sensor
information. DCT Report no: 2004.77: Eindhoven University of Technology.
[21] Michelin. (12/16/2010). GST/C/MTD Test (Auto Test No. 7294).

18
List of Tables
Table 1: Various Tire Parameters
List of Figure Captions
Figure 1: Hub/Tire Model
Figure 2: Schematic for the LuGre Friction Model
Figure 3: Schematic of Brake Hydraulics
Figure 4: Open-Loop Response with Torsional Dynamics
Figure 5: Bosch Wheel-Acceleration Based ABS Algorithm
Figure 6: Step-Response of Unfiltered & Filtered Tangential Accelerations for Open-Loop
Hub/Tire Model
Figure 7: Cutoff Filter Frequency Sensitivity Study for Tire 1 Parameters
Figure 8: Cutoff Filter Frequency Sensitivity Study for Tire 2 Parameters
Figure 9: Kt/Ct Sensitivity Study for Tire 2 Parameters
Figure 10: Jr/Jw Sensitivity Study for Tire 2 -- Tuned for Filter Cutoff Frequency = 30Hz
Figure 11: Jr/Jw Sensitivity Study for Tire 2 -- Tuned for Filter Cutoff Frequency = 35Hz


![Anti Lock Braking System[1]](https://img.dokumen.tips/doc/110x75/577c859c1a28abe054bde223/anti-lock-braking-system1.jpg)