Embed Size (px)
Citation preview

Interaction of adsorbates with clean and metal-covered oxide surfaces: Vibrational spectroscopic studies
Dissertation
by
Hengshan Qiu
Department of Physical Chemistry I, Ruhr-University Bochum,
Bochum, Germany
July 2009

The work of in this dissertation was performed in Physical Chemistry I, Ruhr-Univeristy Bochum from October 2005 to May 2009 under the supervision of Prof. Christof Wöll and Dr. Yuemin Wang.
Referees: Prof. Christof Wöll Prof. Martin Muhler Date of defense:
i

Preface:
When I was a child I had a dream—to be a scientist like Albert Einstein and Niels
Bohr, although it seems naive and impossible in today's research framework. Time
elapses unconsciously, however I go far away from my dream more and more. But I
don't want to give up although I have become old.
During the last three and half years I encountered many difficulties in my work.
Especially, when I reached the end of my PhD study, I found it's very difficult to make
clear even a very tiny problem. I can even imagine I was driving a small boat in the
boundless sea of knowledge.
Yes, I have finished my PhD work and got many results. But I don't want to write this
thesis like a result show, although, perhaps, no one would care about it except for
publications. After finishing this thesis, I just hope it is worth of reading and can help
its readers, if possible, to some extent, at least help them to think about the underlying
problems in this thesis.
Thanks to my forthcoming daughter, she drove me to improve myself and write this
thesis as soon as possible.
25.05.2009, Bochum
ii

This thesis is partially based on following publications:
Chapter 3. Adsorption and Reactions on ZnO(1010)
[P1] Y. Wang, R. Kovacik, B. Meyer, K. Kotsis, D. Stodt, V. Staemmler, H. Qiu, F.
Traeger, D. Langenberg, M. Muhler, and C. Wöll, Angew. Chem. Int. Ed. 46, 5624
(2007).
[P2] Y. Wang, X. Xia, A. Urban, H. Qiu, J. Strunk, B. Meyer, M. Muhler, and C. Wöll,
Angew. Chem. Int. Ed. 46, 7315 (2007).
Chapter 4. Adsorption on TiO2(110) surface
[P3] X.-L. Yin, M. Calatayud, H. Qiu, Y. Wang, A. Birkner, C. Minot, and C. Wöll,
Chem. Phys. Chem. 9, 253 (2008).
[P4] H. Qiu, H. Idriss, Y. Wang, and C. Wöll, J. Phys. Chem. C 112, 9828 (2008).
Chapter 5. Adsorption on ZnO(0001) surface
[P5] H. Qiu, B. Meyer, Y. Wang, and C. Wöll, Phys. Rev. Lett. 101, 236401 (2008).
Other publications:
[P6] H. Noei, H. Qiu, Y. Wang, E. Löffler, and C. Wöll, Phys. Chem. Chem. Phys. 10,
7092 (2008).
[P7] M. Kunat, F. Traeger, D. Silber, H. Qiu, Y. Wang, A. C. v. Veen, C. Wöll, P. M.
Kowalski, B. Meyer, C. Hättig, and D. Marx, J. Chem. Phys. 130, 144703 (2009).
iii

1. Introduction..................................................................................................................3
1.1 General remarks ......................................................................................................................3
1.2 What can we do in surface science studies?............................................................................4
1.3 From metals to metal oxides ...................................................................................................6
1.4 This thesis ...............................................................................................................................9
2. Experiment..................................................................................................................11
2.1 Experimental setup................................................................................................................11
2.2 High resolution electron energy loss spectroscopy (HREELS) ............................................13
2.3 Thermal desorption spectroscopy (TDS) ..............................................................................16
Shape analysis .........................................................................................................................17
Quantitative analysis ...............................................................................................................18
2.4 Low energy electron diffraction (LEED) ..............................................................................21
3. Small molecular adsorbates on ZnO(1010).............................23
3.1 CO2 adsorption on the ZnO(1010) surface ...........................................................................23
3.2 Co-adsorption of CO and CO2 on ZnO(1010) surface .........................................................33
3.3 H2O adsorption on the ZnO(1010) surface...........................................................................37
4. Small molecular adsorbates on TiO2(110).................................44
4.1 CH2O adsorption on the TiO2(110) surface...........................................................................45
CH2O Adsorption on the Perfect TiO2(110) Surface. ..............................................................47
CH2O Aadsorption on Defective TiO2(110) Surfaces. ............................................................52
4.2 H adsorption on the TiO2(110) surface..................................................................................60
5. Small molecular adsorbates on ZnO(0001) .............................69
1

5.1 The structure of the ZnO(0001) surface ...............................................................................69
5.2 Hydrogen adsorption on the ZnO(0001) surface ..................................................................75
5.3 HCOOH adsorption on the ZnO(0001) surface....................................................................83
5.4 CO2 adsorption on the ZnO(0001) surface ...........................................................................93
6. Cu deposition on ZnO(0001)................................................................100
6.1 Structure of Cu clusters on the ZnO(0001) surface ............................................................100
6.2 The chemical state of Cu on ZnO(0001) surface................................................................103
6.3 Diffusion of Cu into ZnO(0001) bulk.................................................................................105
7. Summary and outlook...................................................................................110
7.1 Summary .............................................................................................................................110
7.2 Outlook ...............................................................................................................................113
Appendix 1: Discussion on the effect of Titanium sublimation pump (TSP) on CO2
adsorption experiments............................................................................................................114
Appendix 2 Illustrations and symbols of different vibrational modes...........................118
Appendix 3: Fourier deconvolution process of HREEL spectra.....................................119
Appendix 4: Shape analysis of TD spectra—some examples .........................................124
Appendix 5: Discussion on the expression of density of electrons in conduction band
for doped semiconductor .........................................................................................................127
Bibligraphy.................................................................................................................................129
Acknowledgements ..................................................................................................................143
Curriculum Vitae.......................................................................................................................144
2

1. Introduction
1.1 General remarks
The term catalyst was first introduced by Berzelius in 1835 referring to certain
substances that accelerate a chemical reaction without being consumed during the
reaction [1, 2]. Since then, catalysts have dramatically changed our daily life.
However, until the 1960s, most work on finding catalyst was more empirical, i.e.
experience-based [2]. A more straightforward or more scientific way was developed
by surface science studies after the emergence of high-vacuum and electronic
spectroscopic techniques. Understanding of catalytic processes on elemental level has
become the heartland for exploring a new catalyst in the last several decades [1-7].
Along with the development of more complex catalytic processes, the presence of
unexpected but inevitable side-products causes more and more problems. As a result,
besides the original “catalytic” performance, the selectivity has become the other
criterion for evaluating new catalysts [4, 8].
Although a certain reaction can be thermodynamically favorable from an energy point
of view (ΔG < 0), the reaction rate is still a key point for a real industrial reaction. For
instance, the reaction:
)()(3)( 32 lOHCHgHgCO →+ ΔH = -128.5 kJ/mol and ΔG = -29.5 kJ/mol at T =
298 K
is thermodynamically favorable close to room temperature [9], but high reaction
temperature and high pressure were still adopted in real processes to achieve
relatively high reaction rates and reaction yields. Given enough time, any reaction
(along with side reactions) will finally reach equilibrium with the distribution of all
products depending on the change of ΔG in possible reaction pathways by an
exponential relationship [10-12]. The largest fraction consequently comes from the
lowest energy-containing product.
The reaction rate, based on the transition state theory (TST) [11, 12], is essentially
related with kinetic barriers (or reaction barriers) and reaction temperature. To
3

increase reaction rate, one needs to increase the reaction temperature or decrease
reaction barriers [5]. From an economical point of view, to decrease the reaction
barrier would be a more feasible way since the increasing of temperature is a much
energy-costly approach. The reaction barrier varies according to reaction pathways in
which different intermediates could be presented. This fact provides chemists the
possibility to find a catalyst that would guide the reaction along a different pathway
with a smaller reaction barrier. From this aspect, the study of selectivity, in nature, is
also a case of changing reaction barriers, but increasing the barrier for side reactions
compared to the desired reactions [4]. In other words, catalyst changes the product
distribution in addition to accelerating reaction rate. Additionally, the study of
elevating reaction rates is often accompanied by the aim to avoid extreme reaction
conditions (high temperature, high pressure etc.), which would be the same concept
from an energy point of view.
Nowadays, most industrial catalytic processes are based on heterogeneous catalysis
typically involving solid catalysts and gaseous or liquid reactants [2]. Heterogeneous
catalytic processes may include four elementary steps [1]: (a) adsorption, (b) diffusion,
(c) molecular rearrangement at active sites, (d) desorption. Herein, a good catalyst is
considered to form intermediates with reactants not too strongly but also not too
weakly bound. Too strong bonding leads to either a long residence time of the
intermediate resulting in the decrease of reaction rate, or the blockage of the active
sites resulting in the deactivation of the catalyst. Too weak bonding tends to cause
desorption prior to the desired molecular rearrangement.
1.2 What can we do in surface science studies?
“Surface science” has been one of the most active research fields in the past years.
This is partially due to the unique structural and electronic properties of surfaces after
breaking the periodicity of bulk materials, and partially due to the development of
vacuum techniques and surface analytic methods. One should also recall the fact that
the most relevant existing catalytic processes, i.e. those heterogeneous ones with solid
catalysts, take place at surfaces. In addition, besides the traditional “surface study”,
4

brand new electronic, catalytic and optical properties of electrons behaving in a
confined dimension extend the surface study to a new perspective, including the study
of thin films, nano-particles dispersed on surfaces.
King gave a summary of the methodological questions in the surface science approach
to catalysis [13]:
(i) Where are the atoms comprising the surface? Why are they there? What
structural changes accompany the surface processes?
(ii) What are the bond energies involved? What is the nature of the surface
chemical bonds?
(iii) What factors control the bond making the breaking processes at surfaces?
(iv) How can these bond making and breaking processes be controlled?
In these questions, all the “what” and “where” questions can be answered by
experimentalists individually, and even solely by theorists to a certain extent. But the
“why” and “how” questions can only be answered through the combined efforts by
experimentalists, theorists and engineers.
To my understanding, the role of experimental surface science studies is two-fold:
interplay with the theory to understand the microscopic mechanisms of specific
catalytic processes and interplay with the real catalysis to improve the catalytic
efficiency. The theoretical and computational scientists build new theoretical models
or calculation methods to explain the existing catalytic phenomena and even to predict
the new catalysts with new properties. But, the fact that even the only-theory-based
calculation, namely, the ab intio calculation, still treats theory with approximations to
make the calculation feasible [14, 15], means that experimental results, especially on
well-defined surface, are potentially needed to get a reasonable theoretical model.
From this aspect, the experimental surface science is not the end of studying catalysis,
but the beginning. Generally, useful information derived from experimental surface
science study can be on the adsorption geometry, adsorption site, adsorbate species,
reaction barriers, reaction intermediates, binding energy, and surface structural and
electronic properties. On the other hand, surface science studies should help engineers
to understand reaction mechanisms and find the best way to improve catalytic
5

efficiency, including reaction yields, selectivity, depollution and avoiding of existing
extreme reaction conditions, etc. However, one should be aware that most of surface
studies are performed in ultra-high vacuum (UHV) conditions on well-defined single
crystal surface, which inevitably causes the so-called “pressure gap” and “material
gap” problematic between study conditions and catalytic application conditions [2,
16]. For the material gap, one must consider the existence of abundance of defects and
grain bundaries on powder in contrast to the well-defined structure on single cystal.
New model with extracting the structure-sensitive reaction could help to understand
the inconsistency obtained on powder and on single crystal samples. For the pressure
gap, the extrapolation from UHV to real catalytic condition is not always an effective
way to bridge the gap since some new pahses could arise when the pressure is
increased by more than ten orders of magnitude [17]. This is because in UHV
condition the reaction pathway with high barrier is not prefored although the product
might contain reltively low free energy. Indeed, much effort has been spent to bridge
these two gaps in the recent three decades, including the inherently efficient methods
operating at more realistic conditions [18-20], sum frequency generation (SFG) and
polarization-modulation infrared absorption spectroscopy (PM-IRAS), and the
specially designed UHV apparatus [20-23].
Two kinds of study viewpoints about surface bonding mechanism provide the
principal possibility to study adsorption on surfaces: (a) localized characters of the
chemical bond between surface and adsorbates. This provides experimentalists the
possibility to recognize adsorbed species using fingerprint techniques such as
vibrational spectroscopy and photoelectron spectroscopy etc. (b) de-localized electron
redistribution between surface and adsorbates. As a result, the study of surface
electronic structure (valence and core level) plays an important role to investigate
surface reactions. In fact, a comprehensive understanding would include both, just as
the real system behaves.
1.3 From metals to metal oxides
Since the emergence of the techniques of high vacuum apparatus and electronic
6
spectroscopy the surface science approach to catalysis has been extensively developed.
But most of the studies were carried out on metal substrates [1], whereas the
information on oxide surfaces is still scarce due to experimental difficulties. In
general, the difficulties include: (a) poor conductivity of oxides, which may lead to
charge accumulation on the surface and cause the measurement to become invalid or
deviate from the intrinsic value. (b) space charge regions. This is the consequence of
poor conductivity and surface states (including intrinsic due to the breaking of
periodicity and local molecular orbital and extrinsic due to the adsorbates or defects).
The existence of space charge regions in oxide can affect on the surface chemical
properties and makes the analysis more complicated. (c) poor quality of the surface
structure. The partial segregation and desorption of oxygen atoms during the
preparation process causes an imperfect stoichiometry of surface and near surface
atoms, and in turn an uncertainty in the surface structure. This is more severe for a
polar oxide surface in which the electrostatic instability can further result in a surface
reconstruction, vacancies or steps on the surface. (d) intense surface phonons are a
particular issue for vibrational spectroscopy as very strong surface phonons exhibit
overwhelming domination of measured spectra and in some cases convolute with the
vibrations of adsorbates to “create” new peaks in measured spectra.
Recently, studying oxides has become more active stimulated either by research
interest for the metal/support interactions or by their catalytic activities themselves. At
the same time, on the experimental side, researchers have adopted thin oxide films on
metal substrate to avoid charge effect [24-26]. And some other analytical methods,
such as molecular beam scattering (MB) [27, 28] and atomic force microscope (AFM)
[29, 30] studies, become active due to the inherent insensitivity to charge effect.
Oxygen vacancies on oxide surfaces have been proposed to be important in
dominating surface chemical properties. Studies of adsorption and reaction on
intrinsic or artificially created oxygen vacancies on oxide surfaces has become
blooming [31-33]. Even the self-organization of oxygen vacancies by electron
induction has been reported [34], which has significance for fundamental and
technical research. Besides, the presence of bulk interstitial defects can potentially
7

affect on the surface electronic and chemical properties [35, 36].
The study of metal nano-particles on oxide surfaces or metal diffusion into oxide bulk
with forming doping effect has also attracted many research interests. On one hand
metal nano-particles exhibit themselves excellent catalytic properties. Perhaps, this is
owing to the good balance of less-coordination and band (orbital) dispersion of metal
particles in the nanometer dimension. Too small metal particles have more
un-coordinated orbitals in per unit volume but more strict requirement for the reactant
orbitals due to the relatively monochromatic orbital energy level (horizontal line in
energy diagram). Too large metal particles have higher orbital energy dispersion [37],
but lower electron energy (lower position in energy diagram) and less uncoordinated
orbitals. On the other hand the interaction between metal particles and the oxide
support leads to a further change of electronic properties especially at the interface –
although in some cases the mechanism is not well understood yet.
The diffusion of metal into oxide bulk leads to the change of electronic and
photocatalytic properties, which has been one of the major focuses in semiconductor
industry and photocatalysis in recent years. But the doping effect on “traditional”
catalytic properties was rarely studied. This is understandable because the chemical
bond between adsorbates and solid surface was considered quite localized while the
ionized “donor” electrons are more delocalized. Indeed the delocalized electrons have
less influence on the bonding upon gas adsorption to a lesser extent since the electron
affinity of semiconductor (or insulator) is thought nearly independent of the position
of Fermi level. This means the incoming adsorbate needs to align its orbital energy in
a same value with respect to the oxide surface independent of the bulk doping [38, 39].
However, the doping can essentially change the electron distribution and consequently
charge transfer between the solid surface and adsorbates if the adsorbate orbital is
considered as a part of the solid. Although, in many cases, the Fermi level is pinned
by a surface state, one should still be aware that the pinning of the Fermi level is
always accompanied by the filling (or unfilling) of electrons in surface states
including those created by adsorbates. In principle, the charge redistribution (or
charge transfer) between solid surface and adsorbates can lead to certain effects on the
8

chemical bonds formed between them.
Anyway, studying doping effect on the chemical properties of solid surface is a very
interesting topic and worth of research attentions.
1.4 This thesis
All of this work is performed in the context of the collaborative research center SFB
558 “Metal-substrate interactions in heterogeneous catalysis” of the German research
foundation (DFG). The case study is to understand microscopic reaction mechanism
of the methanol synthesis process. Methanol is synthesized from syn-gas (CO, CO2
and H2) on Cu/ZnO/Al2O3 catalyst [40]. Several possible intermediates were observed
or predicted in this reaction, such as formyl, formate, formaldehyde, formic acid and
methoxy etc. [41-44]. The influence of H2O on this reaction should also be taken into
account since the real reaction is carried out under high-pressure conditions and the
presence of H2O is inevitable. In this thesis, the adsorption of syn-gas (CO, CO2 and
H2), possible intermediates (HCOOH, CH2O) as well as H2O was studied on ZnO
surface, including the non-polar ZnO(1010) and the polar O-ZnO(0001) surface. Gas
adsorption on TiO2(110) and on Cu deposited O-ZnO(0001) were also carried out and
thus also presented in this thesis.
This thesis is organized as follows:
In chapter 2, the experimental setup (HREELS system) and methods (HREELS, TDS
and LEED) are briefly reviewed.
In chapter 3, adsorption of CO2, coadsorption of CO2 and CO, and the H2O adsorption
on ZnO(1010) are investigated.
In chapter 4, the behavior of CH2O and hydrogen adsorbed on TiO2(110) is presented.
In chapter 5, the stability of ZnO(0001) is discussed and the adsorption of hydrogen,
HCOOH and CO2 on the surface are investigated.
9

In chapter 6, the structure, chemical state and diffusion to ZnO bulk of Cu clusters
deposited on ZnO(0001) are presented.
In chapter 7, a summary of each previous chapter and outlook for future work are
provided.
10
2. Experiment
In this chapter I present a brief introduction to the experimental setup and analytic
methods used in this work. For the detailed operation of the setup one would fall back
on the operation manual. In the analytic methods section, I will also discard a detailed
discussion on principle, but focus more on some tips in terms of utility. The principal
details can be found in the mentioned references.
2.1 Experimental setup
PS of vacuum gauge
PS of pumps for gas line
PS of H source
HREELS chamber
PS of step motor
PS of sputtering
PS of TSP
PS of step motor
PID for sample heating
PS of step motor
PS of Ion gauge
Preparation chamber
TSP
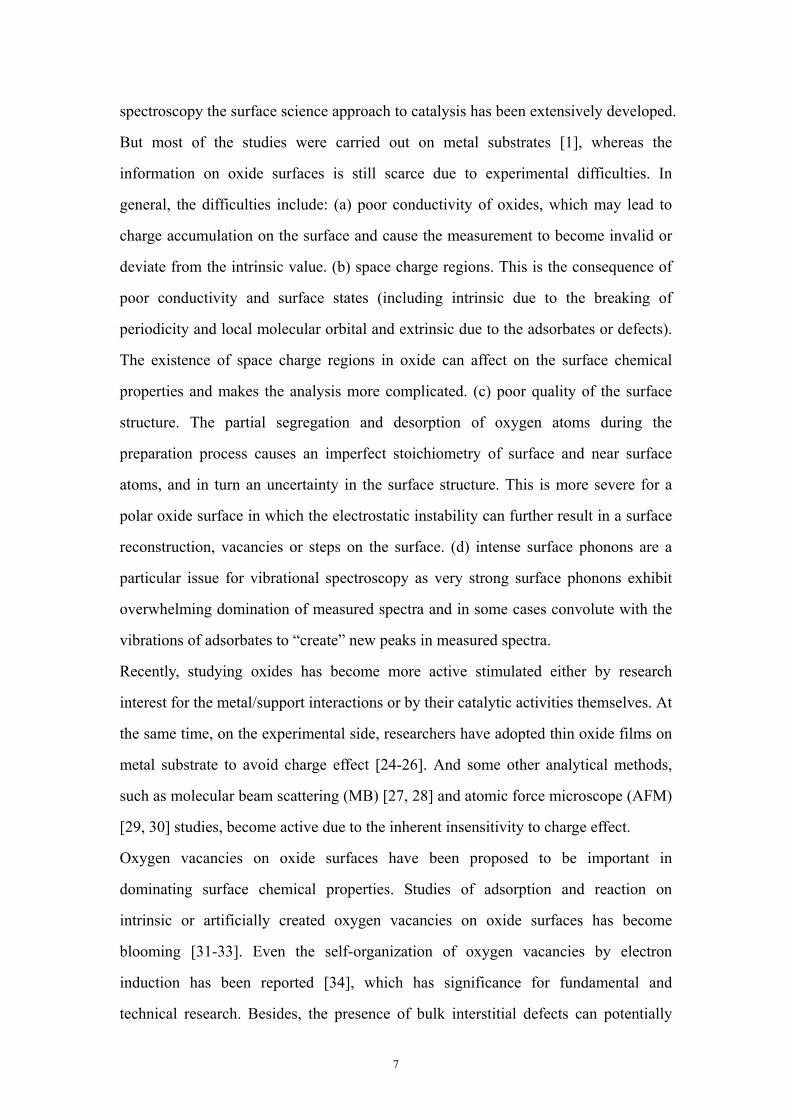
Fig. 2.1 HREELS system used in this work. "PS" denotes "power supply".
The work in this thesis was carried out in an ultra-high vacuum (UHV) system that
contains two chambers, as shown in Fig. 2.1. The upper chamber (also called
preparation chamber) is equipped with low energy electron diffraction (LEED) optics,
Argon ion sputter gun for cleaning sample surface, mass spectrometer (Pfeiffer,
Prisma) for thermal desorption spectroscopy (TDS) experiment, and metal evaporator
for deposition of metal films. The base vacuum in upper chamber is 5×10-11 mbar. The
mass spectrometer is placed in the preparation chamber and differentially pumped
with an ion getter pump. When carrying out TDS experiments, the sample surface is
moved to approach the orifice of a shroud of the mass spectrometer with a distance of
about 1 mm. The lower chamber (also called HREELS chamber) holds
11

high-resolution electron energy loss spectroscopy (HREELS) (Delta 0.5, SPECS,
Germany) with a straight-through resolution close to 1 meV. The incident angle of
electron beam is fixed at 55° with respect to the sample surface normal. The rotatable
analyzer can be positioned in either specular (reflective angle of 55°) or off-specular
geometry. The base vacuum in the lower chamber is 2×10-11 mbar. To maintain the
very good vacuum, a gate valve is installed between the two chambers and kept
closed during the preparation of samples.
The UHV chamber is pumped by a turbomolecular pump with large pumping speed
(300 l/s) and an oil-free forevavuum system consisting of a small turbomolecular
pump combined with a membrane pump. In the HREELS chamber, only an ion getter
pump is running routinely. In both chambers there is a titanium sublimation pump
(TSP) respectively. The TSP in preparation chamber runs more frequently depending
on the vacuum condition. But for some refined experiments by using CO2, the running
of TSP should be very careful (see the Appendix 1).
The single crystal sample (usually 2 mm × 5 mm × 7 mm) was mounted on a Ta plate
(thickness, 0.5 mm) by specifically designed thin Ta foils, with the thermocouple
contacting the sample on the lateral side. Note that mounting sample is a very
skill-based operation and special consideration should be paid on the contact between
thermocouple (K-type) and sample. A calibration process by a known TDS peak is
necessary for a new-mounted sample. The sample temperature can be changed from
90 K (cooled by liquid nitrogen) to 900 K (heated by resistance filament from the
backside of the Ta plate).
Dosing of gas is realized by backfilling the chamber through different leak valves that
connect the preparation chamber with gas bottles. For liquid sources like H2O,
HCOOH and CH3OH, a glass tube with a metal flange to connect with vacuum
system is used as container. Before dosing process, the liquid was cleaned by several
freezing-melting cycles. For a solid source like N-(hydroxymethyl)-benzamide
(decomposition temperature is 95 °C) to produce CH2O, before dosing a degassing
process is performed by overnight evacuation at an intermediate temperature (50-60
°C).
12

2.2 High resolution electron energy loss spectroscopy (HREELS)
As an electronic spectroscopy, HREELS has been proven to be one of the most
powerful techniques for studying adsorption and reactions on single crystalline metal
surfaces [45-48], electronic structures on semiconductor surfaces [49-51] and
Fuchs-Kliewer phonons on oxide surfaces [52-54]. Compared with another wide-used
vibrational spectroscopy, infrared (IR) spectroscopy, HREELS has a relative poor
energy resolution, but high detection sensitivity. Indeed, the energy resolution of 1 to
5 meV of common-used HREELS, although insufficient for the analysis of the
intrinsic vibrational line width [55], is good enough to identify adsorbed species and
chemical shifts in most cases.
For the analysis of both IR and HREELS spectra, two selection rules must be
considered [56, 57]: (a) Only the vibration with dynamic transition dipole moment is
IR-active. (b) On metal surfaces, the vibration with dynamic transition dipole moment
parallel to surface is IR-inactive. In fact, this is not the whole story, because HREELS
can avoid these two selection rules by the impact interaction mechanism, and in some
cases by employing negative ion resonances [58].
Several relevant interaction mechanisms are involved in the energy loss process:
(a) Dipole interaction
This is a long-range interaction between adsorbate dipole moment and electric field of
the electron, which results in a very
sharp peak close to specular
direction in the angle distribution
curve of electrons reflected from a
surface (see Fig. 2.2). Dipole
interaction is the most commonly
used mechanism in HREELS to get
the vibrational frequency of
-60 -40 -20 0 20 40 60
Impact interaction
Dipole interaction
Num
ber o
f ele
ctro
n (A
rb. U
nit)
X10
X1
Angle to specular direction (degree) Fig. 2.2 Schematic angle distributions of dipole and impact interactions in HREELS.
13

adsorbed species due to the high intensity and high signal to noise ratio. In this case,
the analyzer is positioned in specular geometry and both selection rules take effect.
(b) Impact interaction
This is a short-range interaction between adsorbate and incident electrons. The
comprehensive theoretical description is difficult, but we can understand it in a simple
way: imagine that electrons transfer energy to adsorbates during the impact process
just like the collision between two rigid balls, but in this case the transferred energy is
limited to excite the vibration of chemical bonds. As a result, both selection rules
don't work for the impact interaction mechanism. But the intensity from impact
interaction is very low (two to three orders of amplitude lower than that of dipole
interaction) and has a very broad angle distribution (see Fig. 2.2). The study in
off-specular geometry provides a feasible way to separate impact interaction from the
dipole interaction.
(c) Negative ion resonance
Although the dipole-inactive modes could be detected by off-specular measurements,
their extremely weak signals still bring out much experimental difficulty. Another
possible way to study the IR-inactive vibrations is negative ion resonance. For
example, in a HREELS measurement of an IR-inactive adsorbate, it's possible that
electrons are trapped by adsorbates for a short duration to form polar compounds in
which vibrations are temporarily IR-active. However, unfortunately, negative ion
resonance is rarely observed and unpredictable. The most use is to observe the
physisorbed IR-inactive species.
(d) Plasmon excitation
This is a typical case especially for HREELS measurements on doped semiconductor
and metal surfaces where the surface plasmons can be detected. It has been reported
that the growth of metal particles deposited on oxide surfaces can be monitored by
plasmon excitations. For doped semiconductors, if the doping concentration is not so
high, a multi-scattering process can be remarkable. As a result, a broadening of the
elastic peak can be observed. A quantitative analysis of the peak broadening can
further enrich the study of doping process. In addition, the growth of thin films could
14

also be monitored by plasmon excitations [59, 60].
(e) Inter-band transition
In this case, HREELS is more addressed by the name of “EELS”. In the energy loss
processes, besides the just mentioned interaction mechanisms, another contribution
comes from the excitation of inter-band transitions. This allows us to study the
electronic structures of substrates or even surface states.The scanning range of the
energy loss is normally needed to extend to several electron volts (eV) and in this case
a high resolution is not so necessary. At the same time, a relative high primary energy
(several tens eV) should be adopted in order to compress the angle distribution of the
reflected electrons to specular direction. Note also that EELS in this case is slightly
different from that in transmission electron microscopy (TEM). In TEM, very high
incident electron energy is adopted and the core level excitation is inclined to be
concerned due to the relatively poor energy resolution.
0 100 200 300 400 500
X1
0.5 L C18O2 on ZnO(10-10) at 95 K
X40
Energy loss (meV)
Inte
nsity
(Arb
. Uni
t) Raw spectra
(a)
0 100 200 300 400 500
X1
Energy loss (meV)
Inte
nsity
(arb
. uni
ts)
Deconvoluted result
X 40
0.5 L C18O2 on ZnO(10-10) at 95 K
Carbonate
(b)
Fig. 2.3 (a) Raw HREEL spectra of 0.5 L CO2 adsorbed on ZnO(1010) at 95 K. (b) thecorresponding deconvoluted results.
Although HREELS has been successfully used to metal surfaces, it encountered
several problems when applied to oxide surfaces. In addition to the well-known
problems of charge effect and poor surface quality which exist in nearly all electronic
spectroscopy, a prominent problem in HREELS is the appearance of the intensive
surface phonons on oxide surfaces [52, 53], although the surface phonons are of
scientific interest in solid state physics studies [53]. Surface phonons of oxides
15

(including the multiple scattered phonons) dominate almost all interesting regions for
the vibrations of chemical bonds from several tens to several hundreds meV. Fig. 2.3
(a) shows the HREEL spectra recorded on 0.5 L C18O2 adsorbed on ZnO(1010) at 100
K. No any adsorbate-related loss feature can be observed except for the strong surface
phonons.
Most successful attempts to eliminate the effect of surface phonons include the
experimental method by growing oxide thin film on metal supports [25, 26], and the
numerical method by Fourier deconvolution process [61]. In this work, the latter one
was adopted.
Fourier deconvolution process is based on the fact that the multiple scattered phonons
can be expressed by a series of self-convolutions of the primary phonon. A numerical
method to remove the multiple scattered phonons is possible. As is shown in Fig. 2.3
(b), after the Fourier deconvolution process of the raw spectrum, the HREEL
spectrum clearly shows three loss peaks from the adsorbate. Detailed discussions
about Fourier deconvolution process can be found in references and Appendix 2. An
example for illustration and symbols of different vibrational modes can be found in
Appendix 3.
In practical HREELS studies, an isotope substitution experiment is usually helpful to
assign loss peaks, and the combination with TDS can provide more detailed
information of the surface adsorption process.
2.3 Thermal desorption spectroscopy (TDS)
TDS (usually be addressed on single crystals in vacuum condition) or temperature
programmed desorption (TPD, usually be addressed on powder samples in ordinary
pressure ambient) is one of the most important surface techniques for studying
adsorbed species [62-68].
In TDS experiment, sample is heated linearly (in some cases hyperbolic heating is
also adopted) to high temperature with the adsorbate molecules desorbing from the
sample surface. The desorbing molecules are then collected by a mass spectrometer.
16

Finally, a curve of desorbing rate with respect to the sample temperature is obtained.
The analysis of TDS results is based on the well-known Wigner-Polanyi equation:
⎟⎟⎠
⎞⎜⎝⎛ Δ−
⋅⋅=−=RT
EdtdR n
ndes exp)( θνθθ (2.1)
Rdes… desorption rate
θ… surface coverage
νn… pre-exponential factor
n… reaction order
ΔE… activation energy for desorption
When the sample is heated to high temperatures, the exponential term will increase
and will make Rdes larger, and at the same time adsorbates desorb from sample surface
and make Rdes smaller (θ becomes smaller). As a result, a TD spectrum always shows
mountain-like shape. In general, the analysis of TD spectra includes two branches:
quantitative analysis and shape analysis. In both cases, a series of TD spectra with
different initial coverages are necessary.
Note that the re-adsorption of the desorbing molecules is unlikely on single crystal
surfaces in UHV conditions and so is not considered in this work.
Shape analysis Shape analysis can help us to get an overall impression on the adsorption process,
such as the number of stable adsorbed phases, reaction order and the presence of
lateral interaction. Generally, in TD spectra, the different desorption peaks come from
different adsorbed phases each of which has a different binding energy. Further
analysis with different initial coverages would bring us a rough impression of the
reaction order. For example, with increasing coverages the zero-order desorption
(normally desorption of physisorbed species) shows a blue shift of desorption rate
maximum (Tmax), whereas the first order desorption shows a constant Tmax and an
asymmetric shape of the desorption spectra. The second order desorption exhibits a
red shift of Tmax and symmetric shape of the desorption spectra with increasing
coverages.
17
It is difficult to precisely determine the reaction orders just from the shape analysis,
because lateral interactions between adsobates are mostly present and lead to a
coverage-dependent activation energy, ΔE. The increased activation energy with
coverage results in a blue shift of the temperature for desorption rate maximum (Tmax),
and vice versa. In some cases (normally for the 2nd order reaction), the
coverage-dependent νn should also be considered. Some simulated examples for shape
analysis can be found in Appendix 4.
To identify reaction order from TDS results, in many cases, makes sense since
reactions don't always take place in the straightforward way as simple as we imagine,
i.e., directly from reactant to final product. The possible reaction pathway and
intermediates can change the reaction order and control the overall reaction. In other
words, the rate-limiting process dominates the overall reaction order and later the
observed TDS features. The analysis of reaction order can help us to understand the
desorption process. For example, a reaction order of 2 means that the rate-limiting
step during desorption is recombination, while a reaction order of 1/2 possibly
indicates diffusion and desorption process at step edges.
Quantitative analysis For the precise determination of reaction orders, further confirmation from
quantitative analysis is needed. In addition, quantitative analysis of TD spectra can
provide the information of one of the most important parameters, activation energy
for desorption, ΔE. This value is frequently used as the binding energy since in most
cases the adsorption process is non-active or the activation energy of adsorption is so
small compared with the binding energy that the former can be reasonably neglected.
The quantitative analysis is essentially based on the Wigner-Polanyi equation. In fact,
the methods for quantitative analysis are various since it is more like a data fitting
process. One can use linear heating or hyperbolic heating for TDS experiments and
pick up the Tmax or full width at half maximum (FWHM), or even full width at 3/4
maximum as the experimental data to fit the desired parameters [63, 64]. The most
simple and widely used method is to use linear heating and fit the parameters by using
18

Tmax and corresponding initial coverages. In this work, linear heating is adopted,
tTT ⋅+= β0 , where β denotes heating rate.
First let us assume that the differential pumping rate is constant and high enough, and
that the ion current in the mass spectrometer is proportional to the desorption rate for
each specific desorbed species. Thus, the temperature for desorption rate maximum,
Tmax, can be deduced by letting the deviation of desorption rate equal zero (note that
in TDS experiment we plot the desorption rate with respect to temperature):
0)()(2
2
=⋅−=⋅−=dtd
dtdR
dTdR desdes θβθβθ (2.2)
one can get the expression:
⎜⎜⎝
⎛⎟⎟⎠
⎞Δ−⋅⋅⋅⋅=
Δ −
max
12
max
exp1RT
EnRT
E nn θν
β (2.3)
For n=1, expression (2.3) yields:
⎜⎜⎝
⎛⎟⎟⎠
⎞Δ−⋅⋅=
Δ
max12
max
exp1RT
ERT
E νβ
(2.4)
an analytic solution for ΔE is difficult, but a numerical solution, e.g. by Newton's
iteration, is available. Furthermore, a simple approximate solution can be obtained by
reasonably assuming the value of ν1/β located in the range of 108 K-1 to 1013 K-1 range,
where relationship between ΔE and shows a good linearity. The expression (2.4)
becomes:
maxT
⎢⎣
⎡⎥⎦
⎤−⋅=Δ 64.3)ln( 1
max βνRTE
this is the famous Redhead-formula [62], and the approximation would essentially
bring out around 1.5% relative deviation.
For detailed analysis, let's change the form of expression (2.4)
⎜⎜⎝
⎛⎜⎜⎝
⎛⎟⎟⎠
⎞Δ+
Δ=⎟⎟
⎠
⎞RE
RTET
1max
2max lnln
νβ (2.5)
For a specific initial coverage, by varying heating rate, a series of different Tmax
19
values will be observed in TD spectra. When plotting ⎜⎜⎝
⎛⎟⎟⎠
⎞β
2maxln T with respect to
max
1T
,
one would get a straight line. From the slope of straight line, ΔE can be obtained, and
from the intercept on y-axis one can get the information of ν1. If a totally different
shape of curve is obtained, one should consider the possibility of other order
desorption process.
For n=2, expression (2.3) yields:
⎜⎜⎝
⎛⎟⎟⎠
⎞Δ−⋅⋅⋅=
Δ
max22
max
exp2RT
ERT
E θνβ
(2.6)
Again, numerical methods can be applied to get ΔE from Tmax if we know the initial
coverage θini, ν2 and β. For detailed information of ν2, one can also use the analysis
method used in expression (2.5) by varying heating rate.
⎜⎜⎝
⎛⎜⎜⎝
⎛⎟⎟⎠
⎞Δ+
Δ=⎟⎟
⎠
⎞
2max
2max
2lnln
νβ RE
RTET (2.7)
When plotting ⎜⎜⎝
⎛⎟⎟⎠
⎞β
2maxln T with respect to
max
1T
, ΔE can be obtained from the slope of
the straight line, while from the intercept on y-axis one can get the information of ν2.
Here, one potential problem is that for a reasonable accuracy the heating rate should
be varied by at least two orders in magnitude. This is difficult, especially for oxide
samples. For second order desorption, one can also use the similar method, but vary
the initial coverage with keeping a constant heating rate. But determining the initial
coverage is usually difficult since the maximum coverage of chemisorption is not
always one monolayer.
For n=0, from expression (2.3) we will see that the right side becomes zero. As a
result, the ΔE should be zero to keep the equation valid. This is of course not right
since the activation of zero would mean that desorption process can occur at any
temperatures and consequently no adsorption can be formed. This inconsistency
results from the fact that the desorption rate of zero order desorption is
20

coverage-independent as implied in expression (2.1), and it will increase continuously
until the completion of desorption process. After reaching the maximum of desorption
rate, there will be a sharp drop in the desorption rate (a discontinuity in mathematics).
The deduction of Tmax by expression (2.2) would be invalid. Other analysis method
should be introduced for zero order desorption.
Let's come back to the Wigner-Polanyi equation again, for zero order desorption, the
Wigner-Polanyi equation becomes:
⎜⎜⎝
⎛⎟⎠⎞Δ
−⋅=−RT
Edtd exp0νθ (2.8)
Recall that the ion current Iion recorded by mass spectrometer is proportional to the
desorption rate, then we can change the form of expression (2.8) to:
⎜⎜⎝
⎛⎟⎠⎞Δ
−⋅⋅=RT
EkIion exp0ν (2.9)
where k is a constant.
An analytically straightforward form of expression (2.9) is:
)ln()ln( 0ν⋅+Δ
−= kRT
EIion (2.10)
When plotting )( ionIln with respect to T1 one can get the information about ΔE
from the slope of the straight line.
2.4 Low energy electron diffraction (LEED)
LEED is one of the most widely used and powerful surface analytic techniques in
early surface science studies [69, 70]. The electron energies used in LEED are
generally located at 30~300 eV. This is due to the following two reasons. First, the
mean free path of electron in solid shows very small value in this energy region,
which makes LEED very surface sensitive. Second, in this energy region the
wavelength of electron is comparable to lattice constant of solid, which makes LEED
suitable for studying solid surface.
In LEED experiment, an energy-tunable electron beam bombards on sample surface
(in most cases perpendicular to the surface) and is reflected by the sample surface.
21

After filtering inelastically scattered electrons by applying a retarding potential, only
elastically scattered electrons are recorded by a fluorescent screen. The elastically
scattered electrons form diffraction pattern on the fluorescent screen, which is
considered as the reciprocal structure and reflects the periodicity of the sample
surface.
LEED is usually used in two ways to study surface structure: LEED pattern and
LEED IV-curves analysis. From LEED pattern one can check the surface quality and
periodicity. Surface reconstruction or superstructure formed by adsorbates can also be
well studied by LEED patterns. Note that from LEED pattern we can only get the
information about surface periodicity, and no any local structure including position
and orientation can be deduced from this method. The local structure information of
surface can be obtained from LEED IV-curves in which the multi-scattering process
of electrons is considered. However, the explanation of LEED IV-curves is a
complicated process since prediction and test processes are involved. In this work, the
structures of different oxide surfaces are checked only by recording LEED patterns.
22

3. Small molecular adsorbates on ZnO(1010)
As one of non-polar ZnO surfaces, the ZnO(1010) was found to be the dominant
exposed face in ZnO powders, as demonstrated by x-ray diffraction (XRD) and
transmission electron microscopy (TEM) studies [71]. Its well-defined and stable
surface structure brings various advantages for experimental procedures including
preparation, characterization and analysis [72]. Furthermore, it also provides an ideal
structure model for theoretical works to explore the mechanisms of adsorption and
reactions on this surface. In this chapter, I present the HREELS, TDS and LEED
results of CO2 adsorption, co-adsorption of CO and CO2, as well as H2O adsorption
on the ZnO(1010) surface.
Fig. 3.1 Stick-and-ball model of the non-polar ZnO(1010) surface.
Fig. 3.1 shows the stick-and-ball model of non-polar ZnO(1010) surface. It consists of
rows of slightly tilted Zn-O dimers that are formed by threefold coordinated Zn and O
atoms. The Zn-O distance along [0001] direction is 5.21 Å and the O-O or Zn-Zn
distance along [11 2 0] direction is 3.25 Å [73]. It was claimed that, on this surface,
the Zn-O dimer vacancies are more favorable compared to single vacancies [74].
3.1 CO2 adsorption on the ZnO(1010) surface
The interaction of CO2 with the non-polar ZnO(1010) surface at 95 K was studied by
HREELS, TDS and LEED. It was found that an unusual tridentate carbonate species
is formed via the strong interaction of CO2 with Zn-O dimers on the stoichiometric
23

surface. Several ordered adsorption phases were identified. These stable phases with
different binding energies were attributed to the consequence of charge transfer
between substrate and adsorbates.
In previous work, the study of activation of CO2 was limited to just few special topics
due to the low energy content and high kinetic barrier in many CO2-containing
reaction pathways [9, 75]. In heterogeneous catalysis, the interaction of CO2 with
ZnO or Cu/ZnO has attracted much research interest in the recent two decades
stimulated by the synthesis of methanol from syngas (CO/CO2/H2), where CO2 was
considered as one of the carbon sources [44, 76]. The study of CO2 activation was
mainly carried out on metal surfaces, especially on some alkali modified metal
surfaces [77-79]. On oxide surfaces, however, the study was scarcely performed
[80-82]. This deficit is due to the well-known electric conductivity problem on single
crystalline oxide surfaces and partially due to the complexity of oxide surface
structures compared to metal. Additionally, HREELS study on oxide crystalline
surfaces encounters one more difficulty resulting from the very strong surface
phonons (Fuchs-Kliewer phonons) [53, 83]. Growing oxide thin films on bulk metal
supports has been applied by some groups to avoid the surface phonons and charge
effect [25, 26]. However, the potential deviation in chemical properties of metal
supported oxide film is still under debates [25].
Fig. 3.2 Structure model of (2×1) tridentate carbonate species on ZnO(1010) surface.
In one previous work, the adsorption of CO2 on ZnO(1010) surface was investigated
to lead to a strong interaction with the substrate forming (1×1) and (2×1) stable
24
tridentate carbonate species [84]. In both phases, CO2 bonds to the surface through C
to surface oxygen and two up bended oxygen atoms bond to the surface Zn along
[0001] direction. The (2×1) superstructure is formed along [11 2 0] direction with
every two Zn-O pairs covered by one carbonate species, as shown in Fig. 3.2. In a
further combined helium atom scattering (HAS) and theoretical study [85], a 2.3-fold
periodicity of carbonate along [11 2 0] direction was observed and assigned to the
coexistence of (2×1) and (3×1) periodic phases.
100 200 300 400 500 600
125 K
200 K
325 K
5.02.01.0
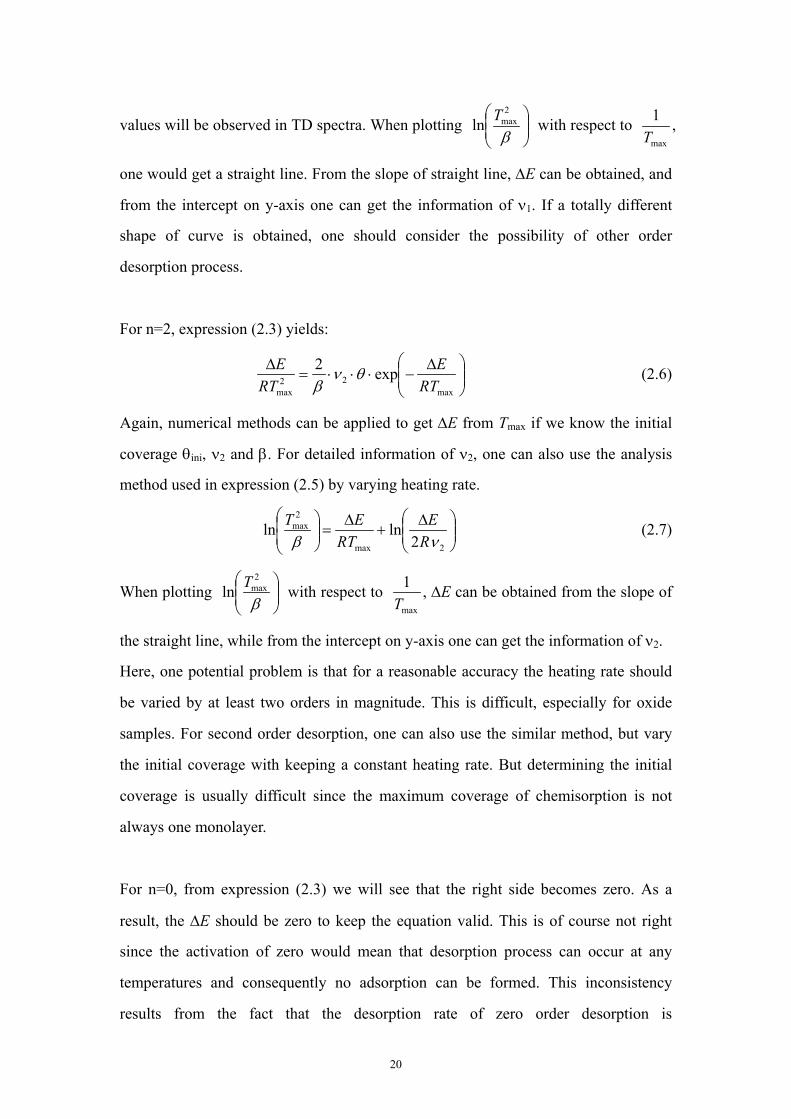
Fig. 3.3 presents the TDS results of various amount of CO2 adsorbed on ZnO(1010) at
95 K. For a low CO2 exposure (0.2 L and 0.5 L), only one desorption peak is found at
325 K. With increasing the CO2 exposure to higher amounts, the peak at 325 K
reaches saturation and four new peaks arise subsequently in the low temperature
region at 297, 240, 200 and 125 K. The 125 K peak has been assigned to the
physisorbed CO2 by HREELS study and DFT calculation [84, 85]. For each other
desorption peaks at 200 K, 240 K, 297 K and 325 K, the peak position has no shift
corresponding to different initial coverage, indicating a negligible lateral interaction,
although CO2 in gas phase always show strong intermolecular interaction due to the
relative large quadrupole moment of CO2 molecule [9]. Assuming a pre-exponential
factor of 1013 s-1 for first order desorption of CO2 adsorbed on ZnO(1010), the
0.50.2
Temperature (K)
x L CO2 at 95K
Inte
nsity
(Arb
. Uni
t)
240 K
297 K
Fig. 3.3 TD spectra of various exposures of CO2 adsorbed on the ZnO(1010) surface at 95 K.The heating rate was 1.5 K/s.
25

100 200 300 400 500 600 700
0.3 μA · min1.0 μA · min6.0 μA · min
Inte
nsity
(Arb
. Uni
t)
Temperature (K) Fig. 3.4 TD spectra of 5 L CO2 adsorbed on different sputtered ZnO(1010) surfaces at 95 K. The energy of Ar+ ion was fixed at 1.0 keV. Different sputter intensities were achievedby fixing the sputtering time for one minute with varying the pressure of backfilled Ar.
binding energies of the four adsorption states at 200, 240, 297 and 325 K correspond
to binding energy of 51.8, 62.6, 77.9 and 85.5 kJ/mol, respectively. The peaks at 200
K and 325 K are attributed to (1×1) and (2×1) chemisorbed tridentate phases and the
two weak peaks at 240 K and 297 K were tentatively explained as the adsorption of
CO2 at the defective sites in the previous work [84].
To identify the origin of 240 K and 297 K desorption peaks, CO2 adsorption was
performed on the defective ZnO(1010) surface, which is created artificially by Ar+
ion sputtering. Fig. 3.4 shows the TDS data obtained by exposing differently
Ar-ion-sputtered ZnO(1010) surfaces to 5 L CO2 at 95 K. A slight sputtering can
reduce the peak intensity to a large extent of the chemisorbed CO2 (the topmost curve
in Fig. 3.4). Note that, this information can be easily obtained by taking the amount of
physisorbed CO2 peak as reference. With increasing the sputtering intensity, the
desorption peak at around 200 K decreases its intensity to near zero, whereas the
desorption peak at around 325 K decreases its intensity very slowly and, at the same
time, becomes broad. The TDS results reveals that the peaks at 240 K and 297 K are
not attributed to the adsorption of CO2 at defective sites on ZnO(1010), since after Ar
ion sputtering the defective sites become abundant and the related desorption peaks
would increase their intensities. Therefore, these two desorption peaks should be
assigned to new stable phases of carbonate on the perfect part of ZnO(1010). The
26
100 200 300 400 500
288
198
163121
(b)
Energy Loss (meV)
Inte
nsity
(Arb
. Uni
t)X25
5 L C18O2 at 95 K
198163
166
201
104
X10
123
292
(a)E0=10 eV
Clean surface
5 L CO2 at 95 K
140 K
200 K
250 K
300 K
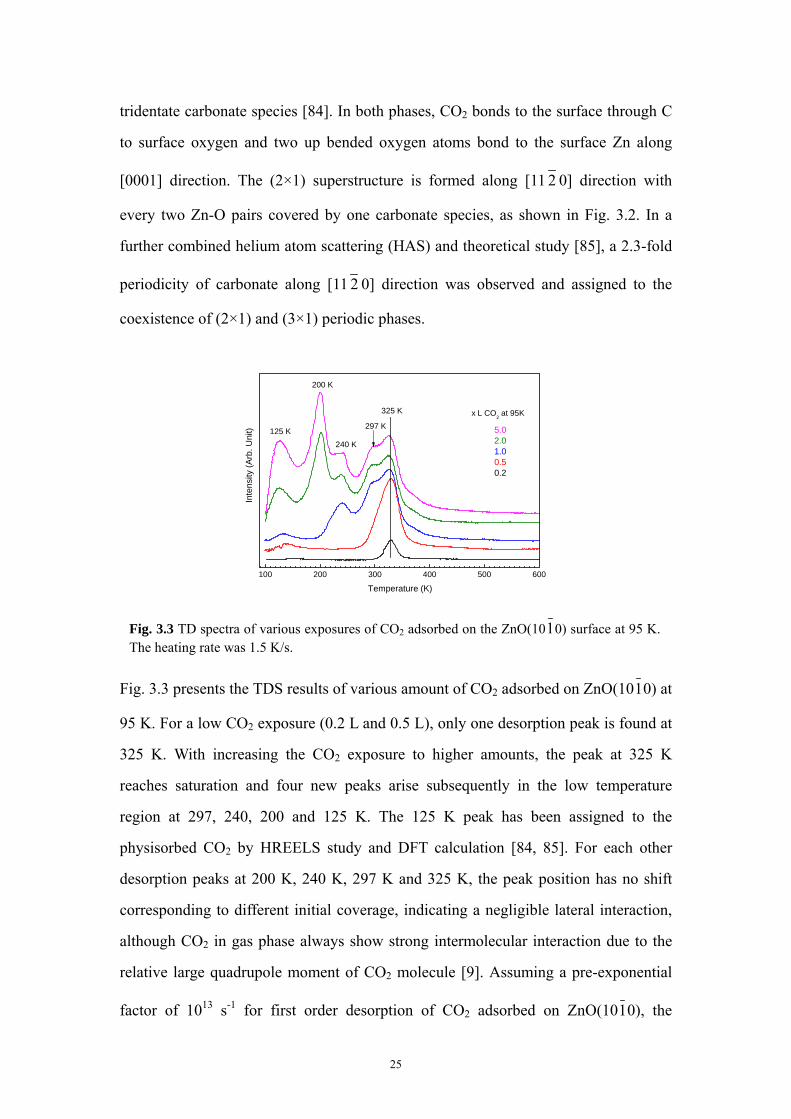
Fig. 3.5 (a) HREEL spectra of 5 L CO2 dosed ZnO(1010) at 95 K and further annealingthe sample to the indicated temperatures. The bottom curve shows the HREEL spectrumof the clean ZnO(10 1 0) surface. (b) HREEL spectrum of 5 L C18O2 adsorbedZnO(1010) surface at 95 K.
long tail at high temperature side can be explained by adsorption on defect sites such
as the (0001) step on which CO2 adsorption shows a very broad desorption peak up to
600 K [86]. The origin of these two peaks will be discussed in more detail in the
following subsection.
Fig. 3.5(a) shows a series of HREEL spectra obtained by adsorption of 5 L CO2 on
ZnO(1010) at 95 K and further annealing to various indicated temperatures. All the
spectra are given after Fourier deconvolution to remove the multiple Fuchs-Kliewer
phonons. The bottom curve in Fig. 3.5a shows the HREEL spectrum of clean surface
Table 3.1 Summary of the HREELS results and assignments of tridentate carbonate on ZnO(1010).
95 K 104 123 166 201 292
300 K 104 123 163 198 *
Assignments π(CO3) ν(CO) νs(OCO) νas(OCO)Physisorbed
CO2
*: no loss peak available
27

and no adsorbate-related losses are detected. Note that the loss feature at around 136
meV results from the residual overtone of the primary surface phonon due to the
imperfection of the deconvolution process [61]. All the loss energies and the
corresponding mode assignments were summarized in Table 3.1 [84]. Upon heating to
higher temperatures, no new peaks appear in the HREELS data (see Fig 3.5a),
indicating that the molecular species constituting the different phases must be
identical or at least very similar. Refined analysis of the HREEL spectra shows a
small red shift of the νs(OCO) and νas(OCO) modes at temperatures higher than 200
K, which is consistent with the calculated vibrational frequencies of low-coverage
tridentate carbonate on ZnO(1010) [84, 85]. The assignment of carbonate related
modes is further confirmed by isotope substitution experiments using C18O2. As
shown in Fig. 3.5(b), taken after exposing ZnO(1010) to 5 L C18O2 at 95 K, all the O-
related vibrations shift to lower frequency with a same isotope shift (due to the
isotope effect) ratio of 1.02 [58].
Fig. 3.6 exhibits the LEED patterns recorded after 5 L CO2 adsorption on ZnO(1010)
Fig. 3.6 LEED patterns on 5 L CO2 dosed ZnO(1010) surface at 95 K and subsequent
annealing to the indicated temperatures. All the patterns were recorded at 95 K.
28
surface at 95 K and after annealing to the indicated temperatures. All the LEED
patterns were recorded at 95 K and the electron energy was fixed at 72 eV. At 95 K,
the LEED pattern shows a sharp (1×1) structure, which is similar to the clean surface.
Annealing to 130 K to remove the physisorbed CO2 just slightly reduces the sharpness
of the diffraction spots, and no resolvable structure change is observed. After
annealing to 170 K, besides further reduction of the sharpness of the diffraction spots,
some blur spots arise between each row of the diffraction spots. After annealing to
220 K, a very clear (2×1) superstructure is observed along [11 2 0] direction. This
superstructure has been observed and attributed to the (2×1) tridentate carbonate
species in the previous work [84, 85]. Annealing to 270 K makes the (2×1) structure
obscure and a different superstructure seems to appear. Indeed, a similar complex
superstructure was also observed by HAS [85]. A 2.3-fold periodicity, caused by
combination of (2×1) and (3×1) superstructure, was obtained after dosing 0.7 L CO2
to ZnO(1010) surface above 270 K. After annealing to 300 K and 330 K,the LEED
patterns exhibit features like that on clean ZnO(1010) surface.
Overall, several stable superstructures of tridentate carbonate are formed (as
confirmed by LEED and TDS), whereas the geometry of adsorbates undergoes nearly
no change (as judged from HREELS) and no apparent lateral interaction is present
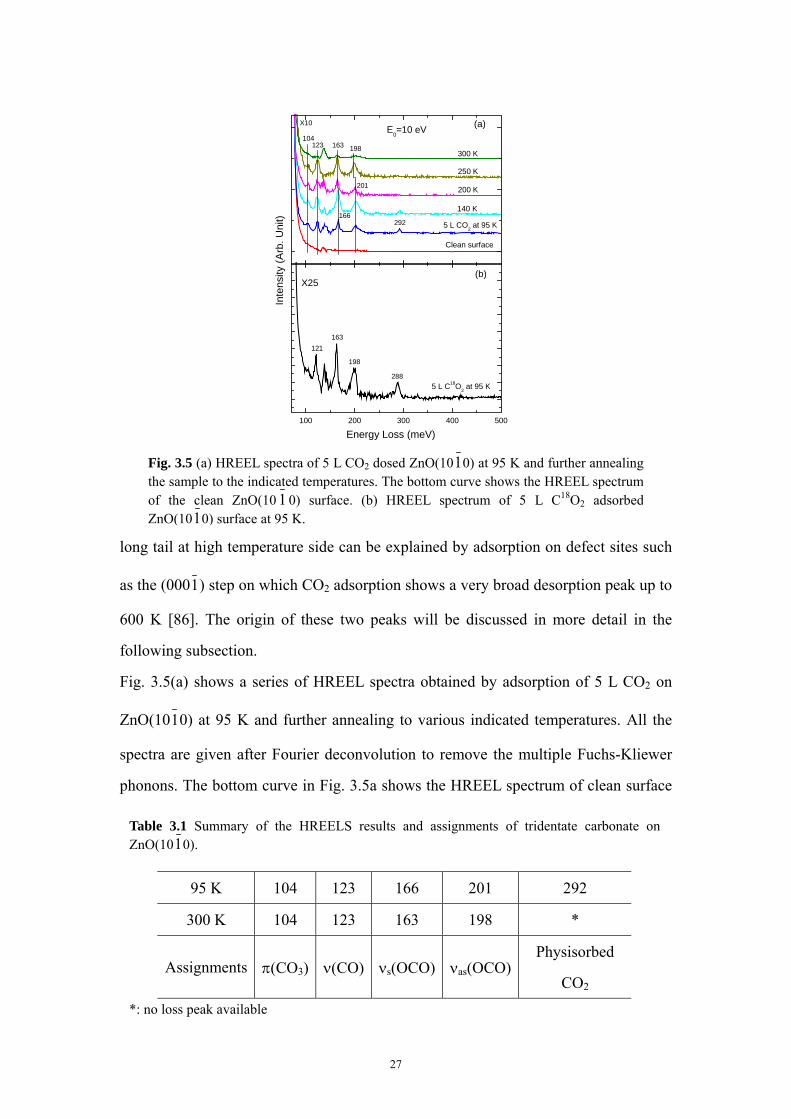
100 200 300 400 500 600
mass 48 (C18O2)
mass 46 (C16O18O)
Temperature (K)
Inte
nsity
(Arb
. Uni
t)
Mass 44 (C16O2)
Fig. 3.7 TD spectra of 5 L C18O2 adsorbed on the ZnO(1010) surface at 95 K. The heating rate was 1.5 K/s.
29
(from TDS). The existence of different stable phases of carbonate species can be
attributed to different amount of charge transfer between substrate and adsorbates.
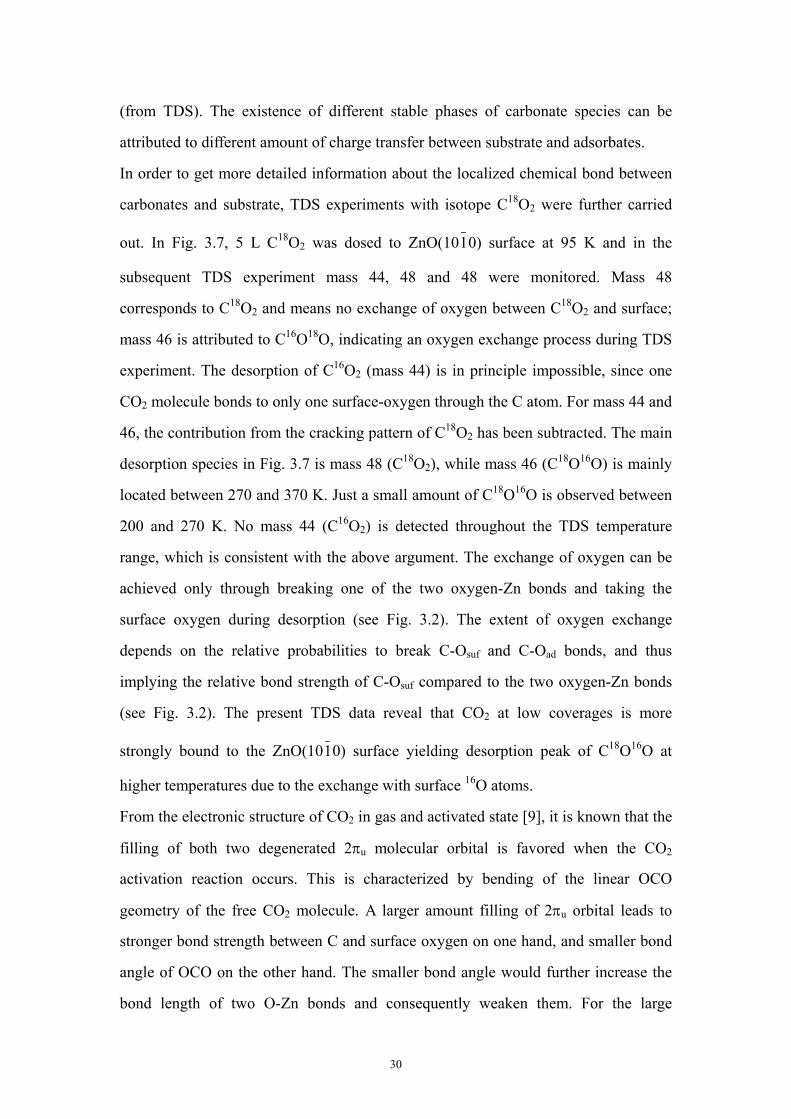
In order to get more detailed information about the localized chemical bond between
carbonates and substrate, TDS experiments with isotope C18O2 were further carried
out. In Fig. 3.7, 5 L C18O2 was dosed to ZnO(1010) surface at 95 K and in the
subsequent TDS experiment mass 44, 48 and 48 were monitored. Mass 48
corresponds to C18O2 and means no exchange of oxygen between C18O2 and surface;
mass 46 is attributed to C16O18O, indicating an oxygen exchange process during TDS
experiment. The desorption of C16O2 (mass 44) is in principle impossible, since one
CO2 molecule bonds to only one surface-oxygen through the C atom. For mass 44 and
46, the contribution from the cracking pattern of C18O2 has been subtracted. The main
desorption species in Fig. 3.7 is mass 48 (C18O2), while mass 46 (C18O16O) is mainly
located between 270 and 370 K. Just a small amount of C18O16O is observed between
200 and 270 K. No mass 44 (C16O2) is detected throughout the TDS temperature
range, which is consistent with the above argument. The exchange of oxygen can be
achieved only through breaking one of the two oxygen-Zn bonds and taking the
surface oxygen during desorption (see Fig. 3.2). The extent of oxygen exchange
depends on the relative probabilities to break C-Osuf and C-Oad bonds, and thus
implying the relative bond strength of C-Osuf compared to the two oxygen-Zn bonds
(see Fig. 3.2). The present TDS data reveal that CO2 at low coverages is more
strongly bound to the ZnO(1010) surface yielding desorption peak of C18O16O at
higher temperatures due to the exchange with surface 16O atoms.
From the electronic structure of CO2 in gas and activated state [9], it is known that the
filling of both two degenerated 2πu molecular orbital is favored when the CO2
activation reaction occurs. This is characterized by bending of the linear OCO
geometry of the free CO2 molecule. A larger amount filling of 2πu orbital leads to
stronger bond strength between C and surface oxygen on one hand, and smaller bond
angle of OCO on the other hand. The smaller bond angle would further increase the
bond length of two O-Zn bonds and consequently weaken them. For the large
30

carbonate coverage, the average charge transfer from surface to each carbonate
species becomes smaller. As a result, the binding energy of carbonate decreases and
the oxygen exchange becomes indistinctive due to the weakening of C-Osuf bond, and
vice versa for the low coverage.
This speculation was further confirmed by the following co-adsorption experiment
with CO and H2O. Fig. 3.8(a) presents the TD spectrum of 2 L H2O adsorption
followed by 5 L CO2 adsorption on ZnO(1010) at 95 K. The desorption peak of CO2
at around 300 K disappears and only the desorption peaks at lower temperatures are
observed. In contrast to coadsorption with H2O, exposing the clean ZnO(1010)
surface to 2 L CO followed by 5 L CO2 at 95 K results in the desorption of CO2 at
high temperature region (see Fig. 3.8b).
100 200 300 400 500 600 700
Inte
nsity
(Arb
. Uni
t)
(b)
CO2
CO
(a)
Temperature (K)
H2OCO2
Fig. 3.8 (a) TD spectra of 2 L H2O adsorption at 250 K followed by 5 L CO2 adsorption on ZnO(1010) surface at 95 K. (b) TD spectra of 2 L CO adsorption followed by 5 L CO2
adsorption on ZnO(1010) at 95 K. The heating rate was 1.5 K/s.
H2O adsorption on ZnO(10 1 0) leads to partial dissociation forming a (2×1)
superstructure [87, 88]. The oxygen row along [11 2 0] direction is half covered by
31

OH species. In the case of CO adsorption on ZnO(1010), however, the CO molecule
is bound only to Zn sites and the bond is strengthened by the pre-adsorbed CO2 [89].
Besides the site-blocking effect by H2O or CO molecules, it is relevant to consider the
electronic state of H2O and CO. For H2O adsorbed on ZnO(1010), H2O mainly acts as
a proton donor to the surface; for the CO adsorption on ZnO(1010), CO is more like a
electron donor. By this means, the pre-adsorbed H2O and CO affect the charge
transfer between substrate and the following adsorbed CO2. Pre-adsorbed H2O would
decrease and pre-adsorbed CO would increase the charge transfer between ZnO
substrate and carbonate specie to some extent, respectively.
As shown in Fig. 3.4, CO2 adsorption on the sputtered ZnO(1010) surface just gives
rise to the new broad desorption feature at high temperature range, while the
desorption peak at 325 K referring to CO2 adsorbed on perfect ZnO(1010) surface is
not disappeared. Here, one should note that besides creating defective sites, the Ar ion
sputtering process also leads to destruction of surface periodicity, which potentially
benefits the charge transfer between CO2 and substrate.
For the charge transfer from substrate to CO2, the maximum extent of filling of
electrons in the two degenerated 2πu orbital is four from energy point of view. No
fractional electron is allowed to transfer and fill in the molecular orbital. The integer
charge transfer of 1, 2, 3 and 4 is possibly corresponding to the different stable
superstructures, although no any experimental indication of (4×1) has been reported.
The speculation is consistent with the theoretical prediction that (4×1), (3×1) and (2×1)
phases have higher binding energy than other investigated superstructures [85]. The
thermal desorption peaks at 240 K and 297 K in Fig. 3.3 are likely attributed to the
desorption from (2×1) and (3×1) carbonate superstructure, respectively, which is
consistent with the LEED patterns obtained after annealing the carbonate-saturated
ZnO(1010) surface to 220 K and 270 K.
In conclusion, we have studied the interaction CO2 with ZnO(1010) at 95 K using
32

HREELS, TDS and LEED. CO2 adsorption on ZnO(1010) at 95 K leads to the
formation of an unsual tridentate carbonate species with different ordered phases.
Several ordered structures are observed and attributed to the consequence of different
amount of charge transfer between CO2 and surface oxygen.
3.2 Co-adsorption of CO and CO2 on ZnO(1010) surface
In this work, a significant increase of CO binding energy on CO2 modified ZnO(1010)
was observed. This effect is attributed to the increase of Lewis acidity of the surface
Zn2+ cations after CO2 adsorption, which results from the charge transfer between
CO2 and ZnO(1010) surface.
Fig. 3.9 presents TD spectra after exposing the ZnO(1010) surface to various amount
of CO at 95 K. The inset shows the integrated CO desorption peak area as a function
of the exposure. With increasing CO exposure, the CO desorption peak exhibits lower
desorption temperature, indicating a relatively strong lateral repulsion between
adsorbed CO species on ZnO(1010) surface. The TD spectrum of 45 L CO exposure
shows no increase in peak area compared with that of 2 L CO exposure, which means
that the CO coverage on ZnO(10 1 0) reaches maximum. By assuming a
100 150 200 250 300
0 10 20 30 40 50
0.4
0.6
0.8
1.0
Exposure (L)
Rel
ativ
e co
vera
ge
118 K
Mas
s 28
sig
nal (
arb.
uni
ts)
Temperature (K)
452.00.50.1
CO exposure (L)
Fig. 3.9 TD spectra of various CO exposures on the ZnO(1010) surface at 95 K. The inset indicates the integration of CO desorption peaks with respect to the exposure. The heatingrate is 1.5 K/s.
33

pre-exponential factor of 1013 s-1 for first order desorption, we can get the binding
energy for CO desorption of 29.8 to 32.7 kJ/mol for the presented CO exposure in Fig.
3.9. In fact a similar weak binding energy of CO was also reported on ZnO powder
samples [90, 91]. The binding energy of the low-coverage limit of CO can be roughly
estimated by extrapolation by the existing data points and amounts to 33.2 kJ/mol.
Fig. 3.10 shows the TD spectra of CO adsorbed on different CO2 modified ZnO(1010)
surfaces at 95 K. ZnO(1010) was first exposed to 2 L CO2, and then annealed to
different temperatures to remove part of adsorbed CO2. CO adsorption was then
performed on these modified surfaces. With increasing annealing temperatures, the
desorption peak of CO2 decreases gradually in intensity, while the peak area of CO
increases first and then decreases again. The increase of CO adsorption amount is
partially attributed to the weakening of site blocking effect by CO2 since the
desorption of CO2 releases surface sites for further CO adsorption. More importantly,
the desorption temperture of CO is also found to increase with elevating the CO2
coverage, which indicates an increase of binding energy of CO to surface. Note that
100 200 300 400 500 600 100 200 300 400 500 600
(f)(e)
(d)(c)
(b)(a)
In
tens
ity (a
rb. u
nits
)
CO
CO2
2 L CO at 95 K
118 K
CO(1) 2 L CO
2 at 95 K,
then heating to 290 K(2) 2 L CO at 95 K
130K
165K
CO(1) 2 L CO
2 at 95 K,
heating to 230 K(2) 2 L CO at 95 K
(1) 2 L CO2 at 95 K, heating to 220 K(2) 2 L CO at 95 K
CO
175 K
Temperature (K)
(1) 2 L CO2 at 95 K, heating to 200 K(2) 2 L CO at 95 KCO
187 K
Temperature (K)
CO
(1) 2 L CO2 at 95 K, heating to 120 K(2) 2 L CO at 95 K
209 K
CO2
CO2
CO2
CO2
CO2
Fig. 3.10 TD spectra of co-adsorbed CO and CO2 on ZnO(1010) surfaces at 95 K. In eachexperiment, ZnO(1010) was first exposed to 2 L CO2 and then annealed to indicatedtemperatures. The modified sample was exposed to 2 L CO.
34

0.0 0.2 0.4 0.6 0.8 1.0
30
35
40
45
50
55
Relative coverage of CO2
Bin
ding
ene
rgy
of C
O (k
J/m
ol)
Fig. 3.11 Binding energy of CO as afunction of coverage of pre-adsorbed CO2. Datapoints are derived from Fig. 3.10.
the increase is significant even taking the binding energy of low-coverage limit of CO
as reference. The binding energy of CO with respect to the relative coverage of CO2 is
summarized in Fig. 3.11. The binding energy of CO increases from 29.8 kJ/mol on the
clean ZnO(1010) surface to 54.4 kJ/mol on the monolayer CO2 modified ZnO(1010)
surface.
Indeed, as we discussed in the above subsection, CO2 adsorbed on ZnO(1010) takes
electron from surface and the amount depends on the carbonate coverage. Since CO
acts as an electron donor [92], the increase of Lewis acidity of the surface Zn2+
cations can potentially promote the charge transfer between CO and surface.
Fig. 3.12 presents the HREEL spectra of CO adsorbed on CO2 modified ZnO(1010)
surfaces at 95 K. Curve A shows the HREEL spectrum on the clean ZnO(1010)
surface. No adsorbate-related losses can be detected. CO adsorption on clean
ZnO(1010) (curve B) results in the appearance of a small loss at 272 meV that is
assigned to the stretching vibration of CO, ν(CO) [93, 94]. The HREEL spectrum
recorded after exposure of 2 L CO2 followed by 2 L CO on ZnO(1010) at 95 K (curve
C) shows tridentate carbonate-related losses at 123, 165 and 201 meV as well as the
band at 292 meV assigned to the physisorbed CO2, whereas no CO-related band is
detected. This is due to the adsorption site blocking by monolayer carbonate as further
demonstrated by the corresponding TDS results (see Fig. 3.10f). If half monolayer of
35

100 200 300 400 500
123
196
201
165
273
292
272
X20
X20
X100
X20 A
B
C
D
Energy Loss (meV)
Inte
nsity
(Arb
. Uni
t)167
Fig. 3.12 HREEL spectra recorded on ZnO(1010) surfaces at 100 K with different treatments. (A) Clean ZnO(1010) surface. (B) 20 L CO exposed surface (C) 2L CO2 on ZnO(1010) at 95 K and annealed to (C) 120 K and (D) 220 K, then exposed to 2 L CO at 100 K.
carbonate is removed from surface, the CO adsorption can reach a maximum
coverage, and the HREEL spectrum (Fig. 3.12D) shows the presence of both
tridentate carbonate and CO-related losses. The ν(CO) of CO reveals a slight blue
shift to 273 meV while the carbonate-related losses are slightly red-shifted. Actually,
this red shift of νs(OCO) and νas(OCO) was also found for CO2 adsorbed on
ZnO(1010) at low coverages where carbonate shows higher binding energy. The red
shift induced by the coadsorption of carbonate and CO could be related to the charge
transfer between CO molecule and pre-covered carbonate species. The blue shift of
ν(CO) is not well understood. However, the present results reveal that the increasing
of CO binding energy is not associated with electron back donation from surface to
CO molecule 2π∗ orbital that will result in a significant red-shift of ν(CO), as
observed on metal surfaces. We would attribute the increasing of CO binding energy
to the electron donation from CO 5σ orbital to the modified ZnO surface, as
supported by the DFT calculations [89]. The ν(CO) is not sensitive to this charge
transfer since the 5s electrons mainly locate at C side.
In the co-adsorption experiment shown in Fig. 3.10, the CO coverage in Fig. 3.10(d)
shows peak area three times larger than that in Fig. 3.10(a). This increase in CO
36

coverage implies a reduction of lateral repulsion between adsorbed CO species by the
pre-adsorbed CO2. This effect together with the site blocking effect on CO coverage
reaches a good balance on the half monolayer CO2 modified ZnO(1010) surface.
3.3 H2O adsorption on the ZnO(1010) surface
Fig. 3.13 Ball and stick model of half dissociated H2O on non-polar ZnO(1010) surfacefrom perspective view.
H2O, acting as an important and inevitable participant or even impurity in most of
industrial chemical reactions, has attracted a lot of scientific attentions [87, 95-101].
The water-solid interactions can be dominant in many surface reactions, such as
water-gas shift, methanol synthesis and stream reforming reaction [102, 103].
However, in some special cases, the unexpected H2O ad-layer on substrate can lead to
a change of the original physical and chemical properties [104]. Especially, H2O
usually shows high reactivity towards the active sites and block other reactions in
many surface catalytic reactions [105-108]. In a more common way, surfaces are
wetted by H2O adlayers in which the hydrogen bond between H2O molecules or
between H2O and substrate dominates the chemical and physical properties [100]. The
existence of these hydrogen bonds gives rise to energy shift of OH stretching
vibrations, which depend on the strength of the bonds [23, 88, 109]. This provides a
possibility to identify the hydrogen bond in different coverage of H2O layers.
H2O adsorption on this surface has been studied theoretically [87, 101] and
experimentally [88, 99] It was found that at room temperature monolayer water is
partially dissociated forming a (2×1) superstructure (as shown in Fig. 3.13). The
37

100 200 300 400 500 600
100 200 300 400 500 6000
10
20
30
40
50
10 L 4 L
4.0 L 2.0 L 0.5 L 0.2 L 0.05 L
Inte
nsity
(Arb
. Uni
t)
Temperature (K) Fig. 3.14 TD spectra of various amount of H2O exposures on ZnO(1010) at 90 K. Theinset shows the TD spectrum of 10 L H2O exposure to compare with the spectra atlower exposures. The heating rate is 1.5 K/s.
driving force of the partial dissociation was proposed to be the unusually strong
hydrogen bonding interactions of water to both neighboring adsorbate molecules and
the surface O atoms [88]. The dissociation barrier was calculated to be smaller than
0.05 eV per molecule [99], which hints that the dissociation of H2O on ZnO(1010)
can be activated even at very low temperatures. However, an experimental
observation by LEED (in macroscopic region) and vibrational spectroscopy (to
determine the dissociated species) at low temperature is still scarce. Furthermore, the
recognition of the hydrogen bonds in multi-, double and monolayer H2O could
provide a more straightforward understanding for the H2O partial dissociation in
monolayer [88, 109].
Fig. 3.14 shows the TDS results of various H2O exposures to ZnO(1010) surface at 90
K. For H2O exposure of 0.05 L, the desorption spectrum is dominated by the peak at
370 K. With increasing the H2O exposure to 0.2 L, besides the increase of peak
intensity at 370 K, a resolvable small shoulder at around 430 K shows up. These two
peaks have been assigned to the chemisorbed H2O molecule and hydroxyl group on
ZnO(1010) surface [88], respectively. Further increasing the H2O exposure to 0.5 L
leads to an intensity increase of the molecular H2O desorption peak to saturation.
After the H2O exposure exceeds 0.5 L (see Fig. 3.14, 2L and 4 L exposures), two new
38

Fig. 3.15 LEED patterns of (a) clean ZnO(1010) and (b) 2 L H2O exposuredZnO(1010) at 90 K. The electron energy was 72 eV.
peaks at 141 K and 160 K arise at lower temperatures. The inset in Fig. 3.14 shows
the TD spectra of 4 L and 10 L H2O exposures. The peak located at 141 K is
obviously assigned to multilayer H2O due to the unsaturated feature and the blue shift
of the peak position for higher H2O coverage, which is the typical character of the
zero-order desorption. The peak at 160 K, therefore, is attributed to double layer H2O
adsorbed on ZnO(1010) surface. Actually, similar TDS results of H2O were reported
on TiO2(110), where the multi-, double and mono-layer water desorptions were
observed at 155, 174 and 270 K, respectively [110].
Fig. 3.15 exhibits the LEED patterns recorded on clean and H2O covered ZnO(1010)
surfaces, respectively. The experiments were carried out at 90 K and the electron
energy was fixed at 72 eV for both cases. A perfect (1×1) surface is obtained on the
clean ZnO(1010) surface (Fig. 3.15a), indicating a good preparing procedure for the
sample. As shown in Fig. 3.15b, the LEED pattern of 1 L H2O covered surface shows
a clear (2×1) superstructure along [11 2 0] direction. This phenomenon is consistent
with the previous theoretical prediction [87, 101] and experimental results [88, 99]
that H2O adsorption on ZnO(1010) at RT leads to a self-dissociation forming a (2×1)
superstructure. The possibility that every two Zn sites along [11 2 0] are occupied by
one H2O molecule with the rest of Zn sites unoccupied, which could also give rise to a
(2×1) superstructure in LEED, is clearly ruled out by our coadsorption experiments of
H2O and CO. When the H2O-modified (2×1) ZnO(1010) surface was further exposed
39
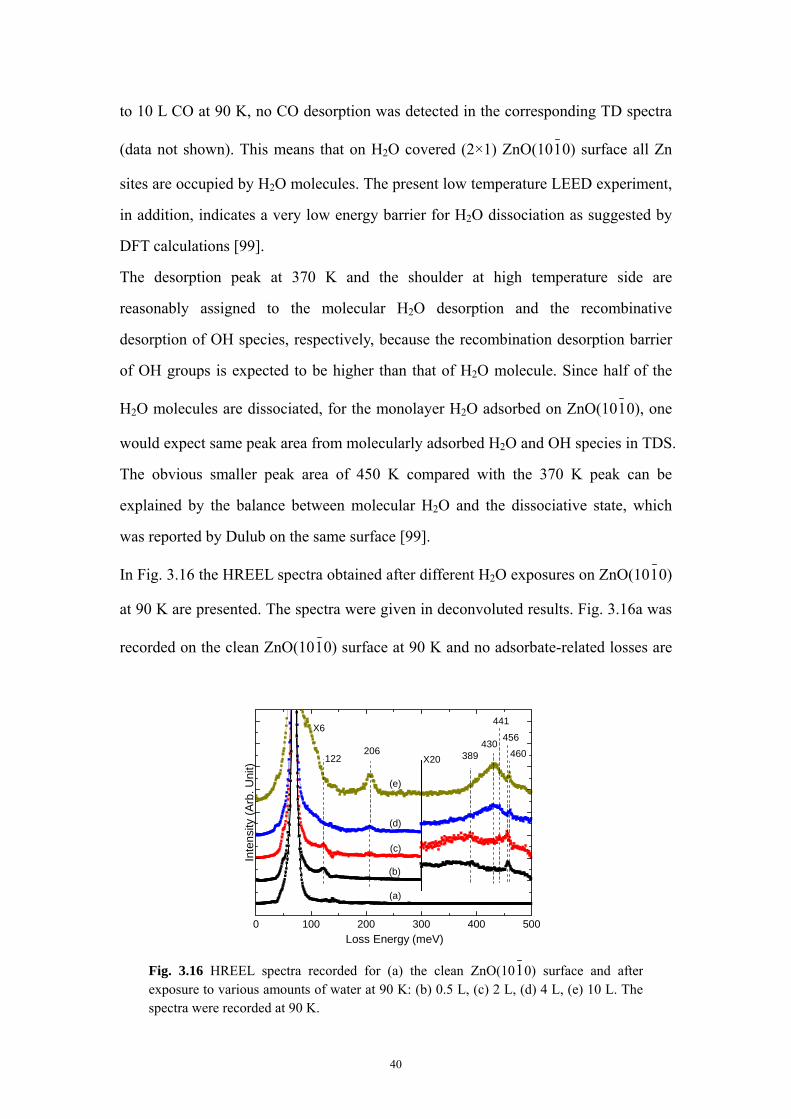
to 10 L CO at 90 K, no CO desorption was detected in the corresponding TD spectra
(data not shown). This means that on H2O covered (2×1) ZnO(1010) surface all Zn
sites are occupied by H2O molecules. The present low temperature LEED experiment,
in addition, indicates a very low energy barrier for H2O dissociation as suggested by
DFT calculations [99].
The desorption peak at 370 K and the shoulder at high temperature side are
reasonably assigned to the molecular H2O desorption and the recombinative
desorption of OH species, respectively, because the recombination desorption barrier
of OH groups is expected to be higher than that of H2O molecule. Since half of the
H2O molecules are dissociated, for the monolayer H2O adsorbed on ZnO(1010), one
would expect same peak area from molecularly adsorbed H2O and OH species in TDS.
The obvious smaller peak area of 450 K compared with the 370 K peak can be
explained by the balance between molecular H2O and the dissociative state, which
was reported by Dulub on the same surface [99].
In Fig. 3.16 the HREEL spectra obtained after different H2O exposures on ZnO(1010)
at 90 K are presented. The spectra were given in deconvoluted results. Fig. 3.16a was
recorded on the clean ZnO(1010) surface at 90 K and no adsorbate-related losses are
0 100 200 300 400 500
Loss Energy (meV)
Inte
nsity
(Arb
. Uni
t)
X6
X20430
456
441
460122206 389
(a)
(b)
(c)
(d)
(e)
Fig. 3.16 HREEL spectra recorded for (a) the clean ZnO(1010) surface and afterexposure to various amounts of water at 90 K: (b) 0.5 L, (c) 2 L, (d) 4 L, (e) 10 L. Thespectra were recorded at 90 K.
40

observed. For the small amount of H2O exposure (as shown in Fig. 3.16b, which
corresponds to monolayer H2O adsorption), the dominant peaks are located at 122,
206 (poorly resolved), 389 and 456 meV. With increasing the H2O exposure to 2 L
(Fig. 3.16c), which corresponds to double layer H2O adsorbed on the surface, a new
loss at 441 meV arises, while the 206 meV and 389 meV peaks increase in intensity.
Further increasing the H2O exposure to 4 L (Fig. 3.16d), which corresponds to the
multiplayer H2O adsorbed on the surface, leads to several new changes of the spectra:
(a) A new broad peak at 430 meV shows up and the peaks at 389 and 441 meV are not
resolvable anymore. (b) The 456 meV peak shifts to 460 meV. (c) The 122 meV
peak disappears and the 206 meV peak increases its intensity. Fig. 3.16e shows the
EEL spectrum obtained after 10 L H2O exposure at 90 K. All the peaks increase in
intensity, whereas no peak shift compared to Fig. 3.16d is observed.
200 300 400 500 600 700
350 400 450 500
456
389 456
Energy Loss (meV)
(b)
(a)
Temperature (K)
Inte
nsity
(Arb
. Uni
t)
(a)
(b)
Fig. 3.17 TD spectra of 1 L H2O adsorbed on ZnO(1010) (a) at 90 K, (b) pre-annealing to 370 K. The inset shows the corresponding HREEL spectra.
Fig. 3.17 presents the TD spectra of 1 L H2O adsorbed on ZnO(1010) at 90 K (curve a)
and subsequently annealing to 370 K (curve b). The inset of Fig. 3.17 shows the
corresponding HREEL spectra recorded before the TDS experiments. After annealing
to 370 K the loss peak at 389 meV disappears. From the TDS data it is known that at
370 K the molecularly adsorbed H2O is largely desorbed. We therefore attribute the
loss peak at 389 meV to the vibration mode existing in the molecularly chemisorbed
H2O layer. The only possibility of so high vibrational energy is the stretching mode of
41

OH in H2O. Therefore, we can further attribute the loss peak at 389 meV to the
stretching vibrational mode of OH with hydrogen bond, which can significantly cause
red shift of the vibrational energy.
The loss feature at 122 meV can be assigned to the bending mode, ρ(OH), of OH
species created by H2O partial dissociation. The decrease and even disappearance of
ρ(OH) for thicker layer H2O adsorption, as shown from Fig. 3.16b to Fig. 3.16e, can
be explained as the screening effect by double and multilayer H2O. The scissor mode,
δ(HOH), of H2O, which is located at 206 meV, just exists in molecular H2O and
increases its intensity with increasing the H2O exposure (from Fig. 3.16b to Fig.
3.16e). The losses higher than 380 meV result from the OH stretching mode, ν(OH) .
It exhibits energy shift according to different chemical surroundings. For instance, the
energy of ν(OH) from isolated hydroxyl is different from that of H2O although they
have overlapping in many cases [95]. According to our previous work on ZnO(1010)
surface [88], the loss at 460 meV is attributed to the ν(OH) of isolated H2O and the
loss at 456 meV results from the ν(OH) of isolated hydroxyl group. On the other hand,
the ν(OH) mode of H2O with H-bond should shift to lower energy region depending
on the strength of the H-bond. The peaks at 389 meV, 430 meV and 441 meV are
assigned to the ν(OH) mode of H2O with H-bond. The very broad peak at 430 meV is
due to the random orientation of H-bond in multiplayer H2O. It increases in intensity
with increasing the thickness of H2O adlayer. The shifts of ν(OH) in mono-, double
Table 3.2 Energy shift of ν(OH) of water with H-bonding compared with ν(OH) in the isolated hydroxyl group.
Exposure (L) H2O species Energy loss (meV) Shift of ν(OH) with
H-bonding (meV)
0.5 Mono-layer 389, 460 71
2 Bi-layer (389*), 441, 460 19
5 Multi-layer (389*), 430, 460 30
10 Multi-layer 430, 460 30
* From the co-existence of mono-layer OH
42
and multi-layer H2O amount to 71 meV, 19 meV and 30 meV, respectively. A collation
of the strength of H-bond in different H2O layers adsorbed on ZnO(1010) can be
achieved: H-bond(mono) > H-bond(multi) > H-bond(double). Surprisingly, the energy of
the ν(OH) mode in monolayer H2O is much lower than those in double and multilayer
H2O, indicating unusually strong H-bond interactions in monolayer H2O. This is
likely the origin of the low barrier of H2O self-dissociation upon adsorbing on the
ZnO(1010). The HREELS data are summarized in Table 3.2.
In conclusion, the interaction of H2O with ZnO(1010) surface at 90 K was studied by
HREELS, TDS and LEED. The partial self-dissociation of H2O on ZnO(1010) with a
very low dissociation barrier was observed forming a stable (2×1) superstructure. The
growth of H2O was clearly monitored by HREELS and TDS. The energy shift of the
ν(OH) mode depends on the strength of H-bonds of H2O and was used to distinguish
between different H2O adsorption layers on ZnO(1010). The unusually strong H-bond
interactions in monolayer H2O is likely responsible to the low barrier self-dissociation
of H2O on this surface.
43

4. Small molecular adsorbates on TiO2(110)
TiO2 is one of the most studied oxides in surface science due to its particular
properties [111], including photo-catalytic properties as catalyst for electron-hole
generation [112, 113] or water dissociation [114], bio-compatibility, heterogeneous
catalytic properties as the support for CO oxidation [115], electronic properties as
varistor, and even the chemical stability as a corrosion-protective material and white
pigment. As the most thermodynamically stable surface of TiO2, rutile TiO2(110) has
attracted much more research attentions than other faces and been considered as a
prototype system in surface science studies of metal oxides.
Fig. 4.1 Stick-and-ball model of TiO2(110) in perspective view together with surfaceoxygen vacancies and reaction intermediate, diolate species formed after formaldehydeactivation on two adjacent bridge O-vacancies. (Ti: bright gray ball, O: red ball)
Fig. 4.1 shows a stick-and-ball model of rutile TiO2(110) surface. A stoichiometric
surface exposes 2-fold coordinated oxygen (bridge oxygen, O2C), 3-fold coordinated
oxygen (lattice oxygen, O3C) and 5-fold coordinated Ti (Ti5C). The lattice oxygen is
coordinatively saturated and shows less chemical reactivity. The Ti5C and O3C atoms
are 1-fold coordinatively unsaturated and usually show chemical reactivity toward gas
adsorption and reactions. Furthermore, like for many other oxide surfaces, the oxygen
vacancies on the surface also exhibit high activity. Two methods are normally applied
to create oxygen vacancies on this surface: annealing at high temperature and
sputtering with Ar+ ion. In general, annealing method can only create the bridge
44

oxygen vacancies and the amount depends on the annealing temperature [116, 117].
Alternatively, Ar+ ion sputtering method can create the more chemical reactive
oxygen vacancies, namely, lattice oxygen vacancies.
In this chapter, the work of CH2O and H adsorption on TiO2(110) surface is presented.
4.1 CH2O adsorption on the TiO2(110) surface
In this work, CH2O adsorption on perfect and defective surface (either by high
temperature annealing or by Ar+ ion sputtering) was studied. Polymerization
production was found to form on the perfect TiO2(110) surface along Ti5C rows. The
binding energy of paraformaldehyde polymers depend on the chain length. On the
defective TiO2(110) surface, the adsorbed CH2O is reduced to ethylene at oxygen
vacancies. The formation of ethylene reflects the diffusion and recombination process
of the adsorbate species, dioxy-methylene. The sputtered surface can contain as much
as 40% of oxygen vacancies. The more reactive site was found to be the lattice
oxygen vacancies created only by Ar+ ion sputtering, on which CH2O is reduced to
ethylene even at temperature as low as 150 K.
Many catalytic reactions rely on the dynamic equilibrium between the addition and
removal of oxygen atoms from the surface. For example, CO oxidation in a Mars van
Krevelen type on RuO2(110) surfaces [118-120] as well as oxidative
de-hydrogenation of alcohols [121] and hydrocarbons [122] all rely on the dynamics
between surface oxygen vacancies and gas phase oxygen pressure. In surface science
for most of these oxidation/reduction processes the decomposition (dissociation)
pathways are studied where the number of moles consumed is equal or less to the
number of moles produced. This preference is in part due to what it generally referred
to as the pressure gap; simply stated as high vacuum favouring dissociation and high
pressure favouring association. However, some counter examples are persistent in
surface reactions where surface-adsorbate interactions lead to building up of large
molecules via carbon-carbon, carbon-oxygen and carbon-nitrogen bond formation.
45
These coupling reactions are among the most essential chemical reactions in nature.
In UHV carbon-carbon bond formation was reported on O-defected TiO2 [123-127]
and UO2 single crystals [128-130]. Oxidative coupling of acetylene to furan was also
detected on Pd(111) single crystal surfaces [131].
Organometallic and organic chemists have early on recognised that Ti compounds are
active for coupling reactions of carbonyl compounds via carbon-carbon bond
formation. During this catalytic process Ti atoms are oxidized, ultimately to Ti4+, a
reaction termed McMurry reaction [132, 133]. Orbital symmetry is given as the
reason for the high activity of the surface Ti-species, although detailed studies are not
reported. It is also worth mentioning that this reaction is not observed on many other
transition metals and of all the transition metals investigated Ti is the most active. The
reductive coupling of carbonyls on reduced TiO2(001) single crystals was studied by
TPD and XPS [123-128] The results indicated that a diolate type species
(-OCH2CH2O-) is most likely formed as an intermediate between the carbonyl
(R(R’)C=O) and the symmetric hydrocarbon (R(R’)C=C(R’)R). This conclusion was
based on the appearance of an XPS C1s signal at about 286.5 eV, a value which is
found between the C1s of hydrocarbons (ca. 285 eV) and that of carbonyls (ca. 288
eV). However, photoelectron spectroscopy provides indirect evidence of the surface
species formed during the reaction. No unambiguous evidence for the formation of a
diolate species on TiO2 single crystal surfaces has been reported.
High resolution electron energy loss spectroscopy (HREELS) has been used
extensively to characterize adsorbed species on metal single crystal surfaces (see e.g.
Ref. [134-139]). In contrast to metals, the application of this technique to oxide
surfaces is rather scarce. This lack of information is to a large extent due to the
intense Fuchs-Kliewer phonon losses [140] which make the adsorbate-related losses
very difficult to detect. Two methods to overcome this problem have been proposed in
the literature: Fourier deconvolution of combination losses [141, 142] and collection
of spectra under conditions where impact scattering is enhanced [143]. More recently,
using a combination of both methods, high-quality HREELS data have been reported
for different adsorbates on ZnO and TiO2 surfaces [72, 84, 88, 93, 144, 145].
46

The successful application of HREELS to oxides and the advanced understanding of
the surface structure of TiO2 (110) rutile single crystal allow for a detailed
investigation of one of the most fundamental and essential reaction in chemistry: the
carbon-carbon bond formation reaction. Association of molecules to higher ones is
not only central to industrial catalysis and chemical manufacture in general but is at
the origin of any process in nature where complex compounds are made from simpler
monomer or precursors. In this work we focus on the reaction of formaldehyde, the
simplest of the carbonyls, on the surfaces of stoichiometric and reduced rutile
TiO2(110) using HREELS and thermal desorption spectroscopy (TDS). It is shown
that formaldehyde can form ethylene by reductive coupling (2 CH2O + 2VO
CH2=CH2 + 2 Os), where VO denotes an O vacancy and s for surface. This reaction,
although the simplest of all reductive carbonyl coupling reactions, is complex, and not
understood on an elementary level. A key intermediate between the adsorbed
formaldehyde and the desorbing ethylene is a diolate species (-OCH2CH2O-) bonded
to Ti atoms. This stable intermediate species has not been unambiguously identified
on any metal oxide single crystal surface prior to this work.
CH2O Adsorption on the Perfect TiO2(110) Surface. Fig. 4.2 presents TD spectra recorded after exposing the defect-free TiO2(110) surface
to various amounts of CH2O at 100 K. With increasing exposure to CH2O three peaks
located at 290, 268 and 128 K are observed for m/e 29 (the parent ion of CH2O). The
relative coverage of CH2O was determined from the ratio of the integrated peak areas
(see inset of Fig. 4.2). The following masses were also investigated but no signals
were detected: m/e 2, 18, 26, 27, 44. A small amount of m/e 31 (CH3OH) was
observed but its intensity was less than 0.6 % of that of m/e 29 and as a result, was not
further considered. At low coverage only one formaldehyde desorption peak at 290 K
is seen; increasing surface exposure results in an increase of the total desorption at the
same temperature. At higher exposures (2 L and above) a peak at 268 K develops and
becomes dominant at 5 L. The peak at 128 K observed at high coverage is assigned to
physisorbed CH2O. It is also worth noting that for the 5 L exposure the main
47

desorption peak becomes very broad between 150 K and 350 K. This hints to a
non-uniform distribution of CH2O species on the TiO2(110) surface, which will be
discussed later.
100 200 300 400 500 600 700
0 1 2 3 4 50,00,20,40,60,81,0
CH2O Exposure (L)
Rel
ativ
e C
over
age
5.0 L2.0 L1.0 L0.5 L
Temperature (K)
Inte
nsity
(arb
. uni
t)
m/e 29 (CH2O)
268
290
128
Fig. 4.2 TD spectra of CH2O adsorbed on the perfect TiO2(110) surface at 100 K with various exposures. The heating rate was 1.5 K/s. 1 L=1.33×10⁻⁶ mbar s. The inset shows the relative coverage of CH2O as function of exposure.
100 200 300 400 500
188148
54
45
f
137
210
x10
143
363
94
156
x400
174
x100
Energy Loss (meV)
Inte
nsity
(arb
. uni
t)
a
b
c
d
e
Fig. 4.3 HREEL spectra of (a), (b) clean TiO2(110) surface, (c) 5 L CH2O adsorbed on theperfect TiO2(110) surface at 100 K. After c the sample was subsequently annealed to (d)200 K, (e) 260 K, (f) 400 K. Curve (a) is the raw spectrum, and the Fourier deconvolutedspectra are shown in curves b-f. In curves c and d the surface phonon at 189 meV is notcompletely removed. All the spectra were taken at 100 K.
48

In Fig. 4.3, HREEL spectra are presented which were recorded for the stoichiometric
TiO2(110) surface before and after adsorption of formaldehyde at 100 K. The raw
spectrum of the clean TiO2(110) surface (curve a) shows intense primary surface
phonon bands at 45, 54 and 94 meV as well as their combination and multiple
excitations. The latter could be completely removed by Fourier deconvolution (curve
b), and the corresponding spectrum demonstrates the presence of a clean,
contamination-free TiO2(110) surface (Note that in curves c, d, and f the surface
phonon at 189 meV is still detected as a weak feature). After exposure of 5 L CH2O at
100 K, new loss peaks are detected at 137, 143 (shoulder), 156, 174, 185, 210 and 363
meV (Fig. 4.3c). By comparison with IR results of free CH2O molecules [146], the
loss features at 143, 156, 210 and 363 meV are assigned to wagging ω(CH2 ), rocking
ρ(CH2), stretching ν(C=O), and asymmetric stretching νa(CH2) modes of physisorbed
CH2O, respectively. This assignment is confirmed by the sequential annealing
experiment shown in Fig. 4.3d, where all the physisorbed CH2O-related bands are
found to disappear upon heating the sample to 200 K. This observation is consistent
with the assignment of the low temperature TDS peak at 128 K to physisorbed species
(Fig. 4.2). Accordingly, the remaining loss features at 137, 174 and 363 meV in Fig.
4.3d must be related to chemisorbed CH2O.
As was shown previously by many groups [147, 148], CH2O adsorbed on metal or
metal oxide surfaces at low temperature often polymerizes to yield paraformaldehyde.
In our HREELS data, the loss peak at 137 meV is a typical feature of the O-C-O units
in paraformaldehyde and corresponds to the C-O stretching vibration. A chemisorbed
CH2O monomer is generally bonded to the oxide surface in an oxygen end-on η1(O)
configuration [148, 149] giving a typical ν(C=O) mode at around 205 meV due to the
slightly reduced C=O bond. Based on our vibrational data, the presence of isolated
chemisorbed CH2O molecules on TiO2(110) can be excluded. After further annealing
to 260 K (Fig. 4.3e) no new peaks show up, while the losses at 137, 174 and 363 meV
decrease in intensity. The two desorption states at 268 K and 290 K in TDS are
therefore assigned to the decomposition of the same surface species,
49

Table 4.1 Vibrational energies (meV) and mode assignments of CH2O adsorbed on fully oxidized TiO2(110) surfaces at 100 K.
Assignment Modes T = 100 K T = 200 K
ν(C-O) 137 137 δ(CH2) 177 174
Paraformaldehyde
ν(CH2) 363 363 ω(CH2) 143
ρ(CH2) 156 δ(CH2) 185a ν(C=O) 210
Physisorbed formaldehyde
ν(CH2) 363 a not resolved from the surface phonon.
paraformaldehyde. All HREELS data and the corresponding assignments are
summarized in Table 4.1.
In order to further assert about the adsorption site of paraformaldehyde, co-adsorption
experiments of CH2O and CO were conducted (Fig. 4.4). It is known that CO is
adsorbed on five-fold coordinated Ti5c cations [145, 150]. Thus, if CH2O also adsorbs
on the metal ions competitive adsorption will take place which is expected to follow
thermodynamic laws: the species with the stronger adsorption energy will prevail.
Fig. 4.4 presents the TDS data obtained after exposing the TiO2(110) surface first to 2
100 200 300 400 500 600
100 200 300
130 K
CO on clean TiO2(110)
Inte
nsity
(arb
.uni
t)
Temperature (K)
Temperature (K)
Inte
nsity
(arb
. uni
t)
CO
CH2O
Fig. 4.4 TD spectra recorded after coadsorption of CO and CH2O on the perfectTiO2(110) surface: 3 L CH2O on TiO2(110) at 100 K followed by 2 L CO at 100 K. Theinsert shows TD spectrum of 2 L CO on defect-free TiO2(110) at 100 K.
50
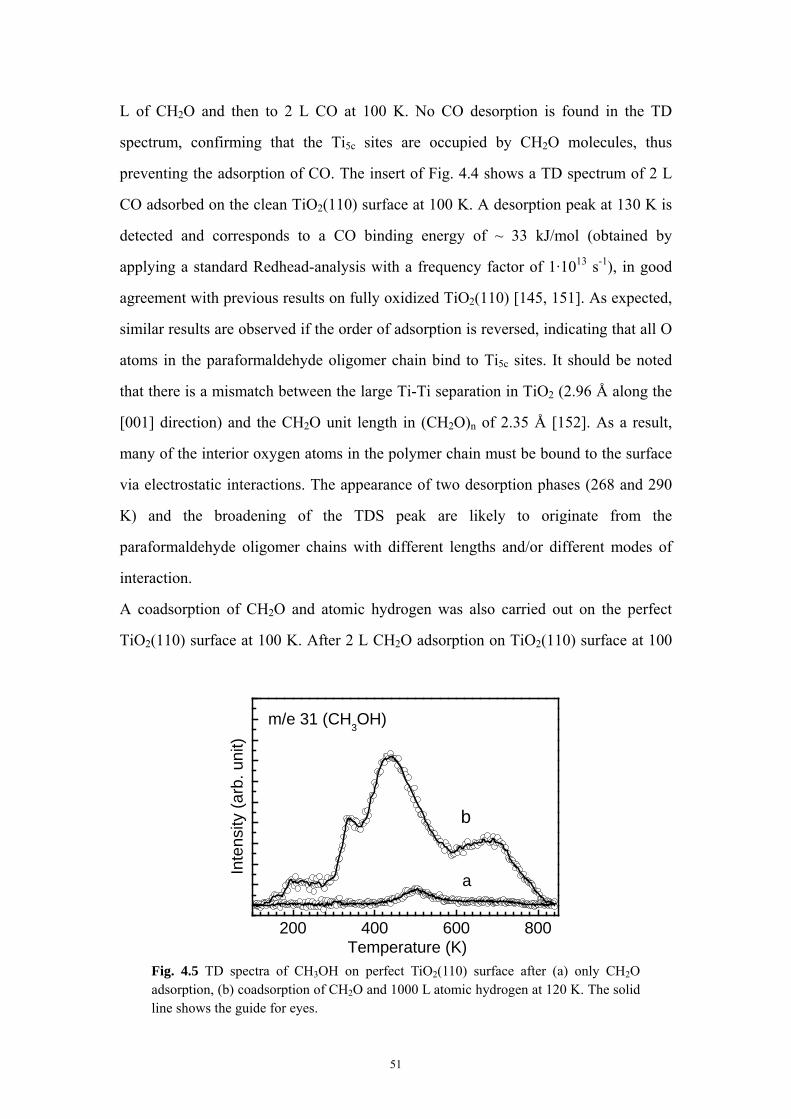
L of CH2O and then to 2 L CO at 100 K. No CO desorption is found in the TD
spectrum, confirming that the Ti5c sites are occupied by CH2O molecules, thus
preventing the adsorption of CO. The insert of Fig. 4.4 shows a TD spectrum of 2 L
CO adsorbed on the clean TiO2(110) surface at 100 K. A desorption peak at 130 K is
detected and corresponds to a CO binding energy of ~ 33 kJ/mol (obtained by
applying a standard Redhead-analysis with a frequency factor of 1·1013 s-1), in good
agreement with previous results on fully oxidized TiO2(110) [145, 151]. As expected,
similar results are observed if the order of adsorption is reversed, indicating that all O
atoms in the paraformaldehyde oligomer chain bind to Ti5c sites. It should be noted
that there is a mismatch between the large Ti-Ti separation in TiO2 (2.96 Å along the
[001] direction) and the CH2O unit length in (CH2O)n of 2.35 Å [152]. As a result,
many of the interior oxygen atoms in the polymer chain must be bound to the surface
via electrostatic interactions. The appearance of two desorption phases (268 and 290
K) and the broadening of the TDS peak are likely to originate from the
paraformaldehyde oligomer chains with different lengths and/or different modes of
interaction.
A coadsorption of CH2O and atomic hydrogen was also carried out on the perfect
TiO2(110) surface at 100 K. After 2 L CH2O adsorption on TiO2(110) surface at 100
200 400 600 800
b
Temperature (K)
Inte
nsity
(arb
. uni
t)
m/e 31 (CH3OH)
a
Fig. 4.5 TD spectra of CH3OH on perfect TiO2(110) surface after (a) only CH2O adsorption, (b) coadsorption of CH2O and 1000 L atomic hydrogen at 120 K. The solid line shows the guide for eyes.
51

K, the modified surface was further exposed to 1000 L atomic hydrogen at 100 K,
performed by dissociating H2 on a hot tungsten filament in line-of-sight from the
substrate as described in previous works [145, 153]. The resulting TDS data (desorbed
species, peak shapes and desorption temperatures) were found to be similar to those
recorded after exposure to 2 L CH2O at 100 K. The only significant difference is the
observation of a small amount of CH3OH (see Fig. 4.5), revealing the formation of
methanol through the hydrogenation of formaldehyde.
CH2O Aadsorption on Defective TiO2(110) Surfaces. As was mentioned above, bridge O vacancies can be created by heating the sample to
high temperatures [154-156]. The increase in vacancy density is not associated with a
considerable rearrangement of the surface, as indicated by results from both STM and
LEED [111]. Dosing of 5 L CH2O to a TiO2(110) surface that has been annealed at
900 K for 5 minutes yields significantly different TDS data. The results presented in
Fig. 4.6b show a new feature in the high temperature region. A peak of mass 26 is
observed at 620 K and corresponds to the desorption of C2H4. TDS results recorded
after longer annealing times (900 K, 10 min) only reveal a small increase in the
intensity of this peak, accompanied by a slight temperature shift (see Fig. 4.6c). The
200 400 600 800Temperature (K)
Inte
nsity
(arb
. uni
t)
620 Kx10
a
b
c
CH2O
C2H4
Fig. 4.6 TDS data of 5 L CH2O adsorbed on over-annealed TiO2(110) surfaces at 100 K.(a) CH2O; (b), (c) C2H4. The sample was over-annealed (a), (b) at 900 K for 5 min; (c) at900 K for 10min.
52
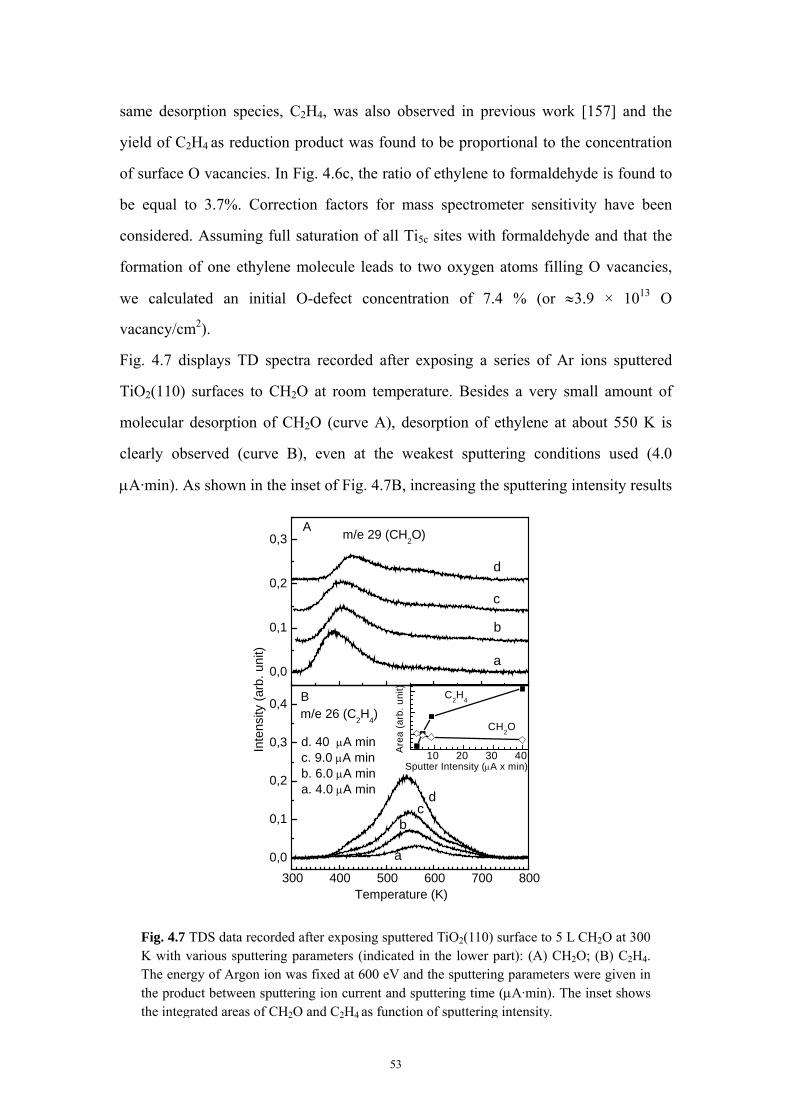
same desorption species, C2H4, was also observed in previous work [157] and the
yield of C2H4 as reduction product was found to be proportional to the concentration
of surface O vacancies. In Fig. 4.6c, the ratio of ethylene to formaldehyde is found to
be equal to 3.7%. Correction factors for mass spectrometer sensitivity have been
considered. Assuming full saturation of all Ti5c sites with formaldehyde and that the
formation of one ethylene molecule leads to two oxygen atoms filling O vacancies,
we calculated an initial O-defect concentration of 7.4 % (or ≈3.9 × 10¹³ O
vacancy/cm2).
Fig. 4.7 displays TD spectra recorded after exposing a series of Ar ions sputtered
TiO2(110) surfaces to CH2O at room temperature. Besides a very small amount of
molecular desorption of CH2O (curve A), desorption of ethylene at about 550 K is
clearly observed (curve B), even at the weakest sputtering conditions used (4.0
μA·min). As shown in the inset of Fig. 4.7B, increasing the sputtering intensity results
300 400 500 600 700 8000,0
0,1
0,2
0,3
0,4
a
b
d
c
dc
b
d. 40 μA minc. 9.0 μA minb. 6.0 μA mina. 4.0 μA min
Temperature (K)
Inte
nsity
(arb
. uni
t)
B
a
0,0
0,1
0,2
0,3
10 20 30 40
C2H4
Are
a (a
rb. u
nit)
Sputter Intensity (μA x min)
CH2O
m/e 26 (C2H4)
m/e 29 (CH2O) A
Fig. 4.7 TDS data recorded after exposing sputtered TiO2(110) surface to 5 L CH2O at 300 K with various sputtering parameters (indicated in the lower part): (A) CH2O; (B) C2H4.The energy of Argon ion was fixed at 600 eV and the sputtering parameters were given inthe product between sputtering ion current and sputtering time (μA·min). The inset shows the integrated areas of CH2O and C2H4 as function of sputtering intensity.
53

in considerable increase of the ethylene desorption (formation), reaching a maximum
value of 19% at about 40 μA·min. Molecular desorption of CH2O from the same
surface, in contrast, is found to clearly decrease with increasing the sputtering
intensity. The corresponding maximum concentration of oxygen vacancies created by
Ar+ sputtering is computed equal to 38%.
Compared with the results on the fully oxidized (perfect) and over-annealed TiO2(110)
surfaces (Fig. 4.8), the yield of ethylene increases dramatically for the sputtered
surface (note that for the perfect TiO2(110) surface no ethylene desorption is detected),
whereas the molecular desorption of CH2O is largely reduced. These observations
strongly indicate that the deoxygenation reaction of CH2O occurs on surface oxygen
vacancies. This finding is further supported by the co-adsorption experiments with
100 200 300 400 500 600 700 8000,0
0,5
1,0
1,5m/e 26 (C2H4)
Inte
nsity
(arb
. uni
t)
Temperature (K)
a
b
c
d
ab
c
d
Bx5
m/e 29 (CH2O) x5
A
0
2
4
6
8
10
Fig. 4.8 TDS results obtained after exposing differently modified TiO2(110) surfaces to5 L CH2O at 100 K: (a) fully oxidized (perfect) TiO2(110). (b) prior-over-annealed to900 K. (c) prior-sputtered TiO2(110). (d) the sputtered surface was exposed first to 2L H2O at 300 K and then to 2 L CH2O at 300 K. The upper part (A): CH2O; the lowerpart (B): C2H4.
54

H2O. Water adsorption on TiO2(110) surface has been intensively studied and it was
shown that the adsorption on O vacancy sites at room temperature causes a
dissociation of H2O molecules forming two OH species (and the filling of the O
vacancies) [158, 159]. We have conducted TDS experiments of formaldehyde (2 L)
on an Ar-ion sputtered TiO2(110) surface that has been pre-exposed to 2 L of water at
room temperature. No desorption of ethylene was observed (see Fig. 4.8d), as
expected from the above reaction mechanism requiring the presence of O vacancies.
In order to elucidate the mechanism of formaldehyde activation at O vacancies, we
have carried out HREELS experiments. Fig. 4.9 presents a comparison of vibrational
data recorded after CH2O adsorption on perfect and defective surfaces. After exposing
the perfect TiO2(110) surface to 5 L CH2O at 300 K followed by annealing to 400 K,
the corresponding HREEL spectrum only shows the features of a clean surface,
clearly CH2O has completely desorbed at this temperature, in good agreement with
the TDS results. However, the HREEL spectrum (Fig. 4.9b) obtained on the defective
TiO2(110) surface prepared by Ar+ sputtering, exhibits a number of distinct loss
features, revealing the presence of chemisorbed species formed via CH2O adsorption
on O vacancy sites. The fact that no ν(C=O) mode (at around 210 meV) was observed
100 200 300 400 500
νs(CH2)353
νas(CH2)
ν(C-C)+ ω(CH2)
νs(OCO)
Energy Loss (meV)
Inte
nsity
(arb
. uni
t)
363
174
138
a
b
νas(OCO)
143
180δ(CH2)
Fig. 4.9 HREELS data recorded after exposing differently modified TiO2(110) surfacesto 5 L CH2O at 300 K followed by annealing to 400 K. (a) The fully oxidized (perfect)surface; (b) Ar-ions sputtered TiO2(110) surface. Both HREELS experiments wererecorded at room temperature. Curve (b) was given as a raw spectrum. All the spectrawere taken at 300 K in specular direction with an incidence angle of 55° and with aprimary energy of 10 eV.
55

Table 4.2 Assignments of HREELS data for the diolate molecule formed on defective TiO2(110) surfaces and comparison with other works from ethylene glycol and the computed (at the DFT/B3LYP-6-31G**) frequencies from a Ti2Cl4C2H3O2 cluster. All numbers are given in meV.
Modes Ethylene Glycol
O-CH2-CH2-O on Mo(110)
HREELS data
Computed results
νas(C-O) 129 - 138 137
νs(C-O) 135 128 143 145
ν(C-C) 107 111 a 114
ν(C-C)+ω(CH2) - - 174 174
δ(CH2) 181 179 180 180-186
νs(CH2) 356 352 353 378
νas(CH2) 364 361 363 385 anot resolved
hints a dissociative adsorption of CH2O on O vacancies.
On the basis of the similarity of the frequencies in the HREELS data with those of
ethylene glycol, both in liquid [160] and adsorbed on Mo(110) [161] (see Table 4.2),
we propose the presence of a diolate species (-OCH2CH2O-). This assignment is
clearly supported by DFT calculations. As shown in Table 4.2, the computed
frequencies of diolate in a TiCl2-OCH2CH2O-TiCl2 cluster are in good agreement
with the experimental results. The losses observed at 138, 143, 180, 353 and 363 meV
are assigned to νas(-O-CH2-H2C-O-), νs(-O-CH2-H2C-O-), δ(CH2), νs(CH2) and
νas(CH2) modes, respectively. The peak at 174 meV is attributed to a vibration of
mixed character involving C-C stretching and CH2 wagging.
The diolate species can be formed through activation of two formaldehyde molecules
adsorbed at adjacent O vacancy sites (see Fig. 4.1). Actually, this type of double O
vacancies has been observed on TiO2(011)-2×1 surface prepared by electron
irradiation in a recent STM study [162]. In our work, the oxygen vacancies on
TiO2(110) are created mainly by Ar+ sputtering, and a large vacancy concentration of
about 38 % of a monolayer is achieved. More recently, the diffusion barrier Eb of
bridge O vacancies on TiO2(110) was determined by both STM and DFT calculations
[163] to be equal to 1.15 eV, revealing that oxygen vacancies exhibit rather limited
mobility at room temperature. The corresponding hopping rate h can be calculated
56
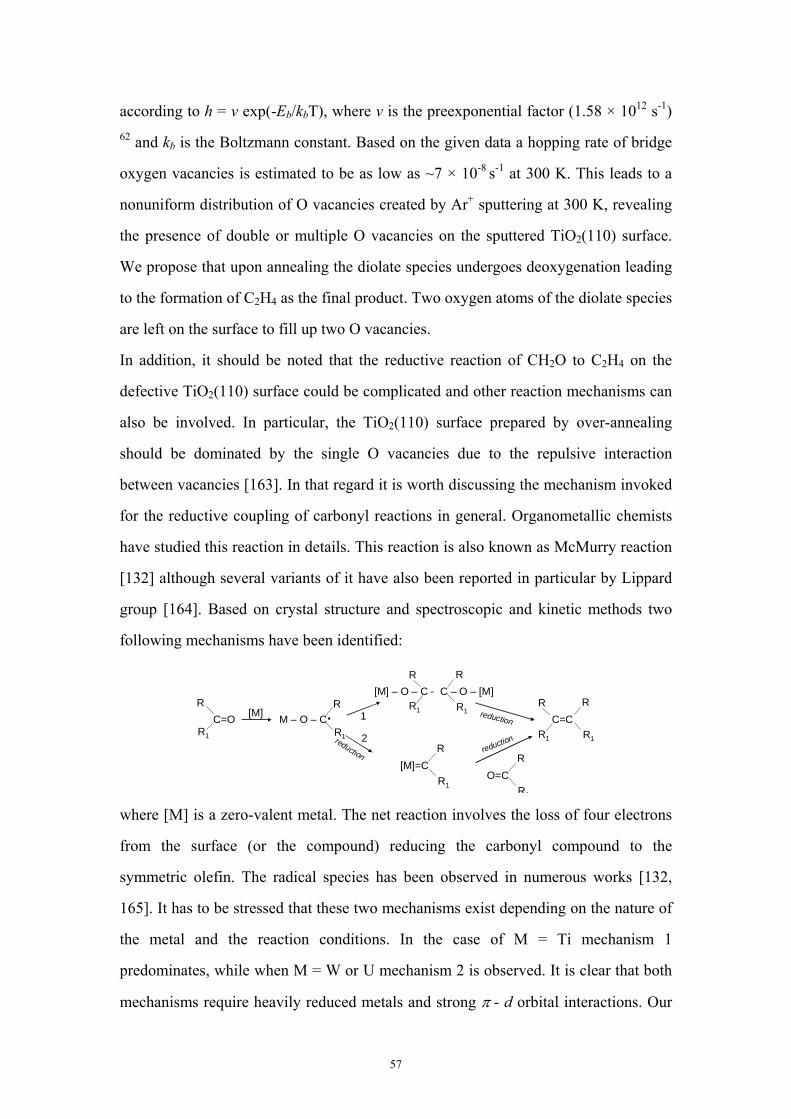
according to h = ν exp(-Eb/kbT), where ν is the preexponential factor (1.58 × 10¹² s-1)
62 and kb is the Boltzmann constant. Based on the given data a hopping rate of bridge
oxygen vacancies is estimated to be as low as ~7 × 10⁻⁸ s-1 at 300 K. This leads to a
nonuniform distribution of O vacancies created by Ar+ sputtering at 300 K, revealing
the presence of double or multiple O vacancies on the sputtered TiO2(110) surface.
We propose that upon annealing the diolate species undergoes deoxygenation leading
to the formation of C2H4 as the final product. Two oxygen atoms of the diolate species
are left on the surface to fill up two O vacancies.
In addition, it should be noted that the reductive reaction of CH2O to C2H4 on the
defective TiO2(110) surface could be complicated and other reaction mechanisms can
also be involved. In particular, the TiO2(110) surface prepared by over-annealing
should be dominated by the single O vacancies due to the repulsive interaction
between vacancies [163]. In that regard it is worth discussing the mechanism invoked
for the reductive coupling of carbonyl reactions in general. Organometallic chemists
have studied this reaction in details. This reaction is also known as McMurry reaction
[132] although several variants of it have also been reported in particular by Lippard
group [164]. Based on crystal structure and spectroscopic and kinetic methods two
following mechanisms have been identified:
C=OR
R1
[M] M – O – C R
R1
.
[M] – O – C - C – O – [M] R
R1
R
R1C=C
R
R1
R
R1
[M]=CR
R1O=C
R
R1
reduction
reduction1
2reduction
where [M] is a zero-valent metal. The net reaction involves the loss of four electrons
from the surface (or the compound) reducing the carbonyl compound to the
symmetric olefin. The radical species has been observed in numerous works [132,
165]. It has to be stressed that these two mechanisms exist depending on the nature of
the metal and the reaction conditions. In the case of M = Ti mechanism 1
predominates, while when M = W or U mechanism 2 is observed. It is clear that both
mechanisms require heavily reduced metals and strong π - d orbital interactions. Our
57

present work indicates that the reductive coupling on the heavily reduced TiO2(110)
surface is efficient. Based on our spectroscopic results this reaction most likely
involves diolate type species as the intermediate (mechanism 1). This species can be
formed not only via adsorption of two CH2O molecules on adjacent O vacancies as
described above, but also probably via activation of formaldehyde on single O
vacancy sites. A schematic representation of the latter process is shown in Scheme 4.1,
with details as follows:
SCHEME 4.1
CHH
[001][110]
A. Oxygen point defects (represented by an open square) have been
reported to involve two Ti atoms each with a +3 oxidation state. These two Ti
atoms are however not equivalent: one is along the [001] direction (formerly
O O
O +
CH H
2 HCH A
B
C
. .O O
CHH
CHH
Ti Ti Ti Ti Ti
O
Ti Ti
O
O O
Ti Ti Ti Ti Ti
O
Ti Ti
O
O OC
HHC
H H
O O
Ti Ti Ti Ti Ti
O
Ti Ti
O
D
CHH
CH H
O OO OTi Ti Ti Ti Ti
O
Ti Ti
O
CH
HC
HH
O OO O O
Ti Ti Ti Ti Ti
O
O O
Ti Ti
O
Ti Ti Ti Ti Ti Ti Ti
E
FOO O
58

six-fold coordinated to oxygen atoms) and the other is a Ti five-fold
coordinated along the [110] direction [166].
Formaldehyde preferentially adsorbs on these oxygen defects along the [001]
direction. The adsorption of formaldehyde leads to the possible formation of a
radical species as previously identified by EPR over Ti complexes for the
same reaction [165].
B. The reaction of the initially adsorbed formaldehyde with an adjacent
bridging oxygen atoms leads to the formation of a dioxy-methylene species
(-OCH2O-). These species has been observed from formaldehyde over several
metal oxides by FTIR [167] and are postulated as reaction intermediate for the
coupling of formaldehyde to ethylene over reduced TiO2(110) surface [151].
C. The diffusion of these species is facilitated at higher temperatures and
would involve the breaking and making of one carbon-oxygen bond.
D. The reaction of two adjacent species would result in the formation of a
diolate species.
E. Upon further heating, breaking of two carbon-oxygen bonds, facilitated
by the energy gained to oxidize the surface, would lead to the formation of
ethylene that desorbs from the surface instantaneously.
Finally, an additional weak desorption peak of ethylene is observed in the TDS data at
around 160 K (see Fig. 4.8), indicating that the reductive reaction of CH2O to C2H4
occurs also in the low temperature region. This finding may indicate the existence of
more active defect sites on TiO2(110) such as lattice O vacancies created by Ar+
sputtering.
In summary, formaldehyde adsorption on perfect and defective TiO2(110) surfaces
has been studied by TDS and HREELS. On the perfect TiO2(110) surface, it was
found that adsorption of CH2O at 100 K leads to physisorbed CH2O and
polymerization of CH2O yielding paraformaldehyde. The latter is bound to the surface
via O-Ti bonds at the five-fold coordinated surface Ti5c ions. Upon heating the
paraformaldehyde oligomer chain decomposes and releases CH2O. On defective
surfaces, created by both over-annealing or Ar+ sputtering, formaldehyde is more
59

strongly adsorbed at O vacancy sites. For the sputtered surface a reaction intermediate
species, diolate (-OCH2CH2O-), is clearly identified by HREELS. The observed
vibrational frequencies are in good agreement with those obtained by DFT
calculations. Upon heating a reductive reaction takes place to form ethylene which
desorbs from the surface. Further studies for other organic molecules on TiO2(110)
are needed in order to elucidate whether similar carbon-carbon coupling reactions
forming olefins take place at the reduced sites, surface oxide vacancies. In addition,
our results demonstrated that HREELS is not only a powerful method to study
adsorption and reaction of molecules at perfect oxide surfaces, but also can be used to
characterize the interaction of adsorbates with defect sites.
4.2 H adsorption on the TiO2(110) surface
In this work, we devoted much effort to the explanation of the experimental
observation by both STM and HREELS that H adsorbed on TiO2(110) surface prefers
to diffuse into the bulk. Atomic hydrogen was used during exposure on account of the
extremely small sticking coefficient of molecular hydrogen. After exposing 2000 L
atomic hydrogen to TiO2(110) surface, the STM images showed that the surface was
covered by 66% OH on bridge oxygen rows. At the same time, the stretching
vibrational mode of the OH species, ν(OH), was observed in HREEL spectra. But in
the sequent TDS experiments, nearly no H2 (or H2O) could be detected, and after that
no ν(OH) could be observed in HREELS. A conclusion was drawn that the hydrogen
atoms of surface hydroxyl groups diffuse into the bulk during heating process. The
theoretical works by DFT calculations further supported this conclusion and claimed
that the reason is attributed to the smaller activation barrier for H diffusion into TiO2
bulk than that for desorption as H2. In addition, the existence of subsurface H was also
observed by theoretical [168] and STM works [169].
Hydroxyl groups formed on TiO2(110) surface was thought to be important for a
number of applications, including the photo-catalysis where the light is converted to
60

chemical energy by photo-induced cleavage of water to O2 and H2 [112].
Unfortunately, the structure and properties of hydroxylated TiO2(110) are still not well
understood. Experimentally, hydroxyl groups can be formed by exposing TiO2(110)
surface to either water or atomic hydrogen. For the water adsorption, the hydroxyl
groups are created through water dissociation at bridge oxygen vacancies [95, 110,
156]. A large amount of hydroxyl groups seems unlikely since the oxygen vacancies
on the TiO2(110) surface are not abundant due to the nice electrostatic stability of this
surface. A previous STM study reported a disordered hydroxyl coverage of 0.25 ML
on the TiO2(110) surface by exposing the surface to atomic hydrogen [170]. However,
a recent helium atom scattering (HAS) study revealed an ordered (1×1) hydroxyl
adlayer [153]. This inconsistency is surprising since the TiO2 has been received much
experimental and theoretical studies in recent years.
In order to get a deeper understanding on the structure and properties of hydroxylated
TiO2(110) surface, several experimental methods including TDS, HREELS and STM
were carried out on atomic hydrogen exposed TiO2(110) surface. Additionally, a
detailed theoretical study was also performed on this system.
The STM experiments were conducted in a two-chamber SEM/STM system (JEOL,
JSPM-4500S) [73]. The HREELS (Delta 0.5, SPECS, Germany, nominal resolution 1
meV) and TDS experiments were performed in a separate UHV system. The TiO2(110)
samples used in this study were cleaned using cycles consisting of 20 min Ar+
sputtering (800-1000 eV) at room temperature (RT) and 30 min annealing (850-900
K). The samples had a dark blue color, indicating a slight O-deficiency. The details on
H exposure can be found in Ref. [171]. Relative H atom exposures are given in L (1
Fig. 4.10 Stick-and-ball model of the bulk-truncated TiO2(110) surface.
61

Langmuir = 1.33 × 10⁻⁶ mbar·s) assuming that the H atom flux is proportional to the
H2 total pressure (1×10⁻⁷ - 4 × 10⁻⁶ mbar). Periodic DFT slab calculations have been carried out using the VASP program [172-174]. The core electrons are described by pseudopotentials whereas a plane-wave basis set (cutoff 400 eV) represents valence electrons. The PW91 functional is used. A four TiO2-layer thick slab is used to model the surface (see Fig. 4.10); the two uppermost layers are allowed to relax. The optimized bulk values are used as slab cell parameters (aslab = cbulk = 2.964 Å, bslab =√2abulk = 6.507 Å). Hydrogen adsorption is modeled by adding neutral H atoms to one side of the slab. A thicker slab fully optimized has been utilized for modeling diffusion processes (see
below).
Fig. 4.11 (a, b) STM images of the TiO2(110)-(1×1) surface determined with sample bias voltages of (a) 2.0 V, (b) 1.3 V. Tunneling current was set at 0.05 nA. Inset in (b): a high resolution image, tunneling conditions: 1.5 V and 0.35 nA; (c, d) STM images of the TiO2(110)-(1×1) surface after exposure to atomic hydrogen with different H2 dosing amounts: (c) ~ 150 L H2 and (d) ~1200 L H2. Tunneling conditions: 2.0 V, 0.05 nA in (c) and 2.0 V, 0.02 nA in (d). Adapted from reference [175].
Fig. 4.11 shows a series of typical STM images of a clean TiO2(110)-(1×1) substrate.
Bright lines along the [001] direction correspond to the rows of 5-fold coordinated Ti
atoms [176, 177]. The inset in Fig. 4.11(b) demonstrates atomic resolution also along
the [001] direction. There are three kinds of atomic scale features in Fig. 4.11a,
denoted by ‘A’, ‘B’ and ‘C’. Type A features are of uniform size and are invisible at
low bias voltages [170] (see Fig. 4.11b) and are, in accordance with previous work,
assigned to hydroxyls formed by the dissociation of water molecules from the residual
gas [170, 178]. Type B features are located on Ti rows and are assigned to subsurface
defects [177]. Type C features bridge two neighboring Ti rows and are attributed to
oxygen vacancies.
62
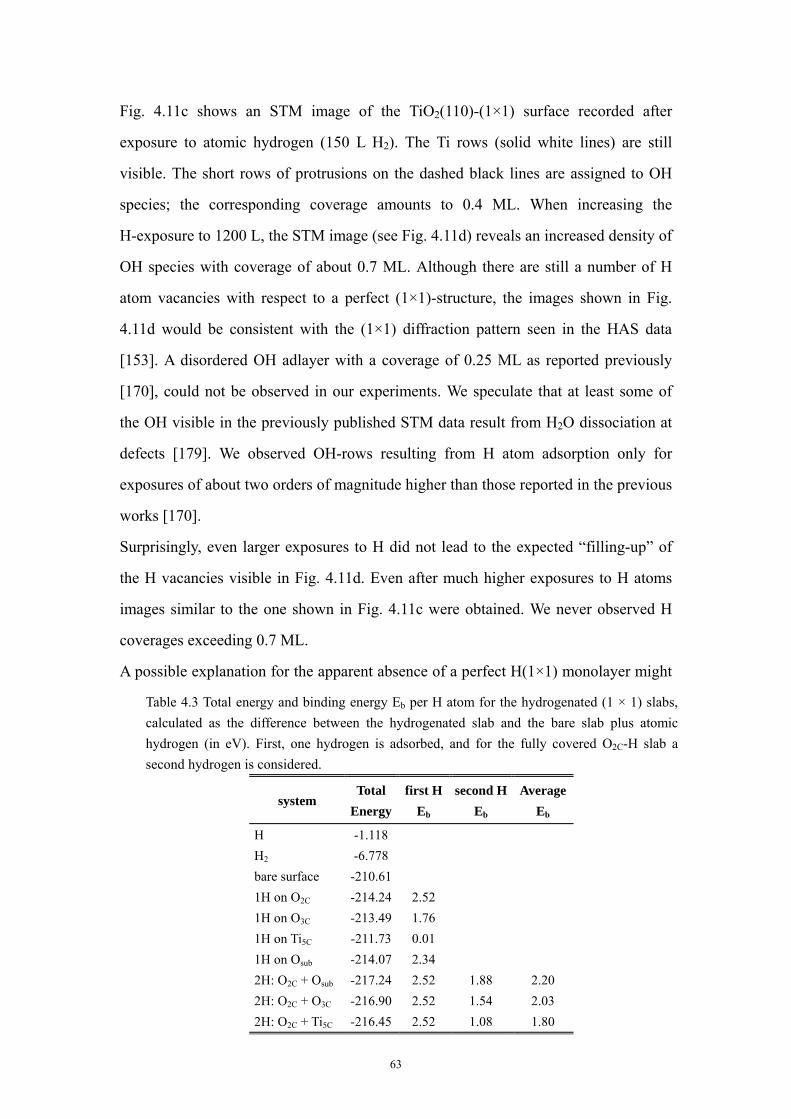
Fig. 4.11c shows an STM image of the TiO2(110)-(1×1) surface recorded after
exposure to atomic hydrogen (150 L H2). The Ti rows (solid white lines) are still
visible. The short rows of protrusions on the dashed black lines are assigned to OH
species; the corresponding coverage amounts to 0.4 ML. When increasing the
H-exposure to 1200 L, the STM image (see Fig. 4.11d) reveals an increased density of
OH species with coverage of about 0.7 ML. Although there are still a number of H
atom vacancies with respect to a perfect (1×1)-structure, the images shown in Fig.
4.11d would be consistent with the (1×1) diffraction pattern seen in the HAS data
[153]. A disordered OH adlayer with a coverage of 0.25 ML as reported previously
[170], could not be observed in our experiments. We speculate that at least some of
the OH visible in the previously published STM data result from H2O dissociation at
defects [179]. We observed OH-rows resulting from H atom adsorption only for
exposures of about two orders of magnitude higher than those reported in the previous
works [170].
Surprisingly, even larger exposures to H did not lead to the expected “filling-up” of
the H vacancies visible in Fig. 4.11d. Even after much higher exposures to H atoms
images similar to the one shown in Fig. 4.11c were obtained. We never observed H
coverages exceeding 0.7 ML.
A possible explanation for the apparent absence of a perfect H(1×1) monolayer might
Table 4.3 Total energy and binding energy Eb per H atom for the hydrogenated (1 × 1) slabs, calculated as the difference between the hydrogenated slab and the bare slab plus atomic hydrogen (in eV). First, one hydrogen is adsorbed, and for the fully covered O2C-H slab a second hydrogen is considered.
system Total
Energyfirst H
Eb
second HEb
Average Eb
H -1.118 H2 -6.778 bare surface -210.61 1H on O2C -214.24 2.52 1H on O3C -213.49 1.76 1H on Ti5C -211.73 0.01 1H on Osub -214.07 2.34 2H: O2C + Osub -217.24 2.52 1.88 2.20 2H: O2C + O3C -216.90 2.52 1.54 2.03 2H: O2C + Ti5C -216.45 2.52 1.08 1.80
63

be that the impinging H atoms also form Ti-H species, which then block adjacent O
adsorption sites (and which may not be seen in the STM data). In order to test this
hypothesis we have calculated the binding energy Eb of one atomic hydrogen atom
bonded to different surface sites in a (1×1) unit cell (Table 4.3). The surface sites
considered are the bridging O2C, 3-fold O3C, under-coordinated titanium Ti5C and a
subsurface Osub. The calculations reveal that the O2C-H, which is tilted in the [110]
direction, is the most stable species (Eb = 2.52 eV), followed by Osub-H (2.34 eV)
O3C-H (1.76 eV) and Ti5C-H (0.01 eV). Next, we considered the presence of two H
atoms in the unit cell, with one of them occupying a O2C site. Also in this case the
Ti-H species is the least favorable H-containing surface species, the binding energy of
the second H atom being Osub-H (1.88 eV), O3C-H (1.54 eV) and Ti5C-H (1.08 eV).
Fig. 4.12 (a) HREELS spectra recorded for the clean TiO2(110) surface (curves A and B) andafter exposure to 2000 L atomic hydrogen at room temperature and subsequent annealing tothe indicated temperatures (curves C-F). Curve A displays the raw spectrum, and theFourier-deconvoluted spectra are shown in curves B-F. (b) TDS data recorded after exposingthe clean TiO2(110) surface to 2000 L atomic hydrogen at 300 K (curve A: H2, curve B: H2O)and after exposing the room temperature hydrogenated surface to 50 L CO at 95 K (curve C:CO).
The absence of Ti-H species is confirmed by the results of vibrational spectroscopy.
Fig. 4.12(a) shows the HREELS data for the clean TiO2(110) surface recorded at room
64

temperature. Curve A presents the raw spectrum that is dominated by the intense
primary phonon losses (45, 55 and 94 meV) as well as their combination and multiple
excitations [110]. After exposing the TiO2(110) surface to 2000 L atomic hydrogen at
room temperature a new loss at 456 meV (curve C) is observed, which can be
unambiguously assigned to the O-H stretching mode. The frequency is in fact rather
similar to the corresponding species on a ZnO(1010) surface [93].
Despite significant effort no Ti-H stretching modes could be observed in the HREELS
data, indicating that no surface Ti-H species are formed when exposing to H-atoms at
room temperature. This conclusion is corroborated by the following coadsorption
experiment: The TiO2(110) surface was first saturated by atomic hydrogen at room
temperature. When this surface was subsequently exposed to 50 L of CO at 95 K, the
corresponding TD spectrum (curve C in Fig. 4.12(b)) exhibits a desorption peak at
129 K, revealing that CO is adsorbed on the hydroxylated TiO2(110) surface at 95 K,
thus confirming that the Ti sites are available for CO adsorption.
At this point we conclude that there is only one H containing species on the surface,
the bridging O2C-H hydroxyl group. There are no Ti-H species on the surface, which
is consistent with expectations for this easily reducible oxide [180, 181]. Note that on
more irreducible metal oxide surfaces like ZnO metal-H species have been observed
[93]. The possibility that the presence of Ti-H species prohibits the completion of the
OH(1 × 1)-adlayer can thus be safely ruled out.
When trying to obtain independent information from thermal desorption spectroscopy,
TDS, a second disturbing observation was made. TDS data recorded after exposing
TiO2(110) to 2000 L of atomic H at room temperature show no signs of H2 or H2O
desorption (see curves A and B in Fig. 4.12(b)). This is in pronounced contrast to H
adsorption on metals [182] and on other oxides, where corresponding H2 or H2O
desorption maxima could be clearly observed in TDS [93, 183].
Upon heating the H atoms clearly leave the surface (as seen by HREELS and HAS).
Since we can rule out desorption, the only way to rationalize our findings is to
propose that the H atoms migrate into the bulk and thus “disappear” from the
65

detection zone of the surface sensitive techniques. This is a rather unexpected finding
which, if true, would have important consequences for the technical applications of
TiO2.
Fig. 4.13 (a) Side view of the (1 × 1) unit cell used to calculate the insertion of H in rutile TiO2, bridging hydroxyl O2C-H group is always present; (b) Energy profile for H penetration from the surface O3C to internal cavities I to IV, in eV. Selected structures for minima (bottom) and transition structures (top) are shown. In parentheses the energy values relative to the starting point (bottom), in square brackets the barriers (top). The x axis shows the vertical z position relative to the initial O3C-H position, in Å. The y axis show energy relative to the starting point. Adapted from reference [175].
The DFT results for H binding energies listed in Table 4.3 clearly demonstrate that the
subsurface Osub-H is a rather stable species. In order to obtain estimates on the
activation energy required for subsurface migration we carried out a detailed
theoretical analysis using TiO2 slabs with a considerable larger thickness (8 layers)
with all surface O2C sites hydroxylated. When a second H atom was placed initially on
the surface O3C site, and then moved towards the cavities I, II, III and IV (see Fig.
4.13) the potential energy diagrams depicted in Fig. 4.13 were obtained. Two
observations are important: First, the total energies are all lower than those on the
surface and second, the corresponding activation energy is 1.11 eV. The fairly large
binding energy of H atoms in the bulk can be rationalized by considering the
formation of hydrogen bonds with the other oxygens inside the cavity; such
stabilizing interactions are, of course, absent at the undercoordinated surface sites. A
more detailed account of these effects will be provided in a future publication.
66

Altogether these results confirm the stability of subsurface hydroxyls and the
corresponding relatively low activation energies for migration of H into the bulk can
explain the experimental TDS findings. Note, that there are a few accounts of
hydrogen incorporation into a rutile TiO2 lattice [184-186].
It remains to explain why the H atom coverage cannot exceed a critical value and
form a perfect (1×1) adlayer as in the case of H on other oxide surfaces (e.g.
ZnO(1010), [73]). Since site-blocking by the formation of other surface species can
be ruled out (see above) another likely explanation could be that repulsive interactions
between adjacent OH species limit the maximal coverage. Indeed, calculations for
larger unit-cells simulating H coverages from 0.5 ML to 1.5 ML reveal a pronounced
decrease of the H atom binding energy with coverage. When using the DFT
calculations in the framework of a thermodynamic analysis [187], considering the
equilibrium between adsorbed H-atoms and H2 molecules in the gas phase, we find
that for the experimental conditions (300 K and 10-6 mbar of H2 pressure) the
coverage is predicted to be 0.66 ML, in good agreement with the experimental
observations.
In conclusion, a combined experimental and theoretical approach has been used to
gain insight into the behavior of hydrogen atoms on TiO2(110) surface. Exposing
TiO2(110) to atomic H yields a quasi (1×1) adlayer consisting of 0.66 ML hydroxyl
groups. Heating of the hydroxylated sample does not lead to recombinative desorption
of H2 (or H2O) molecules, but to a migration of H atoms into the TiO2 bulk, as
demonstrated by TDS and HREELS results. This finding is supported by
DFT-calculations, which reveals the presence of an activation barrier of 1.11 eV for
migration into the bulk, in contrast to the recombinative desorption barrier as H2 of
2.64 eV.
Still, there are some underlying problems in this system not well understood:
(a) No H2 desorption was observed throughout the experiments even after the sample
was heated to 900 K. This temperature is high enough to overcome the possible
67

desorption barrier of 2.26 eV/molecule. Moreover, the diffusion to TiO2 bulk and
desorption (let's say two sides of one reaction pathway) would be non-equilibrium
since on the vacuum side the product can be removed quickly and can't re-adsorb
on the surface.
(b) If the atomic hydrogen adsorbs on bridge oxygen sites to form hydroxyl species,
where does the electron of atomic hydrogen go? It is known that the bridge
oxygen on TiO2(110) has no unfilled bonding orbitals to accept electron If the
electron goes to the 3d orbital of Ti5C or Ti6C, an 2-D metallic character would be
presented on the surface because the conduction band of TiO2 is mainly
contributed by Ti 3d orbitals [188, 189].
(c) Chemically, there should be no difference between hydroxyl group formed by
atomic hydrogen adsorption on Obr sites and by H2O dissociation at bridge oxygen
vacancies. Also, as described in paper, the less than monolayer (66%) coverage is
due to the repulsion force between hydroxyl groups. This means the hydroxyl
group formed by H2O dissociation on 4% oxygen vacancies would have higher
binding energy. Indeed, a small amount of H2O desorpiton can be detected in the
TDS experiments for H2O adsorption on TiO2(110). In principle the adsorbed
species with lower binding energy would desorb first, which means the 66%
hydroxyl groups would be more like to desorb as H2O since we have observed the
H2O desorption from the small coverage of hydroxyl.
(d) It is more reasonable to compare the calculated diffusion barrier with the
activation barrier for desorption as H2O, but not as a H2.
68

5. Small molecular adsorbates on ZnO(0001)
As a polar surface, ZnO(0001) exhibits much complexity in surface structure. Many
structural models have been proposed to explain experimental observations (as will be
discussed below). In addition, atomically resolved images of this surface are still
rarely reported due to either the experimental difficulties or the complex structure of
this surface [190-193]. But one consistency in experimental work is the existence of
abundant of oxygen vacancies on this surface. In this chapter, I present the work on
the structure of ZnO(0001) surface, and H2, HCOOH and CO2 adsorption on the
ZnO(0001) surface.
Fig. 5.1 Stick-and-ball model of the wurtzite ZnO structure from a perspective view.
5.1 The structure of the ZnO(0001) surface
Fig. 5.1 shows the perspective view of the wurtzite ZnO bulk structure. Along the
[0001] direction, the structure can be characterized by the repeating-stack of Zn-O
double layers. The difference of the charge between oxygen and Zn layers lead to a
dipole moment in the Zn-O double layers. The in-plane dipole moment can be
compensated by the neighbor double layers, while the out-of-plane dipole moment
69

will diverge with increasing layer number [194, 195]. As a result, a macroscopic
dipole moment builts up along the [0001] direction cross the crystal. This
macroscopic dipole moment can essentially elevate the Madelung potential of two
surfaces termination, namely, the oxygen terminated surface O-ZnO(0001) and the Zn
terminated surface Zn-ZnO(0001). Energetically, this elevated Madelung potential
possibly (not necessarily) causes the instability of the two polar surfaces. Several
spontaneous reactions of the surface can occur to diminish the Madelung potential
[194, 195]: (a) adsorption of charged ions. (b) charge transfer between two
counterpart polar surfaces. (c) surface reconstructions (including the formation of
disordered steps).
The research interest in the structure of these two polar ZnO surfaces perhaps comes
from the existence of a non-negligible fraction of these two polar surfaces in ZnO
powders, which means they are quite favorable in nature. The study ofsuch polar
surfaces is also an interesting fundamental problem. The O-ZnO surface was
investigated by STM and found be unreconstructed with no significant defect
concentration [192]. The further study by surface X-ray diffraction (SXRD) and ab
initio calculation attributed the unreconstructed structure to the surface relaxation and
charge transfer between the two polar surfaces. It was speculated that, as a result of
the charge transfer, the two polar surfaces exhibit metallicity [196]. But, unfortunately,
the surface metallic character was not approved by HREELS experiment under H free
conditions, in which a significant broadening of the quasi-elastic peak due to the
excitation of free charge carriers in subsurface region would be expected [105].
Furthermore, a photoluminescence (PL) combined with surface Kelvin probe (SKP)
study observed a strong spontaneous polarization along [0001] direction and just a
small difference of the band bending of the (0001) and (0001) surfaces of ZnO [197].
The authors claimed that the charge transfer between two surfaces is not the dominant
contribution to the stabilization of the two polar surfaces. Also, a DFT study showed a
strong contraction of the topmost Zn-O double layers on both sides [198]. Although
consistent with the result on the ZnO(0001) surface, it deviated on ZnO(0001) surface
70

for which STM has shown a different stabilization mechanism by forming triangular
islands and holes [199, 200], which means the charge transfer mechanism alone is not
adequate to understand the stabilization mechanism of these two polar surfaces.
A very surface sensitive technique, helium atomic scattering (HAS), was also
performed on ZnO(0001) surface. Different from the preview work, it showed a (3×1)
reconstruction on the clean surface [28, 106, 107]. Later, by using CO as a probe
molecule, it was claimed that the ZnO(0001) is either reconstructed or hydrogen
covered [201]. In addition, the hydroxylated ZnO(000 1 ) surface shows high
resistance to hydrogen etching that occurs on other ZnO surfaces [202], which might
be due to the high stability of hydroxyl groups on this surface. Note also that a (1×1)
OH covered surface is suggested to be thermodynamically unfavorable, and half
monolayer of OH coverage with formation of (2×1) superstructure was calculated to
be the most thermodynamically stable phase [203]. The experimental observation of a
(1×1) OH covered surface could be explained by a kinetic stabilization mechanism
[106, 107].
The experimental observation of (3×1) superstructure of clean ZnO(0001) surface is
difficult since such a surface is so reactive that H2O in UHV can adsorb on the surface
very fast to cure the reconstruction. This was confirmed by X-ray photoelectron (XPS)
experiment that the O1s curve always shows signal from OH species under the
common preparation condition [72, 204]. The observation of H-free O1s signal can
only be achieved under very careful preparation condition [106]. In addition, a DFT
calculation of the phase diagram of ZnO(000 1 ) with oxygen and hydrogen
atmosphere also proposed that a defect free surface is only possible under the
condition of high oxygen partial pressure with nearly no presence of hydrogen [203].
In this work, we provide additional evidence for the existence of a clean, H-free and
(3×1) reconstructed ZnO(0001) surface.
The first evidence is from the LEED results shown in Fig. 5.2. The clean ZnO(0001)
71

(3X1) (1X1) Fig. 5.2 LEED pattern of clean surface (left panel) and H2O or H covered ZnO(0001) surface (right panel) recorded at 100 K. The energy of incident electrons is 72 eV for both LEED experiments.
surface shows a hexagonal structure with (3×1) reconstruction (Fig. 5.2, left panel).
The different symmetry of LEED pattern (6-fold) and ideal ZnO(0001) surface
(3-fold) was explained by presence of single height steps (double layer) [205]. This
explanation is also consistent with the HAS result that abundant of steps are presented
on the ZnO(0001) surface [206]. By exposing the clean surface to H2O or atomic H
(Fig. 5.2, right panel), the (3×1) LEED pattern turns to (1×1). And if the clean surface
is left under UHV condition for some time (e.g. 1×10⁻¹⁰ mbar for 1 h), the (3×1)
pattern becomes undistinguishable and (1×1) is more likely formed. The (3×1)
reconstruction could be achieved by removing of one row of oxygen in every three
oxygen rows, although other mechanism such as presence of (3×1) step is also
possible to result in the (3×1) LEED pattern.
HREELS experiments were also performed on clean and H2O covered ZnO(0001)
surface. Fig. 5.3(a) shows the HREELS results on the clean, (3×1) reconstructed
ZnO(0001) at room temperature. No loss feature can be detected related OH species.
In contrast, as shown in Fig. 5.3(b), very intense loss feature located at around 449
meV shows up after 2 L H2O adsorption. The loss feature at 449 meV can be assigned
to the stretching vibrational mode of OH, ν(OH). Since other H2O related loss
features are presented in the HREEL spectrum, we can assign the loss feature at 449
meV to ν(OH) of the isolated OH, which further indicates a dissociative adsorption of
H2O molecules at oxygen vacancies. In addition, on the clean surface a small loss
feature at around 45 meV is observed which was assigned to the vibrations of
defective sites [207]. After exposing to 2 L H2O, the loss peak disappears, which
72

confirms deduction of dissociative adsorption of H2O at defective sites. The HREEL
spectra on the atomic hydrogen covered ZnO(0001) is not shown here due to the
relative poor spectrum quality caused by the metallization effect upon atomic
hydrogen adsorption, the LEED pattern of which also exhibits the same (1×1)
structure for the H2O covered surface.
Fig. 5.4 presents the TDS results of H2O adsorbed on the ZnO(0001) surface. Three
H2O desorption peaks are observed at 418 K, 615 K and 710 K respectively. No H2
desorption was detected in the measured temperature range from 300 K to 850 K. The
three different H2O adsorption peaks imply several different stable OH species formed
on the surface. Since 1/3 ML of oxygen vacancies are thought to be existing on the
0 100 200 300 400 500
H2O/ZnO(000-1) (1X1) Clean ZnO(000-1) (1X3)
X100
Energy Loss (meV)
Inte
nsity
(Arb
. Uni
t)
449X1 ν(OH)
(a)
(b)
Fig. 5.3 HREELS on (a) clean ZnO(0001) surface and (b) 2 L H2O covered surface at room temperature.
300 400 500 600 700 800
0,0
0,2
0,4
0,6
0,8
1,0
2 18
4 L H2O on ZnO(000-1) at RT
Inte
nsity
(Arb
. Uni
t)
Temperature (K)
710
615
418
Fig. 5.4 TD spectrum of 4 L H2O adsorbed on the ZnO(000 1 ) surface at roomtemperature. The heating rate is 1.5 K/s.
73
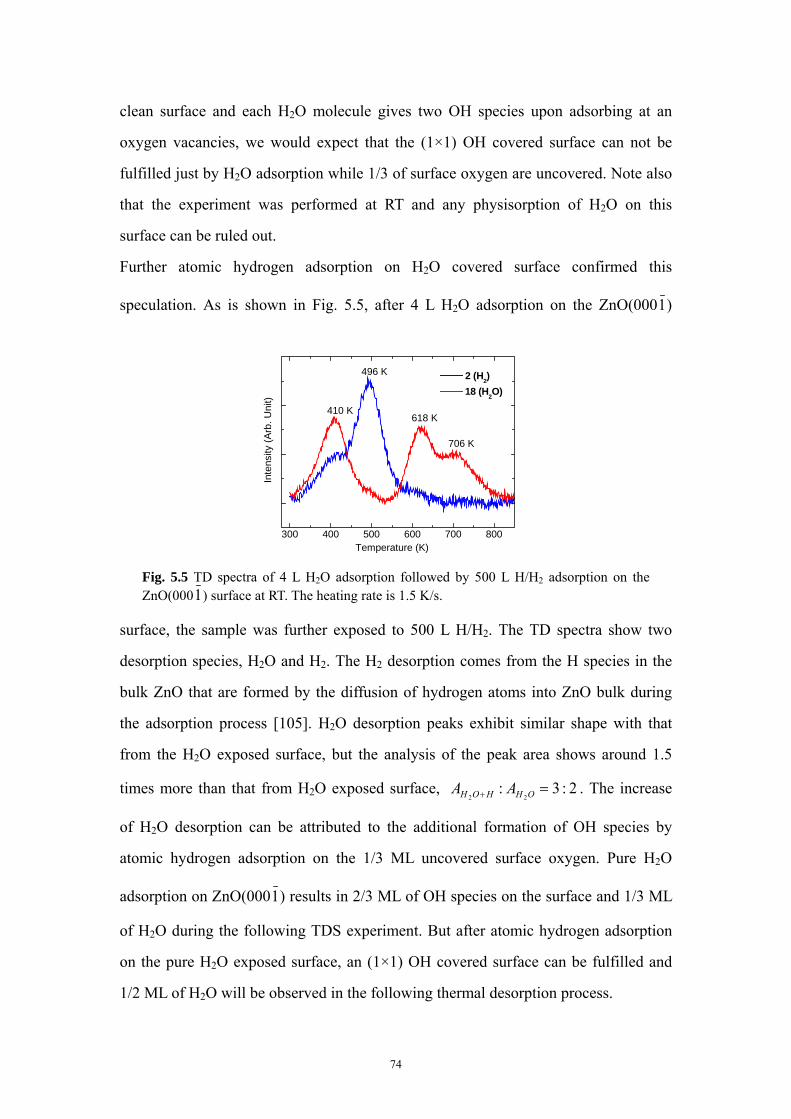
clean surface and each H2O molecule gives two OH species upon adsorbing at an
oxygen vacancies, we would expect that the (1×1) OH covered surface can not be
fulfilled just by H2O adsorption while 1/3 of surface oxygen are uncovered. Note also
that the experiment was performed at RT and any physisorption of H2O on this
surface can be ruled out.
Further atomic hydrogen adsorption on H2O covered surface confirmed this
speculation. As is shown in Fig. 5.5, after 4 L H2O adsorption on the ZnO(0001)
surface, the sample was further exposed to 500 L H/H2. The TD spectra show two
desorption species, H2O and H2. The H2 desorption comes from the H species in the
bulk ZnO that are formed by the diffusion of hydrogen atoms into ZnO bulk during
the adsorption process [105]. H2O desorption peaks exhibit similar shape with that
from the H2O exposed surface, but the analysis of the peak area shows around 1.5
times more than that from H2O exposed surface, 2:3:22
=+ OHHOH AA . The increase
of H2O desorption can be attributed to the additional formation of OH species by
atomic hydrogen adsorption on the 1/3 ML uncovered surface oxygen. Pure H2O
adsorption on ZnO(0001) results in 2/3 ML of OH species on the surface and 1/3 ML
of H2O during the following TDS experiment. But after atomic hydrogen adsorption
on the pure H2O exposed surface, an (1×1) OH covered surface can be fulfilled and
1/2 ML of H2O will be observed in the following thermal desorption process.
300 400 500 600 700 800
2 (H2) 18 (H2O)
Temperature (K)
Inte
nsity
(Arb
. Uni
t)
410 K
496 K
618 K
706 K
Fig. 5.5 TD spectra of 4 L H2O adsorption followed by 500 L H/H2 adsorption on theZnO(0001) surface at RT. The heating rate is 1.5 K/s.
74

Combining the results from LEED, HREELS and the ratio of in
TDS experiment, we conclude that the clean, H-free and (3×1) reconstructed
ZnO(000
2:3:22
=+ OHHOH AA
1) surface does exist.
Still, there are some points in this work not well understood:
(a) the explanation of (3×1) LEED pattern. From LEED pattern only the information
of surface periodicity can be obtained. The missing of 1/3 of oxygen rows would be
not the only possibility to yield (3×1) LEED pattern although a better understanding is
still scarce. Indeed, one previous work observed streak structure in LEED on the same
surface [208] and explained by the presence of two double Zn-O layers [205, 209].
Note also that this is different from the satellite diffraction spots observed in many
film/substrate systems due to the mismatch of lattice constant and multi-scattering
from large unit cell [210-212]. As a summary, although the streak structure in
previous work is different from the observation in this work, such effect should still
be considered when explaining superstructure in LEED on oxide surface.
(b) the transformation of LEED pattern from (3×1) to (1×1) is not exactly as
described in above paragraphs by exposing the clean surface to enough amount of
H2O or atomic H, but more like a trigger effect that a very small amount of H2O
exposure (smaller than 0.1 L) can dispel the (3×1) and form a sharp (1×1) LEED
pattern.
(c) the presence of three H2O desorption peaks perhaps is the evidence of (1×1) and
(2×1) stable phase of OH species although the (1×1) phase is thermodynamically
unstable. The high temperature peak at around 700 K is more reasonably to be
assigned to the OH species formed at step edges.
5.2 Hydrogen adsorption on the ZnO(0001) surface
In this work, the electronic effects of H atoms at interstitial sites in ZnO have been
investigated by high resolution electron energy loss spectroscopy (HREELS). A
75

reversible doping is achieved by exposing single crystalline (0001)-oriented ZnO
substrates to atomic hydrogen. At low temperatures, interstitial H atoms form shallow
donor states. At sufficiently high temperatures, the electrons are excited into the
conduction band. We use EELS to demonstrate the presence of plasmons resulting
from this finite density of charge carriers in the conduction band. Above temperatures
of 100 K, a strong, plasmon-induced broadening of the quasielastic peak in the
HREELS data is observed. The analysis of the temperature dependence yields a donor
level ionization energy of 25 ± 5 meV
Undoped ZnO exhibits n-conduction properties, a fact that—despite numerous
experimental and theoretical studies [213-217]—is still not thoroughly understood. It
has long been known that the incorporation of H atoms in the bulk increases the
electrical conductivity of ZnO. In fact, ZnO can be used as a detector for hydrogen
atoms [218-221]. From the temperature dependence of the electrical conductivity, it is
thought that the incorporation of H atoms at interstitial sites gives rise to shallow
donor states with an ionization energy of 51 meV [222]. This value, however, is not
consistent with donor activation energies of 35 ± 5 meV as obtained from electron
paramagnetic resonance (EPR) spectroscopy [215]. It has been proposed that the
electrical conductivity experiments are affected by other bulk defects such as oxygen
vacancies, which can also interact with H atoms and may have different effects.
The n-doping properties of H in ZnO have been corroborated by recent theoretical
work [213], where it was proposed that interstitial H atoms always act as donors in
ZnO. A reliable value for the ionization (or exciton binding) energy, however, could
not be obtained from these calculations.
The experiments were carried out in an UHV apparatus with a base pressure better
than 5×10-11 mbar, equipped with an HREEL spectrometer [190], LEED optics and a
mass spectrometer [88, 223]. The O-terminated ZnO(0001) surface (O-ZnO) was
prepared using sputtering and annealing cycles as described previously [106, 107].
The LEED pattern recorded for the clean O-ZnO surface exhibited (3×1)
76
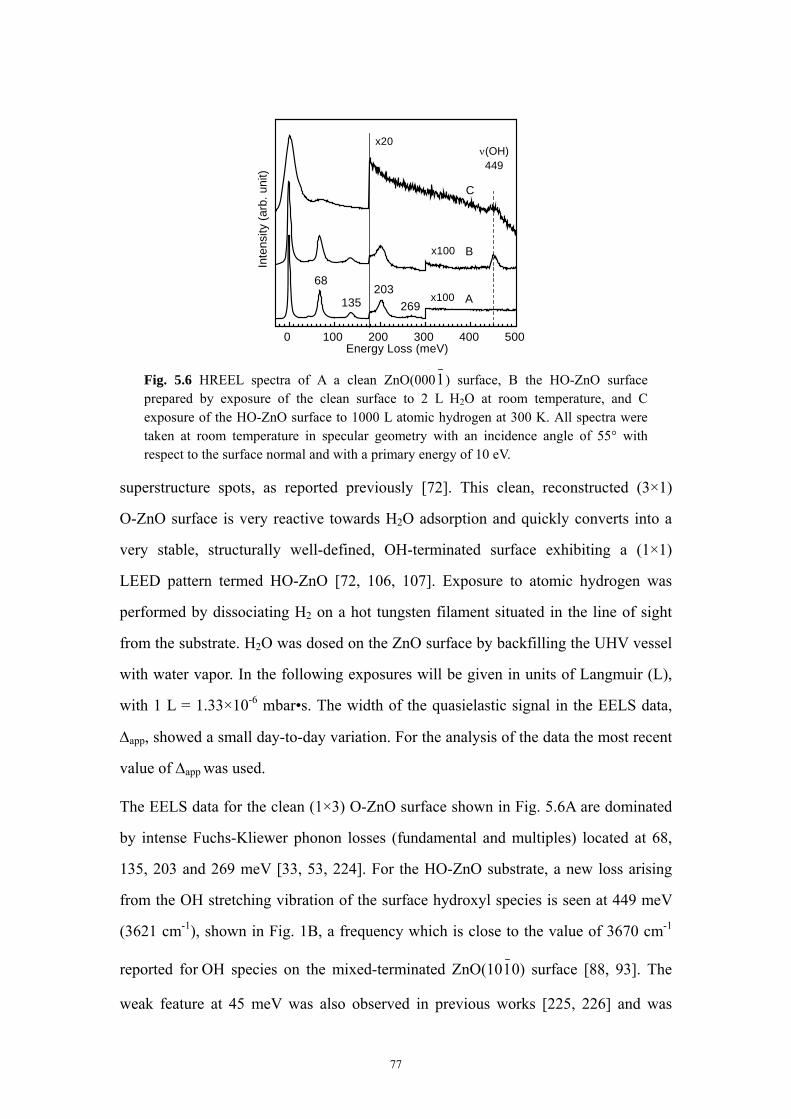
0 100 200 300 400 500
269135203
68
C
B
x20
x100
x100
Energy Loss (meV)
Inte
nsity
(arb
. uni
t)
ν(OH)449
A
Fig. 5.6 HREEL spectra of A a clean ZnO(0001) surface, B the HO-ZnO surfaceprepared by exposure of the clean surface to 2 L H2O at room temperature, and Cexposure of the HO-ZnO surface to 1000 L atomic hydrogen at 300 K. All spectra weretaken at room temperature in specular geometry with an incidence angle of 55° withrespect to the surface normal and with a primary energy of 10 eV.
superstructure spots, as reported previously [72]. This clean, reconstructed (3×1)
O-ZnO surface is very reactive towards H2O adsorption and quickly converts into a
very stable, structurally well-defined, OH-terminated surface exhibiting a (1×1)
LEED pattern termed HO-ZnO [72, 106, 107]. Exposure to atomic hydrogen was
performed by dissociating H2 on a hot tungsten filament situated in the line of sight
from the substrate. H2O was dosed on the ZnO surface by backfilling the UHV vessel
with water vapor. In the following exposures will be given in units of Langmuir (L),
with 1 L = 1.33×10⁻⁶ mbar•s. The width of the quasielastic signal in the EELS data,
Δapp, showed a small day-to-day variation. For the analysis of the data the most recent
value of Δapp was used.
The EELS data for the clean (1×3) O-ZnO surface shown in Fig. 5.6A are dominated
by intense Fuchs-Kliewer phonon losses (fundamental and multiples) located at 68,
135, 203 and 269 meV [33, 53, 224]. For the HO-ZnO substrate, a new loss arising
from the OH stretching vibration of the surface hydroxyl species is seen at 449 meV
(3621 cm-1), shown in Fig. 1B, a frequency which is close to the value of 3670 cm-1
reported for OH species on the mixed-terminated ZnO(1010) surface [88, 93]. The
weak feature at 45 meV was also observed in previous works [225, 226] and was
77
attributed to a vibrational mode localized at defects.
For the spectrum shown in Fig. 5.6B recorded for the HO-ZnO surfaces, the full width
at half maximum (FWHM, Δtot) of the quasielastic peak is equal to 6 meV, slightly
larger than the FWHM of the resolution of HREELS apparatus, 4 meV, as determined
in experiments on a clean Pt(111) substrate. Similar broadenings of the quasielastic
signal in EELS have been observed for other semiconductors, Si [51, 227], GaAs [50]
and Ge [228]. In following these previous works we attribute the broadening of Δtot
seen for ZnO substrates to an interaction of the incident electrons with plasmons in
the semiconductor (SC) substrates. Compared to a metal the carrier density in a SC is
quite low, leading to plasmon energies in the meV-regime. Persson has derived an
elegant formula [51] relating the broadening Δ (given by Δtot2=Δapp
2 + Δ2) to
experimental parameters, the carrier density nc and the substrate temperature T:
αωπ ω cos11
24 /
222⎥⎦⎤
⎢⎣⎡ +
−=Δ Tksp bspe
Ch
(5.1)
with 0
2
1cos
11
14ka
Cαεπ +
=
and
ε
ωω
+=
1p
sp and 2
*0
cp
n em
ωε
= (5.2)
with ε the relative dielectric constant (4.6 for ZnO [229]), k the wave vector of the
incident electron, a0 the Bohr radius, m* the effective mass of electrons in ZnO (0.19
me for ZnO [230]), ε0 the vacuum dielectric constant, kb the Boltzmann constant, ωsp
and ωp are the surface and bulk plasmon frequencies, respectively, and α the electron
angle of incidence (55°).
From (5.1) and our experimental parameters and the materials constants for ZnO we
obtain a carrier density of 9×1013 cm-3, a reasonable low value for a clean ZnO
substrate. Upon exposing the HO-ZnO surface to atomic hydrogen (see Fig. 1C), Δtot
strongly increases. No indications of additional individual losses could be detected in
78

the EELS data. In particular, we were unable to detect Zn-H vibrations, which have
been observed at around 200 meV (1613 cm-1) on other ZnO surfaces [93]. This is
expected, since according to the current structural models for this surface [72] the
HO-ZnO surfaces does not expose Zn atom. The increase of Δtot was found to be
completely reversible: Heating the ZnO specimen (and thus removing the H atoms)
reduced Δtot to its original value. We did not observe any indication of a band arising
from bulk OH stretching vibrations at about 3327 cm-1, which has been detected in IR
transmission experiments [231].
A similar broadening upon exposure to atomic H has been reported for the ZnO(1010)
surface, where the broadening was linked to the formation of a partially filled,
H-induced electronic surface state [93]. In the present case, however, the surface is
already hydroxylated and fully oxidized prior to H atom exposure. DFT calculations
have shown that the surface hydroxylation is the most efficient means to stabilize the
300 400 500 600 700 800
m/e=18
(b)
Inte
nsity
(Arb
. Uni
t)
Temperature (K)
HO-ZnO
HO-ZnO + H
HO-ZnO
HO-ZnO + H
m/e=2(a)
Inte
nsity
(Arb
. Uni
t)
Fig. 5.7 (a) Thermal desorption spectra for m/e=2, representing H2, of the HO-ZnOsurface (prepared by exposure to H2O) before (solid cycles) and after (hollow cycles)exposure to 1000 L atomic H. (b) same as (a) but for m/e=18, representing water.The heating rate was 1.5 K/s.
79

polar surface termination of O-ZnO [232]. The complete hydroxylation of the
HO-ZnO surface has been demonstrated by a study of CO adsorption on this surface
[233] and is further evidenced by the presence of the OH stretching mode and the
absence of any other features in the EELS data after H exposure.
The only possibility to explain our experimental observation is that the H atoms
impinging on the HO-ZnO substrate diffuse into the bulk, forming H interstitials in
the subsurface region. Their presence is clearly revealed by thermal desorption
spectroscopy (TDS). As shown in Fig. 5.7(a), after loading the hydroxylated substrate
with atomic hydrogen at 300 K, the TDS data reveal an additional H2 desorption peak
(m/e=2) at ~ 500 K. The H2 peak was not seen for the HO-ZnO surface that was not
exposed to H atoms. The shape of H2O desorption peaks from the HO-ZnO surface,
however, is unaffected by the exposure to H atoms, as seen in Fig. 5.7(b).
Using (5.1) we can calculate the carrier density nc from the broadening Δ and yield a
value of 1×1017cm-3. When the HO-ZnO substrate is heated to higher temperatures,
300 400 500 600 700-3
-2
-1
0
(b)
FWH
M (m
eV)
8
12
16
20
24
(a)
Ta (K)
d(Δ
2 )/dT
(Arb
. Uni
t)
Fig. 5.8 (a) FWHM of the quasi-elastic peak, Δ, in the HREEL spectra (measured at RT) asa function of annealing temperature Ta after exposing the HO-ZnO surface to 1000 Latomic hydrogen at 300 K. (b) d(Δ2)/dT as a function of the annealing temperature.Annealing rate: 1.5 K/s, total annealing time: < 2 min.
80

the broadening decreases continuously as shown in Fig. 5.8(a). Fig. 5.8(b) shows
d(Δ2)/dT as a function of annealing temperature. The curve reveals two peaks at 455
K and 515 K. By comparison with the hydrogen TDS results (Fig. 5.8(a)) the peak at
515 K can be attributed to H2 desorption from the surface. The maximum observed at
455 K, on the other hand, is not detected in TDS experiments and, accordingly, must
be due to diffusion of H atoms into deeper bulk regions. The corresponding diffusion
barrier Ediff can be estimated from this temperature (455 K) according to
2max max
exp( )diff diff
b b
E Ek T k T
νβ
= − (5.3)
where ν is a preexponential factor, β is the linear heating rate, and Tmax is the
temperature corresponding to the maximum diffusion rate. This equation is derived
from exp( )diff
b
Edn dn ndt dT k T
β ν= = − − and 02
2
=dt
nd for the maximum diffusion rate.
For a heating rate of β=1.5 K s-1 and a preexponential factor ν of 1013 s-1, an activation
energy of 1.26 eV is obtained, in reasonable agreement with the experimental value
(~1.0 eV) reported for H atom diffusion in bulk ZnO [218, 219]. For the H2
desorption peak at 515 K, an activation energy for desorption of 1.44 eV is deduced,
which also agrees well with the results of recent DFT calculations [234].
100 150 200 250 3000
200
400
600
800
Tm (K)
Δ2 ((
meV
)2 )
Fig. 5.9. The value of Δ2 as a function of different measurement temperatures Tm for HO-ZnO surface exposed to 1000 L atomic hydrogen at 100 K. The dashed line has been obtained usingEq. (1) assuming a temperature independent density of carriers, nc. The solid line is the result of a nonlinear least square fit assuming an ionization energy of the H-induced shallow donor of εd=25 meV (see text).
81

Having provided compelling evidence that the increase of Δ seen in our EELS data
results from a finite density of electrons in the conduction band, we next investigate
the temperature dependence of Δ below 300 K, where any diffusion of H atom can be
safely ruled out.
As shown in Fig. 5.9, Δ2 (and Δ) increases continuously with temperature in the
regime between 100 K and 300 K. In principle, such a temperature dependence is
expected, see expression (5.1). A comparison of the experimental data with the dashed
line in Fig. 5.9, however, reveals that the temperature dependence predicted by
expression (5.1) is much too small to reproduce the experimental behavior. The only
possibility to explain this strong temperature variation is to assume that the carrier
density itself, nc, depends on temperature. This is in accord with previous suggestions,
that H-interstitials act as shallow donors with fairly small ionization energies [213].
For an n-type semiconductor, the CB charge density nc can be calculated from [235,
236]:
( )1/ 2( ) exp / 2
2ε⎛ ⎞= −⎜ ⎟
⎝ ⎠d c
c dN N Tn bk T (5.4a)
or
,1 3ln ln( ) ln2 2 2 4
d c o dc
b
N Nn T
k Tε
= − + (5.4b)
where is the density of donor atoms, NdN c(T) the conduction band density of states
e-e-
e-e-e-e-e-e-
e-
e- e-
ZnOConduction band
ZnOValence band
Donor levelεd
H
Fig. 5.10 Schematic model for the shallow donor states created by H atoms in ZnO.
82

and with 2/30,2)( TNTN cc =
⎜⎜
⎝
⎛⎟⎟⎠
⎞=
2/3
2
*
0, 2 hπb
ckm
N . εd denotes the donor state
ionization energy, as shown in Fig. 5. 10. A detailed discussion on the origin of
expression (5.4a) is presented in Appendix 5. If we insert the expression for nc in
(5.4a) into (5.1) we can perform a nonlinear least squares regression analysis, which
yields εd = 25 ± 5 meV. The latter value is in reasonable agreement with the ionization
energy of 35 ± 5 meV as obtained from a completely different method, electron
paramagnetic resonance (EPR) [215]. This value, however, is substantially smaller
than the value deduced from electrical conductivity experiments, 51 meV [222]. The
higher value might result from contributions from other types of defects, such as
oxygen vacancies, which are included in conductivity measurements.
In summary, our HREELS and TDS data demonstrate that exposing a fully
hydroxylated ZnO(0001) surface to atomic hydrogen leads to the incorporation of
subsurface interstitial H atoms. The shallow donor states created by this doping
process can be thermally dissociated, thus populating the conduction band and, as a
result, giving rise to plasmon losses seen in EELS. From the observed temperature
dependence, an ionization energy of 25 ± 5 meV is obtained. In the future we will use
this method to study the doping of ZnO by other elements, in particular metals.
5.3 HCOOH adsorption on the ZnO(0001) surface1
The adsorption and interaction of HCOOH on the ZnO(0001) surface has been
studied by HREELS and TDS. Exposing the ZnO(0001) surface to HCOOH at 100 K
leads to either multi- or double layer HCOOH and formate species. The formate
species can only be formed at oxygen vacancies through a dissociative adsorption of
HCOOH with the ionized H diffusing into ZnO bulk. Heating the sample to higher
temperatures induces a geometry conversion from the bidentate to monodentate
formate species. Further heating of the sample leads to a dehydration process of the
1 The theoretical work was performed by Janos Kiss.
83

monodentate formate species to CO and H2O at around 500 K and full decomposition
process to CO, CO2 and H2 at 550 K. In addition, an adsorbate-induced Zn desorption
was also observed along with the formate full decomposition.
Formate species was predicted by DFT calculations to be one of the intermediates in
the methanol synthesis process [42, 43]. Experimentally, formate species were
observed after dissociative chemisorption of CH3OH on ZnO surfaces [237, 238]. It
has been shown by many groups that the adsorption of HCOOH on metal or metal
oxide tends to form formate on the surface [239-245]. Several different adsorption
geometries were proposed depending on surfaces and adsorption sites, namely,
mono-dentate, bi-dentate and bridge structures [242, 246]. Upon heating, the formate
species undergoes a decomposition releasing CO or CO2 depending on the acidity of
the anion sites [239] and the structure of formate species [247]. With the
decomposition of formate, an adsorbate-induced desorption of Zn was also observed.
It was considered that the desorption of Zn is attributed to the reduction of the surface
by the adsorbates [237, 248]. In this work, a more detailed view on the properties of
HCOOH adsorbed on ZnO(0001) surface is provided using HREELS and TDS.
100 200 300 400 500 600 700 800
CO
CO2
H2
H2O
CH2O
HCOOH
Inte
nsity
(Arb
. Uni
t)
Temperature (K)
554 K
155 K
173 K Zn (x10)
Fig. 5.10 TD spectra of 10 L HCOOH adsorbed on ZnO(0001) surface at 120 K. The heating rate is 1.5 K/s.
84

Fig. 5.10 shows the TD spectra of 10 L HCOOH adsorbed on ZnO(0001) surface at
120 K. The main desorption production are: HCOOH (mass 46), H2 (mass 2), H2O
(mass 18), CO (mass 28), CO2 (mass 44) and trace amount of CH2O (mass 29 and 30)
and Zn (mass 64). For CO, the contribution from the fragment of CO2 has been
subtracted. At low temperature region, only the molecularly desorption of HCOOH
are observed at 155 K and 173 K which can be assigned to physisorbed multi- and
double layer HCOOH. Above 200 K, no molecular desorption of HCOOH is observed
and only the decomposition products, CO, CO2, H2 H2O, and a trace amount of CH2O
and Zn, are detected. A dominant peak located at 554 K consists of CO, CO2, H2 and a
trace amount of CH2O and Zn. A shoulder at the low temperature side of the CO peak
is also resolvable. The H2O desorption peak covers a very wide temperature range
from 200 K to 800 K, but decreases sharply at around 550 K, which is exactly the
decomposition temperature of the formate species (see Fig. 5.10).
In Fig. 5.11, HREEL spectra on the clean and with various amount of HCOOH
covered ZnO(0001) surface at 120 K are shown. No loss feature is observed on the
clean surface, indicating a perfectly clean surface, as well as a Fourier deconvolution
100 200 300 400 500
Energy Loss (meV)
212.5175
154
132
120
X4
X20
341359 449
368
170
199
Inte
nsity
(Arb
. Uni
t)
(a)
(b)
(c)
(d)
Fig. 5.11 HREEL spectra of (a)clean surface and (b) 20 L (c) 3 L (d) 0.8 L HCOOH on the ZnO(0001) surface at 120 K. All spectra were recorded at 120 K.
85

without artifacts process. The spectrum of 10 L HCOOH covered surface (Fig. 5.11b)
exhibits the loss features at 120, 154, 174, 212, 341 and 368 meV that can be assigned
to physisorbed HCOOH [249]. On the other hand, HREEL spectrum of low coverage
HCOOH adsorbed on ZnO(0001) at 120 K (Fig. 5.11d) shows totally different loss
features at 132, 170, 199, 341, 359 and 449 meV. Those loss features were suggested
by our DFT calculation and previous work [244] coming from the formate species
that are formed by dissociative adsorption of HCOOH through breaking OH bond and
leaving the ionized H to the bulk of ZnO. But the loss peak at 449 meV that was
attributed to the surface OH species [105] was still observed in Fig. 5.11d. This OH
species is thought to stem from the co-adsorption of background H2O at the
unsaturated oxygen vacancies since only a small amount of HCOOH is used that can't
saturate the oxygen vacancies (Fig. 5.11d). This suggestion is further confirmed by
the intermediate coverage of HCOOH on ZnO(0001) (Fig. 5.11c), where no surface
OH-related loss feature is seen in Fig. 5.11c, although its spectrum shows a
combinative features of physisorbed HCOOH and formate species.
Co-adsorption of HCOOH and D2O was also performed in order to determine the
adsorption site of the formate species. The TD spectra after HCOOH adsorption
followed by D2O adsorption shows the same desorption peaks as that of HCOOH
adsorbed on clean the ZnO(0001) surface, and no D2O (mass 20) desorption was
detected (data not shown here). Since D2O can only chemisorb on the ZnO(0001)
surface at oxygen vacancy sites [106, 107], we propose that the formate species are
formed at oxygen vacancies, which is consistent with the argument in previous work
that the formation of formate always requires a cation on the surface [239, 240,
243-245].
86

The absence of a loss feature at 449 meV in the spectra of Fig. 5.11b and Fig. 5.11c
provides a solid evidence for the dissociative adsorption and the diffusion of the
ionized H into ZnO bulk upon HCOOH adsorption. The very broad H2O desorption
peak in Fig. 5.10 provides another evidence for this explanation because the
out-diffusion of H from bulk, as shown in previous work [105], also occurs in a large
temperature range from 270 K to 750 K. The adsorption of background H2O forming
multilayer water would give rise to the desorption peak lower than 270 K, because
either the out-diffusion of bulk H or the decomposition of the formate species is
unlikely in this temperature range.
Fig. 5.12 shows a series of HREEL spectra of various HCOOH coverages on the
ZnO(0001) surface at 120 K after annealing to various temperatures. Below 160 K (as
shown in Fig. 5.12a and Fig. 5.12b), the spectra mainly show the features of
100 200 300 400 500
Energy Loss (meV)
10 L HCOOH on ZnO(000-1) at 120 K
120 K
160 K
300 K
500 K
213
204
131
368
360
449
620 K
750 K
174
X10X50
153
120
199170
433
365
(a)
(b)
(c)
(d)
(e)
(f)
Fig. 5.12 HREEL spectra of 10 L HCOOH adsorbed on ZnO(0001) at 120 K after annealingto various temperatures. All measurements were performed at 120 K.
87

physisorbed HCOOH, which is consistent with the TDS data in Fig. 5.10. After the
desorption of molecular HCOOH, the loss features of the formate species appear at
131, 170, 199 and 360 meV. Three possible adsorption geometries of formate have
been reported on other oxide surfaces [239, 244, 245], namely, mono-dentate,
bi-dentate and bridge structures. One rule to distinguish these three geometries in
vibrational spectra comes from the splitting of the symmetric stretch vibrational
mode of (OCO), νs(OCO), and the asymmetric stretch vibrational mode of (OCO).
The splitting of monodentate formate is generally larger than 41 meV and the
bidentate (including bridge structure) formate smaller than 33 meV [245]. In the
bridge structure, the two oxygen atoms of formate would be bound to two different Zn
atoms. For the ZnO(0001) surface, the minimum distance of two adjacent Zn atoms
along the [11 2 0] direction is 3.25 Å, but the distance of two oxygen atoms in the free
formate ion is just 2.25 Å [243]. So, the bridge structure can be ruled out for HCOOH
adsorbed on the ZnO(0001) surface. Consequently, the loss feature shown in Fig.
5.12c can be assigned to bidentate formate due to its relative small splitting of
νs(OCO) and νas(OCO), accounting to 28 meV.
Heating the sample to 500 K, as shown in Fig. 5.12d, the intensity of fomate loss
features decreases. In addition, three new loss features at 161, 204 and 449 meV show
up, indicating that new formate and OH species are formed along with the partial
decomposition of the bidentate formate to CO and H2O occurring at around 500 K.
The new formate species can be assigned to monodentate structure due to a relatively
large splitting of their νs(OCO) and νas(OCO) which amounts to 43 meV, indicating a
geometry conversion along with the first decomposition process. At the same time the
loss feature at 449 meV reappears. Indeed, a similar geometry transformation was also
observed for HCOOH adsorbed on NiO(111) surface studied by DFT calculation
[250], but not reported on ZnO surfaces. Additionally, the desorption of CO at 500 K
(shown in Fig. 5.10 as the shoulder at low temperature side of CO desoption peak
located at 550 K) indicates that, beside the geometry conversion from bidentate
formate to monodentate formate, also a decomposition of formate to CO and H2O
88

Table 5.1 assignments of experimental and calculated results for monodentate and bidentate formate species in units of meV.
Assignments ν(OH) ν(CH) π(CH) νas(OCO) νS(OCO) Δν(OCO)
Mono-dentate (Exp.) 449 360 131 204 161 43
Mono-dentate (Cal.) * 358.8 121.4 204.6 137.9 66.7
Bi-dentate (Exp.) 449 360 131 199 171 28
Bi-dentate (Cal.) * 372 120.4 186.4 155.6 30.8
*: not calculated.
takes place at 500 K.
After heating the sample to 620 K (Fig. 5.12e), only the loss feature at 449 meV is
observed, indicating the accomplishment of the decomposition process of the
monodentate formate, which is also consistent with the TDS data of Fig. 5.10.
Annealing at 750 K (Fig. 5.12f) results in a HREEL spectrum as for a clean surface. A
summary of experimental and theoretical results is presented in Table 5.1.
Fig. 5.13 shows the TD spectra of H2O of different amount of HCOOH on ZnO(0001)
starting from room temperature. With increasing exposure of HCOOH, the area of
H2O desorption peak increases as shown in the inset of Fig. 5.13. By comparing the
H2O desorption peak with the out-diffusion and desorption peak in Ref. [105], the
peak at around 400 K can be attributed to the out-diffusion of bulk proton and further
300 400 500 600 700 800 900
0 1 2 3 4
Exposure (L)
Pea
k A
rea
(Arb
. Uni
t)
4 L2 L0.5 L0.2 L
Temperature (K)
Inte
nsity
of M
ass
18 (A
rb. U
nit)
Exposure of HCOOH
Fig. 5.13 H2O desorption peaks evolve as a function with the exposure of HCOOH onZnO(0001) surface at room temperature. The inset shows the peak area of H2O as afunction with exposure of HCOOH.
89

desorption as H2O molecules. The H2O peak at around 530 K appears following the
CO desorption peak at 500 K. The only source of H2O and CO is formate. Since the
monodentate formate has already formed at 500 K and at the same temperature OH is
observed in EEL spectrum (Fig. 5.12d), we would propose the reaction pathway as
follows:
At 500 K, one of the Zn-O bond breaks and bidentate formate converts to
monodentate formate. At the same temperature part of the H atoms of the
monodentate formate diffuses to surface oxygen site to form surface hydroxyl with
the remaining -CO group desorbing from surface as CO molecule. Indeed, H2O
desorption is not coincident with CO desorption, but later than it. This is due to the
different stabilities of CO and OH species on ZnO(0001) surface. Interestingly, after
the decomposition of HCOOH at 550 K, still a H2O desorption peak is the observed in
TD spectrum, as well as in the HREEL spectrum (Fig. 5.12e). H2O adsorption from
the background can be ruled out since the TDS experiments were carried out at room
temperature within a very short time. The only possibility of H2O desorption peak
above 600 K is as the consequence of formate decomposition. As shown in Fig. 5.10,
the decomposition of formate gives H2, CO and CO2. Either the two H atoms get
together and form a H2 molecule, or they re-adsorb on a surface oxygen forming an
OH species.
In Fig. 5.10, a trace amount of Zn is also observed at the same temperature of formate
decomposition. A similar phenomenon has been reported in Ref. [248], where the
desorption of Zn was explained by the reduction of Zn2+ to 0 of valency by reductive
adsorbates.
90

Due to the very small ionization probability, Zn atoms show a very small intensity
(ion current) in the mass spectrometer. It is difficult to calibrate the absolute amount
of Zn. In this work, since the desorption of Zn can only come from the oxygen
vacancies which have been occupied by formate species, the relative amount of
desorbed Zn can be estimated by the amount of adsorbed formate.
Fig. 5.14 presents the signals of mass 44 in three continuous exposure-TDS cycles. In
each experimental cycle, 5 L HCOOH was dosed onto the ZnO(0001) surface at room
temperature, which is thought to be enough to saturate the oxygen vacancies by
forming formate species. In the first cycle, the HCOOH exposure was performed on
the freshly prepared clean ZnO(0001) surface. The maximum temperature of each
TDS experiment is 630 K, below which the decomposition of formate is completed
and no diffusion of bulk Zn and bulk O is considered [251]. As a result, with the
desorption of Zn, the amount of formate species formed on oxygen vacancies will be
decrease accordingly in the following exposure-TDS cycle. Note that we have
assumed that the amount of formate species can be represented by the amount of
desorbed CO2. The inset in Fig. 5.14 shows the peak area of desorbed CO2 with
500 550 600 650
1 2 3
Peak
are
a (A
rb. U
nit)
Cycles
1st cycle 2nd cycle 3rd cycle
Temperature (K)
Inte
nsity
of M
ass
44 (A
rb. U
nit)
Fig. 5.14 CO2 desorption peaks evolve as a function with the cycle of exposing HCOOH atroom temperature: (a)on clean surface (b) the second cycle (c) the third cycle. During TDSexperiment maximum temperature was restricted to 675 K.
91

respect the experiment cycles. It shows a linear relationship, indicating the ratio of
desorbed Zn to active Zn-formate species sites is constant. We define a constant
i
ii
AAAR 1+−
= , where the Ai represents the peak area of i-th cycle. R would reflect the
decrease of the amount of formate species in percent in each exposure-TDS cycle. R
is calculated to 0.13. Indeed the amount of formate species comes from two
contributions: the desorption of Zn removing oxygen vacancies and the desorption of
H2O creating new oxygen vacancies. Every HCOOH molecule adsorbed at oxygen
vacancies can donate one proton that diffuses to the ZnO bulk and later desorbs as 1/2
H2O creating 1/2 oxygen vacancy. This means if all Zn atoms of Zn-formate species
desorb in the decomposition process, R would be the value of 0.5. A smaller value of
R would indicate a partial desorption of Zn and the ratio of desorbed Zn to
Zn-formate can be calculated by 0.5-R=0.5-0.13=0.37, which means only 37% of the
Zn desorbs along with the decomposition of Zn-formate species.
Since the desorption of Zn associates with the reduction of the Zn*, we attribute this
partial desorption of Zn in Zn-formate species to the existence of different chemical
states of Zn on the surface. Indeed, as a covalent compound, the molecular orbitals on
ZnO surface are quite localized. At single oxygen vacancies, each Zn has one
dangling bond (slightly reduced) while at double oxygen vacancies one of the Zn has
two dangling bonds (heavily reduced). Zn atoms at single vacancies are more likely to
stay at surface and Zn atoms at double vacancies desorb along with the decomposition
of Zn-formate species. Our result illuminates that the proportion of double vacancies
among all surface oxygen vacancies is 37%.
In conclusion, we have investigated the adsorption of HCOOH on ZnO(0001) surface
at 120 K. Multilayer, double layer and chemisorbed HCOOH were observed in our
experiment. The chemisorbed HCOOH undergoes a dissociative adsorption forming
bidentate formate at oxygen vacancies with the ionized H-atom diffusing into the ZnO
bulk. Heating the sample to high temperature leads to a geometry conversion from
bidentate formate to monodentate formate. The latter decomposes to CO and H2O or
92

CO, CO2 and H2 at different temperature with different decomposition mechanism. At
last, the partial desorption of Zn reflects the different chemical states of formate
species on ZnO(0001).
5.4 CO2 adsorption on the ZnO(0001) surface2
In this work, CO2 adsorbed on the clean and hydrogen-free ZnO(0001) surface was
studied by high resolution electron loss spectroscopy (HREELS), thermal desorption
spectroscopy (TDS) at 100 K and DFT calculations. Three different adsorption
geometries for chemisorbed CO2 were proposed by combination of experimental and
calculated results. CO2 adsorption at the oxygen vacancies leads to bidentate at single
oxygen vacancies while at double oxygen vacancies to a planar (tridentate) carbonate
species. Furthermore, CO2 adsorbed on surface oxygen can also form stable
monodentate carbonate with the C atoms bound to surface oxygen. The experimental
results of the binding energy and vibrational energy of different carbonate species are
in very good agreement with theoretical calculations.
Many studies using other methods have been carried out for CO2 adsorbed on
ZnO(0001) surface. A photoelectron spectroscopy (XPS and UPS) study showed that
CO2 can only be chemisorbed as bidentate carbonate at oxygen vacancies [81]. In
another study by NEXAFS and FT-RAIRS, carbonate species were considered
bidentate carbonate formed at (1010) step sites [252]. On the non-polar ZnO(1010)
surface, CO2 adsorption has been found in form of the tridentate carbonate on Zn-O
dimers [84]. The experimental inconsistency possibly results from the complexity of
the surface structure due to the electro-instability of this polar surface and sequentially
abundant of oxygen vacancies [180, 195, 253]. In fact, it was also shown that the
surface chemistry is sensitive to the surface structure or co-adsorption [89, 240].
2 The theoretical work was performed by Jörg Kossmann.
93

Fig. 5.15 shows TD spectra of various amount of CO2 adsorbed on the ZnO(0001)
surface at 120 K. Only desorption of CO2 was observed in TDS experiment. After
adsorption of 0.1 L CO2 adsorbed on the ZnO(0001) surface at 120 K two broaden
desorption peaks at 490 K and 350 K are observed. With increasing exposure to CO2,
the peak at higher temperature becomes broaden, until the appearance of a sharp peak
at 150 K for high exposure. The main features of the TD spectrum for 0.8 L CO2
adsorbed on ZnO(0001) at 120 K are the sharp peak at 150 K and the long tail
roughly from 200 K to 600 K . The peak area, as shown in the inset of Fig. 5.15,
increases linearly and then reaches saturation for 0.8 L of CO2. The saturation might
result from the lower temperature limit, 120 K on this sample. The very broad feature
at high temperature region could be attributed to several contributions: the
re-adsorption process, lateral interaction between adsorbates, different adsorption
configurations. The possibility of re-adsorption can be ruled out since all experiments
100 200 300 400 500 600 700
0,0
0,2
0,4
0,6
0,8
1,0
1,2
0,0 0,5 1,0 1,5 2,0
Cove
rage
(Arb
. Uni
t)
Exposure (L)
2.00.80.40.20.1
Temperature (K)
Inte
nsity
(Arb
. Uni
t)
X L CO2 on ZnO(000-1) at 120 K
150
490
350
Fig. 5.15 TD spectra of various amount of CO2 adsorbed on the ZnO(0001) surface at 120 K. The peak areas are shown in the inset. The heating rate of the TDS experimentwas 1.5 K/s.
94

were carried out in UHV chamber and during the TDS experiment a differential pump
was used to evacuate the gas desorbing from sample surface. Indeed, on the non-polar
ZnO(1010), CO2 desorption also shows a broad feature from 100 K to 350 K due to
the different stable phases of adsorbate on surface [84]. In addition, the complexity of
this surface structure has been frequently reported [72, 253-256]. This broad peak of
CO2 on ZnO(0001), on the other hand, would also provide an evidence of the
complexity of this polar surface. In addition, since 1/3 ML oxygen vacancies is
predicted for the clean ZnO(0001) surface, the TD spectra in Fig. 5.15 indicate a high
sticking coefficient of CO2 or high reactivity of ZnO(0001) to CO2 adsorption.
To explore the origin of broad feature of CO2 desorption at high temperature region, a
co-adsorption experiment of 2 L H2O followed by 2 L CO2 was performed, as shown
in Fig. 5.16. H2O chemisorption on ZnO(0001) surface leads to a dissociative
adsorption at oxygen vacancy sites with leaving two hydroxyl species by every H2O
molecule and thus blocks the oxygen vacancies [72, 253, 257]. In Fig. 5.16, it is
shown that desorption of CO2 at tail region disappears for the hydroxylated surface. A
100 200 300 400 500 600 700
Temperature (K)
Inte
nsity
(Arb
. Uni
t)
2 L CO2 at 120 K
2 L H2O at 250 K2 L CO2 at 120 K
Fig. 5.16 TD spectra of CO2 adsorbed on clean and hydroxylated ZnO(0001) surface at120 K.
95

straightforward conclusion can be drawn here: the tail region of the TD spectra in Fig.
5.15 results from the CO2 adsorption at vacancies sites. One should also note that the
desorption peak of CO2 on hydroxylated surface has slightly a red-shift, which
corresponding a small increase in binding energy. This could be the consequence of
different electronic properties of ZnO(0001) surface after H2O adsorption. Since the
vacancies are always randomly distributed on the surface and the relative amount is
still small, the occurrence of different stable configurations due to the lateral
interaction is unlikely. The long tail character would originate from the different
adsorption configurations although the desorption peaks convolute with each other.
Fig. 5.17 presents the TD spectra from the adsorption of the isotope C18O2 on
ZnO(0001) at 120 K. Mass 48 (C18O2), mass 46 (C18O16O) and mass 44 (C16O2) were
monitored in the experiment. The desorption peak are dominated by mass 48 and
mass 46. Just a trace amount of mass 44 was detected. Since the 16O can only
originate from the substrate, the desorption spectrum of mass 46 indicates an
exchange of surface oxygen and C18O2, indicating that carbon atom bonds to the
surface oxygen upon adsorption. At the same time the 18O from adsorbate should bond
to the surface Zn at vacancy sites since the adsorption at tail region occurs at oxygen
vacancies. This indicates that the possible adsorption configuration of CO2 adsorbed
100 200 300 400 500 600 700
44 (C16O2)
46 (C16O18O)
48 (C18O2)
2.0 L C18O2 on ZnO(000-1) at 120 K
Temperature (K)
Inte
nsity
(Arb
. Uni
t)
Fig. 5.17 TD spectra of isotope C18O2 adsorbed on ZnO(0001) surface at 120 K.
96

Fig. 5.18 Proposed models for carbonate species on ZnO(0001) surface.
at the vacancy sites would be bidentate or tridentate carbonate species as shown in Fig.
5.18(b) and Fig. 5.18(c).
Fig. 5.19 presents HREEL spectra of CO2 adsorbed on ZnO(0001) surfaces of
different states. Compared with Fig. 5.19A, which exhibs the clean surface, the
spectrum of 2 L CO2 adsorbed on ZnO(0001) at 120 K (Fig. 5.19B) shows several
additional loss features at 107, 161, 196 and 207 meV. These loss features are the
characteristics of carbonate species. No loss feature of physisorbed CO2, which would
be located at 291 meV, was observed. To distinguish different carbonate species, an
HREELS experiment of CO2 adsorbed on hydroxylated ZnO(0001) at 120 K was
performed, as shown in Fig. 5.19C. On the hydroxylated ZnO(0001) surface, all
oxygen vacancies are blocked by H2O through dissociative adsorption. The available
adsorption site for CO2 could be the surface oxygen or hydroxyl group. We rule out
the possibility of CO2 reacting with hydroxyl group since the TDS peak of CO2 on the
hydroxylated surface at 150 K in Fig. 5.16 decreases compared with the adsorption on
clean surface. Fig. 5.19C shows loss features at 127, 180 and 203 meV, which are
consistent with the possible adsorption as monodentate carbonate. Fig 5.19D shows
the HREEL spectrum of 2 L CO2 adsorbed on ZnO(0001) at 400 K. Only two weak
97

loss features were observed at 150 and 193 meV.
DFT calculations were also performed for CO2 adsorbed on different oxygen vacancy
sites. The corresponding binding energy and vibrational energy were also calculated
for a comparison with the experimental results. The most stable configuration of CO2
adsorbed on ZnO(0001), as shown in Fig. 5.18(c), was found to be CO2 adsorption at
double oxygen vacancies with a geometry of planar tridentate carbonate and the
binding energy of 134 kJ/mol. This would correspond to the TDS peak centered at
490 K By assuming the preexponential factor for CO2 desorption from ZnO (first
order desorption) of 10-13 s-1 it yields a binding energy of 131 kJ/mol, in perfect
agreement with calculated results. Fig. 5.19D, for 2 L CO2 adsorbed on ZnO(0001) at
400 K, shows the EELS spectrum of this configuration. On the other hand (see Fig.
5.18(b)), the adsorption at single oxygen vacancies leads to bi-dentate carbonate with
0 100 200 300 400
Energy Loss (meV)
180203
207
196161
109
150
Inte
nsity
(Arb
. Uni
t)
193
Clean ZnO surface
2 L CO2 at 100 K
2 L CO2 on HO-ZnO
2 L CO2 at 300 K
A
B
C
D
Fig. 5.19 HREEL spectra of (A) Clean surface (B) 2 L CO2 adsorbed on ZnO(0001) at120 K. (C) 2 L CO2 adsorbed on hydroxylated ZnO(0001) at 120 K (D) 2 L CO2adsorbed on ZnO(0001) at room temperature. All experiment were performed at exposuretemperature. The spectra were shown as the deconvoluted results.
98

Table 5.2 Summary of experimental (HREELS) and theoretical results (DFT calculation) of different carbonate species in units of meV.
Assignments π(CO3) νs(CO) νas(CO) ν(C=O)
Exp. a 180 203 b
Monodentate Cal. 100 153 218 b
Exp. a 109 161 207 Bidentate
Cal. 99 101 126 221
Exp. a 150 193 b
Tridentate Cal. 100 164 190 b
a not resolved b vibrational mode not existence
the binding energy of 115 kJ/mol. The TDS peak centered at 350 K in Fig. 5.15 yields
a binding energy of 93.3 kJ/mol, in reasonable agreement with calculated results.
These two calculated configurations of CO2 adsorbed at oxygen vacancies further
confirm the conclusion deduced from the isotope substitution experiment. As shown
in the experiment, no physisorbed CO2 was observed in HREELS experiment for the
temperature higher than 120 K. DFT calculations also show an intermediate stable
species formed by adsorbing CO2 on the surface oxygen sites with monodentate
carbonate geometry with carbon bound to surface oxygen (see Fig. 5.18(a)). This
configuration would be corresponding to CO2 adsorbing on the hydroxylated
ZnO(0001) surface, the HREEL spectrum of which is presented in Fig. 5.19C. All
experimental and calculated results are summarized in Table 5.2.
In conclusion, we have studied the adsorption and reaction of CO2 with ZnO(0001)
surface. The extremely stable state of CO2 adsorbed on ZnO(0001) surface was
observed and assigned to the planar tridentate carbonate at double oxygen vacancy
sites. On the single oxygen vacancy sites the preferable adsorption geometry is the
bidentate carbonate. At last, a monodentate carbonate species, which is formed by
CO2 adsorption on the surface oxygen, was observed by both experiments and DFT
calculations.
99
6. Cu deposition on ZnO(0001) The interaction between metal and oxide is technically important in many fields, such
as material science, microelectronics and heterogeneous catalysis [24, 38, 208, 258,
259]. In catalysis, the precious metal nanoparticles dispersed on oxide surfaces can
substantially reduce the cost. Furthermore, metal/oxide systems exhibit usually more
superior catalytic properties. Besides the original catalytic properties of the precious
metal, the size-effect of metal particles and their interaction with oxide supports also
remarkably affect on the catalytic properties and has attracted more and more research
attentions. The Cu/ZnO catalyst used for methanol synthesis is a nice example for the
study of the so-called strong metal-support interactions (SMSI).
Several decades ago, ZnO was used as catalyst for synthesizing methanol from syngas
(CO/CO2/H2). However, high pressure and high temperature were required. Later, the
introduction of Cu into ZnO apparently reduced the reaction temperature and pressure
[208]. The role of Cu is still less understood although many studies on this system
have been carried out. It has been proposed that metallic copper particles alone [40,
103, 260], partially oxidized Cu (Cu+ [261, 262]), the size-effect [263], the
metal-oxide junction effect [264], or even the lattice strain and defects in Cu [265]
exhibit catalytic activity for methanol synthesis.
In this chapter, the structure, chemical state and diffusion of Cu into ZnO bulk of Cu
clusters deposited on the ZnO(0001) surface are studied by HREELS, TDS and
LEED.
6.1 Structure of Cu clusters on the ZnO(0001) surface
Fig. 6.1 presents the LEED pattern recorded on clean and Cu deposited ZnO(0001)
surfaces. The clean surface shows a (1×3) superstructure as discussed in previous
section. After deposition of 10 ML Cu at RT, The LEED result shows a bright and
sharp diffraction spots (note that after deposition of Cu, a clear diffraction pattern can
100

72 eV
(a) (b)
Fig. 6.1 LEED patterns of (a) clean ZnO(0001) surface at 100 K, (b) 10 ML Cu depositedZnO(0001) at RT. The electron energy used in experiment is indicated at the right up cornerin each pattern.
only be obtained by using a different electron energy), indicating a good film quality
and a possible layer-by-layer growth mode for relatively large Cu coverages on
ZnO(0001) at RT. Furthermore, the hexagonal structure of Cu deposited on ZnO(0001)
reveals the formation of Cu thin-film with (111) facets since the bulk Cu shows face
cubic centered (fcc) structure (Note that this hexagonal structure is not contributed by
ZnO because the electrons can not penetrate as thick as 10 ML Cu layer). This
conclusion is further confirmed by the different in-plane lattice constants (see Fig. 6.1)
determined by considering the electron energy and pattern dimensions. Direct
calculation of the in-plane lattice constant of the Cu film is difficult and arbitrary,
however a rough estimation is achieved by comparing two LEED patterns and
assuming that the in-plane lattice constant of ZnO(0001) has negligible deviation
from its bulk. Given that the in-plane lattice constant of ZnO(0001) amounts to 3.26Å,
200 220 240 260 280 3006
7
8
9
10
11
12
EE
LS In
tens
ity (k
cps)
2
3
4
5
Temperature (K)
FWH
M (m
eV)
Fig. 6.2 Intensity (top) and FWHM (bottom) of the HREELS elastic peak as a function of theannealing temperature recorded after 5 ML Cu deposition on ZnO(0001) at 100 K.
101

the in-plane constant of the Cu film is calculated to be 2.5 Å. By taking account of the
fcc structure and lattice constant (3.61 Å) of Cu, the in-plane lattice constant of the
(111) face is calculated to be 2.55 Å, which is in very good agreement with the value
derived from the LEED results.
For 10 ML Cu film grown at 110 K, the LEED experiment was also performed. The
corresponding data show a strongly blurred diffraction pattern, implying an
island-like growth mode at low temperatures. Fig. 6.2 shows the intensity of the
HREELS elastic peak and the FWHM value as a function of temperature. The HREEL
spectra were taken after 10 ML Cu deposition on ZnO(0001) at 100 K and during the
following annealing process. First, the HREELS intensity is dramatically decreased
compared to that recorded on the clean surface that amounts to around 20 kilo-counts
per second (kcps). The FWHM value keeps nearly constant in the experimental
temperature range, indicating that no diffusion process of Cu into bulk ZnO occurs
(details will be discussed in subsection 6.3). The HREELS intensity increases
gradually with increasing the temperature, implying that the Cu-covered surface
becomes more flat and film-like. Given that the surface roughness can only be
improved by the lateral diffusion of Cu atoms, our HREELS data further suggests a
relative small diffusion barrier of Cu atoms.
Fig. 6.3 presents the TD spectra of CO adsorbed on different Cu deposited ZnO(0001)
surfaces., CO adsorption on thick Cu layers (curve A) gives a main desorption peak at
100 150 200 250 300 350 400 450
Inte
nsity
of m
ass
28 (A
rb. U
nit)
172 K
Temperature (K)
10 L CO on 30 ML Cu/ZnO at 100 K
A
100 200 300 400
750 K 300 K
Temperature (K)
Inte
nsity
of m
ass
28 (A
rb. U
nit) 162 K
144 K
124 K
200 K
C
B
CO on 5 ML Cu/ZnO at 100 K
Fig. 6.3 TD spectra of 10 L CO adsorption at 100 K on (A) 30 ML Cu/ZnO, (B) 5 MLCu/ZnO, (C) after annealing 5 ML Cu-covered ZnO surface to 700 K.
102

172 K, which is assigned to CO bound to the Cu(111) face. The small desorption peak
at 200 K is not well understood and since it always exists in our experiments we
temporarily attribute it to the systematic problem. Fig. 6.3B shows the TD spectrum
of CO adsorbed on 3 ML Cu/ZnO(0001) surface. The relatively broad feature
indicates the complexity of Cu thin layer on ZnO(0001). After annealing to 750 K for
3 minutes (Fig. 6.3C), four desorption peaks at 124, 144, 162 and 200 K are clearly
resolved, which are attributed to CO adsorbed on different Cu surfaces as supported
by the previous work [266]. This finding indicates the presence of new indexed faces
or steps of Cu layer created after annealing to higher temperatures, which leads to the
aggregation of Cu clusters forming islands due to high intermolecular interaction of
Cu atoms [267-269].
6.2 The chemical state of Cu on ZnO(0001) surface
In general, the chemical state of surface cations (in particular for transition metal
cations) can be explored by vibrational spectroscopy using CO as probe molecule. It
has been shown that the stretching vibration of adsorbed CO, ν(CO), is sensitive to
the potential of surface anions [24, 208]. A large red shift of ν(CO) relative to gas
phase (266 meV) implies usually a lower oxidation state of surface anions. This is
attributed to the electron back donation from 3d metal orbital to the anti-bonding 2π*
orbital of CO, the filling of which can essentially reduce the bond strength and bond
order [37]. Compared to the gas phase value, CO adsorbed on fully reduced metal
surfaces (as an extremity) will give a red shift as large as 20-30 meV. Moreover, the
ν(CO) frequency depends also on the CO coverage and adsorption sites (on-top,
bridge, hollow and step edge). Because of the relatively poor energy resolution of
HREELS, a fine analysis including adsorption site is difficult. For comparison we
have performed the experiments under two extreme conditions: fully oxidized and
fully reduced Cu states. The latter corresponds to the thick Cu layer (more than 20
ML), whereas the fully oxidized Cu state is prepared through an intended post
oxidation process in oxygen ambient.
103

Fig. 6.4 shows the HREEL spectra of CO adsorbed on different Cu/ZnO surfaces. On
the 5 ML Cu covered surface the ν(CO) band amounts to 257 meV (Fig. 6.4(a)),
which is consistent with that of CO adsorbed on the top site of Cu surface [270-272].
When the Cu layer is fully oxidized (Cu2+), the ν(CO) band shows a blue shift to 262
meV, while the peak intensity reduces largely, indicating a weak adsorption of CO on
fully oxidized Cu/ZnO(0001) surface. From this finding a safe conclusion can be
drawn: the thin Cu layer is not in the fully oxidized Cu2+ state.
0 100 200 300 400 500
(a) 5 ML Cu on ZnO(000-1) at RT(b) 10 L CO on Cu/ZnO at 100 K
Energy Loss (meV)
257
10 L CO on annealed Cu/ZnO(000-1) at 100 K
0 100 200 300 400 500
Energy Loss (meV)
261.7
10 L CO on oxidized Cu/ZnO(000-1) at 100 K
(a) 5 ML Cu on ZnO(000-1) at RT(b) ...(c) oxidation at 800 K for 3 min (10-6mbar)(d) cooling down to 100 K(e) 10 L CO on oxidized Cu/ZnO
Fig. 6.4 HREEL spectra of 10 L adsorbed on (a) 5 ML Cu/ZnO surface. (b) full oxidizedCu/ZnO surface. The oxidation was achieved by exposing the Cu/ZnO to 10-6 mbar O2 at800 K for 3 min.
0 100 200 300 400 500
10 L C18O on annealed Cu/ZnO at 100 K
a. 30 ML Cu on ZnO at 100 Kb. annealing to 400 Kc. 10 L C18O on Cu/ZnO at 100 K
250.5
Energy Loss (meV)0 100 200 300 400 500
253.5
Energy Loss (meV)
5 L C18O on 2 ML Cu/ZnO at 100 K
Fig. 6.5 HREEL spectra of 10 L C18O on different Cu/ZnO surfaces (a) 30 ML Cu, (b) 2 ML Cu.
In Fig. 6.5, the ν(CO) bands of C18O adsorbed on different Cu/ZnO surfaces are
further compared. On the 30 ML Cu-covered ZnO(0001) surface with fully reduced
Cu0 state (Fig. 6.5(a)), the C18-O stretching mode is observed at 250.5 meV, whereas
104

on 2 ML Cu-covered ZnO the ν(C18O) band amounts to 253.5 meV (Fig. 6.5(b)),
indicating that the thin Cu layer is not in fully reduced, metallic Cu0 state.
Based ob the above results we draw the conclusion that the chemical state of thin Cu
layer on ZnO(0001) is Cu+. Although the coexistence of other chemical states of thin
layer Cu on ZnO(0001) can not be definitively ruled out, the majority of active sites
(e.g. Cu-ZnO interface) for CO adsorption should be Cu species with the Cu+ state.
6.3 Diffusion of Cu into ZnO(0001) bulk
The diffusion of H into ZnO(0001) bulk has been observed and characterized by the
broadening of the HREELS quasi-elastic peak as discussed in section 5.2. The doping
of ZnO(0001) induced by the H diffusion into the bulk leads to the formation of donor
levels in the band gap of ZnO which are close to the conduction band. The similar
broadening of the quasi-elastic peak in HREELS was also observed after annealing
the Cu-covered ZnO(0001) surface to high temperatures. This finding reveals the
diffusion of Cu atoms into ZnO bulk during annealing. Indeed, the diffusion of Cu
into ZnO bulk was also found on the Zn terminated ZnO surface by STM [267].
0 100 200 300 400
Clean surface
300 K
520 K
760 K
900 K
Energy Loss (meV)
Inte
nsity
(Arb
. Uni
t)
20 ML Cu on ZnO(000-1) at RT
Fig. 6.6 HREEL spectra of 20 ML Cu-covered ZnO surface at 300 K and with annealingto indicated temperatures.
105

Fig. 6.6 shows a series of HREEL spectra recorded after annealing the 20 ML
Cu-covered ZnO(0001) surface to the indicated temperatures. As a reference, the
HREEL spectrum of the clean ZnO(0001) surface is also displayed in Fig. 6.6E. For
the as-grown 20 ML Cu covered ZnO(0001) surface (Fig. 6.6A) the spectrum exhibits
characters of metal surfaces. All surface phonons of ZnO(0001) are absent, which
originates from the screening effect by thick Cu layers. After annealing the sample to
520 K (Fig. 6.6B), the fundamental surface phonon mode at 69 meV starts to appear
in the spectrum, which increases in intensity with further increasing the annealing
temperatures. At temperatures higher than 750 K, the multiple phonons at 136, 202
meV are also observed (Fig. 6.6C and Fig. 6.6D). After annealing to 900 K, the
surface phonons show comparable intensities with those for the clean ZnO(0001)
surface.
The reappearance of ZnO surface phonons could be due to the following reasons: (a)
the desorption of Cu atoms upon annealing to high temperatures. (b) the aggregation
of Cu film to large islands during annealing. (c) the diffusion of Cu atoms into ZnO
bulk. Actually all of these three possibilities have been observed in previous works.
The zero order desorption of Cu on Al2O3/Mo(110) was found to take place at around
900 K [273, 274]. This is obviously not the case occurring in this study since the
100 200 300 400 500 600 700 800 900
Temperature (K)
Desorption of Cu
Desorption of 5 ML Cu on ZnO(000-1)
Background H2O desorption
Fig. 6.7 TD spectrum of Cu of the 5 ML Cu-covered ZnO surface. For comparison the desorption of H2O adsorbed from the background is also shown.
106

100 150 200 250 300 350 400
300 K 450 K 600 K 750 K 850 K
Temperature (K)
Inte
nsity
(Arb
. Uni
t)
CO adsorption on various annealed Cu/ZnO surface
Annealing temperature
Fig. 6.8 TD spectra of 10 L CO adsorbed on 5 ML Cu-covered ZnO surfacespre-annealed to different temperatures
surface phonons reappear at temperatures far below 900 K. Indeed, nearly no
desorption of Cu was observed in the corresponding TDS experiments (see Fig. 6.7).
The mass 64 signal has only an upward bending at around 800 K, which would
correspond to the desorption of Cu. For comparison, the desorption peak from
background H2O adsorption was also shown in Fig. 6.7. Compared to the H2O signals
the desorption of Cu is negligible. Therefore, we can rule out the first possibility; the
reappearance of ZnO surface phonons should be attributed to the aggregation of Cu
layers and/or diffusion of Cu atoms into ZnO bulk. After the former process, part of
the ZnO(0001) surface is again exposed to vacuum and can be monitored by
HREELS. The aggregation of Cu film was also observed by STM studies in the group
of Köhler [267, 269]. Finally, the diffusion of Cu to ZnO bulk can also lead to
elimination of the screening effect, thus resulting in the reappearance of ZnO surface
phonons.
Fig. 6.8 shows a series of TD spectra of CO adsorbed on 5 ML Cu-covered ZnO
surfaces that are pre-annealed to different temperatures. The desorption amount of CO
decreases dramatically with elevating the annealing temperatures. Because the
annealing process causes the aggregation of Cu layers forming Cu islands, more Cu
atoms are exposed. Thus, the desorption intensity of CO is expected to increase to
some extent. The fact that the CO desorption amount is largely decreased during
107

400 500 600 700 80018
20
22
24
26
28
30
32
34
Data1FW
HM
(meV
)
Annealing Temperature (K)
5 ML Cu on ZnO(000-1) at RT
Fig. 6.9 the FWHM value as a function of annealing temperatures for the 5 MLCu-covered ZnO surfaces.
140 160 180 200 220 240 260 280
200
300
400
500
600
700
800
900
Tm (K)
Δ2 ((
meV
)2 )
(a) 5 ML Cu on ZnO(000-1) at RT(b) Cooling down to 100 K(c) measuring FWHM at different temperature
εd=20 meV
Fig. 6.10 The FWHM values as a function of annealing temperatures. The samples wereprepared as follows: 5 ML Cu was first deposited on ZnO(0001) at RT and annealed to 800 K for 5 minutes, and then cooled down to 100 K.
annealing process implies a decrease of exposed Cu atoms, which can only be
explained by diffusion of Cu atoms into ZnO bulk.
A more solid evidence for Cu diffusion into ZnO bulk results from the HREELS
experiments results (see Fig. 6.6). After annealing the Cu-covered ZnO surface to
higher temperatures the quasi-elastic peak in HREELS becomes broader. The FWHM
value as a function of annealing temperatures is plotted in Fig. 6.9. The FWHM
increases with heating to higher temperatures, which indicates directly a diffusion of
Cu atoms into ZnO bulk. The doping of ZnO(0001) by Cu leads to the formation of
shallow donor states in the band gap. As we have discussed in section 5.2, the
excitation of electrons into the conduction band results in the low-energy plasmon
vibrations. Thus, a plasmon-induced broadening of the quasi-elastic peaks in the
HREELS data is observed in Fig. 6.9. To further identify this mechanism on doped
semiconductor surfaces, it's necessary to observe a temperature-dependent broadening
according to expressions (5.1), (5.2) and (5.4a).
As shown in Fig. 6.10, 5 ML Cu was first deposited on ZnO(0001) at RT and
annealed to 800 K for 3 min, then cooled down to 100 K. The FWHM of the
HREELS quasi-elastic peak was then measured at different temperatures. For doped
semiconductors, the density of free charge carriers in the conduction band can be
calculated according to the expression (5.4a). By the same manner as used in section
108

5.2, the ionization energy of the Cu donor level is estimated to be 20 meV. This rather
small ionization energy can be considered as the kinetic barrier for Cu-ZnO redox
reactions, which provides a further evidence for the existence of the Cu+ state in the
thin Cu layer on ZnO(0001) surface.
In summary, Cu deposition on O-ZnO leads to the formation of ordered Cu layers
with the Cu(111) facets. For the small clusters the partial oxidation of Cu0 into Cu+
was clearly identified by the characteristic C-O stretching frequencies. Upon heating
the Cu atoms undergo, instead of desorption, diffusion into the bulk. This is confirmed
by a significant broadening of the quasi-elastic peak in HREELS, which corresponds
to the existence of free charge carriers at ZnO surface region. These free charge
carriers result from the thermal excitation of electrons at the donor level into the
conduction band. The shallow donor states are created via diffusion of Cu atoms into
the bulk. The analysis of the temperature dependence yields a shallow donor
ionization energy of 20 meV. This unexpected doping effect of ZnO by Cu could have
important consequences for its chemical activity and needs to be investigated
systematically in future research.
109

7. Summary and outlook
7.1 Summary
We have shown that the combination of vibrational spectroscopy (HREELS), thermal
desorption spectroscopy (TDS) and electron diffraction method (LEED) can provide a
comprehensive investigation for the adsorption and reaction behaviors of gas
molecules on oxide and metal deposited oxide surfaces. Furthermore, the theoretical
work also plays an important role for getting the insight of the studied system.
Adsorption and reactions of a number of molecules (hydrogen, water, carbon
monoxide, carbon dioxide, formaldehyde, formic acid and methanol) on clean and
metal deposited oxide single crystal surfaces (ZnO and TiO2) have been studied by
high resolution electron energy loss spectroscopy (HREELS), thermal desorption
spectroscopy (TDS) and low energy electron diffraction (LEED).
On the most stable surface of ZnO, ZnO(1010), CO2 adsorption is found to form an
unusual tridentate carbonate species. Several ordered phases can be observed and are
explained as the consequence of charge transfer between CO2 and substrates. As the
result of charge transfer, the Lewis acidity of surface Zn cations increases due to the
formation of neighboring carbonate species after CO2 adsorption, which essentially
leads to an increase of adsorption ability of co-adsorbed CO molecules. With
increasing the coverage of pre-covered CO2 the binding energy of CO increases
monotonically. However, the site-blocking effect also arises. A good balance of the
binding energy and coverage of CO is achieved when the surface is pre-covered by
half monolayer of CO2, where the CO coverage reaches the maximum value of 0.5
ML.
H2O adsorption on ZnO(1010) at 100 K results in the formation of mono-, double-
and multi- layer H2O species, which are clearly identified by the different O-H
stretching modes of H2O with H-bonding. In the monolayer coverage regime it was
further found that H2O is partially dissociated forming a (2×1) superstructure along
[11 2 0] direction. Surprisingly, the frequency of the ν(O-H) mode of H2O monolayer
110

has a large red shift compared to the values in double- and multi- layer H2O. This
findings reveals unusually strong hydrogen bonding interactions in monolayer H2O to
both neighbouring absorbate molecules and the surface O atoms, which is responsible
for the partial dissociation of H2O molecules on the perfect ZnO(1010) surface at
temperature as low as 100 K.
The interaction of formaldehyde (CH2O) with TiO2(110) surfaces was also
investigated. CH2O adsorption on the perfect TiO2(110) surface leads to the
polymerization production, paraformaldehyde, along Ti5C rows. The binding energy of
the paraformaldehyde polymers to surface depends on the chain length. On defective
TiO2(110) surfaces created by high temperature annealing and Ar+ ion sputtering
methods, the adsorbed CH2O is reduced to ethylene at oxygen vacancies. The
formation of ethylene results from the diffusion and recombination processes of the
adsorbate species, dioxy-methylene. The artificially sputtered surface can contain as
much as 40% of oxygen vacancies. The more reactive sites were found to be the
lattice oxygen vacancies created only by Ar+ ion sputtering, where CH2O is reduced to
ethylene even at temperatures as low low as 150K.
For H adsorption on TiO2(110) at room temperature, a maximum hydroxyl coverage
of 0.66 monolayer is achieved by exposing the clean surface to a large amount of
atomic hydrogen. Upon heating, the surface hydrogen species, instead of desorption,
undergoes a diffusion process into the TiO2 bulk. This unusual behavior originates
from the lower activation barrier for diffusion of hydrogen into bulk compared to that
of recombinative desorption.
The existence of a hydrogen-free and unreconstructed polar ZnO(0001) surface is still
under debate. We provided the experimental evidence for the stable surface structure
of ZnO(0001) being either (3×1) reconstructed or (1×1) hydroxylated. The oxygen
vacancies on H-free ZnO(0001) exhibit high catalytic activities toward a number of
chemical reactions. It was found that CO2 is activated at surface oxygens on
ZnO(0001) forming three different carbonate species: monodentate on surface oxygen,
111

bidentate carbonate species at single oxygen vacancies and tridentate carbonate at
double oxygen vacancies.
The interaction of formic acid (HCOOH) with the clean, H-free ZnO(0001) surface
leads to the formation of bidentate formate species at oxygen vacancies. The bidentate
formate species undergo a geometry conversion to mono-dentate formate and further a
dehydration process upon annealing to 500 K. Heating the sample to 550 K leads to a
full decomposition of mono-dentate formate to H2, CO and CO2. The desorption of Zn
atoms during the decomposition process is analyzed and proposed to reveal the
presence of different oxygen vacancies.
Exposing the fully hydroxylated ZnO(0001) surface to atomic hydrogen leads to a
significant broadening of the quasi-elastic peak in HREELS, which results from the
existence of free charge carriers in the ZnO surface region. These free charge carriers
are created by the thermal excitation of electrons from the donor level into the
conduction band. The shallow donor states are created via diffusion of H atoms into
the bulk. The analysis of the temperature dependence yields a shallow donor
ionization energy of 25 ± 5 meV.
Cu deposition on ZnO(0001) surface leads to the formation of well-defined islands
exposing Cu(111) facets. For the small clusters the partial oxidation of Cu0 to Cu+ was
clearly identified by the characteristic C-O stretching frequencies. Upon heating the
Cu atoms undergo, instead of desorption, diffusion into the ZnO bulk. The doping of
ZnO by Cu leads also to the formation of shallow donor states, from which the
electrons can be thermally excited into the conduction band and, as a result, give rise
to a plasmon-induced broadening of the quasi-elastic peak in HREELS. From the
observed temperature dependence, the donor level ionization energy amounts to 20
meV, which reveals the low reaction barrier for the Cu-ZnO redox reaction. This
unexpected doping effect of ZnO by Cu could have important consequences for its
surface chemical activity and needs to be investigated systematically in future
research.
112

7.2 Outlook
In this work, although much effort has been carried out to study the adsorption and
reaction of gases on metal oxide surfaces, a deep understanding of metal substrate
interaction, especially its effect on catalytic properties, is still scarce. Further studies,
including new study methods, would be relevant. Study contents:
(1) The study of adsorption on metal deposited substrate. This includes the growth
mode, the chemical state of metal particles (films) and their effect on the catalytic
properties. The presence of vacancies and pre-covered H2O could also influence
the mentioned properties.
(2) The doping of metal particles in oxide bulk leads to a change on electronic
properties of the substrate, which can essentially change the charge distribution
between adsorbates and substrates. As a result, the binding energy between
adsorbates and substrates would be expected to increase to certain extent. This
could be more prominent on powder sample since the dimension becomes smaller.
A case study is the Cu doping effect on CO2 adsorption properties that after Cu doping in
ZnO the binding energy of CO2 to ZnO increases. Combined techniques including HREELS,
TDS, HAS and theoretical calculations are needed to get deep insight for this system. Study methods:
(1) In this work, the analysis of TDS results seems too straightforward although more
detailed information could be obtained from them. The combination of shape and
quantitative analysis of TDS would make the study more comprehensive.
(2) The study from electronic and orbital point of view, which in many cases provides
the original understanding for the reaction mechanism, could benefit the current
study.
(3) The possible functional extending of HREEL spectrometer for study of electronic
structure, which would enrich the current study contents.
113

Appendix 1: Discussion on the effect of Titanium sublimation
pump (TSP) on CO2 adsorption experiments
When the experiment of CO2 adsorption is performed in UHV chamber, especially
when CO2 just weakly reacts with sample and at the same time its reduction product,
CO, strongly reacts with sample, the effect of Titanium sublimation pump should be
considered. One example is given here of CO2 adsorption on Cu/ZnO(0001) surface.
In the work of CO2 adsorption on Cu/ZnO(0001), one of the “remarkable” results is
that CO2 can be reduced to CO by Cu film. Isotope substitution experiment using
C18O2 further confirmed this conclusion, as shown in Fig A1.1. But, unfortunately,
this is wrong. The problem is attributed to the effect of TSP, that during exposure of
CO2, part of backfilling CO2 is reduced to CO by Ti films produced during the
running of TSP, and further dramatically affects on experiments. Evidences are shown
here.
100 200 300 400 500 600 700 800
30 46 48
Temperature (K)
Inte
nsity
(Arb
. Uni
t)
10 L C18O2 on annealed Cu/ZnO at 100 K
a. 30 ML Cu on ZnO at 100 Kb. annealing to 800 Kc. 10 L C18O2 on annealed Cu/ZnO at 100 K
167
123
200
0 200 400
10 L C18O2 on annealed Cu/ZnO at 100 K
a. 30 ML Cu on ZnO at 100 Kb. annealing to 400 Kc. 10 L C18O2 on Cu/ZnO at 100 K
250.6
Energy Loss (meV)
(a) (b) Fig. A1.1 TD and HREEL spectra of 10 L C18O2 adsorbed on 30 ML Cu deposited ZnO(000-1) at 100 K.
114

As shown in literature, CO2 can only weakly adsorb on Cu(111) surface, but strongly
adsorb on some high Miller indexed surfaces with dissociation [9]. In chapter 6, we
have shown that the growth of Cu on ZnO(0001) surface is along (111) face at room
temperature (RT). Other faces appear only when annealing the sample to high
temperature.
0 100 200 300 400 500
Energy Loss (meV)
Inte
nsity
(Arb
. Uni
t)
a
b
c
d
e
f
X25
Fig. A1.2 Series of HREEL spectra recorded on different treated Cu/ZnO(0001) surface. For
details of each curve, see text.
Fig. A1.2 shows a series of HREEL spectra of 20 ML Cu deposited on ZnO(0001)
surface with different treatment. Note that the curves from (a) to (f) were recorded in
sequence during the experiments. (a) 20 ML Cu was deposited on ZnO(0001) at RT.
(b) after exposing the Cu/ZnO surface to 20 L C18O2 at RT. (c) after exposing the
Cu/ZnO surface to 1000 L C18O2 at RT. (d) cooling the sample down to 100 K and
exposing it to 20 L C18O2. (e) the sample was exposed to 5 L CO at 100 K. (f) running
TSP for twice (40 A, 40 sec for each time) and 20 minutes later exposing the sample
to 20 L C18O2.
After 20 ML Cu deposition on ZnO(0001) surface at RT, there is nearly no phonon
observed (curve a). If this Cu/ZnO surface can really reduce CO2 to CO, one oxygen
atom would be left on the surface and the stretching vibrational mode of ν(Cu-O)
would be observed in HREELS. Note that at room temperature CO2 (or CO) is not
115

stable on Cu film surface. Indeed, in curve (b) no change of the spectrum was
observed. Possible small sticking coefficient was also considered and 1000 L C18O2
adsorption was further performed (curve c). Again, no change was observed in
HREEL spectrum. Possibly, the ν(Cu-O) shows too small intensity to be detected by
HREELS. But, at least, if the Cu/ZnO is fully covered by oxygen due to the
“reduction” of CO2, no further CO2 adsorption would be observed at low temperature.
In curve (d), no ν(C18-O) band was observed. But, wait, we can’t reach the conclusion
right now that Cu/ZnO is fully covered by oxygen after 1000 L CO2 adsorption on
Cu/ZnO at room temperature. The other possibility as we wanted to testify hasn’t
been ruled out. If the surface is now fully covered by oxygen, then how is the further
CO adsorption? Curve (e) brings us the answer. CO does adsorb on this surface and
the ν(CO) is exactly the same with CO adsorbed on the untreated Cu/ZnO surface. We
can not consider this ν(CO) coming from the CO adsorption on CuO or Cu2O since it
is very sensitive to the chemical state of substrate. TSP pump was then switch on for
twice. 20 minutes later, after the vacuum became better, 20 L C18O2 was again
exposed just like step (d). Interestingly, different from curve (d), this time we found
the ν(C-18O).
Now we come back to the speculation at beginning: during exposure of CO2, part of
CO2 is reduced to CO by Ti film from TSP. If it were true, then the result of curve (e)
would be reasonable. In addition, the exposure of 1000 L C18O2 in step (c) would have
another effect, not to saturate the sample, but to saturate the Ti film by oxygen. As a
0 10 20 30 40 500,10
0,12
0,14
0,16
0,18
0,20
0,22
###
A B C D
Time (min)
Rat
io o
f Mas
s 30
/48
Ratio of Mass 30/48 during backfilling the chamber 5.0x10⁻⁷ mbar of C18O2
Fig. A1.2 Ratio of the intensity of mass 30 to mass 48 recorded by mass spectrometer duringbackfilling the preparation chamber with 5.0×10⁻⁷ mbar of C18O2. For details of each curve,
116

result, the CO2 adsorption in step (d) could not provide the reduction production, CO
in the background. Note also that CO2 itself doesn’t adsorb on Cu films at 100 K in
this work.
One more piece of evidence comes from the ratio of mass 30/48 recorded by mass
spectrometer during backfilling the chamber with 5.0×10⁻⁷ mbar of C18O2 (Fig. A1.3).
Four separated regions in the figure denote different experimental condition: (a)
normal condition (b) after exposing 1000 L C18O2. (3) after step (b) and switching on
the TSP (40 A, 80 sec). (d) after step (c) and 50 L C18O2 exposure.
Note that the ratio of mass 30/48 is not the ratio of C18O to C18O2 since C18O2 has
fragment of C18O in mass spectrometer. But the ratio of C18O2 to the C18O fragment is
a constant and increase of the ratio would indicate an increase of CO proportion in the
backfilling ambient. During C18O2 backfilling, the ratio of mass 48/30 was decreasing
slowly from 0.22 to 0.16. After additional 1000 L C18O2 backfilling, the ratio had a
sharp drop. If we run the TSP again (region C) the ratio returns back to the normal
value as in region A. Further decreasing during C18O2 backfilling in region D is
similar with that in region A.
The change of ratio of mass 30/48 clearly exhibits the TSP effect on CO2 adsorption.
Indeed, in the CO2 on Zn(1010) work, we also found tiny amount of CO product in
TDS. So strong effect on Cu/ZnO system comes from the fact CO2 doesn’t adsorb on
Cu(111) surface at 100 K but CO does, as a result, even 5% of CO in CO2 ambient
can essentially affect the experimental observation. But in CO2 on ZnO(1010) work,
CO2 can really adsorb and compete with CO.
In conclusion, when the experiment of CO2 adsorption is performed in UHV chamber,
especially when CO2 just weakly reacts with sample and at the same time its reduction
product, CO, strongly reacts with sample, the effect of Titanium sublimation pump
should be considered.
117

Appendix 2 Illustrations and symbols of different vibrational
modes
A typical example of vibrational modes for three-atom molecule (e.g. H2O) adsorbed
on solid surface is presented here. As shown in figure, the nonlinear adsorbate has
three atoms. As a result, it has three (3N-6) internal vibrations and six integral
vibrations (three rotation and three translation). One should note that during a specific
vibration some irrelative atoms could have a possible movement to keep the
conservation of momentum, which is not specified in this figure.
118
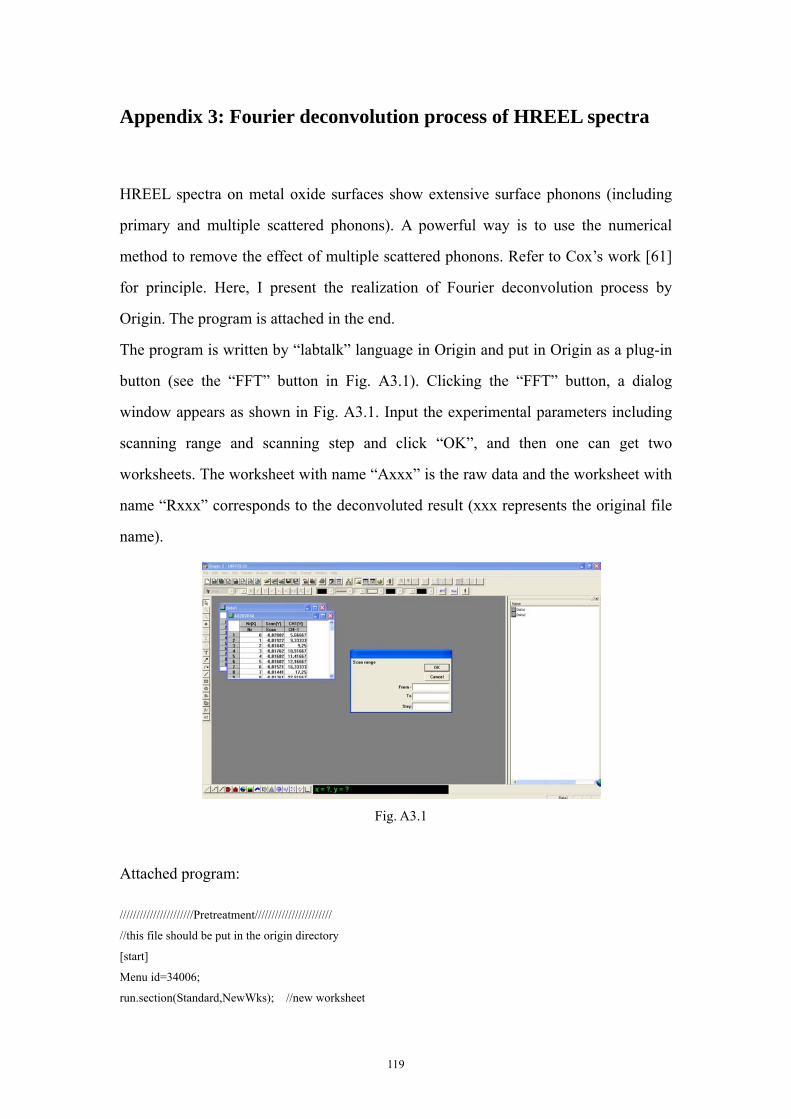
Appendix 3: Fourier deconvolution process of HREEL spectra
HREEL spectra on metal oxide surfaces show extensive surface phonons (including
primary and multiple scattered phonons). A powerful way is to use the numerical
method to remove the effect of multiple scattered phonons. Refer to Cox’s work [61]
for principle. Here, I present the realization of Fourier deconvolution process by
Origin. The program is attached in the end.
The program is written by “labtalk” language in Origin and put in Origin as a plug-in
button (see the “FFT” button in Fig. A3.1). Clicking the “FFT” button, a dialog
window appears as shown in Fig. A3.1. Input the experimental parameters including
scanning range and scanning step and click “OK”, and then one can get two
worksheets. The worksheet with name “Axxx” is the raw data and the worksheet with
name “Rxxx” corresponds to the deconvoluted result (xxx represents the original file
name).
Fig. A3.1
Attached program: //////////////////////Pretreatment///////////////////////
//this file should be put in the origin directory
[start]
Menu id=34006;
run.section(Standard,NewWks); //new worksheet
119

wks.import.minBlock=11;
getfile *.dbf;open -w %A; //open dbf file
run.section(labtalk_eels, begin);
[begin]
for(;wks.col1.name$==Nr;)
{
run.section(labtalk_eels,run);
}
[run]
%Z=%[%A,8];
getnumber "From -" from "To" to "Step" Step "Scan range";
//From*=-1;
ScanRange=From+To;
ResponseRange=2*From;
Delete Col(Nr);
col(Scan)*=1000;
wks.col1.type=4; //set first column as x axis
sum(col(ch1)); //normalize process start
maxtemp=sum.max;
col(ch1)/=maxtemp; // normalize process end
worksheet -d ResultsTemp;
worksheet -d ToFindPhonon;
mark -d col(scan) -b 1 -e 60; // cut the elastic peak off
sum(col(ch1));
Phonon=sum.max;
window -cd ToFindPhonon;// to normalize the last result to the elastic peak
worksheet -a 2; // add two new columns
for(i=1;i<=From+To+1;i++)
col(A)[i]=i-From-1;
col(b)=ResultsTemp_CH1(ResultsTemp_A); //interpolate the dataset with interval 1
for(i=0,LastPoint=0;i<10;i++)
{
LastPoint+=col(b)[From+To+1-i];
}
AverageLastPoint=LastPoint/10; //make an average of last ten data
for(i=From+To+2;i<1025;i++)
{
col(a)[i]=i-From-1;
col(b)[i]=AverageLastPoint*(1-(i-1025+ScanRange)/(1025-ScanRange));
}
col(scan)=col(a);
col(ch1)=col(b); //results after interpolation
Delete col(a);
Delete col(b);
120

worksheet -c response; //add a new column
for(i=1;i<1025;i++)
{
if(i<=ResponseRange+1)
col(response)[i]=col(ch1)[i];
else
col(response)[i]=col(ch1)[ResponseRange+1]*exp(-0.0005*i*i)/exp(-0.0005*(ResponseRange+1)*(ResponseRang
e+1));
}
/////////////////////fft process of the signal/////////////////////////
fft.reset();
fft.forward = 1;
fft.forward.timeData$ = ResultsTemp_scan;
fft.forward.tdelta = ResultsTemp_scan[2] - ResultsTemp_scan[1];
fft.forward.realData$ = Resultstemp_ch1;
window -t W fft FFT1;
fft.output.samplingdata$ = FFT1_Freq;
fft.output.realdata$ = FFT1_Real;
fft.output.imagdata$ = FFT1_Imag;
fft.output.ampdata$ = FFT1_r;
fft.output.phasedata$ = FFT1_Phi;
fft.output.powerdata$ = FFT1_Power;
fft.real = 1;
fft.normalize = 1;
fft.shifted = 1;
fft.windowing = 1;
fft.spectrum = 1;
fft.unwrap = 1;
fft.forward();
fft.reset();
fft.forward = 1;
fft.forward.timeData$ = ResultsTemp_scan;
fft.forward.tdelta = ResultsTemp_scan[2] - ResultsTemp_scan[1];
fft.forward.realData$ = ResultsTemp_response;
window -t W fft FFT2;
fft.output.samplingdata$ = FFT2_Freq;
fft.output.realdata$ = FFT2_Real;
fft.output.imagdata$ = FFT2_Imag;
fft.output.ampdata$ = FFT2_r;
fft.output.phasedata$ = FFT2_Phi;
fft.output.powerdata$ = FFT2_Power;
fft.real = 1;
121

fft.normalize = 1;
fft.shifted = 1;
fft.windowing = 1;
fft.spectrum = 1;
fft.unwrap = 1;
fft.forward();
get col(freq) -e row_number; //get the max row number
create fft_results -w 4 frequency fft_signal fft_response T;
wks.col1.type=4;
wks.col1.width=15; //set the width of first column
wks.col2.width=15;
wks.col3.width=15;
for(i=1;i<row_number;i++)
{
col(Frequency)[i]=FFT1_Freq[i];
col(signal)[i]=FFT1_R[i];
col(response)[i]=FFT2_R[i];
col(T)[i]=ln(col(signal)[i]/col(response)[i])*col(response)[i];
}
fft.reset();
fft.forward = 1;
fft.forward.timeData$ = FFTRESULTS_Frequency;
fft.forward.tdelta = FFTRESULTS_Frequency[2] - FFTRESULTS_Frequency[1];
fft.forward.realData$ = FFTRESULTS_T;
window -t W fft FFT3;
fft.output.samplingdata$ = FFT3_Freq;
fft.output.realdata$ = FFT3_Real;
fft.output.imagdata$ = FFT3_Imag;
fft.output.ampdata$ = FFT3_r;
fft.output.phasedata$ = FFT3_Phi;
fft.output.powerdata$ = FFT3_Power;
fft.real = 1;
fft.normalize = 1;
fft.shifted = 1;
fft.windowing = 1;
fft.spectrum = 1;
fft.unwrap = 1;
fft.forward();
////////////////////////End Process////////////////////////////////
%W=R%Z;
worksheet -d %W; //duplicate the worksheet
122

Delete col(real); //delete useless columns
Delete col(imag);
Delete col(Phi);
Delete col(power);
mark -d col(r) -b 1 -e 512; // delete useless rows
mark -d col(r) -b 501 -e 513;
sum(col(r)); //normalize process start
maxtemp=sum.max;
col(r)/=maxtemp; // normalize process end
col(r)*=Phonon; // normalize to the elastic peak but not the first phonon peak
work -n $(1) Scan$();
work -n $(2) CH1$(); //rename
mark -d col(Scan) -b (To+1) -e 500; //suitable for different scan range (e.g. -30~340meV)
window -cd fft1;
window -cd fft2;
window -cd fft3;
window -cd fftresults;
window -cd ResultsTemp;
123

Appendix 4: Shape analysis of TD spectra—some examples
Shape analysis of TD spectra is important to determine the reaction order and possible
lateral interaction between adsorbate. Some simulated examples are presented here to
show the typical shape features of different order desorption. Mathcad was used to do
the simulation. As an example, the program for first order desorption is attached in the
end. Based on Wigner-Polanyi equation, the simulation can be realized by the simple programming idea:
[ ] [ ] ⎟⎟⎠
⎞⎜⎝⎛ Δ−
⋅⋅=RT
ER in
nides exp)( θνθ (A4.1)
and
[ ] TR idesii Δ⋅−=+ )(1 θθθ (A4.2)
where the subscript i is an integer, TΔ stands for the simulated heating step.
By naming the initial coverage 0θ , we calculate [ ]0)(θdesR and 1θ can be obtained
by expression (A4.2). Go back to expression (A4.1) to calculate the next [ ])(θdesR
and the iteration process starts. Actually, approximation was assumed in expression
(A4.1) that [ idesR )( ]θ is the average desorption rate between and .
The deviation from this approximation can be diminished through using smaller
heating step.
iT TTT ii Δ+=+1
Parameters for each simulated results are shown in figures.
80 90 100 110 120 130 140
0th order desorption β=5 K/s
ν=1034 s-1cm-2
Inte
nsity
(Arb
. Uni
t)
Temperature (K)
Ed=100 meVθ=1.0~10 ML
124

90 100 110 120 130 140
θ=0.1~1.0 ML
Inte
nsity
(Arb
. Uni
t)
Temperature (K)
1st order desorption
Ed=0.3~0.33eV
β=5K/s
Ed=0.30eV
ν=1013s-1
θ=0.1~1.0 ML
90 100 110 120 130 140 150
θ=0.1~1.0 ML
Temperature (K)
Inte
nsity
(Arb
. Uni
t)
2nd order desorption ν=10-2s-1cm2 β=5K/s
Ed=0.3~0.33eV
Ed=0.3eV
θ=0.1~1.0 ML
100 120 140 160 180 200 220
1013
1012
1011
1010
109
108
Temperature (K)
Inte
nsity
(Arb
. Uni
t)
Effect of pre-exponential factor (1st order)
Ed=0.3eVβ=5K/sθ=1.0
Coverage is not sensitive to theposition and width of the peaks
100 110 120 130 140
Ed=0.33~0.30 eV
Temperature (K)
1st order desorption β=5K/s
ν=1013s-1
Inte
nsity
(Arb
. Uni
t)
θ=0.1~1.0 ML
Attached program and explanations:
The evolution of desorption shape with different coverage for the first order desorption. The binding energy increase from Ed to 1.1Ed from the monolayer to the near-zero coverage.Parameters: ν=10^13 s^-1, Ed=300meV, β=5K/s
Reason for if:Due to the use of different time step, it is possible that R becomes negative after some cycles(of course after the useful region)
k, as a variable, is used to change the parameters,e.g., ν and θ0, etc.
AA is used to show the change of Ed (in percent) during the desorption process which is possibly caused by lateral interaction.
125
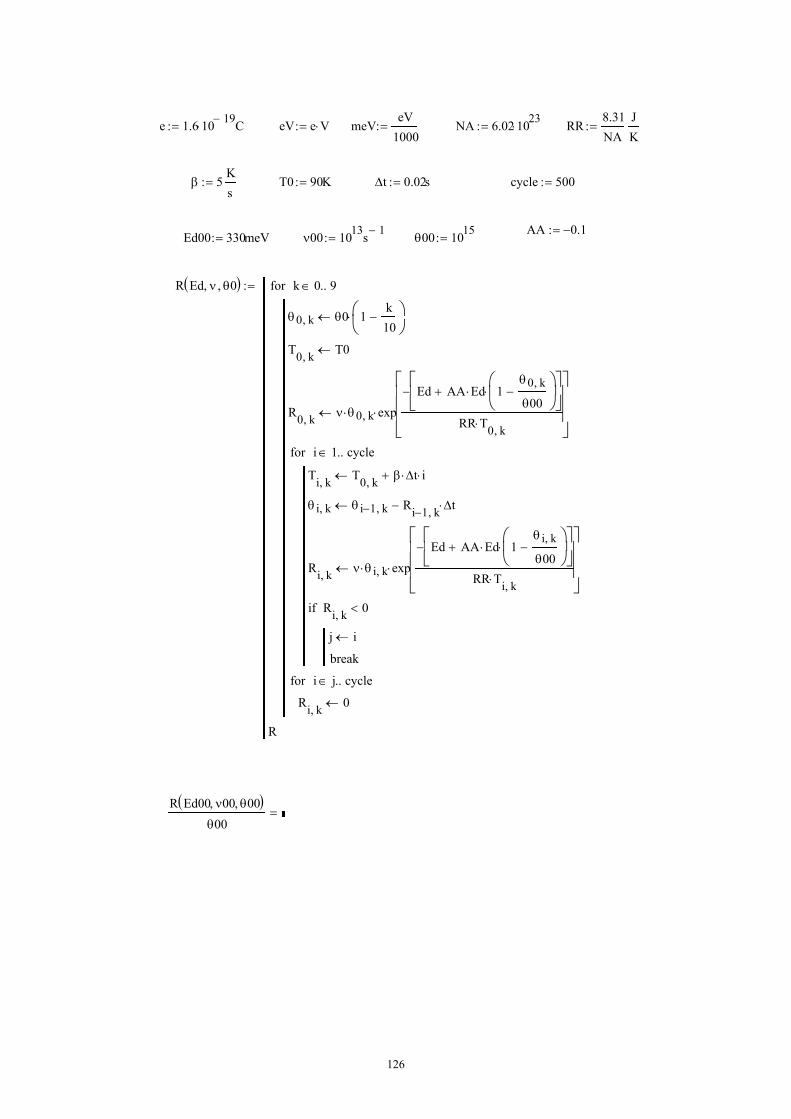
e 1.6 10 19− C⋅:= eV e V⋅:= meVeV
1000:= NA 6.02 1023
⋅:= RR8.31NA
JK
:=
β 5Ks
:= T0 90K:= Δt 0.02s:= cycle 500:=
AA 0.1−:=Ed00 330meV:= ν00 1013s 1−:= θ00 1015
:=
R Ed ν, θ0,( )
θ0 k, θ0 1k10
−⎛⎜⎝
⎞⎟⎠
⋅←
T0 k, T0←
R0 k, ν θ0 k,⋅ expEd AA Ed⋅ 1
θ0 k,
θ00−
⎛⎜⎝
⎞⎟⎠
⋅+⎡⎢⎣
⎤⎥⎦
−
RR T0 k,⋅
⎡⎢⎢⎢⎣
⎤⎥⎥⎥⎦
⋅←
Ti k, T0 k, β Δt⋅ i⋅+←
θ i k, θ i 1− k, Ri 1− k, Δt⋅−←
Ri k, ν θ i k,⋅ expEd AA Ed⋅ 1
θ i k,
θ00−
⎛⎜⎝
⎞⎟⎠
⋅+⎡⎢⎣
⎤⎥⎦
−
RR Ti k,⋅
⎡⎢⎢⎢⎣
⎤⎥⎥⎥⎦
⋅←
j i←
break
Ri k, 0<if
i 1 cycle..∈for
Ri k, 0←
i j cycle..∈for
k 0 9..∈for
R
:=
R Ed00 ν00, θ00,( )θ00
=
126

Appendix 5: Discussion on the expression of density of electrons
in conduction band for doped semiconductor
The expression of density of electrons in conduction band for doped semiconductor is
written in expression (A5.1) or (A5.2). Indeed, both expressions can be found in
different textbooks. A discussion on the validity of both expressions is presented in
this section.
First, the expression of ⎜⎜⎝
⎛⎟⎠⎞=
2/3
222)(
hπmkTTNc
es from the e
iconductors,
is a definition, which can be called
effective density of state (DOS) in conduction band (CB) (or we can just treat it as a
constant). This name com xpression of electron density of conduction
band for the intrinsic sem ⎜⎜⎝
⎛⎟⎠⎞= − TkEEBe BfceTkmn /)(
2/3
222
hπ, where Ec denotes
the bottom of conduction band. This expression is written like the product of DOS
(but not the real DOS in CB) and probability [275-279].
In some books the expression of nc(T) was written as [276, 277],
)2/exp()( kTTNN dcd ε− (A5.1)
where the coefficient of 2 disappears compared to the expression used other books
[278, 279], including in this work [105],
)2/exp(2
)( kTTNNd
cd ε− (A5.2)
The deviation, I think, originates from a very fundamental problem, that what is the
electron energy distribution function (probability) on donor level (electrons which are
not ionized),
kTEE FeEf /)(1
1)( −+= (A5.3)
or
127

kTEE FeEf /)(
1)( −= (A5.4)
Here, the coefficient of 2 in the latter expression results from th
21+
e fact that, at donor
vel two electrons with different spin are not allowed at the same time, which means
c
le
only one of the two states (spin-up and spin-dwon) is allowed for electrons at donor
level due to the potential localized interaction of two electrons [275].
To calculate the electron density in conduction band, n , we can not use the
expression:
∫∞
−+•=
c BdE TkEEdc dEn 1
but we must use:
eN /)(1 (A5.5)
⎜⎜⎝
⎛ ⎞1
dcB
⎟⎟⎠+
−•= − TkEEdc BFeNn /)(21
1 (A5.6)
For weak ionization case EETK −< , Fermi level locates at middle between
n get the electron density in
onduction band:
donor level and the bottom of conduction band. We ca
c
)2/exp()()( kTTNNTn dcd
c ε−= 2
(A5.7)
128

Bibligraphy 1. Spencer, N.D. and G.A. Somorjai, Catalysis. Rep. Prog. Phys., 1983. 46: p. 1.
3. Sinfelt, J.H., Role of surface science in catalysis. Surf. Sci., 2002. 500: p. 923.
5. Ertl, G., Reactions at surfaces: from atoms to complexity. Angew. Chem. Int. Ed., 2008. 47: p.
Phys., 2008. 128: p. 182503. , H., Preface to special topic: a survey of some new developments in heterogeneous
catalysis. J. Chem. Phys., 2008. 128: p. 182501. 8. Freund, H.J., Model system in heterogeneous catalysis: selectivi
Top. Catal., 2008. 48: p. 137. d M.W. Roberts, Surface chemistry of carbon dioxide. Surf. Sci. Rep., 1996. 25:
p. 225. 10. Hammond, G.S., A correlation of reaction rates. J. Am. Chem. Soc., 1953. 11. Laidler, K.J. and M.C. King, The development of transition-stat
87: p. 2657. complex and th
1935. 17: p. 65.
14. Koch, W. and M.C. Holthausen, A Chemist's Guide to Density Functional Theory. 2001: Wiley-VCH Verlag GmbH.
15. Parr, R.G. and W. Yang, Density-functional theory of atoms and Oxford University Press, Inc.
16. Goodman, D.W., Model studies in catalysis using surface science probes. Chem. Rev., 1995. 95: p. 523.
17. Imbihl, R., R.J. Behm, and R. Schlögl, Bridging the pressure and material gap in heterogeneous catalysis. Phys. Chem. Chem. Phys., 2007. 9: p. 3459.
18. Nozawa, R., H. Takeda, M. Ito, M. Hori, and T. Goto, In situ obervation of hydrogenated amorphous silicon surfaces in electron cyclotron resonance hydrogen plasma annealing. J. Appl. Phys., 1999. 85: p. 1172.
19. Kaichev, V.V., I.P. Prosvirin, V.I. Bukhtiyarov, H. Unterhalt, G. Rupprechter, and H.J. Freund, High pressure studies of CO adsorption on Pd(111) by X-ray photoelectron spectroscopy and sum-frequency generation. J. Phys. Chem. B, 2003. 107: p. 3522.
20. Somorjai, G.A. and J.Y. Park, Evolution of the surface science of catalysis from single crystals to metal nanoparticles under pressure. J. Chem. Phys., 2008. 128: p. 182504.
21. Krebs, H.J., H.P. Bonzel, and G. Gafner, A model study of the hydrogenation of CO over polycrystalline iron. Surf. Sci., 1979. 88: p. 269.
22. Campbell, C.T., Model studies of ethylene epoxidation catalyzed by the Ag(110) surface. Surf. Sci., 1984. 139: p. 396.
2. Zaera, F., Probing catalytic reactions at surfaces. Prog. Surf. Sci., 2001. 69: p. 1.
4. Zaera, F., Outstanding mechanistic questions in heterogeneous catalysis. J. Phys. Chem. B, 2002. 106: p. 4043.
3524. 6. Christensen, C.H. and J.K. Norskov, A molecular view of heterogeneous catalysis. J. Chem.
7. Metiu
ty studies at the atomic level.
9. Freund, H.J. an
77: p. 334. e theory. J. Phys. Chem., 1983.
12. Eyring, H., The activated e absolute rate of chemical reactoins. Chem. Rev.,
13. King, D.A., New developments in the surface science approach to catalysis. Top. Catal., 1994. 1: p. 315.
molecules. 1989, New York:
129

23. Noei, H., HZnO nanopa
. Qiu, Y. Wang, E. Löffler, and C. Wöll, The identification of hydroxyl groups on rticles by infrared spectroscopy. Phys. Chem. Chem. Phys., 2008. 10: p. 7092.
rog. Surf. Sci.,
: p. 68.
o(100): TPD and HREELS studies. J. Chem. Phys., 1992. 97: p. 9447.
lities on catalyst nanoparticles. Science, 2004. 304: p. 1639.
of vacancies and hydroxyl of TiO2(110):
30. .J. Freund, Signal electronics for an atomic force microscope
31. .F., G. Ceder, and D. Morgan, First principles study of native point defects in ZnO.
cence and oxygen vacancies in ZnO phosphors. Appl. Phys. Lett., 1996. 68: p.
33. s, Y. Wang, and C. Wöll, Carbon-carbon bond formation on model titanium
spectroscopy. J. Phys. Chem. C, 2008. 112: p. 9828.
sorption from the TiO2(011) 2X1 surface leads to self orgnized
35. ra, G.K.H. Madsen, Z. Li, J. Hansen, J. Matthiesen, A.B.
ate in the band gap of Titania. Science, 2008. 320: p. 1755.
38. nd particles on oxide surfaces: structural, electronic
39.
tt., 1994. 25: p.
41. , and J. Nakamura, Methanol syntehsis by
24. Bäumer, M. and H.J. Freund, Metal deposits on well-ordered oxide films. P1999. 61: p. 127.
25. Chang, Z. and G. Thornton, Reactivity of thin-film TiO2(110). Surf. Sci., 2000. 46226. Truong, C.M., M.C. Wu, and D.W. Goodman, Adsorption and reaction of HCOOH on
NiO(100) films on M27. Johanek, V., M. Laurin, A.W. Grant, B. Kasemo, C.R. Henry, and J. Libuda, Fluctuations and
bistabi28. Traeger, F., Helium atom scattering from oxide surfaces. Chem. Phys. Chem., 2006. 7: p.
1006. 29. Enevoldsen, G.H., A.S. Foster, M.C. Christensen, J.V. Lauritsen, and F. Besenbacher,
Noncontact atomic force microscopy studies Experiments and atomistic simulations. Phys Rev. B, 2007. 76: p. 205415. Rust, H.P., M. Heyde, and Hequipped with a double quartz tuning fork sensor. Rev. Sci. Instrum., 2006. 77: p. 043710. Kohan, APhys Rev. B, 2000. 61: p. 15019.
32. Vanheusden, K., C.H. Seager, W.L. Warren, D.R. Tallant, and J.A. Voigt, Correlation between photolumines403. Qiu, H., H. Idrisoxide surfaces: identification of surface reaction intermediate by high resolution electron energy loss
34. Dulub, O., M. Batzill, S. Solovev, E. Loginova, A. Alchagirov, T.E. Madey, and U. Diebold, Electron induced oxygen devacancies. Science, 2007. 317: p. 1052. Wendt, S., P.T. Sprunger, E. LiRasmussen, E. Lagsgaard, B. Hammer, and F. Besenbacher, The role of interstitial sites in the Ti3d defect st
36. Finazzi, E., C.D. Valentin, and G. Pacchioni, Nature of Ti interstitial in reduced bulk anatase and rutile TiO2. J. Phys. Chem. C, 2009. 113: p. 3382.
37. Hoffmann, R., Solids and srufaces: a chemist's view of bonding in extended structures. 1988, New York: VCH Publishers. Campbell, C.T., Ultrathin metal films aand chemisorptive properties. Surf. Sci. Rep., 1997. 27: p. 1. Scheer, J.J. and J.V. Laar, The influence of Cesium adsorption on surface fermi level poistion in Gallium Arsenide. Surf. Sci., 1969. 18: p. 130.
40. Muhler, M., E. Törnqvist, L.P. Nielsen, B.S. Clausen, and H. Topsoe, On the role of adsorbed atomic oxygen and CO2 in copper based methanol synthesis catalyst. Catal. Le1. Fujitani, T., I. Nakamura, S. Ueno, T. Uchijimahydrogenation of CO2 over a Zn-deposited Cu(111): formate intermediate. Appl. Surf. Sci., 1997. 121/122: p. 583.
130

42. Kurtz, M., J. Strunk, O. Hinrichsen, M. Muhler, K. Fink, B. Meyer, and C. Wöll, Active sites on oxide surfaces: ZnO-catalyzed synthesis of methanol from CO and H2. Angew. Chem. Int.
43. Kleinschmidt, J. Kossmann, and C. Hättig, A density functional study of the . C,
44. of
45. rfect and defective oxide
46. Y. and C. Wöll, Chemical reactions on metal oxide surfaces investigated by vibrational
47.
1). J. Vac. Sci. Technol. B, 1984. 2: p. 384.
51. n, B.N.J. and J.E. Demuth, Inelastic scattering of slow electrons from Si(111) surfaces.
52.
54. rvation of surface optical phonons and low energy
55.
on metal single crystal surfaces. Ann. Rev. Phys. Chem., 1988.
58. y and Surface Vibrations. 1982:
59. an, Initial growth of Au on oxides. Surf.
60. tron energy loss spectroscopy. Microsc. Res. Tech., 2008. 71: p. 626.
62. desorption of gases. Vacuum, 1962. 12: p. 203.
Ed., 2005. 44: p. 2790. Rossmüller, G., V.methanol synthesis at an oxygen vacancy on the polar ZnO(000-1) surface. J. Phys. Chem2009. 113: p. 1418. Jones, P.M., J.A. May, J.B. Reitz, and E.I. Solomon, PES and Electronic structure studies CH2O bonding and reactivity on ZnO surfaces. Inorg. Chem., 2004. 43: p. 3349. Wang, Y., High resolution electron energy loss spectroscopy on pesurfaces. Z. Phys. Chem., 2008. 222: p. 927. Wang, spectroscopy. Surf. Sci., 2009. 603: p. 1589. Wang, Y., A. Lafosse, and K. Jacobi, Adsorption and reaction of CO2 on the RuO2(110) surfaces. J. Phys. Chem. B, 2002. 106: p. 5476.
48. Dietrich, H., K. Jacobi, and G. Ertl. Vibrational analysis of the NH+N coadsorbate on Ru(0001). 1997: Elsevier Science Bv.
49. Demuth, J.E. and B.N. Persson, High resolution electron energy loss studies of Fermi level states of clean and metallized Si(11
50. Dubois, L.H., B.R. Zegarski, and B.N.J. Persson, Electron-energy-loss study of the space-charge region at semiconductor surfaces. Phys. Rev. B, 1987. 35: p. 9128. PerssoPhys. Rev. B, 1984. 30: p. 5968. Fuchs, R. and K.L. Kliewer, Optical modes of vibration in an ionic cystal slab. Phys. Rev., 1965. 140: p. A2076.
53. Ibach, H., Optical surface phonons in zinc oxide detected by slow-electron spectroscopy. Phys. Rev. Lett., 1970. 24: p. 1416. Cox, P.A. and A.A. Williams, The obseelctronic transition in NiO single cystals by EELS. Surf. Sci., 1984. 152/153: p. 791. Ueba, H., Vibrational lineshapes of adsorbates on solid surfaces. Prog. Surf. Sci., 1986. 22: p. 181.
56. Ibach, H., H. Hopster, and B. Sexton, Analysis of surface reactions by spectroscopy of surface vibration. Appl. Surf. Sci., 1977. 1: p. 1.
57. Sheppard, N., Vibrational spectroscopy studies of the structure of species derived from chemisorption of hydrocarbons 39: p. 589. Ibach, H. and D.L. Mills, Electron Energy Loss SpectroscopAcademic Press, New York. Guo, Q., K. Luo, K.A. Davis, and D.W. GoodmInterface Anal. , 2001. 32: p. 161. Iakoubovshii, K., K. Mitsuishi, Y. Nakayama, and K. Furuya, Thickness measurement with elec
61. Cox, P.A., W.R. Flavell, and A.A. Williams, Application of Fourier transform techniques to deconvolution of HREEL spectra. Surf. Sci., 1985. 152/153: p. 784. Redhead, P.A., Thermal
131
63. Chan, C.M. and W.H. Weinberg, An analysis of thermal desorption mass spetra II. Appl. Surf. Sci., 1978. 1: p. 377. Chan, C.M., R. Aris, an64. d W.H. Weinberg, An analysis of thermal desorption mass spectra I.
65. parameters in temperature programmed desorption: A comparison of
66. e. Surf. Sci.,
67. , and J.L. Trevor, Surface mass spectrometry of
68. rfaces: a review. Surf. Sci., 1975. 47: p. 384.
.
ci., 1994. 314: p. 243.
s over ZnO:
72. 82: p. 55.
udy. Phys. Chem. Chem. Phys., 2006. 8: p. 1477.
M and STS calculations. Angew. Chem. Int. Ed., 2007. 46: p. 4894.
ransaction, 2006: p. 4191.
77. romoted
78. rd, J., J. Storm, S.V. Christensen, J. Nerlov, P.J. Godowski, P. Morgen, and D.
2. Surf. Sci., 1995. 336: p. 101.
80. , K. Wolter, B. Dillmann, G. Klivenyi, H.J. Freund, D. Scarano, and A. Zecchina,
81. rschwald, Adsorption of CO and CO2 on annealed and defect
. Qiu, F. Traeger, D.
Appl. Surf. Sci., 1978. 1: p. 360. Miller, J.B., H.R. Siddiqui, S.M. Gates, J.N. Russell, J.T. Yates, J.C. Tully, and M.J. Cardillo, Extraction of kineticmethods. J. Chem. Phys. 87: p. 6725.
Ertl, G., M. Neumann, and K.M. Streit, Chemisorption of CO on the Pt(111) surfac1977. 64: p. 393. Hanley, L., O. Kornienko, E.T. Ada, E. Fuocomolecular species. J. Mass. Spectrom., 1999. 34: p. 705. King, D.A., Thermal desorption from metal su
69. Heinz, K., LEED and DLEED as modern tools for quantitative surface structure determination. Rep. Prog. Phys., 1995. 58: p. 637
70. Over, H., M. Gierer, H. Bludau, G. Ertl, and S.Y. Tong, Fingerprinting technique in low-energy electron diffraction. Surf. S
71. Wilmer, H., M. Kurtz, K.V. Klementiev, O.P. Tkachenko, W. Grünert, O. Hinrichsen, A. Birkner, S. Rabe, K. Merz, M. Driess, C. Wöll, and M. Muhler, Methanol synthesiA structure-sensitive reaction? Phys. Chem. Chem. Phys., 2003. 5: p. 4736. Wöll, C., The chemistry and phyiscs of zinc oxide surfaces. Prog. Surf. Sci., 2007.
73. Yin, X., A. Birkner, K. Hänel, T. Löber, U. Köhler, and C. Wöll, Adsorption of atomic hydrogen on ZnO(10-10): STM st
74. Kovacik, R., B. Meyer, and D. Marx, F center versus dimer vacancies on ZnO surfaces: characterization by ST
75. Schenk, S., J. Notni, U. Köhn, K. Wermann, and E. Anders, CO2 and related heterocumulenes at Zn and Li cations. Dalton T
76. Waugh, K.C., Methanol synthesis. Catal. Today, 1992. 15: p. 51. Solymosi, F., The bonding, structure and reaction of CO2 adsorbed on clean and pmetal surfaces. J. Mol. Catal., 1991. 65: p. 337. OnsgaaBatchelor, The interaction of CO2 with potassium-promoted Cu(100): adsorption, reaction and radiation induced dissociation of CO
79. Meyer, G., E. Reinhart, D. Borgmann, and G. Wedler, Interaction of CO2 with potassium-pormoted Fe(110). Surf. Sci., 1994. 320: p. 110. Seiferth, O.IR investigations of CO2 adsorption on Cr2O3. Surf. Sci., 1999. 421: p. 176. Au, C.T., W. Hirsch, and W. HiZnO(000-1) surfaces studied by photoelectron spectroscopy (XPS and UPS). Surf. Sci., 1988. 197: p. 391.
82. Lafosse, A., Y. Wang, and K. Jacobi, Carbonate formation on the O-enriched RuO2(110) surface. J. Chem. Phys., 2002. 117: p. 2823.
83. Fuchs, R. and K.L. Kliewer, Optical modes of vibration in an ionic crystal slab. Phys. Rev., 1965. 140: p. A2076.
84. Wang, Y., R. Kovacik, B. Meyer, K. Kotsis, D. Stodt, V. Staemmler, H
132

Langenberg, M. Muhler, and C. Wöll, CO2 activation by ZnO through the formation of an unusual tridentate surface carbonate. Angew. Chem. Int. Ed., 2007. 46: p. 5624.
l, CO2 adlayer on ZnO(10-10) surface studied by HAS and
86. 87. ebold, M. Kunat, D. Langenberg, and C. Wöll, Partial
p. 6642.
21. e
ocalorimetry. J. Phys. Chem. C,
91. imetry 2. J. Phys.
.
94. S studies of CO coordination to the
97.
99. e dynamical change in a water
100. surf. Sci. Rep.,
101. ociated monolayers. Phys. Chem. Chem. Phys., 2006. 8: p. 1513.
s. Chem. Chem. Phys., 2006. 8: p. 1505.
ts: structural sensitivity. J. Catal., 1996. 161: p. 776.
85. Kotsis, K., D. Stodt, V. Staemmler, R. Kovacik, B. Meyer, F. Traeger, D. Langenberg, T. Strunskus, M. Kunat, and C. WölAb initio calculation. Z. Phys. Chem., 2008. 222: p. 891. Qiu, H., Y. Wang, and C. Wöll, to be published. Meyer, B., D. Marx, O. Dulub, U. Didissociation of water leads to stable superstructures on the surface of ZnO. Angew. Chem. Int. Ed., 2004. 43:
88. Wang, Y., M. Muhler, and C. Wöll, Spectroscopic evidence for the partial dissociation of H2O on ZnO(10-10). Phys. Chem. Chem. Phys., 2006. 8: p. 15
89. Wang, Y., X. Xia, A. Urban, H. Qiu, J. Strunk, B. Meyer, M. Muhler, and C. Wöll, Tuning threactivity of oxide surfaces by charge-accepting adsorbates. Angew. Chem. Int. Ed., 2007. 46: p. 7315.
90. Xia, X., J. Strunk, W. Busser, R.N. d'Alnoncourt, and M. Muhler, Probing the surface heterogeneity of polycrystalline ZnO by static adsorption micr2008. 112: p. 10938. Xia, X., J. Strunk, R.N. d'Alnoncourt, W. Busser, L. khodeir, and M. Muhler, Probing the surface heterogeneity of polycrystalline Zno by static adsorption microcalorChem. C, 2008. 112: p. 10931.
92. Yuan, Q., Y. Zhao, L. Li, and T. Wang, Ab inito study of ZnO based gas-sensing mechanisms: surface reconstruction and charge transfer. J. Phys. Chem. C, 2009. 113: p. 6107.
93. Wang, Y., B. Meyer, X. Yin, M. Kunat, D. Langenberg, F. Traeger, A. Birkner, and C. Wöll, Hydrogen induced metallicity on the ZnO(10-10) surface. Phys. Rev. Lett., 2005. 95: p266104. D'Amico, K.L., F.R. McFeely, and E.I. Solomon, HREEL(10-10) surface of ZnO. J. Am. Chem. Soc., 1983. 105: p. 6380.
95. Henderson, M.A., The interaction of H2O with solid surfaces: fundamental aspects revisited. Surf. Sci. Rep., 2002. 46: p. 1.
96. Feibelman, P.J., Partial dissociation of water on Ru(0001). Science, 2006. 295: p. 99. Woutersen, S. and H.J. Bakker, Resonant intermolecular transfer of vibrational energy in liquid water. Nature, 1999. 402: p. 507.
98. G. E. Brown, J., How minerals react with water. Science, 2001. 294: p. 67. Dulub, O., B. Meyer, and U. Diebold, Obervation of thmonolayer adsorbed on a ZnO surface. Phys. Rev. Lett., 2005. 95: p. 136101. Thiel, P.A., The interaction of H2O with solid surfaces: fundamental aspects.1987. 7: p. 211. Meyer, B., H. Rabaa, and D. Marx, Water adsorption on ZnO(10-10): from single molecules to partially diss
102. Schiek, M., K. Al-Shamery, M. Kunat, F. Traeger, and C. Wöll, Water adsorption on the hydroxylated H-(1x1)O-ZnO(000-1) surface. Phy
103. Yoshihara, J. and C.T. Campbell, Methanol synthesis and reverse water gas shift kinetics over Cu(110) model catalys
104. Topsoe, N.Y. and H. Topsoe, J. Mol. Catal. A, 1999. 141: p. 95.
133

105. 08. 101: p.
106. v. B, 2002. 66: p. 081402.
Wöll, The interaction of water with the
108. s. Chem. C, 2009. 113: p. 2896.
472: p. 9.
111. Diebold, U., The surface science of titanium dioxide. Surf. Sci. Rep., 2003. 48: p. 53.
113. Grätzel, A low-cost, high-efficiency solar cell based on dye-sensitized
114. 37.
01. 114: p. 10058. 2(110):
120. M. Knapp, H. Idriss, and H. Over, Complex redox 2. 505: p. 137.
um-oxide and -hydroxide cluster cations. J. Phys. Chem. A, 2006. 110: p.
123. O2(001) single
124. of
125. metal oxide-from
Qiu, H., B. Meyer, Y. Wang, and C. Wöll, Ionization energies of shallow donor states in ZnO created by reversible formation and depletion of H interstitials. Phys. Rev. Lett., 20236401. Kunat, M., S.G. Girol, T. Becker, U. Burghaus, and C. Wöll, Stability of the polar surfaces of ZnO: a reinvestigation using He-atom scattering. Phys. Re
107. Kunat, M., S.G. Girol, U. Burghaus, and C.oxygen-terminated, polar surface of ZnO. J. Phys. Chem. B, 2003. 107: p. 14350. Calzolari, A. and A. Catellani, H2O adsorption on nonpolar ZnO(10-10) surface: a microscopic understanding. J. Phy
109. Jacobi, K., K. Bedürftig, Y. Wang, and G. Ertl, From monomers to ice: new vibrational characteristics of H2O adsorbed on Pt(111). Surf. Sci., 2001.
110. Henderson, M.A., An HREELS and TPD study of H2O on TiO2(110): the extent of molecular versus dissociative adsorption. Surf. Sci., 1996. 355: p. 151.
112. Thompson, T.L. and J.T. Yates, Surface science studies of photoactivation of TiO2--New photochemical processes. Chem. Rev., 2006. 106: p. 4428. O'Regan, B. and M. colloidal Tio2 films. Nature, 1991. 353: p. 737. Fujishima, A. and K. Honda, Electrochemical photolysis of water at a semiconductor electrode. Nature, 1972. 238: p.
115. Chen, M.S. and D.W. Goodman, The structure of catalytically active gold on Titania. Science, 2004. 306: p. 252.
116. Epling, W.S., C.H.F. Peden, M.A. Henderson, and U. Diebold, Evidence for oxygen adatoms on TiO2(110) resulting from O2 dissociation at vacancy sites. J. Phys. Chem. C, 1998. 412/413: p. 333.
117. Lu, G., A. Linsebigler, and J.T. Yates, Ti3+ defect site on TiO2(110); Production and chemical detection of ative sites. J. Phys. Chem., 1994. 98: p. 11733.
118. Fan, C.Y., J. Wang, K. Jacobi, and G. Ertl, The oxidation of CO on RuO2(110) at room temperature. J. Chem. Phys., 20
119. Wang, J., C.Y. Fan, K. Jacobi, and G. Ertl, The kinetics of CO oxidation on RuOBridging the pressure gap. j. Phys. Chem. B, 2002. 106: p. 3422. Wendt, S., A.P. Seitsonen, Y.D. Kim, chemistry on the RuO2(110) surface: experiment and theory. Surf. Sci., 200
121. Idriss, H. and E.G. Seebauer, Effect of oxygen electronic polarisability on catalytic reactions over oxides. Catal. Lett., 2000. 66: p. 139.
122. Feyel, S., D. Schroder, and H. Schwarz, Gas-phase oxidation of isomeric butenes and small alkanes by vanadi2647. Idriss, H. and M.A. Barteau. Reductive coupling of cyclic ketones on reduced Ticrystal surfaces. 1993: Elsevier Science Publ B V. Idriss, H., K.S. Kim, and M.A. Barteau, Carbon Carbon bond formation via aldolizationacetaldehyde on single crystals and polycrystalline TiO2 surface. J. Catal., 1993. 139: p. 119. Idriss, H., M. Libby, and M.A. Barteau, Carbon Carbon bond formation onsingle crystals toward catalysis. Catal. Lett., 1992. 15: p. 13.
134

126. Idriss, H., K. Pierce, and M.A. Barteau, Carbonyl coupling on the TiO2(001) surface. J. Am. Chem. Soc., 1991. 113: p. 715. Idriss, H127. ., K.G. Pierce, and M.A. Barteau, Synthesis of stilbene from benzaldehyde by
128. . 2000:
129. al surfaces.
130. UO2(111) single crystal
131. drocarbons over
989. 89:
133. of the McMurry reaction. Angew.
134. G. Ertl, P. Salo, T. Ala-Nissila, and S.C. Ying,
135. , S.C. Ying, K. Jacobi, Y. Wang, K. Bedurftig, and G. Ertl,
136. urftig, Y. Wang, and G. Ertl, From monomers to ice - new vibrational
137. er-bar-0) surface. Surf. Sci., 2002. 513: p. 83.
ci.,
142. REELS study of the interaction of formic acid with
143. loss spectroscopy of polar materials-studies of water and methanol adosrption on ultra
144. runk, B. Meyer, M. Muhler, and C. Woll,
e. Chem. Phys. Chem., 2008. 9:
reductive coupling on TiO2(001) surfaces. J. Am. Chem. Soc., 1994. 116: p. 3063. Chong, S.V. and H. Idriss. Reactions of acetic acid on UO2(111) single crystal surfacesAmer Inst Physics. Chong, S.V. and H. Idriss. Reactions of acetaldehyde on UO2(111) single crystEvidence of benzene formation. 2001: Amer Inst Physics. Chong, S.V. and H. Idriss, The reactions of carboxylic acids onsurfaces. Effect of gas-phase acidity and surface defects. Surf. Sci., 2002. 504: p. 145. Ormerod, R.M. and R.M. Lambert, Partial oxidatin of unsaturation hyPd(111)-oxygen scavenging of reactive intermediate and the formation of furan from C2H2 and C4H4. Catal. Lett., 1990. 6: p. 121.
132. McMurry, J.E., Carbonyl coupling reactins using low valent Titanium. Chem. Rev., 1p. 1513. Stahl, M., U. Pidun, and G. Frenking, On the mechanism Chem. Int. Ed., 1997. 36: p. 2234.
Badescu, S.C., K. Jacobi, Y. Wang, K. Bedurftig,Vibrational states of a H monolayer on the Pt(111) surface. Phys Rev. B, 2003. 68: p. 6.
Badescu, S.C., P. Salo, T. Ala-NissilaEnergetics and vibrational states for hydrogen on Pt(111). Phys. Rev. Lett., 2002. 88: p. 4. Jacobi, K., K. Bedcharacteristics of H2O adsorbed on Pt(111). Surf. Sci., 2001. 472: p. 9. Wang, Y. and K. Jacobi, Vibrational characterization of NH and NH2 reaction intermediates on the Ru(11(2)ov
138. Wang, Y. and K. Jacobi, Adsorption and reaction of ammonia on the Ru(1120) surface. J. Phys. Chem. B, 2004. 108: p. 14726.
139. Wang, Y., A. Lafosse, and K. Jacobi, Stepwise dehydrogenation of NH3 at the Ru(1120) surface. Surf. Sci., 2002. 507: p. 773.
140. Fuchs, R. and K.L. Kliewer, Optical modes of vibration in an ionic crystal slab. Phys Rev., 1965. 140: p. 2076.
141. Cox, P.A. and A.A. Williams, The observation of surface optical phonons and low energy electronic transition in NiO single crystals by electron energy loss spetroscopy. Surf. S1985. 152: p. 791. Crook, S., H. Dhariwal, and G. Thornton, HZnO(10(1)over-bar0) and ZnO(000(1)over-bar)-O. surf. Sci., 1997. 382: p. 19. Wu, M.C., C.A. Estrada, and D.W. Goodman, New approach to high resolution electron energy thin MgO(100) films. Phys. Rev. Lett., 1991. 67: p. 2910. Wang, Y.M., X.Y. Xia, A. Urban, H.S. Qiu, J. StTuning the reactivity of oxide surfaces by charge-accepting adsorbates. Angew. Chem. Int. Ed., 2007. 46: p. 7315.
145. Yin, X.L., M. Calatayud, H. Qiu, Y. Wang, A. Birkner, C. Minot, and C. Woll, Diffusion versus desorption: Complex behavior of H atoms on an oxide surfac
135

p. 253. Nakanaga, T., S. Kondo, and146. S. Saeki, Infrrared band intensity of formaldehyde and
147. Cu(100). J.
148. . Wu, and D.W. Goodman, Adsorption of formaldehyde on nickel oxide
151. CO photooxidation on TiO2(110). J. Phys. Chem.,
152. and J.E. Mark, Conformation energies and random coil dimensions and dipole
153. oll, The adsorption of hydrogen on the rutile TiO2(110)
154. toms
ction of O-2 with OH
156. d U. Diebold, Interaction of
9. 103: p. 5328.
ys. Chem., 1994. 98: p. 11733.
p. 4.
01. 87: p. 266104.
.
. 317: p. 1052.
formaldehyde-D2. J. Chem. Phys., 1982. 76: p. 3860. Bryden, T.R. and S.J. Garrett, Adsorption and polymerization of formaldehyde on Phys. Chem. B, 1999. 103: p. 10481. Truong, C.M., M.Cstudied by thermal programmed desorption and high resolution electron energy loss spectroscopy. J. Am. Chem. Soc., 1993. 115: p. 3647.
149. Idriss, H., K.S. Kim, and M.A. Barteau, Surface dependent parthway for formaldehyde oxidation and reduction on TiO2(001). Surf. Sci., 1992. 262: p. 113.
150. Sorescu, D.C. and J.T. Yates, Adsorption of CO on the TiO2(110) surface: A theoretical study. J. Phys. Chem. B, 1998. 102: p. 4556. Linsebigler, A., G.Q. Lu, and J.T. Yates, 1996. 100: p. 6631. Abe, A. moments of polyoxides CH3O[(CH2)YO]XCH3. J. Am. Chem. Soc., 1976. 98: p. 6468. Kunat, M., U. Burghaus, and C. Wsurface. Phys. Chem. Chem. Phys., 2004. 6: p. 4203. Epling, W.S., C.H.F. Peden, M.A. Henderson, and U. Diebold, Evidence for oxygen adaon TiO2(110) resulting from O-2 dissociation at vacancy sites. Surf. Sci., 1998. 412-13: p. 333.
155. Henderson, M.A., W.S. Epling, C.H.F. Peden, and C.L. Perkins, Insights into photoexcited electron scavenging processes on TiO2 obtained from studies of the reagroups adsorbed at electronic defects on TiO2(110). J. Phys. Chem. B, 2003. 107: p. 534. Henderson, M.A., W.S. Epling, C.L. Perkins, C.H.F. Peden, anmolecular oxygen with the vacuum-annealed TiO2(110) surface: Molecular and dissociative channels. J. Phys. Chem. B, 199
157. Lu, G.Q., A. Linsebigler, and J.T. Yates, Ti3+ defect sites on TiO2(110)-production and chemical defection of activie sites. J. Ph
158. Brookes, I.M., C.A. Muryn, and G. Thornton, Imaging water dissociation on TiO2(110). Phys. Rev. Lett., 2001. 87:
159. Schaub, R., R. Thostrup, N. Lopez, E. Laegsgaard, I. Stensgaard, J.K. Norskov, and F. Besenbacher, Oxygen vacancies as active sites for water dissociation on rutile TiO2(110). Phys. Rev. Lett., 20
160. Brown, N.F. and M.A. Barteau, Carbon halogen bond scission and rearrangement of beta-halohydrins on the Rh(111) surface. J. Phys. Chem., 1994. 98(48): p. 12737
161. Queeney, K.T., C.R. Arumainayagam, M.K. Weldon, C.M. Friend, and M.Q. Blumberg, Differential reactivity and structure of mono- and dialkoxides: The reactions of ethylene glycol on Mo(110). J. Am. Chem. Soc., 1996. 118: p. 3896.
162. Dulub, O., M. Batzill, S. Solovev, E. Loginova, A. Alchagirov, T.E. Madey, and U. Diebold, Electron-induced oxygen desorption from the TiO2(011)-2x1 surface leads to self-organized vacancies. Science, 2007
163. Zhang, Z., Q. Ge, S.C. Li, B.D. Kay, J.M. White, and Z. Dohnalek, Imaging intrinsic diffusion of bridge-bonded oxygen vacancies on TiO2(110). Phys. Rev. Lett., 2007. 99: p. 126105.
136

164. n, E.M., J.D. Protasiewicz, and S.J. Lippard, 15 years of reductive coupling-what have
165. e mechanism of the McMurry reaction.
166. A. Selloni, Electronic structure of defect states in
167. species over Cu-ZnO catalysts. J. Mol.
168. nd stability of the rutile
15410.
senbacher, Imaging of the hydrogen subsurface site in rutile TiO2. Phys.
170. -(1x1)
172. D., E. Garfunkel, and T. Gustafsson, Scanning-tunneling-microscopy study of the
173. : p.
174.
. Chem. Phys. Chem.,
176. n, K. Ng, and D. Vanderbilt, Evidence for the tunneling site on
177. 2(110)(1x1) surface and their reaction with oxygen: a
178. rmation on
179. Hammer, and F. Besenbacher,
180. lar O-ZnO surface in the thermodynamic equilibrium
181. n
Carnahawe learned. Acc. Chem. Res., 1993. 26: p. 90. Villiers, C. and M. Ephritikhine, New insights into thAngew. Chem. Int. Ed., 1997. 36: p. 2380. Di Valentin, C., G. Pacchioni, and hydroxylated and reduced rutile TiO2(110) surfaces. Phys. Rev. Lett., 2006. 97: p. 4. Idriss, H., J.P. Hindermann, R. Kieffer, A. Kiennemann, A. Vallet, C. Chauvin, J.C. Lavalley, and P. Chaumette, Characterization of dioxymethyleneCatal., 1987. 42: p. 205. Kowalski, P.M., B. Meyer, and D. Marx, Composition, structure aTiO2(110) surface: oxygen depletion, hydroxylation, hydrogen migration and water adsorption. Phys Rev. B, 2009. 79: p. 1
169. Enevoldsen, G.H., H.P. Pinto, A.S. Foster, M.C.R. Jensen, W.A. Hofer, B. Hammer, J.V. Lauritsen, and F. BeRev. Lett., 2009. 102: p. 136103. Suzuki, S., K. Fukui, H. Onishi, and Y. Iwasawa, Hydrogen adatoms on TiO2(110)characterized by scanning tunneling microscopy and electron stimulated desorption. Phys. Rev. Lett., 2000. 84: p. 2156.
171. Avci, R., O.B. Dabbousi, and A.S. Al-Harthi, Alkali adsorption and its effect on hydrogen saturated Si(111) surface. J. Vac. Sci. Technol. A, 1988. 6: p. 748. Novak, atomic-scale structure of TiO2(110)-(1x1). Phys. Rev. B, 1994. 50: p. 5000. Kresse, G. and J. Hafner, Ab initio molecular-dynamics simulation of the liquid-metal-amorphous-semiconductor transition in germanium. Phys. Rev. B, 1994. 4914251. Kresse, G. and J. Hafner, Ab initio molecular dynamics for liquid metals. Phys. Rev. B, 1993. 47: p. 558.
175. Yin, X.-L., M. Calatayud, H. Qiu, Y. Wang, A. Birkner, C. Minot, and C. Wöll, Diffusion versus desorption complex behavior of H atoms on an oxide surface2008. 9: p. 253. Diebold, U., J.F. Andersotransition-metal oxides: TiO2(110). Phys. Rev. Lett., 1996. 77: p. 1322. Diebold, U., J. Lehman, T. Mahmoud, M. Kuhn, G. Leonardelli, W. Hebenstreit, M. Schmid, and P. Varga, Intrinsic defects on a TiOscanning tunneling microscopy study. Surf. Sci., 1998. 411: p. 137. Fujino, T., M. Katayama, K. Inudzuka, T. Okuno, and T. Hirao, Surface hydroxyl fovacuum-annealed TiO2(110). Appl. Phys. Lett., 2001. 79: p. 2716. Wendt, S., R. Schaub, J. Matthiesen, E.K. Vestergaard, E. Wahlstrom, M.D. Rasmussen, P. Thostrup, L.M. Molina, E. Laegsgaard, I. Stensgaard, B. Oxygen vacancies on TiO2(110) and their interaction with H2O and O2: a combined high-resolution STM and DFT study. Surf. Sci., 2005. 598: p. 226. Meyer, B., First principle study of the powith oxygen and hydrogen. Phys Rev. B, 2004. 69: p. 045416. Calatayud, M., A. Markovits, and C. Minot, Electron-count control on adsorption upo
137

reducible and irreducible clean metal-oxide surfaces. Catal. Today, 2004. 89: p. 269. Christmann, K., Interaction of hydrogen with so182. lid-surfaces. Surf. Sci. Rep., 1988. 9: p. 1.
Phys., 2003. 5: p. 4962.
187. nitio atomistic thermodynamics and statistical
188. M ronic structure of ideal TiO2(110), TiO(001), and TiO2(100)
189. TiO2(110). Phys. Rev. B, 2006. 73: p. 195309.
193. ., L.A. Boatner, and U. Diebold, STM study of the geometric and electronic structure
194. ., The stability of ionic crystal surfaces. J. Phys. C: Solid State Phys., 1979. 12: p.
195. 196. chedin, P. Steadman, A. Norris, R. McGrath, T.S. Turner, G. Thornton, and
197. , B. Nemeth, and J.E.
198. O surfaces. Phys. Rev. B,
199. anism on polar surfaces:
200.
201. f polar ZnO surfaces:
183. Kunat, M., U. Burghaus, and C. Wöll, Adsorption of hydrogen on the polar O-ZnO surface: a molecular beam study. Phys. Chem. Chem.
184. Bates, J.B. and R.A. perkins, Infrared spectral properties of hydrogen, Deuterium and Tritium in TiO2. Phys. Rev. B, 1977. 8: p. 3713.
185. Bromiley, G.D. and A.A. Shiryaev, Neutron irradiation and post-irradiation annealing of rutile (TiO2-x): effect on hydrogen incorporation and optical absorption. Phys. Chem. Miner., 2006. 33: p. 426.
186. Koudriachova, M.V., S.W.d. Leeuw, and N.M. Harrison, First principles study of H intercalation in rutile TiO2. Phys. Rev. B, 2004. 70: p. 165421. Reuter, K., C. Stampfl, and M. Scheffler, Ab imechanics of surface properties and functions, in Handbook of materials modeling, S. Yip, Editor. 2005, Springer: Berlin. p. 149-194.
unnix, S. and M. Schmeits, Electsurfaces. Phys. Rev. B, 1984. 30: p. 2202. Zhao, J., B. Li, K.D. Jordan, J. Yang, and H. petek, Interplay between hydrogen bonding and electron solvation on hydrated
190. Thibado, P.M., G.S. Rohrer, and D.A. Bonnell, Experimental and simulated tunneling spectra of the polar ZnO surfaces. Surf. Sci., 1994. 318: p. 379.
191. Rohrer, G.S. and D.A. Bonnell, The geometric and electronic structure of the ZnO(000-1) surface. Surf. Sci., 1991. 247: p. L195.
192. Parker, T.M., N.G. Condon, R. Lindsay, F.M. Leibsle, and G. Thornton, Imaging the polar (000-1) and nonpolar (10-10) surfaces of ZnO with STM. Surf. Sci., 1998. 415: p. L1046. Dulub, Oof ZnO(0001)-Zn, (000-1)-O, (10-10) and (11-20) surfaces. Surf. Sci., 2002. 519: p. 201. Tasker, P.W4977. Noguera, C., Polar oxide surfaces. J. Phys.: Condens. Matter, 2000. 12: p. R367. Wander, A., F. SN.M. Harrison, Stability of polar oxide surface. Phys. Rev. Lett., 2001. 86: p. 3811.
Chevtchenko, S.A., J.C. Moore, Ü. Özgür, X. Gu, A.A. Baski, H. MorkocNause, Comparative study of the (0001) and (000-1) surface of ZnO. Appl. Phys. Lett., 2006. 89: p. 182111.
Meyer, B. and D. Marx, DFT study of the structure and stability of Zn2003. 67: p. 035403. Dulub, O., U. Diebold, and G. kresse, Novel stabilization mechZnO(000-1)-Zn. Phys. Rev. Lett., 2003. 90: p. 016102. Kresse, G., O. Dulub, and U. Diebold, Competing stabilization mechanism for the polar ZnO(0001)-Zn surface. Phys. Rev. B, 2003. 68: p. 245409. Staemmler, V., K. Fink, B. Meyer, and D. Marx, Stabilization ovalidating microscopic models by using CO as a probe molecule. Phys. Rev. Lett., 2003. 90: p. 106102.
202. Bruno, G., M.M. Giangregorio, G. Mlandrino, P. Capezzuto, I.L. Fragala, and M. Losurdo, Is
138

there a ZnO face stable to atomic hydrogen? Adv. Mater., 2009. 21: p. 1700. 203. Meyer, B., First principle study of the polar O-terminated ZnO surface in thermodynamica
204. 00-1)-O surface structure
205. , and R.R. Gay, Explanation of the 6-fold LEED
206. terminated ZnO and influence of defects. Phys. Rev. B, 2000. 61: p. 4538.
210. th and structure of ultrathin FeO films on Pt(111)
211. ögl, Interaction
ntal
(12): p. 2601-2604. . Orlinskii,
217. tavola, S.J. Pearton, M. Thieme, E.V. Lavrov, and J. Weber, Hydrogen local
218. ng von H2 auf die ... Z. Physik, 1954. 138: p. 478.
222. ., Hall effect studies of doped zinc oxide single crystals. Phys. Rev., 1957. 108: p.
equilibrium with oxygen and hydrogen. Phys. Rev. B, 2004. 69: p. 045416. Lindsay, R., C.A. Muryn, E. Michelangeli, and G. Thornton, ZnO(0hydrogen-free (1x1) termination. Surf. Sci., 2004. 565: p. L283. Henrich, E., H.J. Zeiger, E.I. Solomonpatterns from polar (0001) and (000-1) ZnO surface. Surf. Sci., 1978. 74: p. 682.
Becker, T., C. Boas, U. Burghaus, and C. Wöll, Adsorption probability of CO on a metal oxide: the case of oxygen
207. Thornton, G., S. Crook, and Z. Chang, A HREELS study of the effect of Cu on the interaction of HCOOH with ZnO(000-1)-O. Surf. Sci., 1998. 415: p. 122.
208. Solomon, E.I., P.M. Jones, and J.A. May, Electronic structure of active sites on metal oxide surfaces: definition of the Cu/ZnO methanol synthesis catalyst by photoelectron spectroscopy. Chem. Rev., 1993. 93: p. 2623.
209. Henzler, M., The roughness of cleaved semiconductor surfaces. Surf. Sci., 1973. 36: p. 109. Ritter, M., W. Ranke, and W. Weiss, Growstudied by STM and LEED. Phys. Rev. B, 1998. 57: p. 7240. Joseph, Y., M. Wühn, A. Niklewski, W. Ranke, W. Weiss, C. Wöll, and R. Schlof ethylbenzene and styrene with iron oxide model catalyst films at low coverages: a NEXAFS study. Phys. Chem. Chem. Phys., 2000. 2: p. 5314.
212. Ketteler, G. and W. Ranke, Heteroexpitaxial growth and nucleation of Iron oxide films on Ru(0001). J. Phys. Chem. B, 2003. 107: p. 4320.
213. Walle, C.G.v.d., Hydrogen as a cause of doping in zinc oxide. Phys. Rev. Lett., 2000. 85: p. 1012.
214. Cox, S.F.J., E.A. Davis, S.P. Cottrell, P.J.C. King, J.S. Lord, J.M. Gil, H.V. Alberto, R.C. Vilao, J.P. Duarte, N.A. de Campos, A. Weidinger, R.L. Lichti, and S.J.C. Irvine, Experimeconfirmation of the predicted shallow donor hydrogen state in zinc oxide. Phys. Rev. Lett., 2001. 86
215. Hofmann, D.M., A. Hofstaetter, F. Leiter, H. Zhou, F. Henecker, B.K. Meyer, S.Band J. Schmidt, Hydrogen: A relevant shallow donor in zinc oxide. Phys. Rev. Lett. , 2002. 88: p. 045504.
216. Shi, G.A., M. Saboktakin, and M. Stavola, "Hidden hydrogen" in as-grown ZnO. Appl. Phys. Lett., 2004. 85: p. 5601. Shi, G.A., M. Smodes and shallow donors in ZnO. Phys. Rev. B, 2005. 72: p. 195211. Mollwo, E., Die Wirku
219. Thomas, D.G. and J.J. Lander, Hydrogen as a donor in zinc oxide. J. Chem. Phys. , 1956. 25: p. 1136.
220. Hishinuma, N., High-sensitivity ZnO-semiconductor detector for atomic hydrogen beams. Rev. Sci. Instrum., 1981. 52: p. 313.
221. Göpel, W., Chemisorption and charge transfer at ionic semiconductor surfaces: implications in designing gas sensors. Prog. Surf. Sci., 1985. 20: p. 9. Hutson, A.R222.
139

223. ia on RuO2(110)
224. nd defective oxide
225.
227. electron by
228.
230. ture and the properties of solids: the physics of the chemical
p. 3807.
233. nat, U. Burghaus, S.G. Girol, and C. Wöll,
-4.
235. .H.D. and W.C.v. Geel, Rotgrenze des... Physica, 1935. 2: p. 286.
237.
238. g, The importance of water in the mechanism of methanol
239.
e, and S. Lizzit, Impact of defects on the surface chemistry of
241. sorption and reactions
ical study and STM observation of dehydration process of HCOOH on TiO2(110)
243. n HREELS investigation of the adsorption and reaction of
244. f the interaction of formic acid with
245. , T., K. Asakuba, and Y. Iwasawa, Reactant promoted reaction mechanism for catalytic
Wang, Y., K. Jacobi, W.D. Schöne, and G. Ertl, Catalytic oxidation of ammonsurfaces: mechanism and selectivity. J. Phys. Chem. B, 2005. 109: p. 7883. Wang, Y., High resolution electron energy loss spectroscopy on perfect asurfaces. Z. Phys. Chem., 2008. 122: p. 927. Petrie, W.T. and J.M. Vohs, J. Chem. Phys., 1994. 101: p. 8098.
226. Crook, S., H. Dhariwal, and G. Thornton, Surf. Sci., 1997. 382: p. 19. Stroscio, J.A. and W. Ho, Long-range quasielastic scattering of low-energy conduction-band surface plasmon on Si(111)7x7. Phys. Rev. Lett., 1985. 54: p. 1573. Modesti, S., V.R. Dhanak, M. Sancrotti, A. Santoni, B.N. Persson, and E. Tosatti, Hightemperature surface metallization of Ge(111) detected by electron energy loss spectroscopy. Phys. Rev. Lett., 1994. 73: p. 1951.
229. Hellwege, K.-H., O. Madelung, and Landolt-Bornstein, Semiconductors Physics of II-VI and I-VII Compounds Vol. 17. 1987: Springer, New York. Harrison, W.A., Electronic strucbond. 1989, New York: Dover Publications, Dover books on physics.
231. McCluskey, M.D., S.J. Jokela, K.K. Zhuravlev, P.J. Simpson, and K.G. Lynn, Infrared spectroscopy of hydrogen in ZnO. Appl. Phys. Lett., 2002. 81:
232. Meyer, B., First-principles study of the polar O-terminated ZnO surface in thermodynamic equilibrium with oxygen and hydrogen. Physical Review B, 2004. 69(4): p. 045416. Staemmler, V., K. Fink, B. Meyer, D. Marx, M. KuStabilization of polar ZnO-surfaces: Validating microscopic models by using CO as a probe molec. Phys. Rev. Lett., 2003. 90(10): p. 106102-1
234. Kiss, J., A. Witt, B. Meyer, and D. Marx, Phys Rev. B, submitted. Boer, J
236. Huang, K. and X.D. Xie, Physics of semiconductors. 1958, Beijing: Science Press. Vohs, J.M. and M.A. Barteau, Conversion of methanol, CH2O and HCOOH on the polar ZnO surfaces. Surf. Sci., 1986. 176: p. 91. Chadwick, D. and K. Zhendecomposition on ZnO. Catal. Lett., 1993. 20: p. 231. Gercher, V.A. and D.F. Cox, HCOOH decomposition on SnO2(110). Surf. Sci., 1994. 312: p. 106.
240. Lindsay, R., E. Michelangeli, B.G. Daniels, T.V. Ashworth, A.J. Limb, G. Thornton, A.G. Sosa, A. Baraldi, R. LarcipretZnO(000-1)-O. J. Am. Chem. Soc., 2002. 124: p. 7117. Ludviksson, A., R. Zhang, C.T. Campbell, and K. Griffiths, The chemiof formic acid on Cu films on ZnO(000-1). Surf. Sci., 1994. 313: p. 64.
242. Morikawa, Y., I. Takahashi, M. Aizawa, Y. Namai, T. Sasaki, and Y. Iwasawa, First-principle theoretsurfaces. J. Phys. Chem. B, 2004. 108: p. 14446. Petrie, W.T. and J.M. Vohs, AHCOOH on the (0001)-ZnO surfaces. Surf. Sci., 1991. 245: p. 315. S.Crook, H. Dhariwal, and G. Thornton, HREELS study oZnO(10-10) and ZnO(000-1). Surf. Sci., 1997. 382: p. 19. Shido
140
water-gas shift reaction on MgO. J. Catal., 1990. 122: p. 55. Davis, R., J.F. Walsh, C.A. Muryn, and G. Thornton, The orientation of form246. ate and carbonate
247. and C. Hirose, Adsorption and decomposition of e kinetics studies. Surf. Sci.,
986. 90:
249. . J. Chem. Phys., 1964. 41: p. 1554.
0001.
s J. Anal. Chem., 1995.
252. .T. Campbell, and G.
254. d G. Thornton, Imaging the polar i., 1998. 415: p. L1046.
er, G. Thornton, and
rfaces. Surf. Sci., 2002. 519: p. 201.
03. 107: p. 14350.
sis. Catal. Rev.--Sci. Eng., 1997. 39: p. 77.
260. 261. he activity in methanol synthesis of
262. perties and electronic
263.
ts for methanol synthesis. Angew.
on ZnO(10-10). Surf. Sci. Lett., 1993. 298: p. L196. Bandara, A., J. Kubota, A. Wada, K. Domen, HCOOH on the NiO(111) p(2x2) surface: TPD and steady stat1996. 364: p. L580.
248. Lui, K., M. Vest, P. Berlowitz, S. Akhter, and H.H. Kung, Desorption of Zn from ZnO single crystal surfaces during TPD of methanol, HCOOH and 2-Propanol. J. Phys. Chem., 1p. 3183. Nakamoto, K. and S. Kishida, Normal coordinate analyses of hydrogen bonded compounds: Monomeric HCOOH and Acetic acid
250. Miura, T., H. Kobayashi, and K. Domen, Density functional study of formate decomposition on NiO(111) surface. J. Phys. Chem. B, 2001. 105: p. 1
251. Krummel, C., A. Freiling, R. Schmidt, J. Kelleter, H. Wollnik, and C.D. Kohl, Induced zinc desorption from zinc oxide during exposure to reducing agent. Freseniu353: p. 521. Sosa, A.G., S. Crook, S. Haq, R. Lindsay, A. Ludviksson, S. Parker, CThornton, Influnence of Cu overlayers on the interaction of CO and CO2 with ZnO(000-1)-O. Faraday Discuss., 1996. 105: p. 355.
253. Kunat, M., S. Girol, T. Becker, U. Burghaus, and C. Wöll, Stability of the polar surfaces of ZnO: a reinvestigation using HAS. Phys Rev. B, 2002. 66: p. 081402. Parker, T.M., N.G. Condon, R. Lindsay, F.M. Leibsle, an(000-1) and non-polar (10-10) surfaces of ZnO with STM. Surf. Sc
255. Wander, A., F. Schedin, P. Steadman, A. Norris, R. McGrath, T.S. TurnN.M. Harrison, Stability of polar oxide surfaces. Phys. Rev. Lett., 2001. 86: p. 3811.
256. Dulub, O., L.A. Boatner, and U. Diebold, STM study of the geometric and electronic structure of ZnO (000-1), (10-10) and (11-20) su
257. Kunat, M., S.G. Girol, U. Burghaus, and C. Wöll, The interaction of water with the oxygen terminated polar surface of ZnO. J. Phys. Chem. B, 20
258. Gunter, P.L.J. and J.W. Niemantsverdriet, Surface science approach to modeling supported cataly
259. Henry, C.R., Surface studies of supported model catalysts. Surf. Sci. Rep., 1998. 31: p. 231. Chinchen, G.C., K.C. Waugh, and D.A. Whan, Appl. Catal., 1986. 25: p. 101. Nonneman, L.E.Y. and V. Ponec, On the problem of tsuported unpromoted copper catalysts. Catal. Lett., 1990. 7: p. 213. Bulko, J.B., R.G. Herman, K. Klier, and G.W. Simmons, Optical prointeraction of microcrystalline Cu/ZnO catalysts. J. Phys. Chem., 1979. 83: p. 3118. Che, M. and C.O. Bennett, The influence of particle size on the catalytic properties of supported metals. Adv. Catal., 1989. 20: p. 153.
264. Frost, J.C., Junction effect interactions in methanol synthesis catalysts. Nature, 1988. 334: p. 577.
265. Kasatkin, I., P. Kurr, B. Kniep, A. Trunschke, and R. Schlögl, Role of lattice strain and defects in copper particles on the acitity of Cu/ZnO/Al2O catalysChem. Int. Ed., 2007. 46: p. 7324.
141

266. sorption energies of CO
267. O(0001)-Zn: Nucleation and annealing
268. e. J. Phys. Chem. B, 2003. 107: p. 10583.
270. .A., S.F. Parker, and R. Raval, Fourier transform reflection-absorption infrared
271. model catalysts:
272. ed spectroscopic study of CO on
273. 95. 2: p. 9.
275. olid state physics. 1976, Frome and London: Butler &
276. ner.
278.
Vollmer, S., G. Witte, and C. Wöll, Determination of site specific adon copper. Catal. Lett., 2001. 77: p. 97. Kroll, M. and U. Köhler, Small Cu clusters on Znbehavior. Surf. Sci., 2007. 601: p. 2182. Koplitz, L.V., O. Dulub, and U. Diebold, STM study of copper growth on ZnO(0001)-Zn and ZnO(000-1)-O surfac
269. Dulub, O., L.A. Boatner, and U. Diebold, STM study of Cu growth on the ZnO(10-10) surface. Surf. Sci., 2002. 504: p. 271. Chesters, Mspectroscopy of adsorbates on Cu(100) and Cu(111). Surf. Sci., 1986. 165: p. 179. Xu, X. and D.W. Goodman, Structurual and chemisorptive properties ofcopper supported on SiO2 thin films. J. Phys. Chem., 1993. 97: p. 683. Hayden, B.E., K. Kretzschmar, and A.M. Bradshaw, An infrarCu(111): The linear, bridge and physisorbed species. Surf. Sci., 1985. 155: p. 553. Goodman, D.W., Model catalysts-from extended single crystal to supported particles. Surf. Rev. Lett., 19
274. Wu, M.C., W.S. Oh, and D.W. Goodman, Initial sticking probabilities of Cu vacuum deposited on ordered Al2O3 and MgO. Surf. Sci., 1995. 330: p. 61. Ashcroft, N.W. and N.D. Mermin, STanner Ltd. Kopitzki, K., Einführung in die Festkörperphysik. 1993, Stuttgart: Teub
277. Myers, H.P., Introductory solid state physics. 1997, London: Taylor & Francis Ltd. Sapoval, B. and C. Hermann, Physics of semiconductors. 1995, New York: Springer.
279. Sze, S.M. and K.K. Ng, Physics of Semiconductor Devices. 2007, Hoboken, New Jersey: A John Wiley & Sons, Inc.
142

Acknowledgements
First, I would like to thank my supervisor, Prof. Christof Wöll, for giving me this
to work here. His profound knowledge in science anchance d research habit gave me
much e elf. On the occasion that he leaves for Karlsruhr to be
not onl from him and his
family.
educati go to the organization of
graduation school of SFB 558 in Ruhr-University Bochum.
e first several
ssentially benefit me. Many thanks to them: Dr. Franziska Traeger, Kiss Janos, Prof.
enrd Meyer, Jörg Koßmann, Prof. Hicham Idriss, Dr. Osama Shekhah, Dr. Wei Xia,
Dr. André van Veen, Dr. Mingchun Xu, Dr. Martin Kind, Dr. Alexander Birkner.
I am indebted to the people who work together with me in lab for various helps:
Heshmat Noei, Lanying Jin, Youkun Gao, Jinxuan Liu, Dr. Zhihong Wang, David
Silber and Vadim Schott.
I would like to thank the technicians in PC1 for technique support to my work, Reiner
Krause, Volker Ader, Theo Wasmuth and Heinz Zwingmann.
Thanks Gundula Talbot, Ursula Uhde, Bärbel van Eerd, Ruth Knödlseder-Mutschler
and Angelika Kruse-Fernkorn for the nice considerations and favors during my Ph.D
study.
Special thanks go to my wife, Yanhua Xu. She afforded me all kinds of support to my
work, especially when I sunk to worse state in my work.
licitation to improve mys
a director, I would like to give my best wishes to him for his future career.
I would like to give my sincere appreciation to Dr. Yuemin Wang. He is my supervisor
y in science, but also in daily life. I have got too much helps
Besides, his patience, tolerance and carefulness impressed me deeply.
Many thanks to my scholarship, SurMat of international Max-Planck research school
(IMPRS-SurMat), where I got continuous research grant as well as scientific
ons during the last three years. Thanks also
I am grateful to Prof. Martin Muhler for the financial support in th
months and the chance to communicate with his group.
Many personal scientific discussions have been performed with my colleagues that
e
B
143

Curriculum Vitae
Name: Hengshan Qiu
r example, the research
s (band structure of solid and changing properties of semiconductors), the spin
mension.
Nationality: Chinese
Date of birth: 16.06.1978
Place of birth: Henan province, China
Email: [email protected]
Education experience:
09.1998—07.2002 Bachelor, Physics department, Tongji University, Shanghai
09.2002—07.2005 Master, Department of optical science and engineering, Fudan
University, Shanghai
Thesis directed by Prof. Qingyuan Jin: The temperature dependence of the structure
and magnetism of Ni/Fe/Cu(001) ultra-thin films
10.2005—07.2009 Doctor studies, Department of physical chemistry I,
Ruhr-University Bochum, Bochum, Germany
Thesis directed by Prof. Christof Wöll: Interaction of adsobates with clean and
metal-covered oxide surfaces: Vibrational spectroscopic studies
Scholarships:
2006—2009 Scholarship from SurMat of international Max-Planck research school
2008: Chinese government award for outstanding self-financed students abroad
Research interests:
My research interests focus mainly on fundamental field. Fo
areas related to electron: the bonding of electrons with solid surface (surface chemical
reactions), the transition of electrons (electronic spectroscopy), the statistics of
electron
polarization of electrons (magnetism and spin valve), the interaction of electron with
solid surfaces and the behaviors of electron in confined di
144