Embed Size (px)
Citation preview

International Journal of
Environmental Research
and Public Health
Article
Interaction Effects of Disruptive Behaviour andMotivation Profiles with Teacher Competence andSchool Satisfaction in Secondary SchoolPhysical Education
Antonio Granero-Gallegos 1,2 , Manuel Gómez-López 3,4,* , Antonio Baena-Extremera 5 andMarina Martínez-Molina 1
1 Department of Education, Faculty of Education Sciences, University of Almeria, 04120 Almeria, Spain;[email protected] (A.G.-G.); [email protected] (M.M.-M.)
2 Health Research Center, University of Almeria, 04120 Almeria, Spain3 Department of Physical Activity and Sport, Faculty of Sport Sciences, University of Murcia,
Santiago de la Ribera, 30720 Murcia, Spain4 International Campus of Excellence “Mare Nostrum”, University of Murcia, 30720 Murcia, Spain5 Department of Didactic of Corporal Expression, Faculty of Education Sciences, University of Granada,
18071 Granada, Spain; [email protected]* Correspondence: [email protected]; Tel.: +34-868-888674
Received: 21 November 2019; Accepted: 20 December 2019; Published: 23 December 2019 �����������������
Abstract: The objectives of this work were two-fold: Firstly, to identify the profiles of disruptivebehaviours and motivation in secondary school physical education students using cluster analysis;and secondly, to analyse the interaction of the profiles with school satisfaction and perceived teachingcompetence. A group of 758 secondary school students (54.2% female) between the ages of 13 and 18(M = 15.22, DT = 1.27) participated in the study by responding to the following scales: The DisruptiveBehaviours in Physical Education Questionnaire, The School Satisfaction Scale, The Sport MotivationScale adapted to Physical Education, and the Evaluation of Teaching Competencies Scale in PhysicalEducation. The cluster analysis established two distinct profiles: High levels of disruptive behavioursand low levels of disruptive behaviours. The results showed that the students with the high disruptivebehaviours profile were mostly boys, having low levels of intrinsic motivation and high levels ofamotivation and misbehaviour in the classroom. In contrast, those students with the low disruptivebehaviours profile were mostly girls, having the highest levels of intrinsic motivation and the lowestlevels in all the disruptive behaviours. It was shown that students exhibiting the worse classroombehaviours were more bored in school, while those students with better behaviour perceived greaterteaching competence.
Keywords: secondary education; adolescence; satisfaction with school; bored with school; teaching
1. Introduction
The literature shows that the variables that can influence learning, academic performance,school failure, and the personal growth of students are disruptive behaviours in the classroom,teaching competence, student motivation, subjective well-being, and school satisfaction [1,2].
School failure is related to the success or failure of the education system and cannot be addressedtoday without considering academic problems. Of these, disruptive behaviours in the classroom standout due to teachers’ concerns about coexistence and the classroom climate [3–6]. This phenomenonaffects most schools, the results of which are manifested in the dysfunction of the educational process [7].
Int. J. Environ. Res. Public Health 2020, 17, 114; doi:10.3390/ijerph17010114 www.mdpi.com/journal/ijerph
Int. J. Environ. Res. Public Health 2020, 17, 114 2 of 14
Transgression of the rules is a common behaviour in the evolutionary development of minorsduring childhood and adolescence, and it is a process that strengthens personality and social positioning.These behaviours are externalized mainly in adolescence during compulsory secondary education(ESO) [8,9], probably due to the important changes that take place during this period and how theydevelop; for instance, changes in physical appearance and in the psychosocial field. Such psychosocialchanges often entail a crisis in the adolescent concerning identity and values, along with an increase inbehaviours that affect coexistence both in the family and at school.
Disruptive behaviours interrupt the teaching–learning process and are normally associated withan unfavourable family environment and a mismatch relationship within the school context [10,11].Jurado and Tejada [12] define disruptive behaviours as those that hinder learning and distort individualrelationships, as well as the dynamics of the class, affecting not only the student who provokesthem, but also the other students and the teachers who have to endure the consequences [13].These misbehaviours make it difficult to carry out classroom tasks properly and hinder actionsperformed in the learning context. Consequently, the disruptive behaviour can be identified by themanifestation of a conflict and/or troubling behaviour contrary to the explicit (or implicit) norms of theeducational context [12], jeopardizing the maintenance of an optimal school learning environment andsuccessful teaching [14–16].
Because such disruptive behaviour affects the climate of school coexistence, it can be considered asone of the triggers for situations that risk school failure, social maladaptation, and rejection, which wecurrently witness, above all, in secondary schools [17,18].
Disruptive behaviour typically leads to low academic performance, which influences the student’srisk of failure at school in some way or another. Due to the low academic levels of Spanish studentsdocumented in certain international studies (e.g., the PISA report), there has been increasing interestover recent years to study the factors affecting academic/school performance and students’ personalgrowth [1,19,20].
The scientific literature has shown that there is a relationship between academic performance andsatisfaction with school [15], which determines the student’s engagement in his/her schoolwork [21].Furthermore, recent studies [1] have shown that satisfaction/fun in the subject of physical education(PE) positively predicted the satisfaction/fun experienced at school. This school satisfaction contributesto reducing both the school drop-out rate and disruptive behaviours [22], and can even positivelyinfluence the students’ satisfaction with life [2]. Conversely, school dissatisfaction is associated withnegative behaviours, such as dropping out of school [23]. It should be noted that the prematureabandonment of schooling is related to the manifestation of discipline problems [24]; i.e., those studentswho tend to present discipline problems tend to drop out of school in a high percentage of cases,especially in ESO, thus undervaluing the role of the school as the main motivation in their life trajectory.
Faced with this problem, the educational possibilities that come from practising sports have beennoted in psychosocial development and in the social integration of children and young people [25].Practising sport provides an appropriate context for enhancing personal values such as self-esteem,perseverance, and the capacity to strive to achieve one’s goals, as well as social values such as belongingto a group, cooperation, respect, and solidarity [26]. In addition, the influence of sport on the adolescentsocialization process has been confirmed in various studies, determining that systematic participationmakes it possible to reduce antisocial behaviour [27], and that the effects increase when coachesmaintain an attitude that promotes prosocial behaviour [28]. Promoting prosocial behaviour is one ofthe objectives that the educational context must achieve [7].
Other essential elements for creating an adequate climate in the classroom, in this case, in PEclasses, are motivation and discipline [29], which help to develop effective teaching–learning processes.The results provided by Moreno et al. [29], in which they followed Self-Determination Theory [30],demonstrated that discipline was positively and significantly related to intrinsic and extrinsic motivation,and negatively and significantly related to lack of motivation. On the other hand, discipline waspositively predicted for a motivational, task-oriented climate, and indiscipline was positively predicted

Int. J. Environ. Res. Public Health 2020, 17, 114 3 of 14
for demotivation and an ego-oriented motivational climate. Consequently, the results showed that,to avoid indiscipline or reduce it, teachers must favour the most self-determined forms of motivation,preventing students from falling into demotivation. In this way, students will spend class time doingwork rather than being undisciplined, learning to choose appropriate behaviours in the classroom.That is why it is very important that the teacher directs the students through discipline strategiesof concern and responsibility in order to achieve self-determined motivation [31,32]. In addition,the literature has shown that students who emphasise intrinsic reasons feel greater satisfaction inPE classes, improve their relationships with others, and value the subject more, attaching greaterimportance and usefulness to it [33,34]. Such a mindset favours a climate of learning in class.
On the other hand, another possible reason for these disruptive behaviours manifestingthemselves is the conflict between the institution’s expectations and those of the teachers and students.This produces personal dissatisfaction, inefficiency in achieving educational objectives, rebelliousness,and indiscipline. Alderman and Green [35] even allude to low-quality relationships between teachersand students as the source of these behavioural problems in the classroom. The teacher is primarilyresponsible for maintaining control during the class and for detecting and channelling the mostcommon inappropriate behaviours. Various studies have highlighted the importance of the teacher’srole, both in terms of the student’s satisfaction with school and life and in their learning and academicperformance [19,36–38].
Other research, such as that by Cameron and Lovett [39], linked the teacher’s lack of interestin teaching and the negative impact on pupils with low school engagement and poor academicperformance. In addition, the literature reflected that teaching competence in PE classes was a positivepredictor of student satisfaction/fun and a negative predictor of boredom [36], whereas teachingincompetence was a positive predictor of inappropriate behaviour among adolescents [37].
Finally, and despite what we already know, the analyses of motivational profiles and disruptivebehaviours in class, as well as the interaction of these profiles based on the student’s satisfactionwith the school and their perception of teaching competence, have not yet been addressed together,which suggests that these results will be an interesting contribution to the scientific literature. Therefore,considering the existing theoretical knowledge, it was hypothesized that those students with highdisruptive behaviours (especially boys) would be associated with a profile of amotivation, boredom withschool, and a perception of low teacher competence. The study’s objective was to identify the disruptivebehaviours and motivation profiles of secondary school students in PE classes and to evaluate theinteraction of these profiles with respect to school satisfaction and the students’ perception ofteaching competence.
2. Materials and Methods
2.1. Participants
The design of this cross-sectional study was observational and descriptive. A nonprobabilistic andconvenience sample selection process was employed, based on the subjects that we were able to access.A group of 758 students (45.8% male and 54.2% female) from the Murcia region (Spain) took part.The age range was between 13 and 18 years old (M = 15.22, DT = 1.27; Mboys = 15.20, DTboys = 1.29;Mgirls = 15.18, DTgirls = 1.26). The distribution by course year was: 343 (45.3%) from the second year ofESO; 20.1% from the third, 27.2% from the fourth, and 7.5% from the first year of Bachillerato. As PE isa compulsory subject for all students of the first year of Bachillerato, these students were also includedin this research. All students are from public schools located in areas of medium socioeconomic level,and no educational center is included in the program of Teaching Compensatory, a program thatallocates specific, material, and human resources to guarantee access, permanence, and promotion inthe educational system for socially disadvantaged students.

Int. J. Environ. Res. Public Health 2020, 17, 114 4 of 14
2.2. Measurement Instruments
Disruptive Behaviours in Physical Education: The Disruptive Behaviours in Physical EducationQuestionnaire (CCDEF) by Granero-Gallegos and Baena-Extremera [14] was used. This is the Spanishversion of the original Physical Education Classroom Instrument (PECI) by Krech, Kulinna, andCothran [40]. This version consists of 17 items that measure disruptive behaviours in PE studentsover five subscales: Aggressive (AGR) (2 items; e.g., “Threatens others/I threaten other classmates”);Low engagement or irresponsibility (LEI) (4 items; e.g., “Lazy/I am lazy in class”); Fails to followdirections (FFD) (4 items; “Not following directions/I do not follow the instructions”); Distracts ordisturbs others (DDO) (4 items; e.g., “Leaving the group during an activity/I abandon the group duringan activity”); and Poor self-management (PSM) (3 items; e.g., “Makes fun of other students/I makefun of classmates”). A five-point Likert scale ranging from 1 (never) to 5 (always) was used for theresponses. The internal consistency indexes (Cronbach’s alpha (α)) were: AGR, α = 0.58, compositereliability = 0.81, Average Variance Extracted (AVE) = 0.54; LEI, α = 0.73, composite reliability = 0.84,AVE = 0.74; FFD, α = 0.77, composite reliability = 0.94, AVE = 0.65; DDO, α = 0.81, composite reliability= 0.92, AVE = 0.80; and PSM, α = 0.84, composite reliability = 0.96, AVE = 0.92. Given the low indexachieved by Cronbach’s alpha and that the AGR subscale consists of only two items, this factor wasignored in the analyses performed. The goodness-of-fit indexes of the scale using confirmatory factorialanalysis (CFA) were: Chi-squared ratio (χ2)/degrees of freedom (gl) = 3.61; incremental fit index(IFI) = 0.96; Tucker–Lewis index (TLI) = 0.95; comparative fit index (CFI) = 0.96; root mean squareerror of approximation (RMSEA) = 0.06; Standardized Root Mean Square Residual (SRMR) = 0.06.
The Sport Motivation Scale (SMS): We used the Spanish version adapted to PE [41] of the SportMotivation Scale by Pelletier et al. [42]. It consists of 28 items that measure the different types ofmotivation established by Self-Determination Theory [41], which suggests the multidimensionalexplanation of motivation: Amotivation (AMO) (4 items; e.g., “I don’t know anymore; I have theimpression of being incapable of succeeding in this sport/I really do not feel capable of physical-sportspractice”), extrinsic motivation (EM) (12 items; e.g., “Because people around me think it is importantto be in shape”), and intrinsic motivation (IM) (12 items; e.g., “For the pleasure I feel while improvingsome of my weak points”). Responses were collected on a Likert scale ranging from 1 (totally disagree)to 7 (totally agree). The internal consistency found in this study was: IM, α = 0.91, compositereliability = 0.99, AVE = 0.92; EM, α = 0.91; composite reliability = 0.99, AVE = 0.88; AMO, α = 0.75,composite reliability = 0.85, AVE = 0.58. The goodness-of-fit indexes of the scale using CFA were:χ2/gl = 3.02; IFI = 0.96; TLI = 0.97; CFI = 0.98; RMSEA = 0.05; SRMR = 0.04.
School Satisfaction: The Spanish version of the Intrinsic Satisfaction Classroom Questionnaire(ISC) by Castillo, Balaguer, and Duda [43] was used, adapted from the original Intrinsic SatisfactionClassroom Scale by Nicholls, Patashnick, and Nolen [44], Nicholls [45], and Duda and Nicholls [46].This consists of eight items that measure the degree of satisfaction with school using two subscalesmeasuring satisfaction/fun with school (5 items; e.g., “I normally enjoy learning at school”) and boredwith school (3 items; e.g., “At school I usually get bored”). For the responses, a Likert scale wasused, ranging from 1 (totally disagree) to 5 (totally agree). The internal consistency indexes were:Satisfaction/fun, α = 0.76; composite reliability = 0.76; AVE = 0.54; boredom, α = 0.70; compositereliability = 0.72; AVE = 0.52. The goodness-of-fit index of the scale using CFA was: χ2/gl = 4.79;IFI = 0.96; TLI = 0.93; CFI = 0.96; RMSEA = 0.06; SRMR = 0.04.
Teaching competence: The Spanish version of the Evaluation of Teaching Competencies Scaleadapted to Physical Education (ETCS-PE) by Baena-Extremera et al. [36] was used, adapted from theoriginal Evaluation of Teaching Competencies Scale by Catano and Harvey [47]. This consists of eightitems measuring students’ perception of teacher effectiveness. A seven-point Likert scale rangingfrom low (1, 2; e.g., “The teacher refuses to reach consensus with the class when issues are raised,such as the appropriateness of syllabus content or making new arrangements for assigned work”),medium (3, 4, 5; e.g., “The teacher generally deals with student concerns effectively, yet solutionsare not always universally accepted, such as omitting material to compensate for lost time”), and

Int. J. Environ. Res. Public Health 2020, 17, 114 5 of 14
high (6, 7; e.g., “The teacher effectively deals with issues that impede learning, such as rearranginglab time due to an oversized class or facilitating group discussions when the material is not clearlyunderstood”). The internal consistency indexes were: α = 0.86, composite reliability = 0.86, AVE = 0.59.The goodness-of-fit indexes of the scale using CFA were: χ2/gl = 1.80; IFI = 0.99; TLI = 0.99; CFI = 0.99;RMSEA = 0.03; SRMR = 0.02.
2.3. Procedure
Permission to carry out the work was obtained from the competent bodies, whether at thesecondary schools or at the university. Parents and adolescents were informed about the protocoland the study’s subject matter. The informed consent of both was an indispensable requirementto participate in the research. The tools measuring the different variables were administered in theclassroom by the researchers themselves, without the teacher present. All participants were informedof the study objective, the voluntary and confidential nature of the responses and the data management,as well as their rights as participants thereof, under the Helsinki Declaration [48]. This research wasapproved by the Research Ethics Committee at the University of Murcia (REF-45-20/01/2016).
2.4. Data Analysis
First, the descriptive statistics, the correlation between the subscales, and the internal consistencyof each subscale were calculated, as well as the asymmetry and kurtosis, with values ranging between−0.32 and 1.83. The cluster analysis was performed. This is a multivariate technique that seeks to groupelements (or variables) to achieve maximum homogeneity in each group and the greatest differencesbetween them. It was intended that the student characteristics found in one group would be similarin some respects and different in others [49]. Based on suggestions by Hair, Anderson, Tathan, andBlack [50], two clusters analyses were conducted. The total sample was randomly divided into twogroups so that each group was made up of approximately 50% of the sample. Group A consisted of372 subjects (54.3% girls) and group B consisted of 386 students (54.1% girls). In order to identifythe motivational profiles represented in group A, an exploratory hierarchical cluster analysis wasperformed using the Ward’s method and based on the dendrogram reading, and a solution was selectedfrom the logical results obtained. These results were then verified, obtaining the motivational profilesof group B by cluster analysis using the k-means method. Lastly, a final cluster analysis was performedwith the entire sample using the k-means method again. The composition of the profiles was thenexamined and the subjects identified in each of the profiles formed two different groups (cluster 1 andcluster 2). This acted as an independent variable to analyse the differences in satisfaction with schooland teacher competence using multivariate analysis. For these analyses, SPSS v.22.0 (IBM, Chicago,USA) was used, while for the CFA, we used AMOS v.22.0 (IBM, Chicago, USA).
3. Results
3.1. Descriptive and Correlation Analysis
Table 1 sets out the descriptive values for each of the study variables. For disruptive behaviours,low engagement or irresponsibility presented the highest mean values, while the lowest were forpoor self-management. On the motivation scale, the highest mean value corresponded to intrinsicmotivation, while the lowest was for amotivation. It is noteworthy that boredom with school hadhigher values than satisfaction with school. Lastly, the Evaluation of Teaching Competence Scaleachieved moderately high values.

Int. J. Environ. Res. Public Health 2020, 17, 114 6 of 14
Table 1. Descriptive analysis and correlation between variables.
M SD 2 3 4 5 6 7 8 9 10
1. Low engagement orirresponsibility 2.00 0.90 0.70 ** 0.64 ** 0.59 ** −0.25 ** −0.18 ** 0.18 ** 0.01 0.26 ** −0.21 **
2. Fails to follow directions 1.65 0.84 − 0.71 ** 0.66 ** −0.19 ** −0.14 ** 0.26 ** 0.06 0.18 ** −0.15 **
3. Distracts or disturbsothers 1.49 0.79 − − 0.79 ** −0.10 ** −0.05 0.24 ** 0.04 0.24 ** −0.12 **
4. Poor self-management 1.42 0.83 − − − −0.08 * −0.04 0.20 ** 0.04 0.19 ** −0.10 **
5. Intrinsic motivation 4.94 1.36 − − − − 0.82 ** 0.17 ** 0.30 ** −0.12 ** 0.43 **
6. Extrinsic motivation 4.85 1.25 − − − − − 0.29 ** 0.29 ** −0.16 ** 0.39 **
7. Amotivation 3.72 1.57 − − − − − − 0.16 ** 0.11 ** 0.06
8. Satisfaction with school 2.80 0.87 − − − − − − − −0.32 ** 0.21 **
9. Boredom with school 3.03 1.04 − − − − − − − − −0.14 **
10. Teaching competence 5.36 1.16 − − − − − − − − −
Note: * p < 0.05; ** p < 0.01. M = mean; SD = standard deviation.
The correlations showed a high and significant relationship between the four disruptive behavioursubscales (between 0.59 and 0.79). Furthermore, the correlation between these four subscales andamotivation and boredom with school was significant and positive (between 0.18 and 0.26). On theother hand, disruptive behaviours did not correlate with satisfaction with school, whereas they did ina negative and significant way with teaching competence and intrinsic motivation. Low engagementor irresponsibility and failure to follow directions also correlated negatively and significantly withextrinsic motivation. Teaching competence also showed positive and significant correlations withintrinsic motivation and extrinsic motivation. It did not correlate with amotivation, but did correlatenegatively with boredom with school.
3.2. Cluster Analysis
The cluster analysis was conducted to study motivational profiles and disruptive behavioursamongst secondary school PE students, adjusting the phases to the procedure designed byHair et al. [50]. No lost cases were reported in any of the analytical variables, which were standardizedusing Z scores. The students were then grouped together in clusters. First, an exploratory hierarchicalcluster analysis was performed to identify the cluster number in group A. Since this analysis isexploratory, it is important to confirm the results with a separate sample; thus, a k-mean clusteranalysis (nonhierarchical) was performed on group B. With regard to the multicollinearity betweenvariables, because none of Pearson’s correlation coefficients were >0.90, we decided that there was nomulticollinearity problem [50].
The Ward’s method was used in the exploratory analysis of group A (n = 372) as this hierarchicalprocedure minimizes the distance between the subjects within the cluster (it reduces the variancewithin the group) and avoids forming long chains [49]. The dendrogram suggests tow clusters as themost convenient solution. The first group was named “High disruptive behaviours” (n = 43) andincluded the highest mean values of all disruptive behaviour factors, as well as the highest meanfor amotivation. The second profile was labelled “Low disruptive behaviours” (n = 328), includingstudents with the lowest mean levels of amotivation and disruptive behaviours and higher meanvalues for intrinsic motivation and extrinsic motivation (Table 2).
For the analysis of the group B students, a k-means cluster analysis was performed, identifyingtwo profiles. This type of analysis is considered confirmatory, as it requires an a priori provision ofthe specific number of groupings expected to arise in the sample [51]. The profile findings presentedsimilar characteristics to those found in group A: The “High Disruptive Behaviours Profile” (n = 50),characterized by positive Z scores in the four factors of the disruptive behaviours scale and inamotivation, were negative in both intrinsic motivation and extrinsic motivation, although the valueswere more negative in intrinsic motivation (Table 2); and the “Low Disruptive Behaviours Profile”

Int. J. Environ. Res. Public Health 2020, 17, 114 7 of 14
(n = 336), characterized by a negative score for amotivation and disruptive behaviours, while intrinsicmotivation and extrinsic motivation scored positively, albeit with values close to zero. Some differenceswere found regarding the total distribution of students within the groups, highlighting especially thegreater representation of students in cluster 2 in both groups.
Table 2. Clusters of group A and group B following hierarchical method (Ward) and nonhierarchicalmethod (k-means).
Subescales
Group AWard’s Method (Hierarchical)
Group Bk-Means Method (Nonhierarchical)
Cluster 1 (n = 43) Cluster 2 (n = 328) Cluster 1 (n = 50) Cluster 2 (n = 336)
“High DisruptiveBehaviors”
“Low DisruptiveBehaviors”
“High DisruptiveBehaviors”
“Low DisruptiveBehaviors”
M SD M SD M SD Z M SD Z
Low engagement orirresponsibility 3.48 0.92 1.82 0.69 3.56 0.68 1.73 1.75 0.67 −0.27
Fails to followdirections 3.33 0.93 1.46 0.56 3.12 0.87 1.75 1.41 0.52 −0.29
Distracts or disturbsothers 3.23 0.94 1.29 0.40 3.07 0.93 2.00 1.24 0.38 −0.32
Poorself-management 3.26 0.98 1.22 0.46 3.07 1.05 1.98 1.14 0.31 −0.34
Intrinsic motivation 4.88 1.15 4.92 1.36 4.45 1.21 −0.36 5.08 1.37 0.20
Extrinsic motivation 4.80 1.08 5.02 1.31 4.59 1.10 −0.21 4.92 1.22 0.06
Amotivation 5.08 1.00 3.63 1.57 4.82 1.36 0.98 3.55 1.56 −0.14
Note: Sample (n), mean (M), standard deviation (SD), and Z values in the clusters according to the distribution ofgroup A (n = 372; 49.1%) and group B (n = 386; 50.9%).
Finally, the k-means cluster analysis (nonhierarchical) was performed with the total sample,revealing cluster profiles similar to those found in analyses of groups with a random sample (Figure 1;Table 3).
Int. J. Environ. Res. Public Health 2019, 16, x FOR PEER REVIEW 8 of 14
8
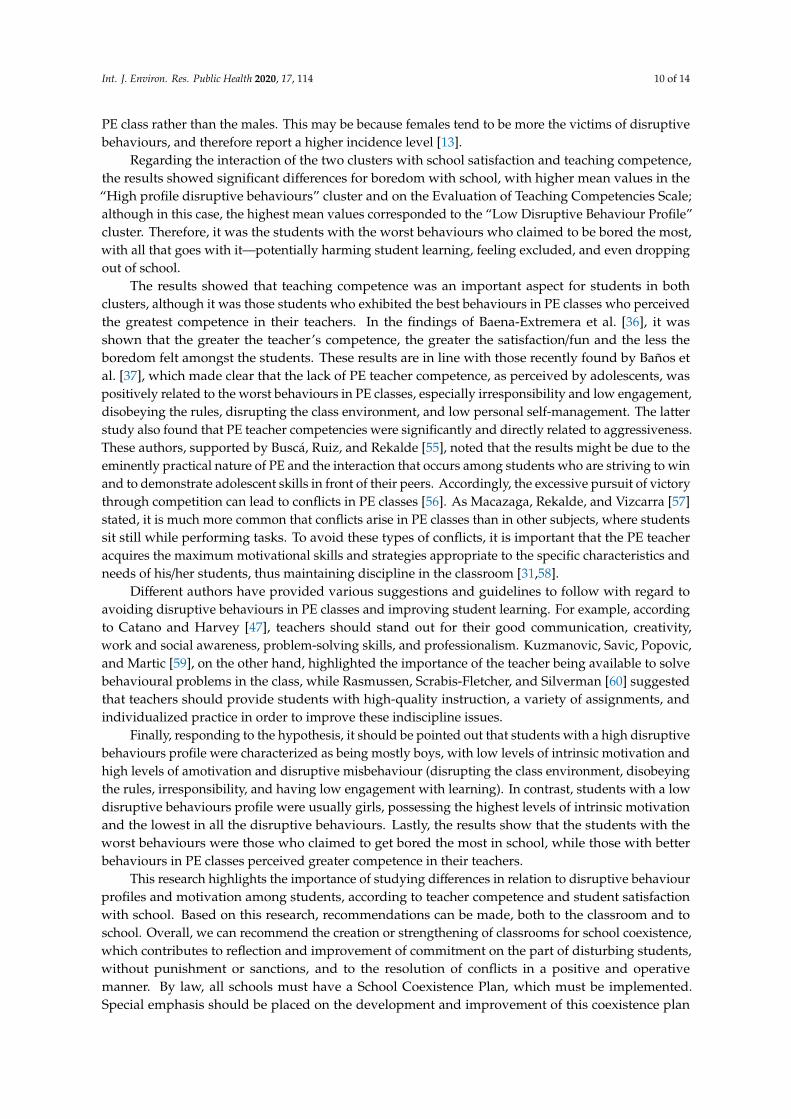
Cluster 1: The first profile grouped a total of 97 students (12.8%) presenting a “High Disruptive Behaviours Profile”. The highest Z scores were found in poor self-management (Z = 2.17) and “distracts or disturbs others” (Z = 2.10), followed by failure to follow directions, low engagement or irresponsibility, and amotivation. The lowest values corresponded to intrinsic motivation (Z = −0.46), followed by extrinsic motivation (Z = −0.11). In addition, it should be noted that 69.1% of the students in cluster 1 were male.
Cluster 2: The second profile was named “Low Disruptive Behaviours Profile”. The profile comprised the vast majority of students (661; 87.2%). In this case, the highest Z score corresponded to intrinsic motivation (Z = 0.35), followed by extrinsic motivation, but with lower values that were closer to zero. The other factors scored negatively in this profile. As for the students who made up this cluster, unlike the other, the majority of students were female (57.6%).
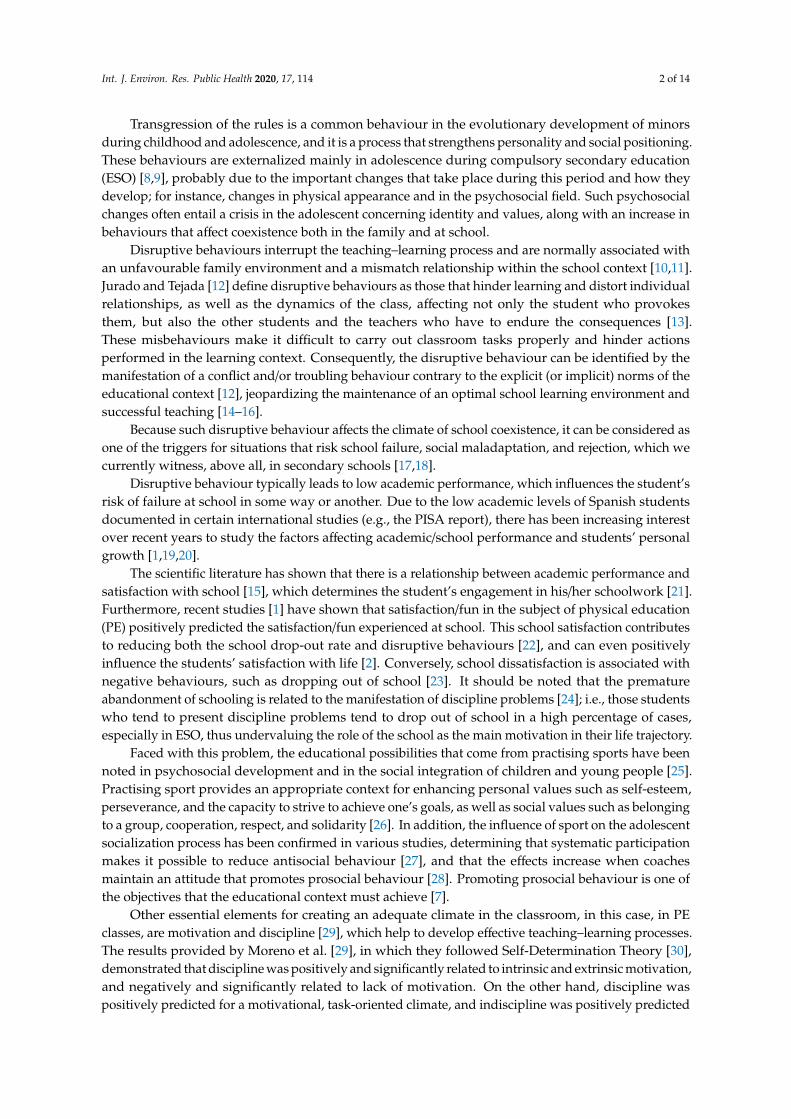
Figure 1. Motivational and disruptive behaviours profiles. Cluster 1: High disruptive behaviours profile; Cluster 2: Low disruptive behaviours profile. Z scores are represented on the vertical axis. On the horizontal axis are the scores of each subscale with the following abbreviations: LEI—Low engagement or irresponsibility; FFD—Fails to follow directions; DDO—Distracts or disturbs others; PSM—Poor self-management; IM—Intrinsic motivation; EM—Extrinsic motivation; AMO—Amotivation.
3.3. Clusters’ Differences According to Sex and Age
An analysis of variance was conducted to check the differences between clusters according to sex and age of the participants. Differences in the interaction of sex × age (F = 0.31, p = 0.91, Cohen’s d = 0.00; power observed = 0.13) were not found. According to sex (F = 13.96, p < 0.0001, Cohen’s d = 0.04; power observed = 0.99), significant statistical differences were found, but no significant statistical differences according to exact ages of the students (F = 0.931, p = 0.477, Cohen’s d = 0.01; power observed = 0.33) were found (R2 = 0.12). The analysis of the residues can be seen in Table 4. Cluster 1 (high disruptive behaviours profile) was positively associated with boys. Meanwhile, cluster 2 (low disruptive behaviours profile) was positively associated with girls (Table 4).
Table 4. Clusters’ characteristics according to sex and age.
Subescales
Sex Age Boys Girls 13 14 15 16 17 18 n = 347 n = 411 n = 144 n = 232 n = 164 n = 153 n = 41 n = 24 45.8% 54.2% 19.0% 30.6% 21.6% 20.2% 5.4% 3.2%
Cluster 1 n = 97% Residues
67 30 14 30 25 15 5 5 69.10% 30.90% 14.40% 32.90% 26.80% 15.50% 5.20% 5.20% 1.49 −1.49 0.92 0.83 0.76 −0.45 −0.85 −1.21
Cluster 2 n = 661% Residues
280 381 128 201 140 137 36 19 42.4% 57.6% 19.4% 30.3% 21.1% 20.8% 5.5% 2.9%
Figure 1. Motivational and disruptive behaviours profiles. Cluster 1: High disruptive behavioursprofile; Cluster 2: Low disruptive behaviours profile. Z scores are represented on the vertical axis. On thehorizontal axis are the scores of each subscale with the following abbreviations: LEI—Low engagementor irresponsibility; FFD—Fails to follow directions; DDO—Distracts or disturbs others; PSM—Poorself-management; IM—Intrinsic motivation; EM—Extrinsic motivation; AMO—Amotivation.

Int. J. Environ. Res. Public Health 2020, 17, 114 8 of 14
Table 3. Mean, standard deviation, and Z values in the clusters with the total sample.
Subescales
Cluster 1 (n = 97)“High Disruptive Behaviors”
Cluster 2 (n = 661)“Low Disruptive Behaviors”
M SD Z M SD Z
Low engagement or irresponsibility 3.49 0.80 1.66 1.79 0.68 −0.24Fails to follow directions 3.22 0.89 1.87 1.43 0.54 −0.26Distracts or disturbs others 3.15 0.92 2.10 1.26 0.38 −0.30Poor self-management 3.22 1.00 2.17 1.17 0.35 −0.31Intrinsic motivation 4.59 1.31 −0.46 4.99 1.35 0.35Extrinsic motivation 4.72 1.21 −0.11 4.87 1.25 0.13
Amotivation 4.59 1.36 1.15 3.60 1.56 −0.18
Note: n = sample; M = mean; SD = standard deviation; Z = standardized values.
Cluster 1: The first profile grouped a total of 97 students (12.8%) presenting a “High DisruptiveBehaviours Profile”. The highest Z scores were found in poor self-management (Z = 2.17) and“distracts or disturbs others” (Z = 2.10), followed by failure to follow directions, low engagement orirresponsibility, and amotivation. The lowest values corresponded to intrinsic motivation (Z = −0.46),followed by extrinsic motivation (Z = −0.11). In addition, it should be noted that 69.1% of the studentsin cluster 1 were male.
Cluster 2: The second profile was named “Low Disruptive Behaviours Profile”. The profilecomprised the vast majority of students (661; 87.2%). In this case, the highest Z score correspondedto intrinsic motivation (Z = 0.35), followed by extrinsic motivation, but with lower values that werecloser to zero. The other factors scored negatively in this profile. As for the students who made up thiscluster, unlike the other, the majority of students were female (57.6%).
3.3. Clusters’ Differences According to Sex and Age
An analysis of variance was conducted to check the differences between clusters according tosex and age of the participants. Differences in the interaction of sex × age (F = 0.31, p = 0.91, Cohen’sd = 0.00; power observed = 0.13) were not found. According to sex (F = 13.96, p < 0.0001, Cohen’sd = 0.04; power observed = 0.99), significant statistical differences were found, but no significantstatistical differences according to exact ages of the students (F = 0.931, p = 0.477, Cohen’s d = 0.01;power observed = 0.33) were found (R2 = 0.12). The analysis of the residues can be seen in Table 4.Cluster 1 (high disruptive behaviours profile) was positively associated with boys. Meanwhile, cluster2 (low disruptive behaviours profile) was positively associated with girls (Table 4).
Table 4. Clusters’ characteristics according to sex and age.
Subescales
Sex Age
Boys Girls 13 14 15 16 17 18
n = 347 n = 411 n = 144 n = 232 n = 164 n = 153 n = 41 n = 24
45.8% 54.2% 19.0% 30.6% 21.6% 20.2% 5.4% 3.2%
Cluster 1 n = 97%Residues
67 30 14 30 25 15 5 5
69.10% 30.90% 14.40% 32.90% 26.80% 15.50% 5.20% 5.20%
1.49 −1.49 0.92 0.83 0.76 −0.45 −0.85 −1.21
Cluster 2 n = 661%Residues
280 381 128 201 140 137 36 19
42.4% 57.6% 19.4% 30.3% 21.1% 20.8% 5.5% 2.9%
−0.52 0.52 −0.39 −0.60 −0.55 0.56 0.37 0.63
Note: n = sample; % = percentage.

Int. J. Environ. Res. Public Health 2020, 17, 114 9 of 14
3.4. Differences in School Satisfaction and Teaching Competence
Finally, to analyse the interaction of the clusters with school satisfaction and teaching competence,a multivariate analysis of variance (MANOVA) was carried out in which the clusters actedas an independent variable, and the ISC and ETCS-EF subscales acted as dependent variables.The homogeneity of covariance was examined using Box’s M test, and the null hypothesis of thedata adjustment was rejected (Box’s M = 72.31, F = 11.91, p < 0.001). The suggestions of Tabachnickand Fidell [52] were followed, in which Pillai’s Trace was used instead of Wilk’s Lamda to assess thesignificance of the main effects and interactions. The multivariate contrast demonstrated significantdifferences and multivariate interaction effects (Pillai’s Trace = 0.46, F(3, 755) = 12.03, p < 0.001, partial etasquare = 0.05, observed power = 1.00). Significant differences were found in boredom with school,with higher mean values in cluster 1 of the high disruptive behaviours profile, and in the Evaluation ofTeaching Competencies Scale, although in this case, the higher mean values corresponded to cluster 2of the low disruptive behaviours profile (Table 5).
Table 5. Differences in satisfaction with school and teacher competence according to cluster;multivariate analysis.
SubescalesCluster 1 Cluster 2
M SD M SD F p d Power Observed
Satisfaction with school 2.91 1.06 2.78 0.84 1.81 0.178 0.00 0.27
Boredom with school 3.46 1.04 2.97 1.02 18.92 0.000 0.41 0.99
Teaching competence 5.04 1.21 5.41 1.16 8.53 0.004 0.29 0.83
Note: M = mean; SD = standard deviation; d = Cohen’s d.
4. Discussion and Conclusions
The objective of the work was to analyse the disruptive behaviour and motivation profiles ofsecondary school students in PE classes as well as to study the differences, according to these profiles,regarding their satisfaction with school and teacher competence. The results provided two profiles.The first and least numerous, called the “High Disruptive Behaviours Profile”, encompassed a set ofmostly boys with the lowest values being for intrinsic motivation and the highest for amotivation.It affirmed that they disrupted the class environment, disobeyed the rules, were irresponsible, and hadlow engagement in learning. These results were in line with those provided by Baños et al. [37] withstudents at the same educational level, which reflected that the boys obtained the highest meansin behaviours related to irresponsibility and low engagement, disobeying the rules, disrupting theclass environment, and having low personal self-management. In summary, Granero-Gallegos andBaena-Extremera [14] noted that the factors with the greatest negative prediction towards schoolsatisfaction were irresponsibility and low engagement; thus, students who were irresponsible and hadlow engagement in academic tasks presented a low level of school satisfaction. Conversely, disruptingthe classroom environment was established as a positive predictor of satisfaction/fun with school,possibly because this behaviour often occurs with students who try to make their classmates laugh,which gives them some personal satisfaction.
The second cluster was named the “Low Disruptive Behaviours Profile”. This profile characterizedmost of the students analysed and was composed mainly of girls, with the highest values being forintrinsic motivation, while scoring negatively in all the disruptive behaviours. With regard to this,Baños, Ortiz-Camacho, Baena-Extremera, and Zamarripa [53], and Baños et al. [37] showed that thegirls obtained higher mean values in aggressiveness, contrary to what Cothran and Kulinna [13] hadpreviously found in boys, while the behaviours of irresponsibility, low engagement, and disruptingthe class environment were higher in girls. In this regard, Kulinna, Cothran, and Regualos [54] statedthat it was the female students and female teachers who reported perceived worse behaviours in the
Int. J. Environ. Res. Public Health 2020, 17, 114 10 of 14
PE class rather than the males. This may be because females tend to be more the victims of disruptivebehaviours, and therefore report a higher incidence level [13].
Regarding the interaction of the two clusters with school satisfaction and teaching competence,the results showed significant differences for boredom with school, with higher mean values in the“High profile disruptive behaviours” cluster and on the Evaluation of Teaching Competencies Scale;although in this case, the highest mean values corresponded to the “Low Disruptive Behaviour Profile”cluster. Therefore, it was the students with the worst behaviours who claimed to be bored the most,with all that goes with it—potentially harming student learning, feeling excluded, and even droppingout of school.
The results showed that teaching competence was an important aspect for students in bothclusters, although it was those students who exhibited the best behaviours in PE classes who perceivedthe greatest competence in their teachers. In the findings of Baena-Extremera et al. [36], it wasshown that the greater the teacher’s competence, the greater the satisfaction/fun and the less theboredom felt amongst the students. These results are in line with those recently found by Baños etal. [37], which made clear that the lack of PE teacher competence, as perceived by adolescents, waspositively related to the worst behaviours in PE classes, especially irresponsibility and low engagement,disobeying the rules, disrupting the class environment, and low personal self-management. The latterstudy also found that PE teacher competencies were significantly and directly related to aggressiveness.These authors, supported by Buscá, Ruiz, and Rekalde [55], noted that the results might be due to theeminently practical nature of PE and the interaction that occurs among students who are striving to winand to demonstrate adolescent skills in front of their peers. Accordingly, the excessive pursuit of victorythrough competition can lead to conflicts in PE classes [56]. As Macazaga, Rekalde, and Vizcarra [57]stated, it is much more common that conflicts arise in PE classes than in other subjects, where studentssit still while performing tasks. To avoid these types of conflicts, it is important that the PE teacheracquires the maximum motivational skills and strategies appropriate to the specific characteristics andneeds of his/her students, thus maintaining discipline in the classroom [31,58].
Different authors have provided various suggestions and guidelines to follow with regard toavoiding disruptive behaviours in PE classes and improving student learning. For example, accordingto Catano and Harvey [47], teachers should stand out for their good communication, creativity,work and social awareness, problem-solving skills, and professionalism. Kuzmanovic, Savic, Popovic,and Martic [59], on the other hand, highlighted the importance of the teacher being available to solvebehavioural problems in the class, while Rasmussen, Scrabis-Fletcher, and Silverman [60] suggestedthat teachers should provide students with high-quality instruction, a variety of assignments, andindividualized practice in order to improve these indiscipline issues.
Finally, responding to the hypothesis, it should be pointed out that students with a high disruptivebehaviours profile were characterized as being mostly boys, with low levels of intrinsic motivation andhigh levels of amotivation and disruptive misbehaviour (disrupting the class environment, disobeyingthe rules, irresponsibility, and having low engagement with learning). In contrast, students with a lowdisruptive behaviours profile were usually girls, possessing the highest levels of intrinsic motivationand the lowest in all the disruptive behaviours. Lastly, the results show that the students with theworst behaviours were those who claimed to get bored the most in school, while those with betterbehaviours in PE classes perceived greater competence in their teachers.
This research highlights the importance of studying differences in relation to disruptive behaviourprofiles and motivation among students, according to teacher competence and student satisfactionwith school. Based on this research, recommendations can be made, both to the classroom and toschool. Overall, we can recommend the creation or strengthening of classrooms for school coexistence,which contributes to reflection and improvement of commitment on the part of disturbing students,without punishment or sanctions, and to the resolution of conflicts in a positive and operativemanner. By law, all schools must have a School Coexistence Plan, which must be implemented.Special emphasis should be placed on the development and improvement of this coexistence plan

Int. J. Environ. Res. Public Health 2020, 17, 114 11 of 14
by the educational centers. More particularly, it is possible to focus on approaches that imply anenhancement of the intrinsic motivation among students, as well as the improvement of teachingcompetence in various aspects (e.g., communication, work awareness, availability, creativity, feedback,individual consideration of the student, problem-solving, social awareness, etc.), although the teachershould enhance their professional training in conflict resolution in the classroom. Related to thisaspect, the educational administration must provide teachers with the necessary continuous trainingto improve social skills and face the challenges posed by disruptive behaviour and coexistence intoday’s classrooms.
Regarding limitations of this research, it is necessary to take into account that the study wasquantitative in that the sample was not representative; therefore, the results cannot be generalized,and the method used does not allow one to go deeper into the disruptive causes in the classroom.Furthermore, the high schools in which the data were collected by means of a questionnaire werenot randomized. For future studies, mixed quantitative and qualitative research designs could beproposed, focusing on all subjects, not just PE. These quantitative designs would be developed withrepresentative samples to generalize the results, with differences analysis according to sex and exact age,and qualitative designs that allow us to go deeper into the causes of disruptive behaviour. Some of thesestudies could also include private schools and public schools located in areas of low socioeconomiclevel (compensatory education centers). On the other hand, it would also be convenient to carry outlongitudinal studies, with several data collections, in which the effectiveness of coexistence programsis valued.
Author Contributions: A.G.-G., M.M.-M., and A.B.-E. conceived and designed the study; A.G.-G. and A.B.-E.performed the analysis; M.G.-L., M.M.-M, and A.G.-G.—original draft preparation; A.G.-G. and M.G.-L.—reviewand editing; A.G.-G., supervision. All authors have read and agreed to the published version of the manuscript.
Funding: This research received no external funding.
Acknowledgments: A special thanks to all the students who participated in this study. Furthermore, thanks to allsecondary school participants from the Region of Murcia (Spain).
Conflicts of Interest: The authors declare no conflict of interest.
References
1. Baena-Extremera, A.; Granero-Gallegos, A. Prediction model of satisfaction with Physical Education andSchool. Rev. Psicodidact. 2015, 20, 177–192. [CrossRef]
2. Lewis, A.D.; Huebner, E.S.; Malone, P.S.; Valois, R.F. Life satisfaction and student engagement in adolescents.J. Youth Adolesc. 2011, 40, 249–262. [CrossRef] [PubMed]
3. Álvarez, E.; Álvarez, M.; Castro, P.; Campo, M.A.; González, C. Teacher’s perception of disruptive behaviourin the clasrooms. Psicothema 2016, 28, 174–180. [CrossRef]
4. Duesund, L.; Ødegård, M. Students’ perception of reactions towards disruptive behaviour in Norwegianand American schools. Emot. Behav. Diffic. 2018, 23, 410–423. [CrossRef]
5. Nash, P.; Schlösser, A.; Scarr, T. Teachers’ perceptions of disruptive behaviour in schools: A psychologicalperspective. Emot. Behav. Diffic. 2016, 21, 167–180. [CrossRef]
6. Woltering, S.; Qinxin, S. On the neuroscience of self-regulation in children with disruptive behavior problems:Implications for education. Rev. Educ. Res. 2016, 86, 1085–1110. [CrossRef]
7. Muñoz, J.M.; Carreras, M.R.; Braza, P. An approach to the study of attitudes and strategies of social thoughtand their connection with disruptive behaviour in the secondary school classroom. An. Psicol. 2004, 20, 81–91.
8. Torregrosa, M.S.; Inglés, C.J.; García-Fernández, J.M.; Valle, A.; Núñez, J.C. Relationship between aggressivebehavior and academic goals: Study with a Spanish compulsory secondary education sample of students.Univ. Psychol. 2012, 11, 1303–1315.
9. Granero-Gallegos, A.; Ruiz-Montero, P.J.; Baena-Extremera, A.; Martínez-Molina, M. Effects of motivation,basic psychological needs, and teaching competence on disruptive behaviours in secondary school physicaleducation students. Int. J. Environ. Res. Public Heath 2019, 16, 4828. [CrossRef]

Int. J. Environ. Res. Public Health 2020, 17, 114 12 of 14
10. Bradshaw, C.P.; O’Brennan, L.M.; McNeely, C.A. Core competencies and the prevention of school failure andearly school leaving. New Dir. Child Adolesc. Dev. 2008, 122, 19–32. [CrossRef]
11. Gómez Mármol, A.; Sánchez-Alcaraz Martínez, B.; Valero Valenzuela, A.; De la Cruz Sánchez, E. Perceivedviolence, sociomoral attitudes and behaviours in school contexts. JHSE 2018, 13, 138–148. [CrossRef]
12. Jurado, P.; Tejada, J. Disrupción y fracaso escolar. Disruption and school failure. A study in the context ofsecondary compulsory education in Catalonia. Estud. Sobre Educ. 2019, 36, 135–155. [CrossRef]
13. Cothran, D.J.; Kulinna, P.H. Students’ reports of misbehavior in physical education. Res. Q. Exerc. Sport 2007,78, 216–224. [CrossRef] [PubMed]
14. Granero-Gallegos, A.; Baena-Extremera, A. Validation of the short-form Spanish version of the PhysicalEducation Classroom Instrument measuring secondary pupils’ disruptive behaviours. Cuad. Psicol. Deporte2016, 16, 89–98.
15. Danielsen, A.G.; Samdal, O.; Hetland, J.; Wold, B. School-related social support and students’ perceived lifesatisfaction. J. Educ. Res. 2009, 102, 303–318. [CrossRef]
16. Kuhn, T.M.; Ebert, J.S.; Gracey, K.A.; Chapman, G.L.; Epstein, R.A. Evidence-based interventions foradolescents with disruptive behaviors in school-based settings. Child Adolesc. Psychiatr. Clin. N. Am. 2015,24, 305–317. [CrossRef] [PubMed]
17. Barnes, T.N.; Smith, S.W.; Miller, M.D. School-based cognitive-behavioral interventions in the treatment ofaggression in the United States: A meta-analysis. Aggress. Violent Behav. 2014, 19, 311–321. [CrossRef]
18. Klapproth, F.; Schaltz, P. Identifying students at risk of school failure in Luxembourgish Secondary School.Int. J. High. Educ. 2013, 2, 191–204. [CrossRef]
19. Baños, R.; Ortiz-Camacho, M.M.; Baena-Extremera, A.; Tristán-Rodríguez, J.L. Satisfaction, motivation andacademic performance in students of secondary and high school: Background, design, methodology andproposal of analysis for a research paper. Espiral 2017, 10, 40–50. [CrossRef]
20. Veas, A.; Castejón, J.-L.; Miñano, P.; Gilar-Corbí, R. Early adolescents’ attitudes and academic achievement:The mediating role of academic self-concept. Rev. Psicodidact. 2019, 24, 71–77. [CrossRef]
21. Danielsen, A.G.; Breivik, K.; Wold, B. Do perceived academic competence and school satisfaction mediatethe relationships between perceived support provided by teachers and classmates, and academic initiative?Scand. J. Educ. Res. 2011, 55, 379–401. [CrossRef]
22. Elmore, G.M.; Huebner, E.S. Adolescents satisfaction with school experiences: Relationships withdemographics, attachment relationships, and school engagement behavior. Psychol. Sch. 2010, 47, 525–537.[CrossRef]
23. Takakura, M.; Wake, N.; Kobayashi, M. The contextual effect of school satisfaction on health-risk behaviorsin Japanese high school students. J. Sch. Health 2010, 80, 544–551. [CrossRef] [PubMed]
24. Mena, L.; Fernández, M.; Riviére, J. Disengaged from education: Processes, experiences, motivations andstrategies of early school dropout and school failure. Rev. Educ. 2010, 119–145.
25. Bruner, M.W.; Boardley, I.D.; Cote, J. Social identity and prosocial and antisocial behavior in youth sport.Psychol. Sport Exerc. 2014, 15, 56–64. [CrossRef]
26. Escartí, A.; Gutiérrez, M.; Pascual, C.; Marín, D.; Martínez, C.; Chacón, Y. Teaching personal and socialresponsibility to a group of at-risk adolescents: An «observational» study. Rev. Educ. 2006, 341, 373–396.
27. Samek, D.R.; Elkins, I.J.; Keyes, M.A.; Iacono, W.G.; McGue, M. High school sports involvement diminishesthe association between childhood conduct disorder and adult antisocial behavior. J. Adolesc. Health 2015,57, 107–112. [CrossRef]
28. Rutten, E.A.; Stams, G.J.; Biesta, G.J.; Schuengel, C.; Dirks, E.; Hoeksma, J.B. The contribution of organizedyouth sport to antisocial and prosocial behavior in adolescent athletes. J. Youth Adolesc. 2007, 36, 255–264.[CrossRef]
29. Moreno, B.; Jiménez, R.; Gil, A.; Aspano, M.I.; Torrero, F. Análisis de la percepción del clima motivacional,necesidades psicológicas básicas, motivación autodeterminada y conductas de disciplina de estudiantesadolescentes en las clases de educación física [Analysis of motivational climate perception, basic psychologicalneeds, self-determined motivation, and disciplinary behaviors of adolescent students in physical educationclasses]. Motricidad 2011, 26, 1–24.
30. Deci, E.L.; Ryan, R.M. The general causality orientations scale: Self-determination in personality.J. Res. Personal. 1985, 19, 109–134. [CrossRef]

Int. J. Environ. Res. Public Health 2020, 17, 114 13 of 14
31. Gómez-López, M.; Granero-Gallegos, A.; Baena-Extremera, A.; Bracho, C.; Pérez, F.J. Interaction effects ofsex and practice of physical exercise on strategies for discipline, motivation and satisfaction with physicaleducation. Rev. Iberoam. Diagn. Y Eval. Psicol. 2015, 2, 6–16.
32. Granero-Gallegos, A.; Gómez-López, M.; Baena-Extremera, A.; Bracho-Amador, C.; Pérez-Quero, F.J.Motivational profiles in physical education. Differences according to teachers strategies to maintaindiscipline. Psicol. Reflex. Crit. 2015, 28, 222–231. [CrossRef]
33. Baena-Extremera, A.; Gómez-López, M.; Granero-Gallegos, A.; Martínez-Molina, M. Prediction model ofsatisfaction and enjoyment in physical education from the autonomy and motivational climate. Univ. Psychol.2016, 15, 39–50. [CrossRef]
34. Granero-Gallegos, A.; Baena-Extremera, A.; Sánchez-Fuentes, J.A.; Martínez-Molina, M. Motivational profilesof autonomy support, self-determination, satisfaction, importance of physical education and intention topartake in leisure time physical activity. Cuad. Psicol. Deporte 2014, 14, 59–70. [CrossRef]
35. Alderman, G.L.; Green, S.K. Social powers and effective classroom management: Enhancing teacher-studentrelationships. Interv. Sch. Clin. 2011, 47, 39–44. [CrossRef]
36. Baena-Extremera, A.; Granero-Gallegos, A.; Martínez-Molina, M. Spanish version of the Evaluation ofTeaching Competencies Scale in Physical Education of secondary school. Cuad. Psicol. Deporte 2015,15, 113–122. [CrossRef]
37. Baños, R.; Baena-Extremera, A.; Ortiz-Camacho, M.M.; Zamarripa, J.; Beltrán, A.; Juvera, J.L. Influence of thecompetences of secondary teachers on disruptive behavior in the classroom. Espiral 2019, 12, 3–10. [CrossRef]
38. Li, J.W.; O’Connor, H.; O’Dwyer, N.; Orr, R. The effect of acute and chronic exercise on cognitive function andacademic performance in adolescents: A systematic review. J. Sci. Med. Sport 2017, 20, 841–848. [CrossRef]
39. Cameron, M.; Lovett, S. Sustaining the commitment and realizing the potential of highly promising teachers.Teach. Teach. 2015, 21, 150–163. [CrossRef]
40. Krech, P.R.; Kulinna, P.H.; Cothran, D. Development of a short-form version of the Physical EducationClassroom Instrument: Measuring secondary pupils’ disruptive behaviours. Phys. Educ. Sport Pedagog. 2010,15, 209–225. [CrossRef]
41. Granero-Gallegos, A.; Baena-Extremera, A.; Gómez-López, M.; Sánchez-Fuentes, J.A.; Abraldes, J.A.Psychometric Properties of the “Sport Motivation Scale (SMS)” Adapted to Physical Education. J. SportSci. Med. 2014, 13, 801–807.
42. Pelletier, L.G.; Fortier, M.S.; Vallerand, R.J.; Tuson, K.M.; Brière, N.M.; Blais, M.R. Toward a new measureof intrinsic motivation, extrinsic motivation, and amotivation in sports: The Sport Motivation Scale (SMS).J. Sport Exerc. Psychol. 1995, 17, 35–53. [CrossRef]
43. Castillo, I.; Balaguer, I.; Duda, J.L. Goals perspectives of adolescents in sport context. Psicothema 2001,14, 280–287.
44. Nicholls, J.G.; Patashnick, M.; Nolen, S.B. Adolescents’ theories of education. J. Educ. Psychol. 1985, 77,683–692. [CrossRef]
45. Nicholls, J.G. The Competitive Ethos and Democratic Education; Harvard University Press: Cambridge, UK,1989.
46. Duda, J.L.; Nicholls, J.G. Dimensions of achievement motivation in schoolwork and sport. J. Educ. Psychol.1992, 84, 290–299. [CrossRef]
47. Catano, V.M.; Harvey, S. Student perception of teaching effectiveness: Development and validation of theEvaluation of Teaching Competencies Scale (ETCS). Assess. Eval. High. Educ. 2011, 36, 701–717. [CrossRef]
48. World Medical Association. World Medical Association Declaration of Helsinki: Ethical principles formedical research involving human subjects. JAMA 2013, 310, 2191–2194. [CrossRef]
49. Aldenderfer, M.S.; Blashfield, R.K. Cluster Analysis; Sage: Beverly Hills, LA, USA, 1984.50. Hair, J.F.; Anderson, R.E.; Tatham, R.L.; Black, W.C. Multivariate Data Analysis; Prentice-Hall: Upper Saddle
River, NJ, USA, 1999.51. Yli-Piipari, S.; Watt, A.; Jaakkola, T.; Liukkonen, J.; Nurmi, J.E. Relationships between physical education
students’ motivational profiles, enjoyment, state anxiety, and self-reported physical activity. J. Sports Sci. Med.2009, 8, 327–336.
52. Tabachnick, B.G.; Fidell, L.S. Using Multivariate Statistics, 6th ed.; Allyn & Bacon: Boston, MA, USA, 2013.

Int. J. Environ. Res. Public Health 2020, 17, 114 14 of 14
53. Baños, R.; Ortiz-Camacho, M.M.; Baena-Extremera, A.; Zamarripa, J. Effect of teachers’ gender on theimportance of physical education, motivational climate, disruptive behaviors, future practice intentions, andacademic performance. Retos 2018, 33, 252–257.
54. Kulinna, P.H.; Cothran, D.; Regualos, R. Teachers’ reports of student misbehavior in physical education.Res. Q. Exerc. Sport 2006, 77, 32–40. [CrossRef]
55. Buscá, F.; Ruiz, L.; Rekalde, I. Conflict resolution in schools as Learning Communities through physicaleducation. Retos 2014, 25, 156–161.
56. Klomsten, A.T.; Marsh, H.W.; Skaalvik, E.M. Adolescent’s perceptions of masculine and feminine values insport and physical education. A study of gender differences. Sex Roles 2005, 52, 625–636. [CrossRef]
57. Macazaga, A.M.; Rekalde, I.; Vizcarra, M.T. ¿Cómo encauzar la agresividad? Una propuesta de intervencióna través de juegos y deportes [How to channel aggressiveness? A proposal for intervention through gamesand sports]. Rev. Esp. Pedagog. 2013, 255, 263–276.
58. Martínez-Galindo, C.; Cervelló, E.; Moreno-Murcia, J.A. Predicting student’s reasons to be disciplined inphysical education classes. Rev. Latinoam. Psicol. 2012, 44, 41–52. [CrossRef]
59. Kuzmanovic, M.; Savic, G.; Popovic, M.; Martic, M. A New approach to evaluation of university teachingconsidering heterogeneity of students’ preferences. Procedia 2012, 64, 153–171. [CrossRef]
60. Rasmussen, J.F.; Scrabis-Fletcher, K.; Silverman, S. Relationships among tasks, time, and student practice inelementary physical education. Phys. Educ. 2014, 71, 114–131.
© 2019 by the authors. Licensee MDPI, Basel, Switzerland. This article is an open accessarticle distributed under the terms and conditions of the Creative Commons Attribution(CC BY) license (http://creativecommons.org/licenses/by/4.0/).