Embed Size (px)
Citation preview
Biogeosciences, 9, 5373–5389, 2012www.biogeosciences.net/9/5373/2012/doi:10.5194/bg-9-5373-2012© Author(s) 2012. CC Attribution 3.0 License.
Biogeosciences
Inter-annual variation of carbon uptake by a plantation oakwoodland in south-eastern England
M. Wilkinson 1, E. L. Eaton1, M. S. J. Broadmeadow2, and J. I. L. Morison1
1Forest Research, Centre for Forestry and Climate Change, Alice Holt Lodge, Farnham, Surrey, GU10 4LH, UK2Forestry Commission, Alice Holt Lodge, Farnham, Surrey, GU10 4LH, UK
Correspondence to:M. Wilkinson ([email protected])
Received: 21 June 2012 – Published in Biogeosciences Discuss.: 31 July 2012Revised: 21 November 2012 – Accepted: 23 November 2012 – Published: 21 December 2012
Abstract. The carbon balance of an 80-yr-old deciduousoak plantation in the temperate oceanic climate of thesouth-east of Great Britain was measured by eddy covari-ance over 12 yr (1999–2010). The mean annual net ecosys-tem productivity (NEP) was 486 g C m−2 yr−1 (95 % CI of±73 g C m−2 yr−1), and this was partitioned into a grossprimary productivity (GPP) of 2034± 145 g C m−2 yr−1,over a 165 (± 6) day growing season, and an annual lossof carbon through respiration and decomposition (ecosys-tem respiration,Reco) of 1548± 122 g C m−2 yr−1. Althoughthe maximum variation of NEP between years was large(333 g C m−2 yr−1), the ratio of Reco/GPP remained rela-tively constant (0.76± 0.02 CI). Some anomalies in the an-nual patterns of the carbon balance could be linked to partic-ular weather events, such as low summer solar radiation andlow soil moisture content (values below 30 % by volume).The European-wide heat wave and drought of 2003 did notreduce the NEP of this woodland because of good water sup-ply from the surface-water gley soil. The inter-annual vari-ation in estimated intercepted radiation only accounted for∼ 47 % of the variation in GPP, although a significant rela-tionship (p < 0.001) was found between peak leaf area indexand annual GPP, which modified the efficiency with whichincident radiation was used in net CO2 uptake. Whilst thespring start and late autumn end of the net CO2 uptake periodvaried substantially (range of 24 and 27 days respectively),annual GPP was not related to growing season length. Se-vere outbreaks of defoliating moth caterpillars, mostlyTor-trix viridana L. andOperophtera brumataL., caused consid-erable damage to the forest canopy in 2009 and 2010, result-ing in reduced GPP in these two years. Inter-annual varia-tion in the sensitivity ofReco to temperature was found to be
strongly related to summer soil moisture content. The eddycovariance estimates of NEP closely matched mensuration-based estimates, demonstrating that this forest was a substan-tial sink of carbon over the 12-yr measurement period.
1 Introduction
Many terrestrial ecosystems, including forests, are sinks forcarbon (C) (Unger et al., 2009), and globally between 1990and 2007 forests were estimated to have a net sequestrationof 1.1± 0.8 Pg C yr−1 (Pan et al., 2011), equivalent to one-seventh of emissions from fossil fuel combustion and cementproduction (Reich, 2011). Forests therefore have a funda-mental role in helping to regulate atmospheric CO2 concen-trations, and an improved understanding of the underlyingprocesses is needed to inform the development of climatechange mitigation strategies (Nabuurs et al., 2007). In themedium to long term, a growing forest stand will be a netcarbon sink, but at shorter timescales and as they react to un-favourable weather conditions, they can also act as a source(Valentini et al., 2000). For example, the severe drought andextreme high temperatures experienced in Europe over thesummer of 2003 led to an estimated net release from the con-tinent’s forests of 0.5 Pg C yr−1 (Ciais et al., 2005). Forestdisturbance, changes in local climate or in phenology mayalso lead to a long-term forest carbon sink temporarily be-coming a carbon source (Powell et al., 2006; Pereira et al.,2007; Noormets et al., 2008).
While forest mensuration methods are well suited to quan-tifying the long-term growth of forest stands (e.g. at 5 yrintervals), the infrequency with which measurements are
Published by Copernicus Publications on behalf of the European Geosciences Union.
5374 M. Wilkinson et al.: Inter-annual variation of carbon uptake
usually made means that they are unable to give reliable in-formation about inter-annual variation in growth rates. Fur-thermore, as mensuration methods typically show only thenet effect on the tree components, they do not give infor-mation about the C balance of whole ecosystems or aboutthe effects of disturbance and recovery. Networks of long-term, continuous, direct measurements of CO2 fluxes us-ing the eddy covariance method have become a powerfultool in improving the understanding of C exchange betweenforests and the atmosphere (Baldocchi et al., 2001), and pro-vide valuable information relating to their daily and seasonalchanges and about the impact of management. Our under-standing of the size of sink and extent of inter-annual vari-ation is increasing as data from eddy covariance studies inforests in excess of 10 yr duration become available (e.g. Itoet al., 2005; Dunn et al., 2007; Ilvesniemi et al., 2009). Keyaspects now being revealed include the following: impacts ofclimate change (Urbanski et al., 2007); the role of weatheranomalies (Saigusa et al., 2008; Teklemariam et al., 2009);effects of pests and diseases (Allard et al., 2008) and the roleof management (Saunders et al., 2012).
In this paper we present the results from 12 yr(1999–2010) of eddy covariance measurements of CO2 fluxabove an 80-yr-old lowland oak woodland in a mild, tem-perate, oceanic climate in south-eastern England. The annualsums of net ecosystem productivity (NEP) and its compo-nent assimilatory (gross primary productivity, GPP) and res-piratory fluxes (ecosystem respiration,Reco) are given. Thepaper also examines the causes of inter-annual variability ofthe partitioned fluxes, and assesses the relationship with keyclimatic and biotic drivers.
2 Materials and instrumentation
2.1 Site description
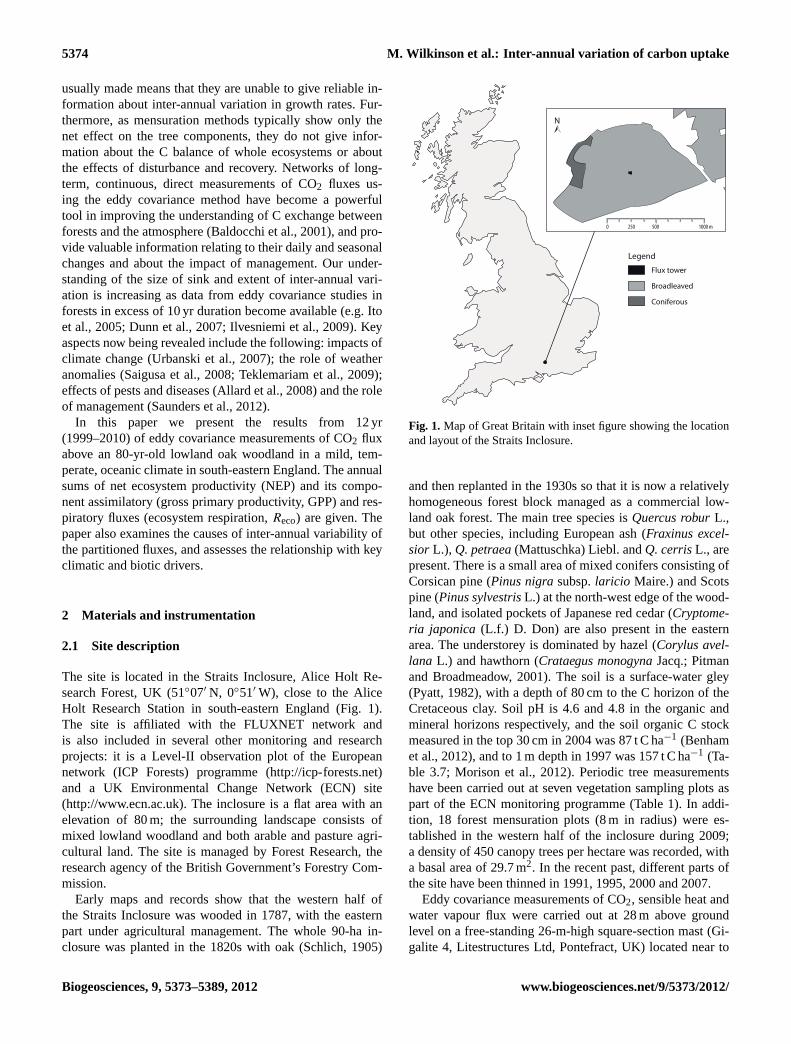
The site is located in the Straits Inclosure, Alice Holt Re-search Forest, UK (51◦07′ N, 0◦51′ W), close to the AliceHolt Research Station in south-eastern England (Fig. 1).The site is affiliated with the FLUXNET network andis also included in several other monitoring and researchprojects: it is a Level-II observation plot of the Europeannetwork (ICP Forests) programme (http://icp-forests.net)and a UK Environmental Change Network (ECN) site(http://www.ecn.ac.uk). The inclosure is a flat area with anelevation of 80 m; the surrounding landscape consists ofmixed lowland woodland and both arable and pasture agri-cultural land. The site is managed by Forest Research, theresearch agency of the British Government’s Forestry Com-mission.
Early maps and records show that the western half ofthe Straits Inclosure was wooded in 1787, with the easternpart under agricultural management. The whole 90-ha in-closure was planted in the 1820s with oak (Schlich, 1905)
N
0 500 1000 m250
Legend
Flux tower
Broadleaved
Coniferous
Fig. 1. Map of Great Britain with inset figure showing the locationand layout of the Straits Inclosure.
and then replanted in the 1930s so that it is now a relativelyhomogeneous forest block managed as a commercial low-land oak forest. The main tree species isQuercus roburL.,but other species, including European ash (Fraxinus excel-sior L.), Q. petraea(Mattuschka) Liebl. andQ. cerrisL., arepresent. There is a small area of mixed conifers consisting ofCorsican pine (Pinus nigrasubsp.laricio Maire.) and Scotspine (Pinus sylvestrisL.) at the north-west edge of the wood-land, and isolated pockets of Japanese red cedar (Cryptome-ria japonica (L.f.) D. Don) are also present in the easternarea. The understorey is dominated by hazel (Corylus avel-lana L.) and hawthorn (Crataegus monogynaJacq.; Pitmanand Broadmeadow, 2001). The soil is a surface-water gley(Pyatt, 1982), with a depth of 80 cm to the C horizon of theCretaceous clay. Soil pH is 4.6 and 4.8 in the organic andmineral horizons respectively, and the soil organic C stockmeasured in the top 30 cm in 2004 was 87 t C ha−1 (Benhamet al., 2012), and to 1 m depth in 1997 was 157 t C ha−1 (Ta-ble 3.7; Morison et al., 2012). Periodic tree measurementshave been carried out at seven vegetation sampling plots aspart of the ECN monitoring programme (Table 1). In addi-tion, 18 forest mensuration plots (8 m in radius) were es-tablished in the western half of the inclosure during 2009;a density of 450 canopy trees per hectare was recorded, witha basal area of 29.7 m2. In the recent past, different parts ofthe site have been thinned in 1991, 1995, 2000 and 2007.
Eddy covariance measurements of CO2, sensible heat andwater vapour flux were carried out at 28 m above groundlevel on a free-standing 26-m-high square-section mast (Gi-galite 4, Litestructures Ltd, Pontefract, UK) located near to
Biogeosciences, 9, 5373–5389, 2012 www.biogeosciences.net/9/5373/2012/

M. Wilkinson et al.: Inter-annual variation of carbon uptake 5375
Table 1. Mean annual biometric mensuration data for understoreyand canopy tree species at the Straits Inclosure, Alice Holt Forest,for the period 1994–2011.
Year Shrubs Canopy Trees
Crataegus Corylus Ilex Fraxinus Quercusmonogyna avellana aquifolium excelsior robur
Height (m)
1994 3.5 6.8 Na 17.8 16.12002 3.9 7.4 5.4 19.9 19.62011 7.4 6.2 8.6 21.6 21.1
Diameter (cm)
1994 6.0 6.4 Na 20.8 22.52002 4.6 6.0 7.5 23.9 28.62011 7.3 4.9 11.6 26.5 29.6
Na= not available
the centre of the inclosure (Fig. 1) providing a fetch over thewoodland of 500 m, 700 m, 350 m and 600 m to the N, E,S and W respectively. Additional measurements of climaticvariables were recorded from the mast or from the groundnearby (see below). The long-term mean (1971–2000) screenannual air temperature was 9.6◦C and the mean annual pre-cipitation 779 mm at the UK Meteorological Office affiliatedweather station, Alice Holt, Farnham (51◦10′ N, 0◦51′ W),approximately 1.8 km from the measurement site.
2.2 Instrumentation
Half-hourly fluxes of energy (sensible and latent heat), mo-mentum, CO2 and water vapour have been measured con-tinuously using the eddy covariance technique (Moncrieff etal., 1997) since 1998. The system is comprised of a three-dimensional sonic anemometer (model Solent R2, Gill In-struments, Lymington, UK) measuring wind vector com-ponents and a closed-path infrared CO2 and H2O analyser(IRGA, model LI-6262 until October 2005, LI-7000 there-after, LI-COR Inc., Lincoln, NE USA) measuring atmo-spheric CO2 and H2O concentrations. Pure nitrogen was usedas the zero CO2 concentration gas flowing through the IRGAreference cell. Sample air was drawn from the inlet port at apoint close to the sonic anemometer (horizontal separation of∼ 10 cm) using a sample tube (Dekabon Ltd., Glasgow, UK)with an internal diameter of 6.15 mm, through two inline1 micron PTFE Teflon filters (Gelman Acro 50) at a rate of5.5 L min−1 by a small pump (Capex V2 SE, Charles AustenPumps, Byfleet, Surrey, UK). Calibration of the IRGA us-ing a reference standard gas was performed weekly. The rawhigh frequency data (20.8 Hz) were logged using the EdiSolsoftware (Moncrieff et al., 1997), and for this study wereavailable from 1 January 1999 through to 31 December 2010.The system was powered by battery, charged by solar panelsand wind turbines until 31 May 2005, when mains power
was installed, resulting in significant improvements to datacollection.
Supporting environmental measurements recorded at thesite included the following: wind speed and direction (modelWA15, Vaisala, Helsinki, Finland), wet and dry bulb air tem-perature (model DTS-5, ELE International, Loveland, USA),above and below canopy solar radiation (tube solarimeters,Delta-T Devices, Cambridge, UK), global solar radiation(model CM2, Kipp & Zonen B.V., Delft, Netherlands), netradiation (model DRN-301, ELE International, Loveland,USA), soil heat flux (model HFP01, Campbell ScientificLtd, Loughborough, UK), soil temperature at 10 cm depth(2K Thermistor, Delta-T Devices) and soil moisture (modelThetaProbe ML2, Delta-T Devices). All measurements werelogged at 10 s intervals, and half-hourly averages recordedusing data loggers (DT 500, dataTaker, Thermo Fisher Sci-entific, Australia).
Leaf area index (LAI) was assessed using litterfall trapslocated within the Level-II forest-intensive monitoring plotapproximately 450 m from the flux tower. Canopy litterfall(leaves, twigs, frass, acorns, etc.) was collected in 10 cone-shaped traps held above the ground vegetation at height of1.5 m, each with a collecting surface area of 0.33 m2, anddistributed randomly within the monitoring plot. Small clothbags attached to the traps were collected every two weeksduring the summer and autumn and subsequently sorted intotheir constituents. Leaf surface area was measured using aleaf area meter (model MK2, Delta-T Devices), and peak leafareas back-calculated from cumulative litterfall (ICP Forests,2004). Although the forest intensive monitoring plot has beensubjected to a slightly different management regime thanother areas of the forest, a comparison with litterfall trapsfrom the area surrounding the mast (data not shown) indi-cates that the LAI values derived here give a good represen-tation of the relative change in canopy density between years.
2.3 Calculation of CO2 fluxes
The raw eddy covariance data files were re-processedwith the Edinburgh University micrometeorological soft-ware tool EdiRe (http://www.geos.ed.ac.uk/abs/research/micromet/EdiRe) following the basic procedures used in theCarboEurope project (Aubinet et al., 2000). Two-angle ve-locity signal coordinate rotation was applied to ensure thatthe vertical velocity signal was orthogonal to the plane ofmean air flow. The lag time of the sample from the in-take point to the cell of the closed-path analyser was de-termined by maximising the covariance between the verti-cal wind velocity and scalar concentration. Virtual tempera-ture derived from the speed of sound was corrected for wa-ter vapour (Hignett, 1992). In order to account for flux losscaused by signal damping inside the tube, limited time re-sponse and sensor separation, etc, the usual spectral correc-tions were applied (Moore, 1986; Leuning and Moncrieff,1990; Lenschow and Raupach, 1991; Massman, 1991) to
www.biogeosciences.net/9/5373/2012/ Biogeosciences, 9, 5373–5389, 2012
5376 M. Wilkinson et al.: Inter-annual variation of carbon uptake
compute the corrected CO2 and water vapour fluxes. In ad-dition, an angle of attack correction was applied to correctfor sonic anemometer velocity calibration errors at large(> ±40 degrees) angles of attack (Van der Molen et al.,2004).
Half-hourly net ecosystem exchange (NEE,µmol m−2 s−1) was calculated using the corrected CO2flux, Fc as NEE= Fc+Sc, whereFc = w′c′ is the covariancebetween the vertical wind velocity and the atmospheric CO2concentration, andSc the rate of change in CO2 storage perunit ground area in the air column below the eddy covarianceIRGA intake. The storage term was estimated by the simpleapproach using only the change in CO2 concentration mea-sured at 28 m (Hollinger et al., 1994; Greco and Baldocchi,1996):
Sc =1c(z)
1t1z, (1)
where1c(z) is the change in CO2 molar density at heightz,1t the time period (30 min) and1z the height of the eddycovariance sensor above ground (28 m).
After calculation of corrected NEE, and manual filteringof data for instrument failures and system maintenance, datafilters were applied in order to remove extreme spikes, whichwere assumed to be not biologically valid data, an approachsimilar to that proposed by Papale et al. (2006) and Thomaset al. (2011). For each calendar year, NEE data were firstlysplit into either positive or negative values. Positive valuesgreater than the mean positive value for the whole year plusthree standard deviations were removed and the same ap-proach applied to all negative values. A secondary stage datafilter was then applied, removing positive values that weregreater than the mean monthly value for that half-hourly pe-riod plus three standard deviations, and negative values lessthan the mean monthly value minus three deviations. Despik-ing filters were also applied to the latent heat flux (< −100or > 400 W m−2) and to the sensible heat flux (< −500 or> 500 W m−2) NEE data when either of these criteria oc-curred were also removed.
A flux footprint probability analysis was carried out us-ing the “footprint” calculation tool within EdiRe, which ap-plies the model of Kormann and Meixner (2001) to a user-specified fetch. On average 65 % of the daytime flux origi-nated within∼ 450 m of the tower, but at night this increasedto ∼ 600 m. Therefore, it is likely that a majority of the day-time flux originated from within the oak forest, particularlyas the longest possible target fetch extends to over 800 m to-wards to the south-west of the tower, which is also the pre-dominant (24.6 %) wind direction. However, we cannot ex-clude the possibility that fluxes were influenced by the ad-joining agricultural land, especially when nighttime condi-tions were combined with southerly wind directions.
2.4 Gap filling
In order to create the continuous flux dataset required for car-bon budgeting, and as an input for the partitioning of CO2fluxes, it was necessary to replace the missing and deletedvalues with appropriate values (“gap-filling”). The marginaldistribution sampling (MDS) method described in Reich-stein et al. (2005) and accessed through the on-line Car-boEurope gap filling tool was used (http://www.bgc-jena.mpg.de/∼MDIwork/eddyproc/index.php). Whilst similar tothe lookup table method (Falge et al., 2001), this approachalso considers the temporal auto-correlation of the fluxes,replacing missing data with an average value under similarmeteorological conditions. This method was chosen becauseit is widely accepted and has been employed by both Car-boEurope and FLUXNET (Moffat et al., 2007; Papale et al.,2006). Half-hourly NEE values were screened against a fric-tion velocity (u∗) threshold using the method described byReichstein et al. (2005) and implemented through the on-line gap filling tool. The dataset is split into six tempera-ture categories of equal sample size and then further subdi-vided into 20 classes based onu∗ values. Theu∗ thresholdfor each temperature class is calculated as theu∗ class wherethe nighttime flux reaches more than 95 % of the average fluxwithin the higheru∗ classes. The final threshold is defined asthe median of the thresholds, and this procedure is appliedto the subsets of four 3-month periods to account for sea-sonal variation of vegetation structure. The meanu∗ thresh-old for the period 1999–2010 calculated using this methodwas 0.17 m s−1. Where it is not possible to calculate au∗
threshold, a default value of 0.4 m s−1 is used.Although near-continuous meteorological data were col-
lected, the occasional short-term gaps of< 1 h were filledby manual interpolation. Longer-term gaps in the meteoro-logical data, caused by battery or logging failure, were filledusing data from an automatic weather station at the nearbyAlice Holt Research Station. Over the 12-yr period mainte-nance, data logging and power failure problems resulted in amean annual loss of 18.5 % of total available flux data. Qual-ity control, primary, secondary and LE/H despiking routinesremoved a further 2.6 %, whilstu∗ filtering removed 17.1 %,resulting in a mean annual quality-controlled CO2 flux dataavailability of 61.8 % (Table 2), and exceeding 50 % in allyears.
2.5 CO2 flux partitioning
The half-hourly quality-controlled NEE data were parti-tioned into gross primary productivity (GPP) and ecosystemrespiration (Reco) using the on-line CarboEurope gap fillingtool (Reichstein et al., 2005). The dataset is split into 10-dayconsecutive periods, andReco is estimated using the Lloyd–Taylor regression model (Lloyd and Taylor, 1994) betweennighttime CO2 flux (global solar radiation< 20 W m−2) andair temperature. The estimated value ofReco is then assigned
Biogeosciences, 9, 5373–5389, 2012 www.biogeosciences.net/9/5373/2012/

M. Wilkinson et al.: Inter-annual variation of carbon uptake 5377
Table 2.Sources of annual data loss of CO2 flux measurements forthe period 1999–2010 at the Straits Inclosure, Alice Holt Forest andquality-controlled (QC) data availability (%).
Year Power/ QC/ u∗ filtering QC fluxlogging failure despiking data
1999 13.9 2.3 17.7 66.12000 21.7 2.5 15.5 60.32001 27.0 2.5 11.0 59.52002 24.9 2.3 13.9 58.92003 18.8 3.1 23.3 54.82004 13.0 3.5 15.2 68.32005 8.2 3.9 12.7 75.22006 23.7 0.1 14.2 62.12007 19.5 2.3 19.2 59.02008 12.9 5.3 30.2 51.52009 23.9 2.3 18.5 55.32010 15.0 0.8 13.7 70.5Mean 18.5 2.6 17.1 61.8
to the central time point of the averaging interval and lin-early interpolated between time points. GPP is subsequentlycalculated as the difference between NEE andReco. By con-vention, NEP was defined as opposite in sign to NEE (Fig. 2).
3 Results and analysis
3.1 Climatic conditions
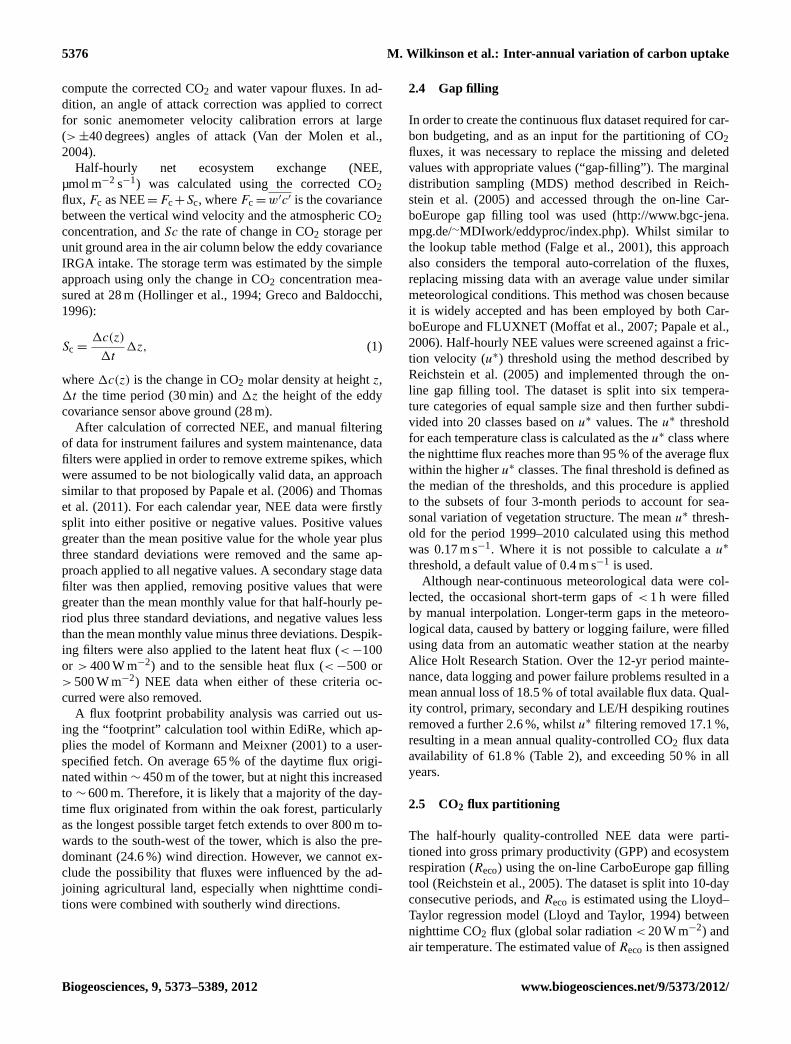
The average annual cycles of daily maximum air tempera-ture (Tmax), minimum air temperature (Tmin) and incidentsolar radiation (Sg) recorded at the flux site are shown inFig. 3a and the average daily soil moisture content and meanmonthly precipitation from the nearby Alice Holt Researchstation in Fig. 3b. Collectively these illustrate the oceanicclimate of the region, typified by mild winters, cool summersand a relatively uniform distribution of precipitation through-out the year. Using the Koppen climate classification system,the region is classified as “Cfb”. The long-term (1971–2000)mean annual precipitation of 779 mm was exceeded in 8 outof the 12 yr, with the highest recorded amount falling in 2002(1046 mm) and the lowest in 2005 (590 mm). The mean an-nual above-canopy solar radiation receipts were lowest in2002 (253 W m−2) and highest in 2006 (319 W m−2). Long-term observations (1948–2009) from the Alice Holt weatherstation near the site have demonstrated a warming in meansurface air temperature (data not shown) of∼ 0.2◦C perdecade, with higher rates of warming in winter and summerthan in spring and autumn. Whilst there has been no over-all change in annual precipitation, there has been a slight re-duction in summer and an increase in winter levels over thisperiod.
Fig. 2.Half-hourly average values of quality-controlled (black sym-bols) and gap-filled (gray symbols) NEP,Reco and GPP for the pe-riod 1999–2010, at the oak plantation, Straits Inclosure, Alice HoltForest.
3.2 Annual cycle of carbon fluxes
Substantial seasonal and inter-annual variations in compo-nent fluxes were measured (Fig. 2). In order to describe themean annual carbon cycle for each of these components,data from all 12 yr were pooled (Fig. 3c). Over the win-ter period (December, January, February), GPP was closeto zero and started to rise slowly from around day of year(DOY) 50 as a result of early bud break and leaf expan-sion of the shrub layer, exploiting available light. At approx-imately DOY 100 GPP started to rise more rapidly, coincid-ing with bud break and expansion of the tree canopy, peak-ing at around DOY 170, with a mean summer (June, Julyand August) value of 13.5 g C m−2 d−1. A reduction in GPPstarted around DOY 200 as mean solar radiation levels de-clined (Fig. 3a); this reduction accelerated around the begin-ning of October (∼ DOY 280), corresponding with the startof canopy senescence.
www.biogeosciences.net/9/5373/2012/ Biogeosciences, 9, 5373–5389, 2012
5378 M. Wilkinson et al.: Inter-annual variation of carbon uptake
(c)
-3
2
7
12
17
0 50 100 150 200 250 300 350
Day of year
C fl
ux (g
C m
-2 d
-1)
(b)
0
20
40
60
80
100
120
140
160
1 2 3 4 5 6 7 8 9 10 11 12
Month
Mon
thly
Pre
cip
Sum
(mm
)
0
10
20
30
40
50
60
Soi
l wat
er c
onte
nt (%
)
(a)
0
5
10
15
20
25
30
0 50 100 150 200 250 300 350-5
0
5
10
15
20
25
Sol
ar ra
diat
ion
(MJ
m-2
d-1
)
Tem
pera
ture
(°C
)
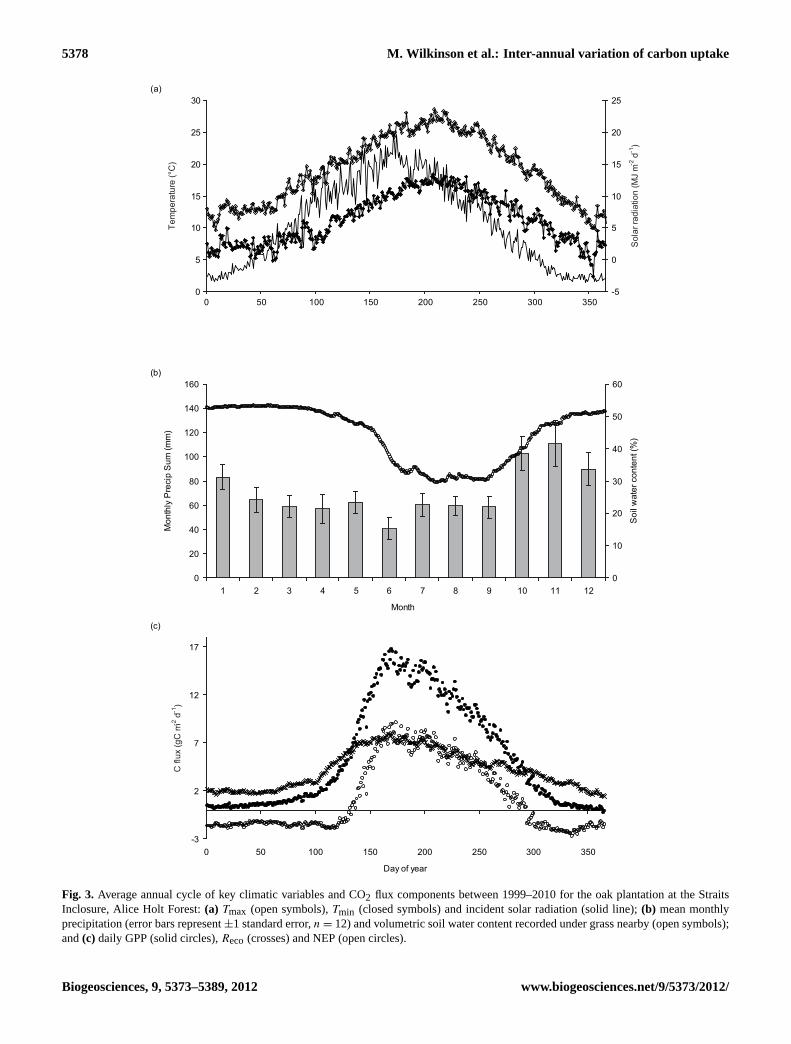
Fig. 3. Average annual cycle of key climatic variables and CO2 flux components between 1999–2010 for the oak plantation at the StraitsInclosure, Alice Holt Forest:(a) Tmax (open symbols),Tmin (closed symbols) and incident solar radiation (solid line);(b) mean monthlyprecipitation (error bars represent±1 standard error,n = 12) and volumetric soil water content recorded under grass nearby (open symbols);and(c) daily GPP (solid circles),Reco (crosses) and NEP (open circles).
Biogeosciences, 9, 5373–5389, 2012 www.biogeosciences.net/9/5373/2012/
M. Wilkinson et al.: Inter-annual variation of carbon uptake 5379
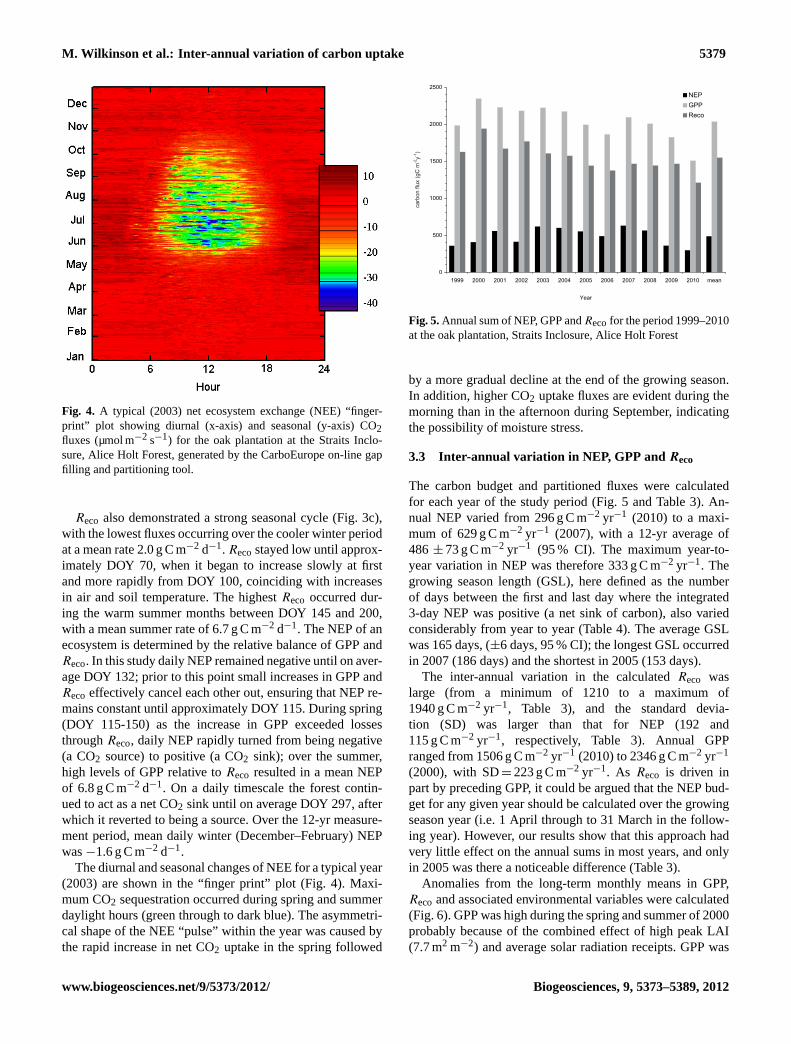
Fig. 4. A typical (2003) net ecosystem exchange (NEE) “finger-print” plot showing diurnal (x-axis) and seasonal (y-axis) CO2fluxes (µmol m−2 s−1) for the oak plantation at the Straits Inclo-sure, Alice Holt Forest, generated by the CarboEurope on-line gapfilling and partitioning tool.
Reco also demonstrated a strong seasonal cycle (Fig. 3c),with the lowest fluxes occurring over the cooler winter periodat a mean rate 2.0 g C m−2 d−1. Recostayed low until approx-imately DOY 70, when it began to increase slowly at firstand more rapidly from DOY 100, coinciding with increasesin air and soil temperature. The highestReco occurred dur-ing the warm summer months between DOY 145 and 200,with a mean summer rate of 6.7 g C m−2 d−1. The NEP of anecosystem is determined by the relative balance of GPP andReco. In this study daily NEP remained negative until on aver-age DOY 132; prior to this point small increases in GPP andReco effectively cancel each other out, ensuring that NEP re-mains constant until approximately DOY 115. During spring(DOY 115-150) as the increase in GPP exceeded lossesthroughReco, daily NEP rapidly turned from being negative(a CO2 source) to positive (a CO2 sink); over the summer,high levels of GPP relative toReco resulted in a mean NEPof 6.8 g C m−2 d−1. On a daily timescale the forest contin-ued to act as a net CO2 sink until on average DOY 297, afterwhich it reverted to being a source. Over the 12-yr measure-ment period, mean daily winter (December–February) NEPwas−1.6 g C m−2 d−1.
The diurnal and seasonal changes of NEE for a typical year(2003) are shown in the “finger print” plot (Fig. 4). Maxi-mum CO2 sequestration occurred during spring and summerdaylight hours (green through to dark blue). The asymmetri-cal shape of the NEE “pulse” within the year was caused bythe rapid increase in net CO2 uptake in the spring followed
0
500
1000
1500
2000
2500
1999 2000 2001 2002 2003 2004 2005 2006 2007 2008 2009 2010 mean
Year
carb
on fl
ux (g
C m
-2y-1
)
NEPGPPReco
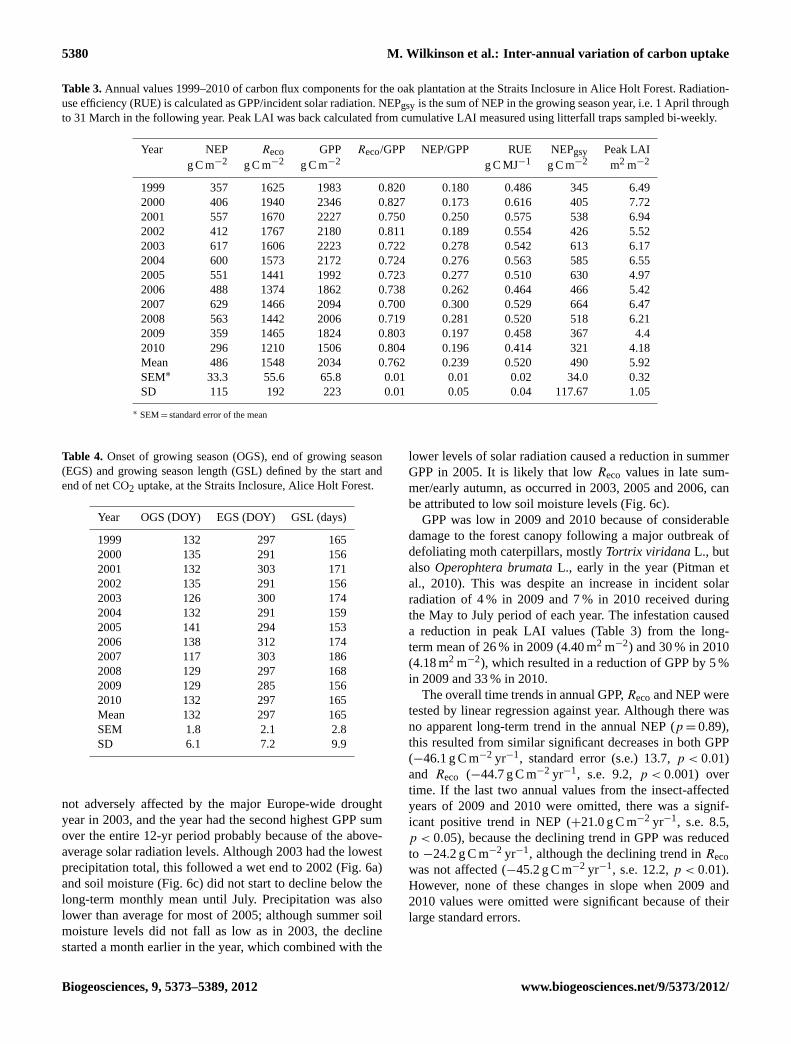
Fig. 5.Annual sum of NEP, GPP andRecofor the period 1999–2010at the oak plantation, Straits Inclosure, Alice Holt Forest
by a more gradual decline at the end of the growing season.In addition, higher CO2 uptake fluxes are evident during themorning than in the afternoon during September, indicatingthe possibility of moisture stress.
3.3 Inter-annual variation in NEP, GPP andReco
The carbon budget and partitioned fluxes were calculatedfor each year of the study period (Fig. 5 and Table 3). An-nual NEP varied from 296 g C m−2 yr−1 (2010) to a maxi-mum of 629 g C m−2 yr−1 (2007), with a 12-yr average of486 ± 73 g C m−2 yr−1 (95 % CI). The maximum year-to-year variation in NEP was therefore 333 g C m−2 yr−1. Thegrowing season length (GSL), here defined as the numberof days between the first and last day where the integrated3-day NEP was positive (a net sink of carbon), also variedconsiderably from year to year (Table 4). The average GSLwas 165 days, (±6 days, 95 % CI); the longest GSL occurredin 2007 (186 days) and the shortest in 2005 (153 days).
The inter-annual variation in the calculatedReco waslarge (from a minimum of 1210 to a maximum of1940 g C m−2 yr−1, Table 3), and the standard devia-tion (SD) was larger than that for NEP (192 and115 g C m−2 yr−1, respectively, Table 3). Annual GPPranged from 1506 g C m−2 yr−1 (2010) to 2346 g C m−2 yr−1
(2000), with SD= 223 g C m−2 yr−1. As Reco is driven inpart by preceding GPP, it could be argued that the NEP bud-get for any given year should be calculated over the growingseason year (i.e. 1 April through to 31 March in the follow-ing year). However, our results show that this approach hadvery little effect on the annual sums in most years, and onlyin 2005 was there a noticeable difference (Table 3).
Anomalies from the long-term monthly means in GPP,Reco and associated environmental variables were calculated(Fig. 6). GPP was high during the spring and summer of 2000probably because of the combined effect of high peak LAI(7.7 m2 m−2) and average solar radiation receipts. GPP was
www.biogeosciences.net/9/5373/2012/ Biogeosciences, 9, 5373–5389, 2012
5380 M. Wilkinson et al.: Inter-annual variation of carbon uptake
Table 3.Annual values 1999–2010 of carbon flux components for the oak plantation at the Straits Inclosure in Alice Holt Forest. Radiation-use efficiency (RUE) is calculated as GPP/incident solar radiation. NEPgsy is the sum of NEP in the growing season year, i.e. 1 April throughto 31 March in the following year. Peak LAI was back calculated from cumulative LAI measured using litterfall traps sampled bi-weekly.
Year NEP Reco GPP Reco/GPP NEP/GPP RUE NEPgsy Peak LAIg C m−2 g C m−2 g C m−2 g C MJ−1 g C m−2 m2 m−2
1999 357 1625 1983 0.820 0.180 0.486 345 6.492000 406 1940 2346 0.827 0.173 0.616 405 7.722001 557 1670 2227 0.750 0.250 0.575 538 6.942002 412 1767 2180 0.811 0.189 0.554 426 5.522003 617 1606 2223 0.722 0.278 0.542 613 6.172004 600 1573 2172 0.724 0.276 0.563 585 6.552005 551 1441 1992 0.723 0.277 0.510 630 4.972006 488 1374 1862 0.738 0.262 0.464 466 5.422007 629 1466 2094 0.700 0.300 0.529 664 6.472008 563 1442 2006 0.719 0.281 0.520 518 6.212009 359 1465 1824 0.803 0.197 0.458 367 4.42010 296 1210 1506 0.804 0.196 0.414 321 4.18Mean 486 1548 2034 0.762 0.239 0.520 490 5.92SEM∗ 33.3 55.6 65.8 0.01 0.01 0.02 34.0 0.32SD 115 192 223 0.01 0.05 0.04 117.67 1.05
∗ SEM= standard error of the mean
Table 4. Onset of growing season (OGS), end of growing season(EGS) and growing season length (GSL) defined by the start andend of net CO2 uptake, at the Straits Inclosure, Alice Holt Forest.
Year OGS (DOY) EGS (DOY) GSL (days)
1999 132 297 1652000 135 291 1562001 132 303 1712002 135 291 1562003 126 300 1742004 132 291 1592005 141 294 1532006 138 312 1742007 117 303 1862008 129 297 1682009 129 285 1562010 132 297 165Mean 132 297 165SEM 1.8 2.1 2.8SD 6.1 7.2 9.9
not adversely affected by the major Europe-wide droughtyear in 2003, and the year had the second highest GPP sumover the entire 12-yr period probably because of the above-average solar radiation levels. Although 2003 had the lowestprecipitation total, this followed a wet end to 2002 (Fig. 6a)and soil moisture (Fig. 6c) did not start to decline below thelong-term monthly mean until July. Precipitation was alsolower than average for most of 2005; although summer soilmoisture levels did not fall as low as in 2003, the declinestarted a month earlier in the year, which combined with the
lower levels of solar radiation caused a reduction in summerGPP in 2005. It is likely that lowReco values in late sum-mer/early autumn, as occurred in 2003, 2005 and 2006, canbe attributed to low soil moisture levels (Fig. 6c).
GPP was low in 2009 and 2010 because of considerabledamage to the forest canopy following a major outbreak ofdefoliating moth caterpillars, mostlyTortrix viridana L., butalso Operophtera brumataL., early in the year (Pitman etal., 2010). This was despite an increase in incident solarradiation of 4 % in 2009 and 7 % in 2010 received duringthe May to July period of each year. The infestation causeda reduction in peak LAI values (Table 3) from the long-term mean of 26 % in 2009 (4.40 m2 m−2) and 30 % in 2010(4.18 m2 m−2), which resulted in a reduction of GPP by 5 %in 2009 and 33 % in 2010.
The overall time trends in annual GPP,Recoand NEP weretested by linear regression against year. Although there wasno apparent long-term trend in the annual NEP (p = 0.89),this resulted from similar significant decreases in both GPP(−46.1 g C m−2 yr−1, standard error (s.e.) 13.7,p < 0.01)and Reco (−44.7 g C m−2 yr−1, s.e. 9.2,p < 0.001) overtime. If the last two annual values from the insect-affectedyears of 2009 and 2010 were omitted, there was a signif-icant positive trend in NEP (+21.0 g C m−2 yr−1, s.e. 8.5,p < 0.05), because the declining trend in GPP was reducedto −24.2 g C m−2 yr−1, although the declining trend inRecowas not affected (−45.2 g C m−2 yr−1, s.e. 12.2,p < 0.01).However, none of these changes in slope when 2009 and2010 values were omitted were significant because of theirlarge standard errors.
Biogeosciences, 9, 5373–5389, 2012 www.biogeosciences.net/9/5373/2012/

M. Wilkinson et al.: Inter-annual variation of carbon uptake 5381
(a)
0
50
100
150
200
250
300
350
1999 2000 2001 2002 2003 2004 2005 2006 2007 2008 2009 2010
Mon
thly
dev
iatio
n (%
)
(b)
-4
-3
-2
-1
0
1
2
3
4
1999 2000 2001 2002 2003 2004 2005 2006 2007 2008 2009 2010
Mon
thly
dev
iatio
n (°
C)
(c)
40
60
80
100
120
140
160
1999 2000 2001 2002 2003 2004 2005 2006 2007 2008 2009 2010
Mon
thly
dev
iatio
n (%
)
(d)
60
70
80
90
100
110
120
130
140
150
1999 2000 2001 2002 2003 2004 2005 2006 2007 2008 2009 2010
Mon
thly
dev
iatio
n (%
)
(e)
-150
-100
-50
0
50
100
150
1999 2000 2001 2002 2003 2004 2005 2006 2007 2008 2009 2010
GP
P D
evia
tion
(g C
m2 m
-1)
(f)
-150
-100
-50
0
50
100
150
1999 2000 2001 2002 2003 2004 2005 2006 2007 2008 2009 2010
Rec
o de
viat
ion
(g C
m2
m-1
)
Fig. 6. Deviation from the 12-yr monthly average (1999–2010) for key climatic variables and partitioned CO2 flux components at the oakplantation woodland, Straits Inclosure, Alice Holt Forest:(a) precipitation,(b) air temperature,(c) soil moisture,(d) solar radiation,(e)GPPand(f) Reco.
www.biogeosciences.net/9/5373/2012/ Biogeosciences, 9, 5373–5389, 2012
5382 M. Wilkinson et al.: Inter-annual variation of carbon uptake
1000
1200
1400
1600
1800
2000
1400 1500 1600 1700 1800 1900 2000 2100 2200 2300 2400
GPP (gC m-2 yr-1)
Rec
o (gC
m-2
y-1) …
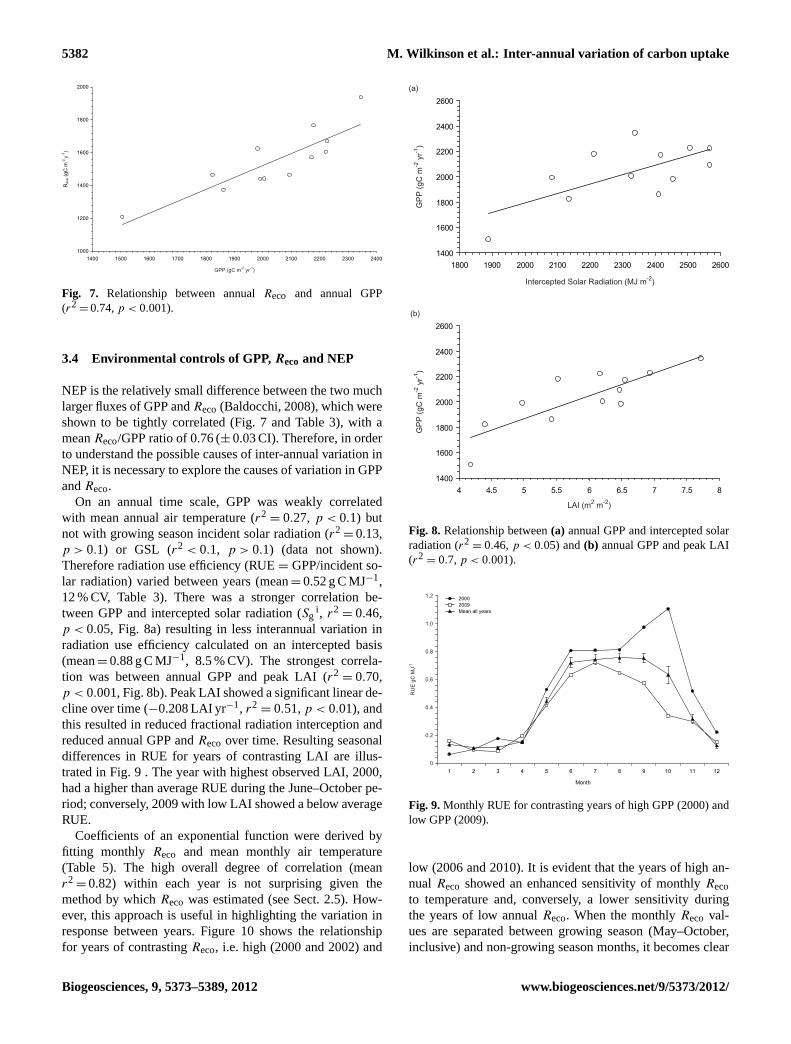
Fig. 7. Relationship between annualReco and annual GPP(r2
= 0.74,p < 0.001).
3.4 Environmental controls of GPP,Reco and NEP
NEP is the relatively small difference between the two muchlarger fluxes of GPP andReco(Baldocchi, 2008), which wereshown to be tightly correlated (Fig. 7 and Table 3), with ameanReco/GPP ratio of 0.76 (± 0.03 CI). Therefore, in orderto understand the possible causes of inter-annual variation inNEP, it is necessary to explore the causes of variation in GPPandReco.
On an annual time scale, GPP was weakly correlatedwith mean annual air temperature (r2
= 0.27, p < 0.1) butnot with growing season incident solar radiation (r2
= 0.13,p > 0.1) or GSL (r2 < 0.1, p > 0.1) (data not shown).Therefore radiation use efficiency (RUE= GPP/incident so-lar radiation) varied between years (mean= 0.52 g C MJ−1,12 % CV, Table 3). There was a stronger correlation be-tween GPP and intercepted solar radiation (Sg
i , r2= 0.46,
p < 0.05, Fig. 8a) resulting in less interannual variation inradiation use efficiency calculated on an intercepted basis(mean= 0.88 g C MJ−1, 8.5 % CV). The strongest correla-tion was between annual GPP and peak LAI (r2
= 0.70,p < 0.001, Fig. 8b). Peak LAI showed a significant linear de-cline over time (−0.208 LAI yr−1, r2
= 0.51,p < 0.01), andthis resulted in reduced fractional radiation interception andreduced annual GPP andReco over time. Resulting seasonaldifferences in RUE for years of contrasting LAI are illus-trated in Fig. 9 . The year with highest observed LAI, 2000,had a higher than average RUE during the June–October pe-riod; conversely, 2009 with low LAI showed a below averageRUE.
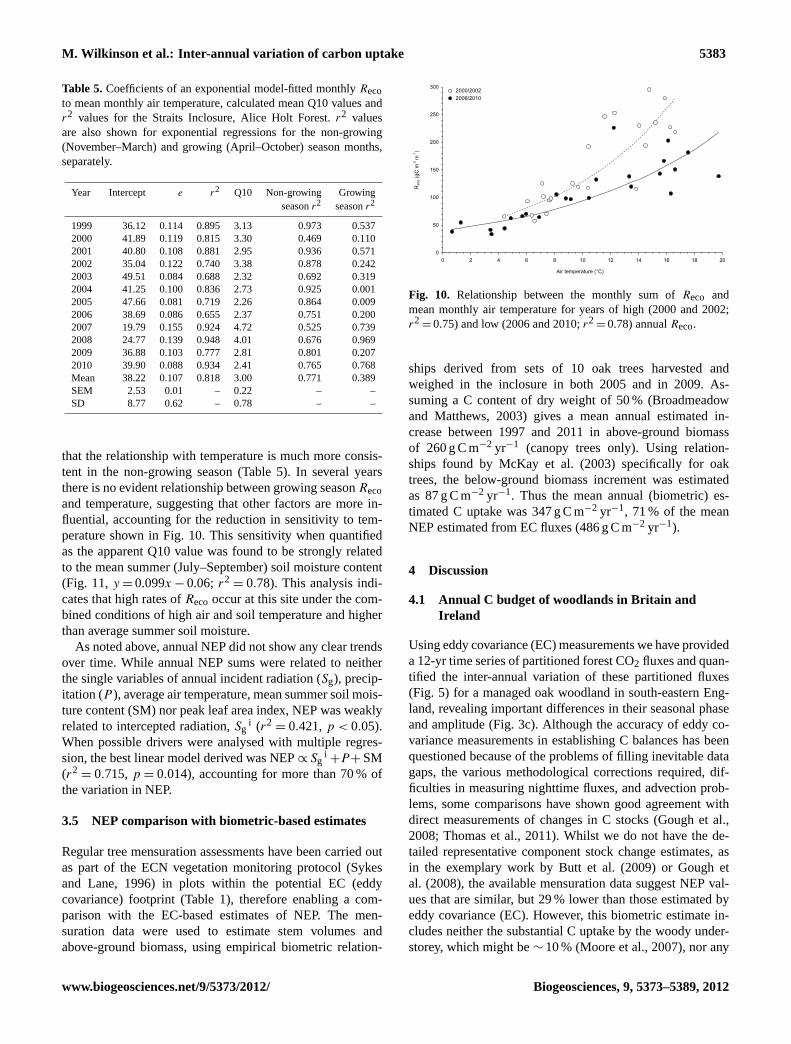
Coefficients of an exponential function were derived byfitting monthly Reco and mean monthly air temperature(Table 5). The high overall degree of correlation (meanr2
= 0.82) within each year is not surprising given themethod by whichReco was estimated (see Sect. 2.5). How-ever, this approach is useful in highlighting the variation inresponse between years. Figure 10 shows the relationshipfor years of contrastingReco, i.e. high (2000 and 2002) and
(b)
1400
1600
1800
2000
2200
2400
2600
4 4.5 5 5.5 6 6.5 7 7.5 8
(a)
1400
1600
1800
2000
2200
2400
2600
1800 1900 2000 2100 2200 2300 2400 2500 2600
GPP
(gC
m-2
yr-1
)G
PP (g
C m
-2 y
r-1)
LAI (m2 m-2)
Intercepted Solar Radiation (MJ m-2)
Fig. 8. Relationship between(a) annual GPP and intercepted solarradiation (r2
= 0.46, p < 0.05) and(b) annual GPP and peak LAI(r2
= 0.7, p < 0.001).
1 2 3 4 5 6 7 8 9 10 11 12
Month
0
0.2
0.4
0.6
0.8
1.0
1.2
RU
E g
C M
J-1
20002009Mean all years
Fig. 9. Monthly RUE for contrasting years of high GPP (2000) andlow GPP (2009).
low (2006 and 2010). It is evident that the years of high an-nual Reco showed an enhanced sensitivity of monthlyRecoto temperature and, conversely, a lower sensitivity duringthe years of low annualReco. When the monthlyReco val-ues are separated between growing season (May–October,inclusive) and non-growing season months, it becomes clear
Biogeosciences, 9, 5373–5389, 2012 www.biogeosciences.net/9/5373/2012/
M. Wilkinson et al.: Inter-annual variation of carbon uptake 5383
Table 5. Coefficients of an exponential model-fitted monthlyRecoto mean monthly air temperature, calculated mean Q10 values andr2 values for the Straits Inclosure, Alice Holt Forest.r2 valuesare also shown for exponential regressions for the non-growing(November–March) and growing (April–October) season months,separately.
Year Intercept e r2 Q10 Non-growing Growingseasonr2 seasonr2
1999 36.12 0.114 0.895 3.13 0.973 0.5372000 41.89 0.119 0.815 3.30 0.469 0.1102001 40.80 0.108 0.881 2.95 0.936 0.5712002 35.04 0.122 0.740 3.38 0.878 0.2422003 49.51 0.084 0.688 2.32 0.692 0.3192004 41.25 0.100 0.836 2.73 0.925 0.0012005 47.66 0.081 0.719 2.26 0.864 0.0092006 38.69 0.086 0.655 2.37 0.751 0.2002007 19.79 0.155 0.924 4.72 0.525 0.7392008 24.77 0.139 0.948 4.01 0.676 0.9692009 36.88 0.103 0.777 2.81 0.801 0.2072010 39.90 0.088 0.934 2.41 0.765 0.768Mean 38.22 0.107 0.818 3.00 0.771 0.389SEM 2.53 0.01 – 0.22 – –SD 8.77 0.62 – 0.78 – –
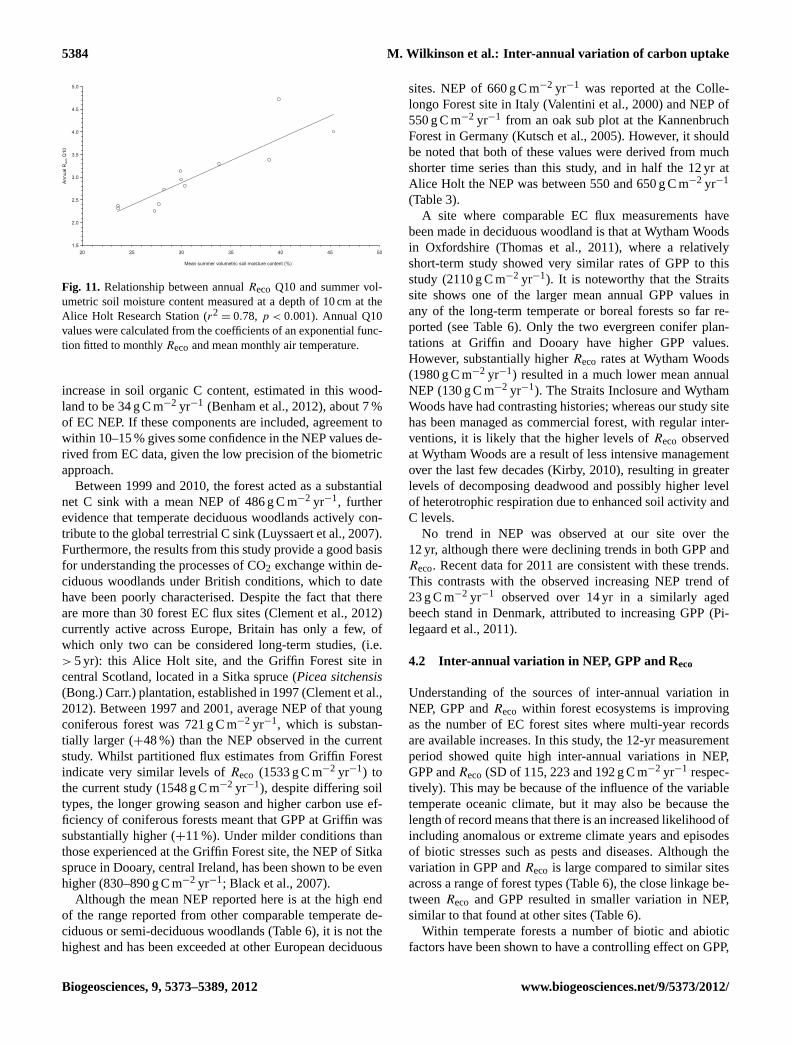
that the relationship with temperature is much more consis-tent in the non-growing season (Table 5). In several yearsthere is no evident relationship between growing seasonRecoand temperature, suggesting that other factors are more in-fluential, accounting for the reduction in sensitivity to tem-perature shown in Fig. 10. This sensitivity when quantifiedas the apparent Q10 value was found to be strongly relatedto the mean summer (July–September) soil moisture content(Fig. 11,y = 0.099x − 0.06; r2
= 0.78). This analysis indi-cates that high rates ofReco occur at this site under the com-bined conditions of high air and soil temperature and higherthan average summer soil moisture.
As noted above, annual NEP did not show any clear trendsover time. While annual NEP sums were related to neitherthe single variables of annual incident radiation (Sg), precip-itation (P ), average air temperature, mean summer soil mois-ture content (SM) nor peak leaf area index, NEP was weaklyrelated to intercepted radiation,Sg
i (r2= 0.421,p < 0.05).
When possible drivers were analysed with multiple regres-sion, the best linear model derived was NEP∝ Sg
i+P+ SM
(r2= 0.715,p = 0.014), accounting for more than 70 % of
the variation in NEP.
3.5 NEP comparison with biometric-based estimates
Regular tree mensuration assessments have been carried outas part of the ECN vegetation monitoring protocol (Sykesand Lane, 1996) in plots within the potential EC (eddycovariance) footprint (Table 1), therefore enabling a com-parison with the EC-based estimates of NEP. The men-suration data were used to estimate stem volumes andabove-ground biomass, using empirical biometric relation-
0
50
100
150
200
250
300
0 2 4 6 8 10 12 14 16 18 20
Air temperature (°C)
2000/20022006/2010
Rec
o (gC
m-2
m-1
)
Fig. 10. Relationship between the monthly sum ofReco andmean monthly air temperature for years of high (2000 and 2002;r2
= 0.75) and low (2006 and 2010;r2= 0.78) annualReco.
ships derived from sets of 10 oak trees harvested andweighed in the inclosure in both 2005 and in 2009. As-suming a C content of dry weight of 50 % (Broadmeadowand Matthews, 2003) gives a mean annual estimated in-crease between 1997 and 2011 in above-ground biomassof 260 g C m−2 yr−1 (canopy trees only). Using relation-ships found by McKay et al. (2003) specifically for oaktrees, the below-ground biomass increment was estimatedas 87 g C m−2 yr−1. Thus the mean annual (biometric) es-timated C uptake was 347 g C m−2 yr−1, 71 % of the meanNEP estimated from EC fluxes (486 g C m−2 yr−1).
4 Discussion
4.1 Annual C budget of woodlands in Britain andIreland
Using eddy covariance (EC) measurements we have provideda 12-yr time series of partitioned forest CO2 fluxes and quan-tified the inter-annual variation of these partitioned fluxes(Fig. 5) for a managed oak woodland in south-eastern Eng-land, revealing important differences in their seasonal phaseand amplitude (Fig. 3c). Although the accuracy of eddy co-variance measurements in establishing C balances has beenquestioned because of the problems of filling inevitable datagaps, the various methodological corrections required, dif-ficulties in measuring nighttime fluxes, and advection prob-lems, some comparisons have shown good agreement withdirect measurements of changes in C stocks (Gough et al.,2008; Thomas et al., 2011). Whilst we do not have the de-tailed representative component stock change estimates, asin the exemplary work by Butt et al. (2009) or Gough etal. (2008), the available mensuration data suggest NEP val-ues that are similar, but 29 % lower than those estimated byeddy covariance (EC). However, this biometric estimate in-cludes neither the substantial C uptake by the woody under-storey, which might be∼ 10 % (Moore et al., 2007), nor any
www.biogeosciences.net/9/5373/2012/ Biogeosciences, 9, 5373–5389, 2012
5384 M. Wilkinson et al.: Inter-annual variation of carbon uptake
1.5
2.0
2.5
3.0
3.5
4.0
4.5
5.0
20 25 30 35 40 45 50
Mean summer volumetric soil moisture content (%)
Ann
ual R
eco Q
10
Fig. 11. Relationship between annualReco Q10 and summer vol-umetric soil moisture content measured at a depth of 10 cm at theAlice Holt Research Station (r2
= 0.78, p < 0.001). Annual Q10values were calculated from the coefficients of an exponential func-tion fitted to monthlyRecoand mean monthly air temperature.
increase in soil organic C content, estimated in this wood-land to be 34 g C m−2 yr−1 (Benham et al., 2012), about 7 %of EC NEP. If these components are included, agreement towithin 10–15 % gives some confidence in the NEP values de-rived from EC data, given the low precision of the biometricapproach.
Between 1999 and 2010, the forest acted as a substantialnet C sink with a mean NEP of 486 g C m−2 yr−1, furtherevidence that temperate deciduous woodlands actively con-tribute to the global terrestrial C sink (Luyssaert et al., 2007).Furthermore, the results from this study provide a good basisfor understanding the processes of CO2 exchange within de-ciduous woodlands under British conditions, which to datehave been poorly characterised. Despite the fact that thereare more than 30 forest EC flux sites (Clement et al., 2012)currently active across Europe, Britain has only a few, ofwhich only two can be considered long-term studies, (i.e.> 5 yr): this Alice Holt site, and the Griffin Forest site incentral Scotland, located in a Sitka spruce (Picea sitchensis(Bong.) Carr.) plantation, established in 1997 (Clement et al.,2012). Between 1997 and 2001, average NEP of that youngconiferous forest was 721 g C m−2 yr−1, which is substan-tially larger (+48 %) than the NEP observed in the currentstudy. Whilst partitioned flux estimates from Griffin Forestindicate very similar levels ofReco (1533 g C m−2 yr−1) tothe current study (1548 g C m−2 yr−1), despite differing soiltypes, the longer growing season and higher carbon use ef-ficiency of coniferous forests meant that GPP at Griffin wassubstantially higher (+11 %). Under milder conditions thanthose experienced at the Griffin Forest site, the NEP of Sitkaspruce in Dooary, central Ireland, has been shown to be evenhigher (830–890 g C m−2 yr−1; Black et al., 2007).
Although the mean NEP reported here is at the high endof the range reported from other comparable temperate de-ciduous or semi-deciduous woodlands (Table 6), it is not thehighest and has been exceeded at other European deciduous
sites. NEP of 660 g C m−2 yr−1 was reported at the Colle-longo Forest site in Italy (Valentini et al., 2000) and NEP of550 g C m−2 yr−1 from an oak sub plot at the KannenbruchForest in Germany (Kutsch et al., 2005). However, it shouldbe noted that both of these values were derived from muchshorter time series than this study, and in half the 12 yr atAlice Holt the NEP was between 550 and 650 g C m−2 yr−1
(Table 3).A site where comparable EC flux measurements have
been made in deciduous woodland is that at Wytham Woodsin Oxfordshire (Thomas et al., 2011), where a relativelyshort-term study showed very similar rates of GPP to thisstudy (2110 g C m−2 yr−1). It is noteworthy that the Straitssite shows one of the larger mean annual GPP values inany of the long-term temperate or boreal forests so far re-ported (see Table 6). Only the two evergreen conifer plan-tations at Griffin and Dooary have higher GPP values.However, substantially higherReco rates at Wytham Woods(1980 g C m−2 yr−1) resulted in a much lower mean annualNEP (130 g C m−2 yr−1). The Straits Inclosure and WythamWoods have had contrasting histories; whereas our study sitehas been managed as commercial forest, with regular inter-ventions, it is likely that the higher levels ofReco observedat Wytham Woods are a result of less intensive managementover the last few decades (Kirby, 2010), resulting in greaterlevels of decomposing deadwood and possibly higher levelof heterotrophic respiration due to enhanced soil activity andC levels.
No trend in NEP was observed at our site over the12 yr, although there were declining trends in both GPP andReco. Recent data for 2011 are consistent with these trends.This contrasts with the observed increasing NEP trend of23 g C m−2 yr−1 observed over 14 yr in a similarly agedbeech stand in Denmark, attributed to increasing GPP (Pi-legaard et al., 2011).
4.2 Inter-annual variation in NEP, GPP and Reco
Understanding of the sources of inter-annual variation inNEP, GPP andReco within forest ecosystems is improvingas the number of EC forest sites where multi-year recordsare available increases. In this study, the 12-yr measurementperiod showed quite high inter-annual variations in NEP,GPP andReco (SD of 115, 223 and 192 g C m−2 yr−1 respec-tively). This may be because of the influence of the variabletemperate oceanic climate, but it may also be because thelength of record means that there is an increased likelihood ofincluding anomalous or extreme climate years and episodesof biotic stresses such as pests and diseases. Although thevariation in GPP andReco is large compared to similar sitesacross a range of forest types (Table 6), the close linkage be-tweenReco and GPP resulted in smaller variation in NEP,similar to that found at other sites (Table 6).
Within temperate forests a number of biotic and abioticfactors have been shown to have a controlling effect on GPP,
Biogeosciences, 9, 5373–5389, 2012 www.biogeosciences.net/9/5373/2012/

M. Wilkinson et al.: Inter-annual variation of carbon uptake 5385
Table 6.Published multi-annual values of NEP, GPP andReco for a range of temperate and boreal forest ecosystems
Site Country No of Measurement NEP GPP Reco Forest Type Authorsyears period g C m−2 yr−1 g C m−2 yr−1 g C m−2 yr−1
Alice Holt UK 12 1999–2010 486 (115) 2034 (228) 1548 (192) Temperate deciduous Present studyoak plantation
Griffin UK 5 1997–2001 721 (60) 2253 (83) 1533 (37) Temperate conifer Clement et al. (2012)plantation
De Inslag Belgium 6 1997–2002 −91 (na) 1234 (na) 1326 (na) Mixed temperate Carrara et al. (2003)Lille Bøgeshov Denmark 14 1996–2009 156 (103) 1727 (136) 1570 (97) Temperate beech Pilegaard et al. (2011)SMEAR II Finland 10 1999–2007 206 (38) 1031 (54) 825 (39) Boreal Scots pine Ilvesniemi et al. (2009)Hesse France 10 1995–2005 386 (171) 1397 (192) 1011 (138) Temperate beech Granier et al. (2008)Puechabon France 6b 2001–2006 278 (117) 1317 (151) 1018 (68) Evergreen Mediterranean Allard et al. (2008)
forestDooary Ireland 8 2000–2006c 886 (20) 2311 (145) 1445 (133) Temperate conifer Saunders et al. (2012)
plantationBorden Forest Canada 8 1996–2003 141 (112) 1118 (92) 976 (67) Mixed hardwood and Teklemariam et al. (2009)
coniferNorthern Old Canada 10 1994–2004 1.8 (41) 706 (57) 713 (79) Black spruce/veneer bog Dunn et al. (2007)Black SpruceHarvard Forest USA 9 1993–2000 201 (36) 1297 (99) 1099 (91) Mixed deciduous Barford et al. (2001)Harvard Foresta USA 13 1992–2004 245 (100) 1400 (164) 1153 (105) Mixed deciduous Urbanski et al. (2007)Akou Japan 3 2001–2003 615 (189) 1759 (220) 1144 (135) Warm temperate evergreen Kosugi et al. (2005)
broad-leavedTakayama Japan 9 1994–2002 237 (92) 978 (120) 742 (36) Cool temperate Saigusa et al. (2005)
deciduous forestTomakomai Japan 3 2001–2003 212 (44) 1673 (60) 1461 (43) Larch plantation Hirata et al. (2007)National Forest
Where NEP data were not available, NEE has been used; figures in brackets are standard deviation;a based on ecological year;b of this 9-yr study, only 6 full years of data were available;c based on the pre-thinning period.
including light interception, seasonal phenological develop-ment, temperature and moisture availability (Reichstein etal., 2007). The ratio of CO2 uptake to available light is akey variable, and has been shown to be influenced by a vari-ety of environmental conditions and stresses including standage, species composition, soil fertility, nutrient status (Goweret al., 1999) and the ratio of diffuse to total incident radi-ation (Jenkins et al., 2007; Alton, 2008). Here, the annualmean RUE varied between 0.62 and 0.41 g C MJ−1 incidentradiation (2000 and 2010 respectively; Table 3), averaging0.52 g C MJ−1. A comparison with other sites is made diffi-cult as there is no common definition of RUE. Some studieshave used net primary productivity as the numerator; othershave used GPP (Schwalm et al., 2006). In years with lowpeak LAI, monthly RUE values were low (Fig. 9), particu-larly later in the year. It is unlikely that, over such monthlyperiods, variation in the ratio of diffuse to total incident ra-diation was a major contributor to this effect. Peak LAI ex-plained a large proportion of the inter-annual variation in an-nual GPP (r2
= 0.7; Fig. 8) because of its direct relationshipwith light interception and canopy photosynthesis; a similarresponse to that shown by Longdoz et al. (2010) across arange of forest sites in France. Furthermore, the trend of de-clining peak LAI over time at this site led to parallel declinesin GPP andReco. We can offer no explanation for this long-term decline in peak LAI. Interestingly, when annualReco to-tals are separated into growing season and non-growing sea-
son periods, the declining trend is only found in the growingseasonReco, which comprises 71 % (±3 % CI) of the annualtotal. This emphasises the strong linkage betweenReco andGPP within a growing season.
Growing season length has also been shown to be an im-portant control factor in ecosystem C balance both at the in-dividual site level (e.g. Carrara et al., 2003; Granier et al.,2008) and across a range of forest types (Baldocchi and Xu,2005). However, at this site neither NEP nor GPP was cor-related with onset of growing season or length of growingseason. This is similar to the findings of Dunn et al. (2007)who found no correlation between longer growing seasonsand net C uptake (at a boreal black spruce forest), which theysuggested was due to corresponding increases in ecosystemrespiration offsetting increased GPP during longer growingseasons.
The importance of indirect climatic events such as insect-induced canopy defoliation is becoming evident from thegrowing network of long-term forest EC studies (Allard etal., 2008; Pilegaard et al., 2011). In this study the observedreduction in NEP that occurred in 2009 and 2010 could inpart be attributed to the major outbreak of defoliating mothcaterpillars, which caused a significant reduction in peakLAI. In addition, there are likely to have been some effectsof the oak powdery mildew (Erysiphe alphitoides) infectionof leaf regrowth on a number of oak trees within the study
www.biogeosciences.net/9/5373/2012/ Biogeosciences, 9, 5373–5389, 2012

5386 M. Wilkinson et al.: Inter-annual variation of carbon uptake
area in 2009 and 2010 (Heinemeyer at al., 2012) and the oc-currence of a late and damaging air frost on day 127 in 2010.
Understanding the determinants ofReco is complicated be-cause it is governed by several different above- and below-ground processes, each responding to a set of environmen-tal variables. The ratio ofReco/GPP was relatively constant(0.76± 0.02 CI) and was similar to the average value of 0.80reported by Law et al. (2002) for a range of forest types. Inthe absence of auxiliary measurements, it is impossible toseparate totalReco into its different components. Howeverin a parallel study at the same site, between 2007 and 2010,soil CO2 efflux was estimated to be 740± 43 g C m−2 yr−1
(Heinemeyer at al., 2012), accounting for∼ 53 % of totalReco over the same period. Other studies have estimated alarger contribution by soil autotrophs and heterotrophs to to-tal Reco. For example, Knohl et al. (2008) reported a rangeof 79–88 % for another temperate deciduous forest. At theannual scale, mean monthly air temperature explained mostof the annual variability inReco (r2
= 0.81, Table 5). Non-growing season (winter)Reco was tightly correlated withair temperature (meanr2
= 0.77), which we attribute to thedominance of heterotrophic respiration during this period.During the growing season the relationship was weaker andvaried substantially between years because of the influenceof soil moisture. There was more interannual variation in thisrelationship during the growing season (r2
= 0.39). This typeof response has been demonstrated across a range of otherforest sites (Law et al., 2002) and is probably because, un-der conditions of moderate reduced water content, microbialrespiration is limited by the diffusion of soluble organic sub-strates (Epron et al., 1999), particularly in the near-surfacelayers. The autotrophic respiration component is less likelyto be affected by moderate reductions in water content be-cause of the deeper rooting depth (Borken et al., 2006).
The 12-yr continuous dataset presented here for the firsttime shows that this deciduous forest ecosystem locatedin southeast Britain acted as a substantial sink for car-bon, with a mean up take of 486 g C m−2 yr−1 (95 % CIof ± 73 g C m−2 yr−1). Our EC-based estimates of NEPare relatively closely matched by mensuration-based esti-mates, providing confidence in our measurements. Year-to-year variation in NEP was largely explained by changes inthe contributory, yet opposing, partitioned fluxes of GPP andReco, and the main biological and environmental drivers ofthese have been discussed. The study has also identified theimportant effect that biotic damage such as insect defoliationcan have on the carbon flux dynamics of forests.
Copyright statement
©Crown copyright 2012.
Acknowledgements.The authors would like to thank all staff andstudents at Forest Research who have worked on this project. Ourspecial thanks to Rona Pitman for assisting with running the siteand contributing to litterfall analysis, Eric Casella for biometrictree harvest data, and to Samantha Broadmeadow for her technicalassistance. We would also like to thank staff at the School ofGeoSciences, University of Edinburgh, especially Robert Clement,for their advice and guidance, particularly in the use of EdiResoftware. We are grateful to the Forestry Commission for fundingthis work.
Edited by: P. Stoy
References
Allard, V., Ourcival, J. M., Rambal, S., Joffree, R., and Rocheteau,A.: Seasonal and annual variation of carbon exchange in an ev-ergreen Mediterranean forest in southern France, Glob. ChangeBiol., 14, 714–725, 2008.
Alton, P. B.: Reduced carbon sequestration in terrestrial ecosystemsunder overcast skies compared to clear skies, Agr. Forest Meteo-rol., 148, 1641–1653, 2008.
Aubinet, M., Grelle, A., Ibrom, A., Rannik, U., Moncrieff, J., Fo-ken, T., Kowalaski, A. S., Martin, P. H., Berbigier, P., Bernhofer,C., Clement, R., Elbers, J., Granier, A., Grunwald, T., Morgen-stern, K., Pilegaard, K., Rebmann, C., Snijders, W., Valentini,R., and Vesala, T.: Estimates of the annual net carbon and waterexchanges of forests: the EUROFLUX methodology, Adv. Ecol.Res., 30, 113–175, 2000.
Baldocchi, D. D.: ‘Breathing’ of the terrestrial biosphere: lessonslearned from a global network of carbon dioxide flux measure-ment systems, Aust. J. Bot., 56, 1–26, 2008.
Baldocchi, D. D. and Xu, L.: Carbon exchange of deciduousbroadleaved forests in temperate and mediterranean regions, in:Carbon Balance of Forest Biomes, edited by: Jarvis, P. J. andGriffiths, H., Taylor & Francis, Oxford, 187–216, 2005.
Baldocchi, D. D., Falge, E., Gu, L. H., Olson, R., Hollinger, D.,Running, S., Anthoni, P., Bernhofer, C., Davis, K., Evans, R.,Fuentes, J., Goldstein, A., Katul, G., Law, B., Lee, X. H., Malhi,Y., Meyers, T., Munger, W., Oechel, W., Paw, K. T., Pilegaard,K., Schmid, H. P., Valentini, R., Verma, S., Vesala, T., Wilson,K., and Wofsy, S.: FLUXNET: A new tool to study the tempo-ral and spatial variability of ecosystem-scale carbon dioxide, wa-ter vapor, and energy flux densities, B. Am. Meteorol. Soc., 82,2415–2434, 2001.
Barford, C. C., Wofsy, S. C., Goulden, M. L., Munger, J. W., Pyle,E. H., Urbanski, S. P., Hutyra, L., Saleska, S. R., Fitzjarrald, D.,and Moore, K.: Factors controlling long- and short-term seques-tration of atmospheric CO2 in a mid-latitude forest, Science, 294,1688–1691, 2001.
Benham, S. E., Vanguelova, E. I., and Pitman, R. M.: Shortand long term changes in carbon, nitrogen and acidity inthe forest soils under oak at the Alice Holt EnvironmentalChange Network site, Sci. Total Environ., 421–422, 82–93,doi:10.1016/j.scitotenv.2012.02.004, 2012.
Black, K., Bolger, T., Davis, P., Nieuwenhuis, M., Reidy, B., Saiz,G., Tobin, B., and Osborne, B.: Inventory and eddy covariance-based estimates of annual carbon sequestration in a Sitka spruce
Biogeosciences, 9, 5373–5389, 2012 www.biogeosciences.net/9/5373/2012/
M. Wilkinson et al.: Inter-annual variation of carbon uptake 5387
(Picea sitchensis(Bong.) Carr.) forest ecosystem, Eur. J. For.Res., 126, 167–178, 2007.
Borken, W., Savage, K., Davidson, E. A., and Trumbore, S. E.: Ef-fects of experimental drought on soil respiration and radiocarbonefflux from a temperate forest soil, Glob. Change Biol., 12, 177–193, 2006.
Broadmeadow, M. S. J. and Matthews, R. W.: Forests, carbon andclimate change: the UK contribution, Forestry Commission In-formation Note 48, Forestry Commission, Edinburgh, 2003.
Butt, N., Campbell, G., Malhi, Y., Morecroft, M., Fenn, K., andThomas, M.: Initial results from establishment of a long-termbroadleaf monitoring plot at Wytham Woods, Oxford, UK, Uni-versity of Oxford report, Oxford, 2009.
Carrara, A., Kowalski, A. S., Neirynck, J., Janssens, I. A., Yuste, J.C., and Ceulemans, R.:. Net ecosystem CO2 exchange of mixedforest in Belgium over 5 years, Agr. Forest Meteorol. 119, 209–227, 2003.
Ciais, P., Reichstein, M., Viovy, N., Granier, A., Ogee, J., Al-lard, V., Aubinet, M., Buchmann, N., Bernhofer, C., Carrara, A.,Chevallier, F., De Noblet, N., Friend, A. D., Friedlingstein, P.,Grunwald, T., Heinesch, B., Keronen, P., Knohl, A., Krinner, G.,Loustau, D., Manca, G., Matteucci, G., Miglietta, F., Ourcival,J. M., Papale, D., Pilegaard, K., Rambal, S., Seufert, G., Sous-sana, J. F., Sanz, M. J., Schulze, E. D., Vesala, T., and Valentini,R.: Europe-wide reduction in primary productivity caused by theheat and drought in 2003, Nature, 437, 529–533, 2005.
Clement, R. J., Jarvis, P. G., and Moncrieff, J. B.:, Carbon dioxideexchange of a Sitka Spruce plantation in Scotland over five years,Agr. Forest Meteorol. 153, 106–123, 2012.
Dunn, A. L., Barford, C. C., Wofsy, S. C., Goulden, M. L., andDaube, B. C.: A long-term record of carbon exchange in a borealblack spruce forest: means, responses to interannual variability,and decadal trends, Glob. Change Biol., 13, 577–590, 2007.
Epron, D., Farque, L., Lucot, E., and Badot, P. M.: Soil CO2 effluxin a beech forest: dependence on soil temperature and soil watercontent, Ann. For. Sci., 56, 221–226, 1999.
Falge, E., Baldocchi, D., Olson, R. J., Anthoni, P., Aubinet, M.,Bernhofer, C., Burba, G., Ceulemans, R., Clement, R., Dolman,H., Granier, A., Gross, P., Grunwald, T., Hollinger, D., Jensen,N.-O., Katul, G., Keronen, P., KowalskI, A., Ta Lai, C., Law,B. E., Meyers, T., Moncrieff, J., Moors, E., Munger, J. W., Pi-legaard, K., Rannik,U., Rebmann, C., Suyker, A., Tenhunen, J.,Tu, K., Verma, S., Vesala, T., Wilson, K., and Wofsy, S.: Gapfilling strategies for defensible annual sums of net ecosystem ex-change, Agr. Forest Meteorol., 107, 43–69, 2001.
Gough, C. M., Vogel, C. S., Schmid, H. P., Su, H.-B., and Curtis,P. S.: Multi-year convergence of biometric and meteorologicalestimates of forest carbon storage, Agr. Forest Meteorol., 148,158–170, 2008.
Gower, S. T., Kucharik, C. J., and Norman, J. M.: Direct and in-direct estimation of leaf area index, f(APAR), and net primaryproduction of terrestrial ecosystems, Remote Sens. Environ., 70,29–51, 1999.
Granier, A., Breda, N., Longdoz, B., Gross. P., and Ngao, J.: Tenyears of fluxes and stand growth in a young beech forest at Hesse,North-eastern France, Ann. For. Sci., 65, 704, 2008.
Greco, S. and Baldocchi, D. D.: Seasonal variation of CO2 andwater vapour exchange rates over a temperate deciduous forest,Glob. Change Biol., 2, 183-197, 1996.
Heinemeyer, A., Wilkinson, M., Vargas, R., Subke, J.-A., Casella,E., Morison, J. I. L., and Ineson, P.: Exploring the “overflow tap”theory: linking forest soil CO2 fluxes and individual mycorrhizo-sphere components to photosynthesis, Biogeosciences, 9, 79–95,doi:10.5194/bg-9-79-2012, 2012.
Hignett, P.: Corrections to temperature measurements with a sonicanemometer, Bound.-Lay. Meteorol., 67, 175–187, 1992.
Hirata, R., Hirano, T., Saigusa, N., Fujinuma, Y., Inukai, K., Kita-mori, Y., Takahashi, Y., and Yamamoto, S.: Seasonal and interan-nual variations in carbon dioxide exchange of a temperate larchforest, Agr. Forest Meteorol., 147, 110–124, 2007.
Hollinger, D. Y., Kelliher, F., Byers, J. N., Hunt, J. E., McSeveny, T.M., and Weir, P. L.: Carbon dioxide exchange between an undis-turbed old-growth temperate forest and the atmosphere, Ecology,75, 134–150, 1994.
ICP Forests (International co-operative programme on assessmentand monitoring of air pollution effects on forests), Part XI: Sam-pling and analysis of litterfall, vTI-Institute for World Forestry,Hamburg, 2004.
Ilvesniemi, H., Levula, J., Ojansuu, R., Kolari, P., Kulmala, L.,Pumpanen, J., Launiainen, S., Vesala, T., and Nikinmaa, E.:Long-term measurements of the carbon balance of a boreal Scotspine dominated forest ecosystem, Boreal Environ. Res., 14, 731–753, 2009.
Ito, S., Saigusa, N., Murayama, S., and Yamamoto, S.: Modellingof gross and net carbon dioxide exchange over a cool-temperatedeciduous broad-leaved forest in Japan: Analysis of seasonal andinterannual change, Agr. Forest Meteorol., 134, 122–134, 2005.
Jenkins, J. P., Richardson, A. D., Braswell, B. H., Ollinger, S. V.,Hollinger, D. Y., and Smith, M.-L.: Refining light-use efficiencycalculations for a deciduous forest canopy using simultaneoustower-based carbon flux and radiometric measurements, Agr.Forest Meteorol., 143, 64–79, 2007.
Kirby, K. J.: The trees in the woods Wytham Woods, in: Oxford’sEcological Laboratory, edited by: Savill, P. S., Perrins, C. M.,Kirby, K. J., and Fisher, N., Oxford University Press, Oxford,57–74, 2010.
Knohl, A., Søe, A. R. B., Kutsch, W. L., Gockede, M., and Buch-mann, N.: Representative estimates of soil and ecosystem respi-ration in an old beech forest, Plant Soil, 302, 189–202, 2008.
Kormann, R. and Meixner, F. X.: An analytical footprint model fornon-neutral stratification, Bound.-Lay. Meteorol., 99, 207–224,2001.
Kosugi, Y., Tanaka, H., Takanashi, S., Matsuo, N., Ohte, N., Shi-bata, S., and Tani, M.: Three years of carbon and energy fluxesfrom Japanese evergreen broad-leaved forest, Agr. Forest Mete-orol., 132, 329–343, 2005.
Kutsch, W., Liu, C. J., Hoermann, G., and Herbst, M.: Spatial het-erogeneity of ecosystem carbon fluxes in a broadleaved forest inNorthern Germany, Glob. Change Biol., 11, 70–88, 2005.
Law, B. E., Falge, E., Gu, L., Baldocchi, D. D., Bakwin, P.,Berbigier, P., Davis, K., Dolman, A. J., Falk, M., Fuentes, J. D.,Goldstein, A., Granier, A., Grelle, A., Hollinger, D., Janssens, I.A., Jarvis, P., Jensen, N.-O., Katul, G., Mahli, Y., Matteucci, G.,Meyers, T., Monson, R., Munger, W., Oechel, W., Olson, R., Pi-legaard, K., Paw, K. T., Thorgeirsson, H., Valentini, R., Verma,S., Vesala, T., Wilson, K., and Wofsy, S.: Environmental controlsover carbon dioxide and water vapor exchange of terrestrial veg-etation, Agr. Forest Meteorol., 113, 96–120, 2002.
www.biogeosciences.net/9/5373/2012/ Biogeosciences, 9, 5373–5389, 2012
5388 M. Wilkinson et al.: Inter-annual variation of carbon uptake
Lenschow, D. H. and Raupach, M. R.: The attenuatation of fluctu-ations in scalar concentrations through sampling tubes, J. Geo-phys. Res., 96D, 15259–15268, 1991.
Leuning, R. and Moncrieff, J.: Eddy-covariance CO2 flux measure-ments using open- and closed-path CO2 analysers: correctionsfor analysers water vapour sensitivity and damping of fluctua-tions in air sampling tubes, Bound.-Lay. Meteorol., 53, 63–76,1990.
Lloyd, J. and Taylor, J. A.: On the temperature dependence of soilrespiration, Funct. Ecol., 8, 315–323, 1994.
Longdoz, B., Granier, A., Loustau, D., Bakker, M., Delzon, S.,Kowalski, A. S., Rambal, S., Dufrene, E., Bonal, D., and Nouvel-lon, Y.: Environmental control of carbon fluxes in forest ecosys-tems in France: a comparison of temperate, mediterranean andtropical forests, in: Forests, Carbon Cycle and Climate Change,edited by: Loustau, D.,Editions Quae, Versailles, 27–53, 2010.
Luyssaert, S., Inglima, I., Jung, M., Richardson, A. D., Reichstein,M., Papale, D., Piao, S. L., Schulze, E. D., Wingate, L., Mat-teucci, G., Aragao, L. E. O. C., Aubinet, M., Beers, C., Bern-hofer C., Black, G. K., Bonal, D., Bonnefond, J. M., Cham-bers, J., Ciais, P., Cook, B., Davis, K. S., Dolman, A. J., Gie-len, B., Goulden, M., Grace, J., Granier, A., Grelle, A., Griffis,T., Grunwald, T., Guidolotti, G., Hanson, P. J., Harding, R.,Hollinger, D. Y., Hutyra, L. R., Kolari, P., Kruijt, B., Kutsch, W.L., Lagergren, F., Laurila, T., Law, B., Le Maire, G., Lindroth,A., Loustau, D., Malhi, Y., Mateu, J., Migliavacca, M., Misson,L., Montagnani, L., Moncrieff, J., Moors, E. J., Munger, J. W.,Nikinmaa, E., Ollinger, S. V., Pita, G., Rebmann, C., and Roup-sard, O.: CO2 balance of boreal, temperate, and tropical forestsderived from a global database, Glob. Change Biol. 13, 2509–2537, 2007
McKay, H., Hudson, J. B., and Hudson, R. J.: Woodfuel Resourcesin Britain FES/B/W3/00787/REP/2. DTI./Pub URN 03/1436,Forestry Commission and Forestry Contracting Association, Ed-inburgh and Lairg, 2003.
Massman, W. J.: The attenuation of concentration fluctuations inturbulent flow through a tube, J. Geophys. Res., 96D, 15269–15273, 1991.
Moffat, A. M., Papale, D., Reichstein, M., Hollinger, D. Y., Richard-son, A. D., Barr, A. G., Beckstein, C., Braswell, B. H., Churkina,G., Desai, A. R., Falge, E., Grove, J. H., Heimann, M., Hui, D.,Jarvis, A. J., Kattge, J., Noormets, A., and Stauch, V. J.: Compre-hensive comparison of gap-filling techniques for eddy covariancenet carbon fluxes, Agr. Forest Meteorol., 147, 209–232, 2007.
Moncrieff, J. B., Massheder, J. M., de Bruin, H., Elbers, J., Friborg,T., Heusinkveld, B., Kabat, P., Scott, S., Soegaard, H., and Ver-hoef, A.: A system to measure surface fluxes of momentum sen-sible heat, water vapour and carbon dioxide, J. Hydrol., 188–189,589–611, 1997.
Moore, C. J.: Frequency response corrections for eddy correlationsystems, Bound.-Lay. Meteorol., 37, 17–35, 1986.
Moore, P. T., Van Miegroet, H., and Nicholas, N. S.: Relative roleof understory and overstory in carbon and nitrogen cycling in asouthern Appalachian spruce-fir forest, Can. J. Forest Res., 37,2689–2700, 2007.
Morison, J., Matthews, R., Miller, G., Perks, M., Randle, T.,Vanguelova, E., White, M., and Yamulki, S.: Understanding thecarbon and greenhouse gas balance of forests in Britain. ForestryCommission Research Report, Forestry Commission, Edinburgh,
149 pp., 2012.Nabuurs, G. J., Masera, O., Andrasko, K., Benitez-Ponce, P., Boer,
R., Dutschke, M., Elsiddig, E., Ford-Robertson, J., Frumhoff, P.,Karjalainen, T., Krankina, O., Kurz, W. A., Matsumota, M., Oy-hantcabal, W., Ravindranath, N. H., Sanz Sanchex, M. J., andZhang, X.: Forestry, in: Climate Change 2007: Mitigation, Con-tribution of Working group III to the Fourth Assessment Reportof the Intergovernmental Panel on Climate Change, edited by:Metz, B., Davidson, O. R., Bosch, P. R., Dave, R., and Meyer, L.A., Cambridge University Press, Cambridge, 541–584, 2007.
Noormets, A., McNulty, S. G., DeForest, J. L., Sun, G., Li, Q., andChen, J. L: Drought during canopy development has lasting ef-fect on annual carbon balance in a deciduous temperate forest,New Phytol., 179, 818–828, 2008.
Pan, Y., Birdsey, R. A., Fang, J., Houghton, R., Kauppi, P. E., Kurz,W. A., Phillips, O. L., Shvidenko, A., Lewis, S. L., Canadell, J.G., Ciais, P., Jackson, R. B., Pacala, S., McGuire, A. D., Piao, S.,Rautiainen, A., Sitch, S., and Hayes, D.: A large and persistentcarbon sink in the world’s forests, Science, 19, 988–993, 2011.
Papale, D., Reichstein, M., Aubinet, M., Canfora, E., Bernhofer, C.,Kutsch, W., Longdoz, B., Rambal, S., Valentini, R., Vesala, T.,and Yakir, D.: Towards a standardized processing of Net Ecosys-tem Exchange measured with eddy covariance technique: algo-rithms and uncertainty estimation, Biogeosciences, 3, 571–583,doi:10.5194/bg-3-571-2006, 2006.
Pereira, J. S., Mateus, J. A., Aires, L. M., Pita, G., Pio, C., David,J. S., Andrade, V., Banza, J., David, T. S., Paco, T. A., and Ro-drigues, A.: Net ecosystem carbon exchange in three contrast-ing Mediterranean ecosystems – the effect of drought, Biogeo-sciences, 4, 791–802,doi:10.5194/bg-4-791-2007, 2007.
Pilegaard, K., Ibrom, A., Courtney, M. S., Hummelshøj, P., andJensen, N. O.: Increasing net CO2 uptake by a Danish beech for-est during the period from 1996 to 2009, Agr. Forest Meteorol.151, 934–946, 2011.
Pitman, R. M. and Broadmeadow, M. S. J.: Leaf area, biomass andphysiological parameterisation of ground vegetation of lowlandoak woodland, Internal Report to PPD, Forestry Commission,Edinburgh, 2001.
Pitman, R. M., Vanguelova, E. I., and Benham, S. E.: The effects ofphytophagous insects on water and soil nutrient concentrationsand fluxes through forest stands of the Level II monitoring net-work in the UK, Sci. Total Environ., 409, 169–181, 2010.
Powell, T. L., Bracho, R., Li, J. H., Dore, S., Hinkle, C. R., andDrake, B. G.: Environmental controls over net ecosystem carbonexchange of scrub oak in central Florida, Agr. Forest Meteorol.,141, 19–34, 2006.
Pyatt, D. G.: Soil classification, Forestry Commission Research In-formation Note 68/82/SSN, Forestry Commission, Edinburgh,1982.
Reich, P. B.: Taking stock of forest carbon, Nature Clim. Change,1, 346–347, 2011.
Reichstein, M., Falge, E., Baldocchi, D., Papale, D., Valentini,R., Aubinet, M., Berbigier, P., Bernhofer, C., Buchmann, N.,Gilmanov, T., Granier, A., Grunwald, T., Havrankova, K.,Janous, D., Knohl, A., Laurela, T., Lohila, A., Loustau, D., Mat-teucci, G., Meyers, T., Miglietta, F., Ourcival, J. M., Rambal, S.,Rotenberg, E., Sanz, M., Seufert, G., Vaccari, F., Vesala, T., andYakir, D.: On the separation of net ecosystem exchange into as-similation and ecosystem respiration: review and improved algo-
Biogeosciences, 9, 5373–5389, 2012 www.biogeosciences.net/9/5373/2012/
M. Wilkinson et al.: Inter-annual variation of carbon uptake 5389
rithm, Glob. Change Biol., 11, 1–16, 2005.Reichstein, M., Papale, D., Valentini, R., Aubinet, M., Bernhofer,
C:, Knohl, A., Laurila, T., Lindroth, A., Moors, E., Pilegaard,K., and Seufert, G.: Determinants of terrestrial ecosystem car-bon balance inferred from European eddy covariance flux sites,Geophys. Res. Lett., 34, L01402,doi:10.1029/2006GL027880,2007.
Saigusa, N., Yamamoto, S., Murayama, S., and Kondo, H.: Inter-annual variability of carbon budget components in an AsiaFluxforest site estimated by long-term flux measurements, Agric. For-est Meteorol. 134, 4–16, 2005.
Saigusa, N., Yamamoto, S., Hirata, R., Ohtani, Y., Ide, R., Asanuma,J., Gamo, M., Hirano, T., Kondo, H., Kosugi, Y., Li, S. G., Nakai,Y., Takagi, K., Tani, M., and Wang, H.: Temporal and spatial vari-ations in the seasonal patterns of CO2 flux in boreal, temperate,and tropical forests in East Asia, Agr. For. Meteorol., 148, 700–713, 2008.
Saunders, M., Tobin, B., Black, K., Niewuenhuis, M., and Osborne,B.: Thinning effects on the net ecosystem carbon exchange of aSitka spruce forest are temperature-dependent, Agr. Forest Me-teorol., 157, 1–10, 2012.
Schlich, W.: Working plan for the Alice Holt Forest, His Majesty’sStationery Office, London, 1905.
Schwalm, C. R., Black, T. A., Amiro, B. D., Arain, M. A., Barr, A.G., Bourque, C. P.-A., Dunn, A. L., Flanagan, L. B., Giasson, M.-A., Lafleur, P. M., Margolis, H. A., McCaughey, J. H., Orchan-sky, A. L., and Wofsy, S. C.: Photosynthetic light use efficiencyof three biomes across an east–west continental-scale transect inCanada, Agr. Forest Meteorol. 140, 269–286, 2006.
Sykes, J. M. and Lane, A. M. J. (Eds.): The UK EnvironmentalChange Network: Protocols for standard measurements at terres-trial sites, The Stationery Office, London, 1996.
Teklemariam, T., Staebler, R. M., and Barr, A. G.: Eight years ofcarbon dioxide exchange above a mixed forest at Borden, On-tario, Agr. Forest Meteorol., 149, 2040–2053, 2009.
Thomas, M. V., Malhi, Y., Fenn, K. M., Fisher, J. B., More-croft, M. D., Lloyd, C. R., Taylor, M. E., and McNeil, D. D.:Carbon dioxide fluxes over an ancient broadleaved deciduouswoodland in southern England, Biogeosciences, 8, 1595–1613,doi:10.5194/bg-8-1595-2011, 2011.
Unger, S., Maguas, C., Pereira, J. S., Aires, L. M., David, T. S., andWerner, C.: Partitioning carbon fluxes in a Mediterranean oakforest to disentangle changes in ecosystem sink strength duringdrought, Agr. Forest Meteorol., 149, 949–961, 2009.
Urbanski, S., Barford, C., Wofsy, S., Kucharik, C., Pyle, E., Budney,J., McKain, K., Fitzjarrald, D., Czikowsky, M., and Munger, J.W.: Factors controlling CO2 exchange on timescales from hourlyto decadal at Harvard forest, J. Geophys. Res., 112, GO2020,doi:10.1029/2006JG000293, 2007.
Valentini, R., Matteucci, G., Dolman, A. J, Schulze. E.-D., Reb-mann, C., Moors, E. J., Granier, A., Gross, P., Jensen, N. O.,Pilegaard, K., Lindroth, A., Grelle, A., Bernhofer, C., Grunwald,T., Aubinet, M., Ceulemans, R., Kowalski, A. S., Vesala, T., Ran-nik, U., Berbigier, P., Loustau, D., Guðmundsson, J., Thorgeirs-son, H., Ibrom, A., Morgenstern K., Clement, R., Moncrieff, J.,Montagnani, L., Minerbi, S., and Jarvis, P. G.: Respiration as themain determinant of European forests carbon balance, Nature,404, 861–865, 2000.
Van der Molen, M. K., Gash, J. H. C., and Elbers, J. A.: Sonicanemometer (co)sine responses and flux measurements: II. Theeffect of introducing an angle of attack dependant calibration,Agr. Forest Meteorol., 122, 95–109, 2004.
www.biogeosciences.net/9/5373/2012/ Biogeosciences, 9, 5373–5389, 2012