Embed Size (px)
Citation preview

Sage 300 ERP (formerly Sage ERP Accpac) Intelligence Reporting empowers you to quickly and easily gain control and obtain the information you need from across your business. Using familiar Microsoft Excel®, you are able to gather and analyze data from across your entire business. Multiple data sources can effortlessly be pulled together to create real-time, automated, and preformatted reports with up-to-date, accurate, and meaningful information. Intelligence Reporting allows you to spend more time focusing on analysis and interpretation and less time pulling the data together.
In total, Intelligence Reporting ships with 12 predefined report templates to get you up and running immediately. All standard report templates can be copied and/or modified according to your unique business needs.
Report Name Description Business Benefits
Dashboard Analysis The Dashboard Analysis report template contains a one-page summary of key performance indicators (KPIs) featuring a financial analysis and “Top 5” reporting on customers, items, and expenses.
It contains both text and graphics to help with daily and long-term planning. In addition, comparative profit and loss figures are displayed for both the current month and year-to-date figures from the start of the current financial year.
This report allows you to easily drill down to get further insights into the data.
Real-time
Provides a real-time overview of the overall health of the business at a glance.
Consolidation of data
Delivers critical information in one place to help key stakeholders make better, faster, and smarter decisions.
Ease of use
Can be generated at the click of a button— no copying, cutting, and pasting of data from different sources.
Ready for distribution
It can be scheduled, published to the web, and shared through email to relevant people in the organization—putting critical information at their fingertips, thus improving collaboration and productivity.
Flexible
Customizable to suit your unique business requirements, providing access to real-time information, even across multiple companies, divisions, and databases, to improve business insight.
Intelligence Reporting Standard Reports

2
Sage 300 ERP I Intelligence Reporting Standard Reports
Report Name Description Business Benefit
Sales Master Displays pertinent sales information including sales quantities, costs, and gross profits by customer and item. This report is run for a chosen date range and displays quantity sold, cost of goods sold, discount amount, gross profit amount, and gross profit percentage by customer and item.
Similar to other reports, additional elements can be added to the Microsoft® Excel PivotTable® for further manipulation and analysis.
Comprehensive
All your sales reporting requirements solved within one report.
Flexible
Users have the flexibility to group required data. The layouts can be dynamically changed on the fly in Excel to view the same data in different ways, including graphically in trend charts, pie charts, bar graphs, and so on. These different views can then be saved for reuse.
Powerful and simple
Allows for comparative analysis using drag-and-drop functionality in PivotTables. For example, comparing sales regions side by side or analyzing sales performance by sales representative.
Time saving
Gives time back to the sales team by allowing them to access this report on demand and get up-to-date information immediately instead of relying on IT or spending time collating and updating reports in Excel. Allows the sales team to analyze buying behaviors, identify up- and cross-sell opportunities, and spend more time chasing prospects.

3
Sage 300 ERP I Intelligence Reporting Standard Reports
Report Name Description Business Benefit
Purchase Master This report is run for a chosen date range and displays quantities purchased and total unit cost, by vendor and item.
The report can easily be filtered by category, location, period, and item code, or additional fields can be dragged and dropped into the report, using standard PivotTable functionality for further analysis.
Comprehensive
All your purchasing reporting requirements solved within one report.
Powerful and simple
Allows for comparative analysis using drag-and-drop functionality in PivotTables. For example, comparing warehouses, divisions, and product lines side by side for detailed or summarized analysis.
Helps to identify vendors with whom volume discounts or faster delivery times can potentially be negotiated.
Flexible
Users have the flexibility to group data that is appropriate for their requirements. The layouts can be dynamically changed on the fly in Excel to view the same data in different ways, including graphically in trend charts, pie charts, bar graphs, and so on. These different views can then be saved for reuse.
Fully customizable
• Add additional elements to the PivotTable for further manipulation and analysis.
• Easily create top “N” views (for example, top five vendors or graphical views of your data using standard Excel graphs or Pivot Charts).

4
Sage 300 ERP I Intelligence Reporting Standard Reports
Report Name Description Business Benefit
Financial Report and Consolidated Financial Report
Powerful Financial Report and Consolidated Financial Report templates are available out of the box, offering 14 different report layouts to generate comparative balance sheets and/or income statements for any specified financial year, period, quarter, and budget.
The layouts are automatically generated, grouped, and subtotaled by Sage 300 ERP account group. It is possible to drill down to the general ledger (GL) transaction details for any of these accounts. The Consolidated Financial Report supports multicompany consolidations.
The report layouts are neatly presented and readily customizable in Excel, allowing users the ability to insert their own rows and columns, add their own formulas, customize account groupings, and format their layouts exactly as they wish to see them. These customizations can be saved for future use.
Income statement—current month and YTD
Displays balances per GL account number per financial period for the current financial year, previous year, and current budget year.
Time saving
Saves bookkeepers and accountants hours of manual manipulation each month by automating the month-end financial reporting processes.
Enables faster, fact-based decision making based on the business essentials of cash flow, profitability, and growth.
Allows for:
• Real-time analysis of expenses and major streams of operating revenues of the company.
• An up-to-date, automated snapshot of a company’s assets, liabilities, and shareholders’ equity in a presentable format, at any time, without the need for time-consuming manipulation of data in Excel.
Accuracy
Real-time data drawn directly from the source eliminates human error and provides information in the familiar face of Excel, which is trusted, secure, and up to date.
Ease of use
Allows accountants to prepare financial statements for government compliance or bank loans easily. The financial information required is now in one place, and accountants can easily customize the templates without a report consultant to present the reports in a professional manner.
Flexible
Provides flexibility to business owners and/or managers by offering different views of the data, depending on how they wish to have it presented or what they need to analyze. Comparative balance sheets and/or income statements can be generated for any specified financial year, period, quarter, and budget.
6561 Irvine Center Drive I Irvine, California 92618 I 866-530-7243 I www.Sage300ERP.com
©2012 Sage Software, Inc. All rights reserved. Sage, the Sage logos, and the Sage product and service names mentioned herein are registered trademarks or trademarks of Sage Software, Inc., or its affiliated entities. All other trademarks are the property of their respective owners. 300_IR_REP 06/12
Sage 300 ERP I Intelligence Reporting Standard Reports
Report Name Description Business Benefit
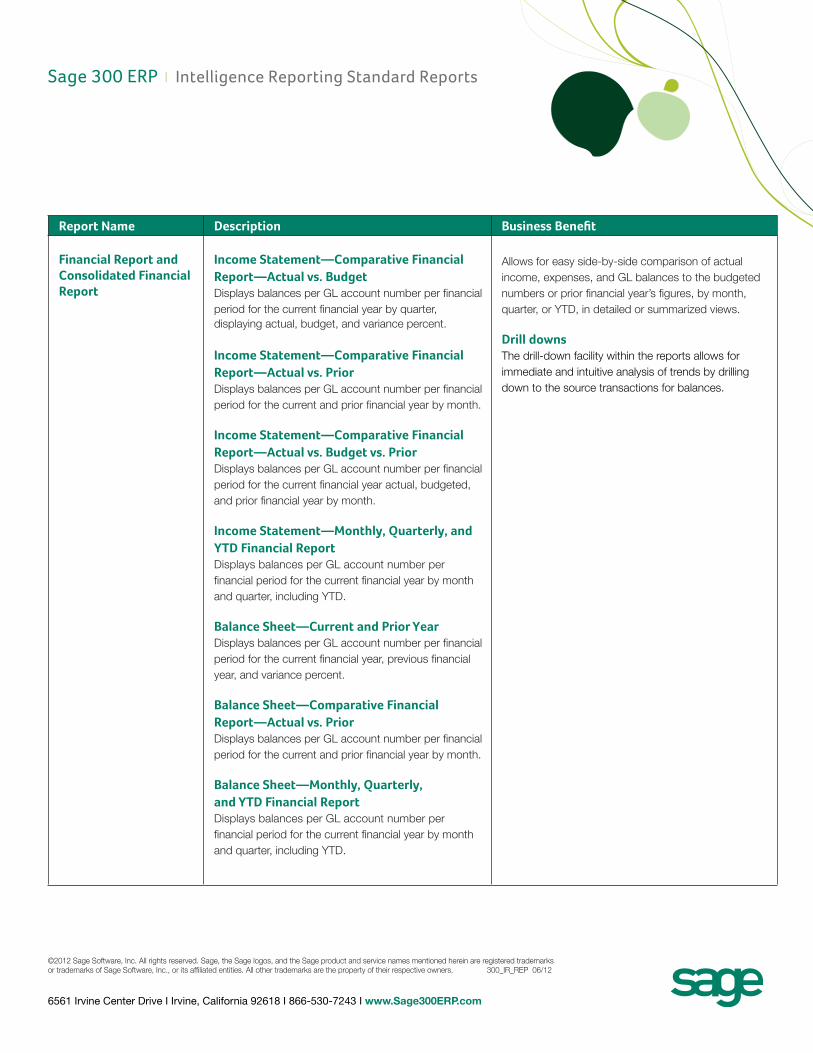
Financial Report and Consolidated Financial Report
Income Statement—Comparative Financial Report—Actual vs. Budget Displays balances per GL account number per financial period for the current financial year by quarter, displaying actual, budget, and variance percent.
Income Statement—Comparative Financial Report—Actual vs. Prior Displays balances per GL account number per financial period for the current and prior financial year by month.
Income Statement—Comparative Financial Report—Actual vs. Budget vs. PriorDisplays balances per GL account number per financial period for the current financial year actual, budgeted, and prior financial year by month.
Income Statement—Monthly, Quarterly, and YTD Financial ReportDisplays balances per GL account number per financial period for the current financial year by month and quarter, including YTD.
Balance Sheet—Current and Prior YearDisplays balances per GL account number per financial period for the current financial year, previous financial year, and variance percent.
Balance Sheet—Comparative Financial Report—Actual vs. Prior Displays balances per GL account number per financial period for the current and prior financial year by month.
Balance Sheet—Monthly, Quarterly, and YTD Financial ReportDisplays balances per GL account number per financial period for the current financial year by month and quarter, including YTD.
Allows for easy side-by-side comparison of actual income, expenses, and GL balances to the budgeted numbers or prior financial year’s figures, by month, quarter, or YTD, in detailed or summarized views.
Drill downsThe drill-down facility within the reports allows for immediate and intuitive analysis of trends by drilling down to the source transactions for balances.