Embed Size (px)
Citation preview

Report Manager User Guide Version 1 April 2012
Sage Intelligence –
Financial Reporting for
Sage ERP X3
Report Manager User Guide

2 Report Manager User Guide Version 1 April 2012
The software described in this document is protected by copyright,
And may not be copied on any medium except as specifically authorized in the license or
Non‐disclosure agreement.
This document is also protected by copyright, and may not be reproduced or transmitted,
In whole or in part, by any means, including photocopying, facsimile transmission, or
Reduction to any electronic medium or machine‐readable form, without the express
Written consent of Sage Software Inc.
© 2012 Sage Software, Inc. All rights reserved.
The Sage Software logo and the Sage Software product and service names mentioned
herein are registered trademarks or trademarks of Sage Software, Inc. or its affiliated
entities. Adobe and Adobe are registered trademarks of Adobe Systems, Incorporate.
Microsoft, the Microsoft logo, MS, MSDOS, FRx, Microsoft Excel, Windows and
Windows NT are trademarks of Microsoft Corporation. Other product names are
trademarks or registered trademarks of their respective owners

3 Report Manager User Guide Version 1 April 2012
Standard Reports Available ................................................................................................................................ 5
The Structure of Standard Reports .................................................................................................................. 11
Report Manager ............................................................................................................................................... 12
Running Reports ........................................................................................................................................... 12
Excel ................................................................................................................................................................. 15
Using the BI Tools Tab in Excel ..................................................................................................................... 17
The Report Designer Interface Explained ........................................................................................................ 20
Load Layout Interface ................................................................................................................................... 20
Layout Designer Interface ............................................................................................................................ 21
Calculated Fields ........................................................................................................................................... 27
Formula Builder ............................................................................................................................................ 28
Report Filter ..................................................................................................................................................... 30
Reporting Trees ................................................................................................................................................ 32
Reporting Unit Structures ............................................................................................................................ 33
Parent Child Relationships ........................................................................................................................... 34
Account Filters .............................................................................................................................................. 35
Managing Reporting Trees ........................................................................................................................... 37
Creating a New Reporting Tree .................................................................................................................... 38
Editing Reporting Trees ................................................................................................................................ 41
Distribution ...................................................................................................................................................... 42
Distribution Settings ..................................................................................................................................... 43
Manage Instructions ........................................................................................................................................ 44
Accessing Distribution Instructions .............................................................................................................. 44
Add Distribution Instructions ....................................................................................................................... 45
Add Email Distribution Instruction ................................................................................................................... 47
Adding Cell References to the Body of an Email Message ........................................................................... 48
Adding Cell References to Email Headers .................................................................................................... 50
Add File Publish Instruction .......................................................................................................................... 52
Add FTP Instruction ...................................................................................................................................... 53
Edit Distribution Instructions ........................................................................................................................... 54
Select Instructions ........................................................................................................................................ 55
Automated Distribution ................................................................................................................................... 57
Send Now ..................................................................................................................................................... 58
Copying, Pasting and Renaming Reports ......................................................................................................... 59

4 Report Manager User Guide Version 1 April 2012
To create a new report from an existing report ........................................................................................... 59
Creating and Linking a Report .......................................................................................................................... 60
Exporting and Importing Reports..................................................................................................................... 61
Additional Resources for Sage Intelligence – Financial Reporting for Sage ERP X3 ........................................ 65

5 Report Manager User Guide Version 1 April 2012
Standard Reports Available
Sage Intelligence – Financial Reporting for Sage ERP X3 ships with 3 Excel‐based out‐of‐the‐box reports
(Financial Report, Analytical Budget Report, and Analytical Report) that cover both the standard financial
statement requirements and analytical reporting requirements for more specific financial analysis. All these
reports ship with predefined drill down reports that allow users to drill into detailed transactions from
within the familiar environment of Excel.
Although Sage Intelligence – Financial Reporting for Sage ERP X3 provides out‐of‐the‐box reports for the
General Ledger only, the solution can access all fields, tables, views and stored procedures in Sage ERP X3,
allowing you to create your own Excel based reports from all other Sage ERP X3 modules.
Financial Report – This report is used to produce financial layouts for any ledger type where no
dimension information is required. This report delivers 2 years of financial balances directly from your Sage
ERP X3 General Ledger, and ships with 6 predefined layouts to get you up and running immediately.
The layouts provided include:
• Income Statement – Actual vs. Budget vs. Prior month on month layout
• Income Statement – Actual vs. Budget month on month layout
• Income Statement – Actual vs. Prior month on month layout
• Income Statement – Actual vs. Prior current month layout
• Balance Sheet – Actual vs. Prior month on month layout
• Trial Balance – Actual vs. Prior layout
All standard layouts can be edited, allowing you to cater for your own specific financial requirements and
presentation style.
The Financial Report covers the following:
• Multiple Companies
• Multiple Sites
• Drill down to detailed ledger transactions from within Excel
• Budgets – One Budget Set and Budget Version at a time
• Any Ledger Type
• Report in Ledger Currency or Source Currency
• Report in a selected Currency and Rate of Exchange (ROE)
Analytical Budget Report – This report is used to produce financial layouts for any ledger type where
information per dimension is required with a comparison to budgets (3 dimensions only based on
relationship to budgets as per core Sage ERP X3 functionality). The report delivers 2 years of financial
balances directly from your Sage ERP X3 General Ledger for Income Statement accounts only, and ships
with 5 predefined layouts to get you up and running immediately. The layouts provided include:
• Income Statement – Actual vs. Budget vs. Prior month on month layout
• Income Statement – Actual vs. Budget vs. Prior layout, column grouped by site

6 Report Manager User Guide Version 1 April 2012
• Income Statement – Actual vs. Budget month on month layout
• Income Statement – Actual vs. Prior month on month layout
• Income Statement – Actual vs. Prior current month layout
All standard layouts can be edited, allowing you to cater for your own specific financial requirements and
presentation style.
Analytical Report - The Analytical Report is used to produce financial reports for any ledger type where
information per dimension (any of the 9 dimensions) is required. This report delivers 2 years of financial
balances directly from your Sage ERP X3 General Ledger for Income Statement accounts only, and ships
with 3 predefined layouts to get you up and running immediately. The layouts provided include:
• Income Statement – Actual vs. Prior layout, column grouped by site
• Income Statement – Actual vs. Prior month on month layout
• Income Statement – Actual vs. Prior current month layout
All standard layouts can be edited, allowing you to cater for your own specific financial requirements and
presentation style.
Financial Report – The figure below illustrates one of the standard out the box layouts generated into
Excel i.e. Actual vs. Prior with Variance for the current period and year to date

7 Report Manager User Guide Version 1 April 2012
Launching the Report Manager
1. Select the Start button> All Programs > Sage Intelligence – Financial Reporting for
Sage ERP X3>Report Manager.
2. Enter the server, database details and the username and password that were created
in SQL Server.
3. Tick the Remember Database Credentials box.

8 Report Manager User Guide Version 1 April 2012
NOTE: You will need to change the Report Repository folder in the Report Manager
so it points to the new Report Repository folder that was created earlier in the
installation guide.
4. Select the Report Repository tab.
5. The Repository Path box will open. Click the button to find the Report Repository
folder path you created. Alternatively type in the name of the Report Repository folder
path location.

9 Report Manager User Guide Version 1 April 2012
6. The location of the new Repository Folder path appears. Click the OK button.
7. Click the to return the Sage Intelligence – Financial Reporting for Sage ERP X3
Database Details tab. Click the OK button.

10 Report Manager User Guide Version 1 April 2012
8. The Sage ERP X3 Intelligence splash screen will load up & the Report Manager screen
will open.

11 Report Manager User Guide Version 1 April 2012
The Structure of Standard Reports
Standard Reports created in Sage Intelligence have a structure which is critical to understanding the
reporting process. There are three entities to a standard report – the data container, the report, and the
Microsoft Excel template. Below is a graphic that can help to visualize this concept:
Data Container
A Data Container is simply a set of data which is made available (published) by the Connector, which allows
users access to the data using the Report Manager interface. The container defines what data you have
made available for reporting from the database, (metadata). Sage Intelligence comes with various
containers providing access to information within X3, such as GL Transactions, among others. The data
container for a report is found in the Connector. If you are in the Report Manager module you are able to
see what container a report is using by expanding the details of a report and observing the Source
Container. In addition, on the Properties section of the window, the exact container name is found,
including its unique container ID. (The container ID is used to identify the exact container in situations
where multiple containers use the exact same name.)
Report
The report defines fields, filters, and parameters, as well as sort and summation criteria. The report name
is listed in the appropriate folder in Report Manager, and can be modified as required.
Microsoft® Excel® Template
The Excel template is an Excel workbook formatted for easier reporting, often containing pivot tables and
other formatting to make data analysis easier. The Excel workbook is linked to a report which defines how
you want the data displayed. The template is stored in a folder as indicated in the properties of the report,
and its name is typically similar to the report name, though it can be different, and is also identified in the
properties of the report. Each report is attached to one template; however, the same template can be
attached to more than one report.

12 Report Manager User Guide Version 1 April 2012
Report Manager
Running Reports 1. Double click on each of the folders to reveal the reports within each folder.
2. Right click on a report and select Run.
3. The Enter Report Parameters screen will open. Enter the parameters in each box and
press the OK button. Use the button to retrieve and select values for each box if
unsure of what values to enter.

13 Report Manager User Guide Version 1 April 2012
4. The Data Out progress box will appear.

14 Report Manager User Guide Version 1 April 2012
Mapping
1. Please note if you have unmapped accounts the mapping tool will open.
2. The Mapping Tool allows you to map Categories into predefined Reporting Groups that are used
by the default financial layouts. The mappings and groupings performed here are saved within a
grouping field in the first worksheet of your Microsoft Excel Workbook, named PrimaryGrouping,
which can be used within Report Designer layouts. If you do not require the default report designer
layouts to work correctly and intend to group your report’s rows using other grouping fields
relevant to your company, this step can be skipped (cancelled) but will require you to build some
Row Groupings manually. Users also have the ability to add their own new reporting groups and
deleting existing reporting groups.
3. Once you have mapped your accounts. Select OK. The source data will be rendered into Excel.

15 Report Manager User Guide Version 1 April 2012
Excel
1. You can now use the Report Designer to generate a standard report layout.
2. To generate a report, simply select Quick Generate from the BI Tools Tab, and a drop down menu
will appear. Select the report layout you wish to generate.
3. Alternatively you can Launch the Report Designer from the BI Tools Tab and choose to Load a
report layout.
4. Your selected layout will be generated onto a new sheet in the Excel workbook. E.g. Income
Statement

16 Report Manager User Guide Version 1 April 2012
5. When you run the financial report it automatically pulls through 2 years of data, so you can report
against prior and current year. One of the greatest functionalities of the financial reports is the
ability to dynamically change the reporting month. (See Using BI Tools Tab)
Drill Down
1. You also have the ability to drill down into the detailed transactions by executing a report definition
as an ad‐hoc data inquiry. The drill down interrogates the Sage ERP X3 database directly from
within the Excel Report. The drill down period is selected when the report date is changed using
the Change Month function as discussed previously.
2. Right Select on the GL account number you wish to drill down on, although any reference to the
Lookup sheet will suffice. Note that a subtotal field does not allow drill down.
3. An additional window appears, as shown below, and you click Execute to run the drill down.
4. The transactions open in a separate window, revealing the detailed transactions for the account
selected.
5. From this window, the data can be sent to Excel, by selecting the option in the top left corner of
the window, as shown above.
6. To close the Drill Down, simply close the window.

17 Report Manager User Guide Version 1 April 2012
Using the BI Tools Tab in Excel The BI Tools tab provides access to various tools helpful in using the Report Designer.
Launch
Opens the Report Designer Launch window
Refresh Data
This is especially useful when new accounts are added IN Sage ERP X3, and you have created and linked a
layout. By selecting Refresh Data, the new accounts are added, or deleted accounts are removed, in the
layout currently selected, if you have created and linked the template. Selecting Refresh Data is not
required for newly‐generated layouts, as this already includes the latest information.
NOTE: The Refresh Data button does not retrieve data from your accounting system; instead, it
retrieves data from the raw data sheet and places it into the appropriate place in the selected
layout.

18 Report Manager User Guide Version 1 April 2012
Change Period
Allows you to filter the months and bring through the data for a specified month. The report pulls through
2 years of financial data so you are able to utilize 2 years of information.
What If Analyzer
This will open the What If Analyzer window which allows you to dynamically change amounts in your
spreadsheet, to assist in forecasting/budgeting or creating projections.
Simply slide the bar for an entire row (under Revenue, for example) or for a specific period for a specific
row (Jan 12 Actual for Revenue) in 5% increments. By using the What If Analyzer, all formulas are
automatically updated, providing easy analysis of changing financial conditions.
Mapping Tool
The Mapping Tool allows you to map Categories into predefined Reporting Groups that are used by the
default financial layouts.
The mappings and groupings performed here are saved within a grouping field in the first worksheet of
your Microsoft Excel Workbook, named PrimaryGrouping, which can be used within Report Designer
layouts. If you do not require the default report designer layouts to work correctly and intend to group
your report’s rows using other grouping fields relevant to your company, this step can be skipped
(cancelled) but will require you to build some Row Groupings manually.

19 Report Manager User Guide Version 1 April 2012
Reporting Trees
Opens the reporting trees window, and allows you to add and manage your reporting trees. **For more
information see the section on Reporting Trees**
Quick Generate
This is a drop down menu of all the report layouts previously saved. Instead of selecting the Launch button
to run a report, you can simply run them from the Quick Generate menu.
Quick Edit
This allows you to quickly edit a report without having to open the Report Designer from the Launch menu.
Send Now **for more information see the section on Distribution**
Once the distribution instructions have been selected for a report, you can execute the instructions by
selecting the Send Now button.
Select Instructions
Once the distribution instructions have been set up, the instructions need to be linked to the report, and
the worksheets which the instructions must apply to, need to be selected.
Manage Instructions
Distribution Instructions save time by sending reports, along with pertinent information, automatically to
the right person/people using the chosen electronic method. Use the Manage Distribution
Instructions to set up different instructions for each report that requires a unique distribution method,
i.e. distributed to different people or via different methods e.g., Email, FTP or Saved to a folder
Distribution Settings
Email is the most popular distribution channel. By default, your Microsoft Outlook profile settings will be
used by Sage Intelligence to send emailed reports automatically, however, if this is not preferable or you do
not have Microsoft Outlook installed, an Exchange or SMTP Server may be specified. These details will
have to be obtained by your network administrator. The SMTP / Exchange Server option is recommended
for an unattended distribution as the Use My Outlook Profile option requires Outlook to be open at the
time of distribution.

20 Report Manager User Guide Version 1 April 2012
The Report Designer Interface Explained
1. From the launch button you can choose to create a New Layout, Load an existing layout or Exit.
� New Layout option will allow you to create a report from scratch.
� Load Layout would bring up existing report layouts that ship with the Report Designer.
� Exit will close down the Sage Intelligence Report Designer main screen.
Load Layout Interface
1. The Load Layout interface will display the existing report layouts that ship with the Report Designer
and any new layouts that you have created.
2. From here you can select a layout and choose to edit, copy, delete or generate the layout.
� Edit – will allow you to edit the existing layout.
� Copy – will make an exact copy of an existing layout, you can then rename this copy.
� Delete – will remove the report layout from the menu.
� Generate – this will run the report layout selected.

21 Report Manager User Guide Version 1 April 2012
Layout Designer Interface
Text Columns
This interface allows you to create layouts from scratch or edit existing report layouts.
• Text columns
(What level of detail do you want to view in your layout?)
1. Text Columns ‐ Select fields here that you want to see at the most detailed level on your report.
For example AccountNumber and AccountName, depending on which accounting package you are
using.
2. To add fields to the Text Columns area select the field from the fields in the Text Columns Tab.
3. To remove a field from the Text Columns area, right click on the field in the Text Columns area.

22 Report Manager User Guide Version 1 April 2012
Row Area
(What information do you want to see down the left hand side of the layout?)
1. Before you can add rows into the Row area you need to select a Primary Row to Group by. The
Primary Row Grouping is mandatory. An example of a primary row grouping is Financial Category,
GLCategoryDescription, Account Group, Main Account. Again this will differ for the Accounting or
ERP application you are using.
2. You can add a further 2 levels of grouping to the row area if required. In total there are 3 levels of
grouping available in the row area.
3. You can now add your fields from the Rows Tab into the Rows area. For example: Sales, Cost of
Sales, Income, Expenses. Or you can pull fields through from standard calculated row fields such as
Gross Profit, Gross Profit %. These standard calculated fields will ship with the Report Designer
layouts but you are able to edit, add new or delete calculated fields.
4. Add Spacer button simply adds a space between fields in the row area. Spacers can be dragged and
moved to neaten your report layout when delivered in excel.
5. Clear All buttons will clear all the Row fields from the Row area.
Toggle Switch
When you generate a pre‐defined layout, you will notice that certain fields in the row groupings have
their signs switched, in particular, revenue accounts which are stored as negative values in the
underlying data. It does not make sense to present these in a statement as negative figured which is
why the sign is switched to a positive.

23 Report Manager User Guide Version 1 April 2012
In the situation where you delete the primary row grouping and replace it with a new one of your
choice, the Designer has no way of telling what fields you are going to include within the newly
selected primary row grouping, so by default the field’s sign status will be the same as that in the
underlying data – for revenue accounts this will be negative values. You have the option to switch the
sign of any of these fields that you include in the primary row grouping. You do this by right clicking on
the button of the field that you want to change the sign of...And clicking on the Toggle Switch Sign
popup. This will then switch the sign of this field from its default value in the underlying data. If it is
negative, it will become positive, and vice versa.

24 Report Manager User Guide Version 1 April 2012
Column Area
(What information do you want across the top of your layout?)
1. Columns Area: you can add fields by selecting the Columns Tab and clicking on the required fields.
For Example, Actual Jan, Actual Feb, Actual March. (Period 1, Period , Period 3) Or you can add
standard calculated fields, such as Actual Quarter 1, Actual Quarter 2.
2. You can add further grouping in the Column section if required. For example Company Name,
Segments, Branch, Department. There is one level of grouping available across the top of the
report.
3. Add Spacer button simply adds a space between fields in the column area. Spacers can be dragged
and moved to neaten your report layout. Clear all buttons will clear all the Column fields from the
column area.
4. Another option for adding fields to the Column area is to use the Auto or Quarters buttons.

25 Report Manager User Guide Version 1 April 2012
Auto Button
The auto selection button allows you to quickly create a layout, without having to drag individual fields into
the column area.
Actual button will automatically add 12 months current figures to the column area, and bring in the
spacers.
For example: If you tick Actual and Budget , then click on Actual , then set your Primary Row Grouping field
which is the highest level that you would like to group accounts by. (Often the Account Category
Description field) the following layout in the column area and Excel worksheet will be displayed. Select the
Rows and Text Fields you would like to see, you will then very quickly have the Actual Figures interlaced
with the Budget figures for 12 months of the year.
Layout in the Report Designer Layout Designer
Layout in the Excel Workbook

26 Report Manager User Guide Version 1 April 2012
Quarters Button
The Quarters Selection allows you to add quarters and half year figures automatically.
For example if you want to see your 1st half actual/ current figures versus what you have budgeted for the
2nd half of the year. You simply click the 1st half button in the Actual section and then click the 2nd half
button in the Budget section, then set your Primary Row Grouping field which is the highest level that you
would like to group accounts by. (Often the Account Category Description field) Finally select your rows and
text columns you would like to view.

27 Report Manager User Guide Version 1 April 2012
Calculated Fields
Standard calculated fields will ship with the standard Report Designer report layouts, but calculated fields
can be added, edited or deleted. Simply select a calculated field and right click.
The option to add New Formula, Edit Formula or Delete Formula will come up.
• If you choose New Formula or Edit Formula the formula builder will open.
• You can go ahead and create your own calculated fields using the standard and function items that
exist in the formula builder.

28 Report Manager User Guide Version 1 April 2012
Formula Builder If you need to edit, add or delete calculated fields, you need to open the formula builder.
• Clear All button – clears all fields from the My Formula area
• Standard Items – these are standard items that have been created and any new items you create
will appear here.
• Function Items – includes your addition, subtraction, multiply, divide and other functions.
• Scroll bar – scrolls between all the saved standard items.
• Add Value button – allows you to add a value in the formula you create. For example calculating
GP%. You would need to include a value to build this formula ( GP/Sales)*100
• Save – will save the formula you create. You will then need to name this formula? The formula will
be saved and will appear as a button in the calculated field’s area of your Report Designer Layout
Interface.
• The IS Percentage check box will convert to a % if required.
• The IS Variance Check box will change signs of variances figures as per accounting practices. (see
below for more detail)
• Cancel ‐ will close the formula builder.

29 Report Manager User Guide Version 1 April 2012
See example below: Actual Mar + Actual April + Actual May = Actual Quarter 1
How does the variance button work in the formula builder?
• The variance button caters for standard accounting calculations. The Variance calculation is based
on the Account Type.
Variance Button Explained
• If you did $100 worth of Sales and your budget is $50 then the Variance is $50 and is a positive
value.
• If your Cost of sales is $100 and your budget is $50 then the Variance is $50 and is calculated as
positive, but should in fact be negative as you are $50 over budget.
• The IS Variance calculation button caters for this. The variance calculation is based on account type
Actual Budget Variance
Sales 100 50 50
Cost of Sales 100 50 50
When IS Variance is checked. The sign control is taken care of and delivers the correct result
Actual Budget Variance
Sales 100 50 50
Cost of Sales 100 50 -50

30 Report Manager User Guide Version 1 April 2012
Report Filter
The Report Filter is like a Page Field on a pivot table.
It creates a drop down on the layout that allows one to view different filters on the data. The report filter
allows you to select a field from the source data that you assign to a page (or filter) orientation in the
layout designer. For example, Year could be used for a report filter. You can use the Year field to display
summarized data for only 2010, only 2011, and so on. Another example of a Report Filter could be
Company Name.

31 Report Manager User Guide Version 1 April 2012
Please Note: If you select a Report Filter, for example: Company Name. When you generate the report into
Excel the default report will include all the Companies information, (Company ABC, Company DEF and
Company MNO), you can then select to view 1 company at a time. The functionality at this stage does not
allow to Select Multiple Items.

32 Report Manager User Guide Version 1 April 2012
Reporting Trees
Although you can create financial reports without the aid of a reporting tree, the reporting tree allows you
to model a very sophisticated reporting structure and view your organization in many different ways with
the click of a button. Some companies may have very complex corporate hierarchies that require hundreds
of tree units, as well as other hierarchies that require much fewer tree units.
Most organizations have a hierarchical structure in which departments (or other business units) report to
one or more higher‐level units. In a traditional organizational chart, the lower units on the chart typically
report to increasingly higher units.
Sage Intelligence uses the term reporting unit for each box in an organizational chart. A reporting unit can
be an individual department from the general ledger, or it can be a higher‐level, summary unit that
combines information from other reporting units. For a Report Designer layout that includes a reporting
tree, one report is generated for each reporting unit and at the summary level. All of these reports use the
text columns, row and column layouts that are specified in the Report Designer.
Example:
Each reporting tree contains a group of reporting units. Sage Intelligence allows you to easily add or change
reporting units without requiring a change to your financial data.
33 Report Manager User Guide Version 1 April 2012
Reporting Unit Structures Sage Intelligence uses the following kinds of reporting units:
• A detail unit draws information directly from the financial data or from a Microsoft Excel
spreadsheet file.
• A summary unit summarizes data from lower‐level units.
A reporting tree consists of parent reporting units and child reporting units:
• A parent reporting unit is a summary unit that pulls summarized information from a detail unit. A
summary unit can be both a detail unit and a summary unit; that is, a summary unit can draw
information from a lower unit, the financial data, or an Excel spreadsheet. Thus, a parent unit can,
in turn, be the child unit of a higher parent unit.
• A child reporting unit can be either a detail unit that pulls information directly from the financial
data or a spreadsheet, or it can be an intermediate summary unit (that is, the parent unit to a
lower unit, but also the child unit to a higher‐level summary unit).
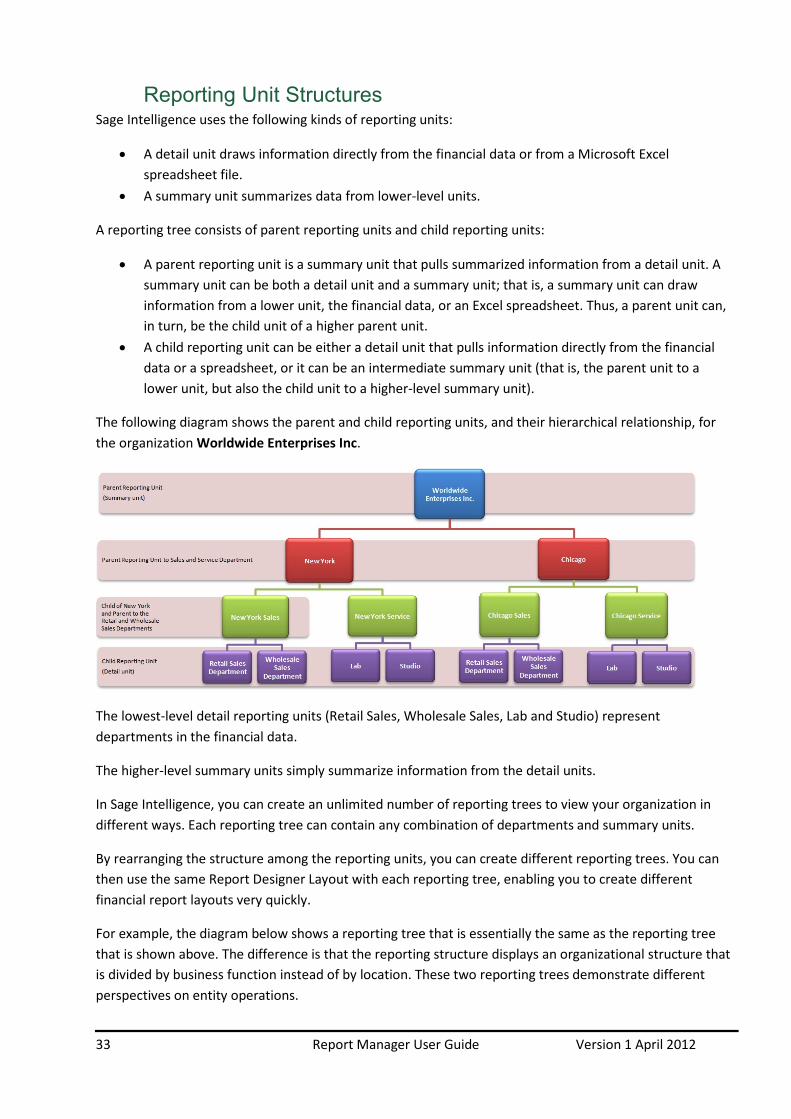
The following diagram shows the parent and child reporting units, and their hierarchical relationship, for
the organization Worldwide Enterprises Inc.
The lowest‐level detail reporting units (Retail Sales, Wholesale Sales, Lab and Studio) represent
departments in the financial data.
The higher‐level summary units simply summarize information from the detail units.
In Sage Intelligence, you can create an unlimited number of reporting trees to view your organization in
different ways. Each reporting tree can contain any combination of departments and summary units.
By rearranging the structure among the reporting units, you can create different reporting trees. You can
then use the same Report Designer Layout with each reporting tree, enabling you to create different
financial report layouts very quickly.
For example, the diagram below shows a reporting tree that is essentially the same as the reporting tree
that is shown above. The difference is that the reporting structure displays an organizational structure that
is divided by business function instead of by location. These two reporting trees demonstrate different
perspectives on entity operations.

34 Report Manager User Guide Version 1 April 2012
If you create several different reporting trees, you can print a series of financial statements each month
that analyze and present your entity's operations in various ways.
Parent Child Relationships The most common type of reporting tree is composed of parent units that pull summarized information
from the detail units and child units that contain detail units of account information. However, many
detail/summary hierarchy combinations can be created. A child unit can be both a child to the higher unit
as well as a parent to a lower unit.
You can create this parent/child hierarchy structure by moving individual reporting units or an entire
branch (parent unit and all child units) to higher or lower levels on the graphical tree. This is called
promoting and demoting units. Promoting a unit moves it to a higher level in the tree. Demoting a unit
moves a unit to a lower level. When you build a reporting tree, you can promote and demote reporting
units using a drag‐and‐drop operation.

35 Report Manager User Guide Version 1 April 2012
Account Filters Most organizations use an account structure that separates business entities into different categories. A
fully qualified account contains a value for the natural segment e.g. Cash or Sales, as well as values for
additional segments, e.g. Location, Division and Department. The following figure demonstrates how the
natural segment and the identifying segments combine to form a fully qualified account number.
The distinction between the natural and identifying segment is critical to the successful use of the Report
Designer. Typically users specify the natural segment in a row definition and the identifying segment in a
reporting tree definition. When reports are generated, these values combine to pull specific financial
records from the source.
Reporting Trees support the use of special characters as a way to identify multiple segment values without
specifically naming each one.
Character Function
? Question Mark A placeholder for a single character in a segment.
In the above example, the value "1100-2???-100" will return all data with a segment
range between "1100‐2000‐100" to "1100‐2999‐100" which will be all retail sales
cash transactions from all branches with codes between 2000 and 2999.
* Asterisk A placeholder for one or more characters.
In the above example, the value "1100-2000-*" will return all data with a segment
range between "1100‐2000‐0" to "1100‐2000‐999" which will be all cash transactions
from all departments in New York.
OR Used to describe multiple segments.
In the above example, the value "1100-2000-100 OR 1100-2000-200" will return all
data with a segment of either 1100‐2000‐100 or a segment range of 1100‐2000‐200
which will be all retail sales cash transactions from New York branch or wholesale
sales cash transactions from New York (if 200 represented wholesale sales)
TO Used to describe a range of segments.
In the above example, the value "1100-1???-100? TO 1100-8???-100" will return all
data with a segment range from 1100‐2000‐100 to 1100‐8999‐100 which will be all
cash retail sales from all branches whose branch segments range from 1000 to 8999.

36 Report Manager User Guide Version 1 April 2012
Account Filter Examples
Depending on the size of the organization, fully qualified account number segments can have different
representations for different companies.
Example below:
In the above example to include all cash transactions, an account filter rule of 1100-????-??? would be
used.
An extra digit may even be added to further identify a segment:
In this example to include all cash transactions, an account filter rule of 1100-????-???? would be used.

37 Report Manager User Guide Version 1 April 2012
Managing Reporting Trees To manage Reporting Trees, do the following:
1. Run a Report Designer enabled report from the Sage Intelligence Report Manager.
2. In Microsoft Excel, select the BI Tools tab.
3. In the Report Designer group, click Reporting Trees.
4. From the Manage Reporting Trees window, you can now Add, Edit, Delete, Rename or Duplicate
your trees.

38 Report Manager User Guide Version 1 April 2012
Creating a New Reporting Tree Before you build any reporting trees, you will first need to determine the various reporting structures your
company will require. The best approach is to draw an organizational chart of your company. Use your
current general ledger departments as the lowest detail level. Add to these as many boxes as you need to
show higher‐level divisions or regions. Remember that each box represents a potential reporting unit in any
of your reporting trees.
To create a new reporting tree, do the following:
1. From the Manage Reporting Trees window, click Add.
2. Enter a name for your Reporting Tree and click OK.
3. In the right pane, each reporting unit will need to be added in a separate row with its relevant
account filter rule.

39 Report Manager User Guide Version 1 April 2012
4. The graphical tree on the left pane of the Reporting Tree Manager allows you to visualize the
relationship of parent/child unit hierarchy while the right pane displays each reporting unit in a
separate row with its relevant account filter. The Preview Pane will change dynamically to display
the results of the account filter for each reporting unit. Example below:
40 Report Manager User Guide Version 1 April 2012
5. An optional Company filter may be applied. This will further filter the reporting unit to apply only
to a specified company.
6. An optional distribution instruction may be added to each reporting unit. The distribution
instruction entered here will automatically be linked to the generated worksheet. This prevents
instructions from having to be selected and linked to each individual report. This will be covered in
more detail in the Advanced Report Writing course.
7. Using drag and drop functionality, you can arrange reporting units into parent/child hierarchies.
8. Click Apply to save and continue. Click OK to save and exit.

41 Report Manager User Guide Version 1 April 2012
Editing Reporting Trees 1. From the Manage Reporting Trees window, select the Reporting Tree you wish to edit and click the
Edit button.
2. Make the necessary changes. Click Apply to save and continue. Click OK to save and exit.
3. Using the same method as above but selecting the other buttons, you can also delete, rename or
duplicate your reporting trees.

42 Report Manager User Guide Version 1 April 2012
Distribution
Report distribution is a powerful feature that saves time and effort by allowing you to send reports
to a file, ftp site, or email in a number of standard formats.
Simply set up which reports you would like to distribute, whether you would like them in Microsoft
Excel, MHMTL or PDF and whom it should be sent to. You can even create custom criteria for
sending out reports.
Features include the ability to customize each email format, use your existing outlook profile and
address book, or specify a SMTP or Exchange server. The same report can be set up to be
distributed to different destinations.
Distribution is ideal for sending reports out to line managers or providing corporate management
with tailored reports.

43 Report Manager User Guide Version 1 April 2012
Distribution Settings
Email is the most popular distribution channel. By default, your Microsoft Outlook profile settings
will be used by Sage Intelligence to send emailed reports automatically, however, if this is not
preferable, or you do not have Microsoft Outlook installed, an Exchange or SMTP Server may be
specified. These details will have to be obtained by your network administrator.
The SMTP / Exchange Server option is recommended for an unattended distribution, as the Use
My Outlook Profile option requires Outlook to be open at the time of distribution.

44 Report Manager User Guide Version 1 April 2012
Manage Instructions
Accessing Distribution Instructions
Distribution Instructions save time by sending reports, along with pertinent information,
automatically to the right person/people using the chosen electronic method. Use the Manage
Distribution Instructions to set up different instructions for each report that requires a unique
distribution method, i.e. distributed to different people or via different methods e.g., Email, FTP, or
Saved to a folder.
Complete the following steps to Manage Distribution Instructions.
1. Run a report from the Sage Intelligence Report Manager to Microsoft Excel.
2. Click the BI Tools Tab.
3. Click Manage Instructions.
4. From the Manage Distribution Instructions window, you can now Add, Edit, Delete, or
Rename your Instructions.

45 Report Manager User Guide Version 1 April 2012
Add Distribution Instructions
Complete the following steps to add a Distribution Instruction.
1. From the Manage Distribution Instructions window, select Add.
2. Enter a Distribution Instruction Name.
3. You will be presented with a window that has three distribution methods, namely Email,
File Publish and FTP.

46 Report Manager User Guide Version 1 April 2012
4. By default, the methods are disabled. You may enable one or multiple options by selecting
the Enable box/es.

47 Report Manager User Guide Version 1 April 2012
Add Email Distribution Instruction
When the Enable Email box is selected, you will be able to fill in the email details.
To Add Email Distribution Instructions, do the following:
1. Enter the recipients' e‐mail addresses or names in the To, Cc, or Bcc box. Always
separate multiple recipients with a semicolon. To select from your outlook address
book, select the To, Cc or Bcc buttons and select the name/names. If you do not have
Microsoft Outlook installed, you will need to enter the recipients full email address.
� To... A message is sent to the recipients in the To box.
� Cc... A copy of the message is also sent to recipients in the Cc box.
� Bcc.. A copy of the message is also sent to recipients in the Bcc box;
however, it is a blind carbon copy so the names of the recipients in the
Bcc box are not visible to other recipients.
2. In the Subject box, type the subject of the message.
3. In the message body, you can type in the required text to accompany your report. You
may also use cell references to reference any data in your report. This is covered later
in this lesson. All of the standard formatting commands are also available from the
menu bar.
4. You will need to specify a file name for your report in the File Name box.
5. In the format box, select the format you would like the report to be emailed in.
6. You also have the option to distribute each worksheet as separate documents or leave
this option disabled to send worksheets in one workbook.
7. Click OK.

48 Report Manager User Guide Version 1 April 2012
Adding Cell References to the Body of an Email Message
A cell reference refers to a particular cell or range of cells in your worksheet. Cell references are
used to identify data for use in formulas to calculate results based on your data. From your Email
Distribution form, you can add cell references to the body or headers of your email message. For
example, you could reference the gross profit for the month.
To Manage Distribution Instructions, do the following:
1. Whilst in the Email Distribution Instruction, at the point where you would like to reference
the Excel cell reference click on the fx button.
2. The Select a Cell window will appear in Microsoft Excel.
3. Type the cell reference/s, or click on the cell/s you would like to add and you will notice
that its reference is automatically inserted into the window.
4. Click on the Expand Dialog box.
5. You will be returned to your email distribution instruction and you will notice that the cell
reference has been added to your message text.

49 Report Manager User Guide Version 1 April 2012
6. If you click on the Preview Cell References box, you will be able to see the text that would
be inserted for the report that is currently open in Microsoft Excel from cell F45 for this
example.
7. Note: You cannot edit the window whilst in Preview Cell References mode. To exit,
select the Preview Cell References box again.

50 Report Manager User Guide Version 1 April 2012
Adding Cell References to Email Headers
Cell References can also be added to the headers of your email message. For example, you could
email a particular person if a condition was true. E.g. in Microsoft Excel you could specify that if
the Sales Revenue was above a certain amount, then the sales manager would receive a
congratulatory email with the financial report.
Complete the following steps to add cell references to email headers.
1. In your Excel Report, add an IF formula in a blank cell, for this example we will add it into
cell N2,
=IF(B12>1000000,"[email protected]", ";")
where Cell B12 represents your Sales Revenue and [email protected] represents the
email address of the sales manager.
2. In the Manage Instructions, email message header, right‐click in the To... box, select Insert,
Cell Reference.
3. In Microsoft Excel, select cell N2.
4. Select the Expand Dialog box.

51 Report Manager User Guide Version 1 April 2012
5. In your Distribution Instruction, you will notice the cell reference has been inserted into the
To... box.
6. If you now select the Preview Cell References box, you will be able to see the value that
will be inserted if your Sales Revenue exceeds $1,000,000
7. If your sales revenue does not exceed $1,000,000 the email will not be sent to the sales
manager as your Preview Cell References To... Box will show you that the sales manager's
email will not be inserted.

52 Report Manager User Guide Version 1 April 2012
Add File Publish Instruction
In order to save a report to a specified location, the file publish option can be enabled.
Complete the following steps to add a File Publish Distribution Instructions.
1. Click the File Publish tab.
2. Select the Enable File Publish box.
3. Click the Browse button to locate the folder where you would like the reports saved to and
click OK.
4. Type in the file name you would like to save your report to, and select the format you
would like the report to be in.
5. For the Excel and MHMTL format, you will have the option to save each worksheet as
separate documents. Select the box to apply the option.
6. Click OK.

53 Report Manager User Guide Version 1 April 2012
Add FTP Instruction
In order to FTP a report to a specified location, the FTP option can be enabled.
Complete the following steps to add an FTP Distribution Instruction.
1. Select the FTP tab
2. Select the Enable FTP box.
3. The server information can be obtained from your IT administrator as well as the logon
information.
4. Specify a file name you would like the report to be saved to.
5. Specify the format you would like the report to be saved in.
6. For the Excel and MHMTL format, you will have the option to save each worksheet as
separate documents. Select the box to apply the option.
7. Click OK.

54 Report Manager User Guide Version 1 April 2012
Edit Distribution Instructions
To Edit Distribution Instructions, do the following:
1. In Microsoft Excel, click the BI Tools Tab.
2. Click Manage Instructions.
3. Select the Distribution Instruction you would like to edit.
4. Click Edit.
5. Make the necessary changes and click OK.

55 Report Manager User Guide Version 1 April 2012
Select Instructions
Once the distribution instructions have been set up, the instructions need to be linked to the
report, and the worksheets which the instructions must apply to, need to be selected.
To Select Distribution Instructions, do the following:
1. Run the relevant report from Sage Intelligence Report Manager.
2. In Microsoft Excel, click the BI Tools tab.
3. Click Select Instructions.
4. In the left pane, you will see all the instructions you have previously set up. In the right
pane is all the worksheets available in the current excel report you have run out from the
Sage Intelligence Report Manager.
5. Select the Instruction from the left that you would like to apply, and click the right arrow
button.

56 Report Manager User Guide Version 1 April 2012
6. Select the worksheets you would like to include in your distribution instruction.
7. If you would like to include an additional instruction, repeat from step 4.
8. If you would like any selected distribution instruction(s) to be executed when a report is
automatically scheduled via a scheduler command, refer to the next section.
9. Click OK.
•
NOTE: If you would like the distribution instruction to be permanently linked to the report, you will need to Create and Link the report in Sage Intelligence Report Manager.
57 Report Manager User Guide Version 1 April 2012
Automated Distribution
In order to use automated distribution it is recommended that you use the SMTP / Exchange
Server option in your Distribution Settings as the Use My Outlook Profile option requires Microsoft
Outlook to be open at the time of distribution.
For Automated Distribution Instructions, do the following:
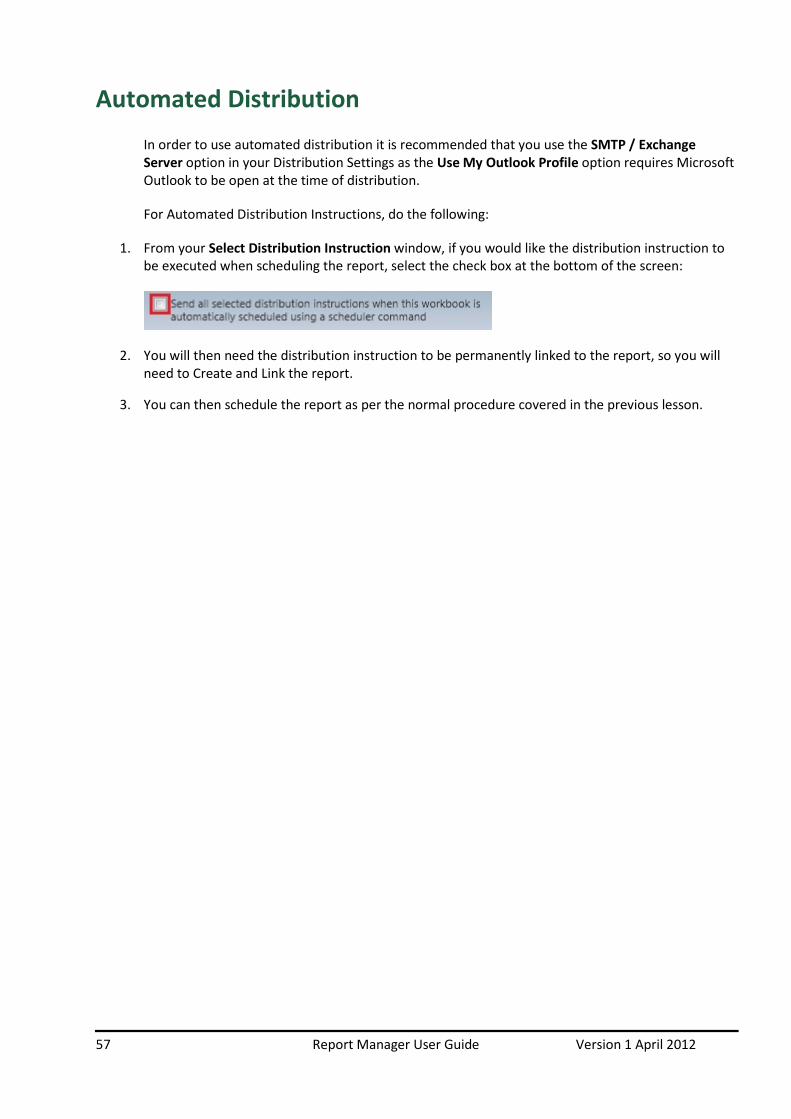
1. From your Select Distribution Instruction window, if you would like the distribution instruction to
be executed when scheduling the report, select the check box at the bottom of the screen:
2. You will then need the distribution instruction to be permanently linked to the report, so you will
need to Create and Link the report.
3. You can then schedule the report as per the normal procedure covered in the previous lesson.

58 Report Manager User Guide Version 1 April 2012
Send Now
Once the distribution instructions have been selected for a report, you can execute the instructions
immediately by selecting the Send Now button.
To Execute Distribution Instructions, do the following:
1. Click the BI Tools Tab.
2. Click Send Now.
3. The distribution instructions will then be validated. If there are any errors, these will be displayed;
thereafter the distribution instructions will be executed.

59 Report Manager User Guide Version 1 April 2012
Copying, Pasting and Renaming Reports
You can copy and paste a report, at any stage, in the report manager. These functions are useful in Sage
Intelligence because all the Master reports are locked and you need to make a copy of these master
reports. Use the copy, paste, and renaming methods so you can create new reports from an existing report
and therefore not corrupt the master report.
To create a new report from an existing report 1. Open the Report Manager from the Sage Intelligence menu under Reports
2. Right‐click on the report you want to make a copy of; e.g. Financial Report
3. Select Copy to copy that report to the Clipboard.
4. Now paste the copied report onto a folder.
5. Select a folder. You can choose the same folder that contains the original report or a different
folder.
6. Right‐click on the selected folder and select Paste.
7. Rename the newly copied report. By default, the report’s name is Copy of <report name>.
Note – You can use the short‐cut keys of Ctrl+C to copy the report, and Ctrl+V to paste instead of
using the menus.
Right‐click on the report and select Rename to give the report a different name. You now have an exact
duplicate of the original report that will obtain its data from the same place, and deliver it in the same
format, until you make any changes to this new report.

60 Report Manager User Guide Version 1 April 2012
Creating and Linking a Report
It is entirely possible to customize the look and layout of the Sage Intelligence Standard Reports. Although
these reports are designed to encompass the needs of most business organizations, you may want to
change the appearance (colors, text style, etc.) to reflect your company image, and perhaps change the
order or inclusion of columns to suit your company processes. These changes can be saved for the next
time you run the report.
Creating Excel templates enables the user to create a template from an open Excel workbook and link it to
an existing report so as to standardize the output format of the chosen report for every run instance in
future.
Note:
If you are unsure of making changes to any of the Standard Reports, you should create a copy of the report
before you make any changes.
Sage Intelligence users must make a copy of a report in order to edit the standard reports.
To copy a report
1. Open the Sage Intelligence Report Manager.
2. Right‐click the report you want to copy and select Copy.
3. Right‐click on the report folder in which you want to paste the copy and select Paste. The copy of
the report is renamed as Copy of and the original report name.
To create and link the Report
1. Open the Sage Intelligence Report Manager.
2. Select and run the report you want to customize; e.g. Financial Report.
3. Make the changes to the report; ensure that Sheet1 (where Sage Intelligence puts the Raw Data)
and Sheet2 (where Sage Intelligence puts the report parameters) are unchanged.
4. After completing the changes, leave the workbook open and go back to the Report Manager.
5. Right‐click on the report for which the changes were made and select Create and Link Template.
6. Select the workbook with the changes in the window that appears.
7. Click OK.
8. When prompted with the pop up message, click Yes to link the workbook. Clicking No will not link
the workbook.
9. When prompted to specify the template name, change the name of the template. Doing so ensures
that the original template is not overwritten with the copy
10. Click OK.
Once the template has been successfully linked, a message is displayed.

61 Report Manager User Guide Version 1 April 2012
Exporting and Importing Reports
Reports can be exported from one report manager and imported into another. The export function
creates a compressed file with an .al_ extension which can be imported into other systems.
NOTE: Though reports are exported only from the Report Manager, they can be imported using
either the Report Manager or the Connector. Importing a report that already exists in your
system does not affect the existing report. An imported report that contains a template file with
the same name as a template file must be renamed to avoid template conflicts. You are
prompted to provide a new name for the template. Everything required to make the template
work is included in the export, including the container, template union reports etc.
Exporting a Report
To export a report, use the following procedures:
1. From the Object window, right click on the desired report.
2. Select Export Report.
3. Select OK. (A window appears to export the report, before the Save As dialog window appears.)
4. Select the Export directory from the save export file as dialogue box.

62 Report Manager User Guide Version 1 April 2012
5. Select Save.
6. You will get a message to confirm your Export Succeeded.
7. Select OK.

63 Report Manager User Guide Version 1 April 2012
Importing a Report
8. To import a report, use the following procedures:
9. From the Object window, right click on the Home object.
10. Select Import Report.
11. Select the report to Import.
12. Select Open.
13. The Import Report dialogue box will open (with the _al extension).

64 Report Manager User Guide Version 1 April 2012
14. Change the Report Name if required.
15. Select the Target Connection (should be Sage ERP X3 (Auto Connect).
16. Select the Report Destination (the folder in which to save the report).
17. Select Import.
18. Select OK.
19. A message may appear indicating that a template already exists – click Yes to specify a new name
and No to overwrite the existing template file
20. You may get an additional message highlighting that the container may already exist. Choose yes to
use this container or No to create a new one. Select No.
21. Import Succeeded.
22. Double click on the folder in the Report Manager to refresh. The Imported report will now appear
in the Folder specified.

65 Report Manager User Guide Version 1 April 2012
Additional Resources for Sage Intelligence – Financial
Reporting for Sage ERP X3
Sage Intelligence X3 Group
on the BI Community
http://community.alchemex.com
Live & Recorded Webcasts http://www.alchemex.com/Sage/Sagex3Webinars.aspx
Alchemex Twitter @Alchemex
Sage ERP X3 Twitter @sageerpx3