Embed Size (px)
Citation preview
This journal is c The Royal Society of Chemistry 2010 Integr. Biol.
Cite this: DOI: 10.1039/c0ib00071j
Imaging in real-time with FRET the redox response of tumorigenic cells
to glutathione perturbations in a microscale floww
Chunchen Lin,za Vladimir L. Kolossov,zb Gene Tsvid,cLisa Trump,
b
Jennifer Jo Henry,bJerrod L. Henderson,
bLaurie A. Rund,
dPaul J.A. Kenis,
b
Lawrence B. Schook,bH. Rex Gaskins*
band Gregory Timp*
a
Received 3rd August 2010, Accepted 18th November 2010
DOI: 10.1039/c0ib00071j
Despite the potential benefits of selective redox-modulating strategies for cancer therapy, an efficacious
methodology for testing therapies remains elusive because of the difficulty in measuring intracellular redox
potentials over time. In this report, we have incorporated a new FRET-based biosensor to follow in real
time redox-sensitive processes in cells transformed to be tumorigenic and cultured in a microfluidic
channel. A microfluidic network was used to control micro-scale flow near the cells and at the same time
deliver drugs exogenously. Subsequently, the response of a redox homeostasis circuit was tested, namely
reduced glutathione (GSH)/oxidized glutathione(GSSG), to diamide, a thiol oxidant, and two drugs used
for cancer therapies: BSO (L-buthionine-[SR]-sulfoximine) and BCNU (carmustine). The main outcome
from these experiments is a comparison of the temporal depletion and recovery of GSH in single living
cells in real-time. These data demonstrate that mammalian cells are capable of restoring a reduced
intracellular redox environment in minutes after an acute oxidative insult is removed. This recovery is
significantly delayed by (i) the inhibition of GSH biosynthesis by BSO; (ii) the inactivation of glutathione
reductase by BCNU; and (iii) in tumorigenic cells relative to an isogenic non-tumorigenic control cell line.
Introduction
As a cancerous tumor expands, it quickly outgrows the diffusion-
limited blood supply leading to a hypoxic microenvironment
and oxidative stress. Oxidative stress, in particular, has been
hypothesized to influence tumors since the decreased
susceptibility of tumor cells to stimuli that induce apoptosis
has been linked to their inherently reduced reduction/
oxidation (redox) potential.1–6 Thus, redox homeostasis has
become a target for cancer chemotherapy. Generally, cells
depend vitally on the balance struck between redox
reactions, which can be disrupted by factors such as increases
aUniversity of Notre Dame, 316 Stinson-Remick Hall, South Bend,IN 46556. E-mail: [email protected], [email protected]; Fax: 574-631-6141;Tel: 574-631-1272
b Institute for Genomic Biology, University of Illinois, 1206 WestGregory Drive, Urbana, IL 61801. E-mail: [email protected],[email protected], [email protected], [email protected],[email protected], [email protected], [email protected];Tel: (217) 244-3163
cUniversity of Illinois at Urbana-Champaign, 405 North MathewsAvenue, Urbana, IL 61801. E-mail: [email protected]
dDepartment of Animal Sciences, University of Illinois, 1201 WestGregory Drive, Urbana, IL 61801. E-mail: [email protected]
w Electronic supplementary information (ESI) available. See DOI:10.1039/c0ib00071jz Contributed equally to the work
Insight, innovation, integration
INTEGRATION: This manuscript reports the integration
of a tumorigenic cell line with a new FRET redox biosensor
and microfluidic for the study of pulsatile perturbations to
redox homeostasis in real time. Together these tools provide
a new method to examine the fundamental mechanisms
underpinning tumorigenesis.
INNOVATION: Despite the potential benefits of selective
redox-modulating strategies for cancer therapy, a methodology
for testing therapies remains elusive because of the difficulty in
measuring intracellular redox potentials over time. To our
knowledge, our study provides the first data on the time-response
of depletion of (reduced) glutathione, the most abundant redox
buffer in eukaryotic cells, in real-time after an oxidative insult.
INSIGHT: The key question we are trying to address with
this research is whether tumor cells have lost the ability to
mount the apparent changes in intracellular redox potential
that accompanies normal cell growth or the ability to sense
these changes. Our data indicates that some cancer cells seem
to lose or at least have a compromised ability to sense and
mount changes in intracellular redox potential.
Integrative Biology Dynamic Article Links
www.rsc.org/ibiology PAPER
Dow
nloa
ded
on 2
8 D
ecem
ber
2010
Publ
ishe
d on
http
://pu
bs.r
sc.o
rg |
doi:1
0.10
39/C
0IB
0007
1JView Online

Integr. Biol. This journal is c The Royal Society of Chemistry 2010
in the level of reactive oxygen species (ROS) that develop
during inflammation or exposure to environmental chemicals
that are metabolized to antioxidant-depleting electrophiles.
Consequently, cells have evolved sophisticated regulatory
mechanisms to buffer the reduction potential and mitigate
oxidative stress. A key question that remains is whether tumor
cells have lost the ability to mount the apparent changes in
intracellular redox potential that accompany normal cell growth
or the ability to sense these changes.
Although redox homeostasis most likely affects cell fate
more than any other biochemical phenomenon, the
molecular mechanisms mediating redox sensitivity and
regulation are poorly defined and difficult to study.7,8 Being
the most abundant redox buffer in eukaryotic cells, the
glutathione (GSH)/oxidized glutathione (GSSG) homeostasis
circuit plays a crucial role in the response to oxidative stress.
As illustrated in Fig. 1(a), GSH biosynthesis is catalyzed by
two ATP-dependent enzymes: g-glutamyl-cysteine ligase
(GCL), which is comprised of two independent subunits
GCLC and GCLM; and glutathione synthetase (GSS).9–13
GSH protects cells against oxidative stress through
termination of oxidants with concomitant oxidation of GSH
to GSSG. GSH reacts spontaneously with electrophilic
substances such as free radicals and ROS producing
glutathione disulfide (GSSG). When GSH becomes oxidized
to form GSSG, it can then effectively be recycled by the
antioxidant flavoenzyme glutathione reductase (GR). GR
catalyzes the reduction of oxidized glutathione by NADPH
and elevated levels of GSH are often detected in drug-resistant
tumors.13
Despite the potential benefits of a selective GSH-modulating
strategy for cancer therapy, an efficacious methodology
remains elusive because of the difficulty in measuring
intracellular redox potentials over time. Various methods
have been employed to quantify the redox environment in
cells, including the use of fluorescent sensors based on GFP
proteins,8,14–16 peptide scaffolds,17,18 or small molecules;19
each having strengths and weaknesses. For example, dyes
force redox measurements to be made in a static mode, thus
providing only limited evidence about redox dynamics.20 For
such applications, genetically encoded fluorophores are more
suitable.8,21
We report here on the development of a novel genetic
construct that enables real-time assessment of intracellular
redox, and its use in tracking the redox response of
tumorigenic cells to glutathione perturbations introduced
through a microscale flow. This genetic construct senses
intracellular redox using Forster/fluorescence resonance
energy transfer (FRET), a powerful technique for monitoring
interactions, associations, and structural modifications of
biological molecules. In our case, oxidation induces a change
in the molecular conformational that alters the distance
between the FRET donor–acceptor pair, which in turn
causes a detectable change in FRET efficiency.22 Using this
FRET sensor, protocols were first established to test the redox
response of Chinese hamster ovary (CHO) cells cultured in a
microfluidic channel. In contrast to a canonical culture vessel,
the microfluidic device affords us stringent control over the
spatial and temporal microenvironment of the cell. Then the
Fig. 1 Glutaredoxin pathway of reduction of protein disulfides and
a FRET biosensor to probe it. (a) The glutaredoxin system acts via
the GSH/GSSG redox buffer. Its high electron-donating capacity
(high negative redox potential) combined with high intracellular
concentration (millimolar levels) generate great reducing power.
GRX-(SH)4 and GRX-S4 indicate the reduced and oxidized forms,
respectively, of glutaredoxin. In the Figure the enzymes are
indicated by boxes and their inhibitors are in red. (b,c) A
schematic of the redox sensitive switching mechanism for a single
molecule. Under oxidative conditions, intermolecular disulfide
bonds can form shifting the free energy minimum from the (b)
a-helix, to a (c) ‘clamped-coil’ state (similar to a helix–coil
transition). The coiled state brings the donor (ECFP) and acceptor
(EYFP) in closer proximity than in the extended helix state, where
they exchange excitation energy more efficiently (i.e. a high FRET
state). The extent of energy transfer is easily quantified from the
increased emission of the acceptor. (d) Diagram of the CY-RL7
construct, indicating the location of the redox linker inserted
between two GFP variants, ECFP and EYFP. The position of the
restriction sites for NcoI, BlgII and BamHI, EcoRI used for cloning
are also indicated in the map along with the location of the hexa
histidine-tag, identified by the trademarked name His-tag, which is
used for protein purification.
Dow
nloa
ded
on 2
8 D
ecem
ber
2010
Publ
ishe
d on
http
://pu
bs.r
sc.o
rg |
doi:1
0.10
39/C
0IB
0007
1JView Online

This journal is c The Royal Society of Chemistry 2010 Integr. Biol.
redox response of two isogenic porcine cell lines was examined:
one being nontransformed control fibroblasts, which exhibit
contact-inhibition (161-C) versus a transformed fibroblast cell
line that harbors six oncogenes (161-T), hTERT, p53DD, cyclin
D1, CDK4R24C, c-MycT58A and H-RasG12V, known to perturb
pathways commonly corrupted in human cancer.23 This cell
line is tumorigenic when implanted into the host animal, and it
was used supposing that tumorigenesis in pigs is similar to that
in humans, even at a molecular level.23
The main outcome from these experiments is a
comparison of the real-time kinetics of GSH depletion and
recovery in single normal and cancer cells subjected to
oxidant challenges. Specifically, the responses of 161-C
and 161-T cells to a pulsatile challenge by diamide
((CH3)2NCONQNCON(CH3)2), an oxidant probe for thiols,
were examined after treatment with two drugs used in cancer
therapy: BSO (L-buthionine-[SR]-sulfoximine) and BCNU
(1,3-bis[2-chloroethyl]-2-nitrozourea, commonly known as
Carmustine). These data demonstrate that mammalian cells
are capable of restoring a reduced intracellular redox
environment in minutes after an acute oxidative insult is
removed. But the recovery is significantly delayed by both (i)
the inhibition of GSH biosynthesis by BSO; and (ii) the
inactivation of glutathione reductase by BCNU.
Results and discussion
Fluorescence microscopy is ideally suited to elucidate the
spatio-temporal distribution and functional states of
constituent intracellular molecules.24,25 In this work it was
used to both demonstrate the utility of a FRET-based
biosensor, CY-RL7 (cyan-yellow FRET pair with a newly
designed redox linker 7 (RL7)) and illuminate the
intracellular redox environment driven specifically by the
2GSH/GSSG couple in live cells in real time. A schematic of
the redox-sensitive switching mechanism for a single molecule
is shown in Fig. 1(b,c). An oxidation event induces a
conformational change in the sensor altering the distance
between the FRET donor–acceptor pair, which in turn
causes a detectable change in FRET efficiency. Under
oxidative conditions intermolecular disulfide bonds form,
shifting the free energy minimum from the a-helix, shown in
Fig. 1(b) to a ‘clamped-coil’ state represented in Fig. 1(c),
which forces the donor (ECFP) and acceptor (EYFP) into
closer proximity. The efficacy of redox biosensors with related
structures was previously demonstrated in vitro by analyzing
purified proteins by steady-state fluorescence spectroscopy.22
The lack of linkers capable of both separating donor from
acceptor and conferring redox sensitivity is a major drawback
in engineering FRET-based redox biosensors, but that issue
was resolved in our previous study. In this most recent design,
developed using the cloning strategy represented schematically
in Fig. 1(d), the linker is comprised of eight –EAAAK–
sequences with 4 cysteine residues flanked by the two GFP
variants, ECFP and EYFP.
As a test of its suitability for use in vivo, FRET
measurements using CY-RL7 in living CHO cells were
performed. The live cells were first cultured in a microfluidic
channel like that shown in Fig. 2(a,b). The microchannel
enables stringent control of the cell’s microenvironment and
allows us to broadcast drugs exogenously.26–28 To establish
sensitivity of the FRET sensor to changes in intracellular redox
potential, the CHO cells were subsequently subjected in a pulsatile
manner to oxidative stress using 1 mM diamide in DMEM.
A cell contains millimolar concentrations of GSH
(B10 mM) that is maintained in this reduced form by a
cytosolic NADPH-dependent reaction catalyzed by GR.
Thus, protein disulfide bonds that drive the FRET sensor
rarely form in the cytosol because of the high concentrations
of GSH. However, upon exposure of the cells to diamide,
concentrations of intracellular GSH are rapidly depleted.29,30
The diamide penetrates cell membranes within seconds and
reacts within the cell at a high rate (seconds to minutes) at
physiological pH, enabling the study of cell functions altered
by a temporary perturbation of the thiol status.
Once in the cell, the diamide may directly oxidize the
biosensor as it does cell extracts.36 Alternatively, the diamide
insult, which is governed by the following reactions:
ð1Þ
ð2Þ
ð3Þ
ð4Þ
affects the glutathione homeostasis circuitry, shifting the cell to
an environment conducive to the oxidation of the biosensor.
Overall, the diamide reacts with glutathione more rapidly than
other thiol substrates according to reaction (1); it is
characterized by a rate constant of k1 = 18 mM�1 min�1.29
On the other hand, the diamide reacts very slowly with non-
GSH thiols and even more slowly with non-thiols. Moreover,
the diamide is more likely to react with a small thiol like GSH
than with a protein thiol due to steric hindrance.29 Thus, it was
reasoned that the diamide challenge predominately perturbs
the glutathione circuitry and, since glutathione is the major
nonprotein thiol in most cells, it is possible to gain information
about the role of GSH in redox homeostasis this way.
In most living organisms GR maintains a high cytosolic
ratio (B100 : 1) of reduced GSH over GSSG by catalyzing
reaction (2). However, following a 1 mM diamide challenge,
the GSH is exhausted, which drives reaction (2) toward the
production of more GSH. In particular, the net reaction
described by reaction (4) may shift the FRET sensor to a
‘clamped-coil’ state and a more efficient exchange of the
excitation energy. Thus, while the FRET response seems to
follow the concentration of GSH, it is difficult to distinguish
Dow
nloa
ded
on 2
8 D
ecem
ber
2010
Publ
ishe
d on
http
://pu
bs.r
sc.o
rg |
doi:1
0.10
39/C
0IB
0007
1JView Online

Integr. Biol. This journal is c The Royal Society of Chemistry 2010
between the direct oxidation of the probe and an alteration in
the redox potential of the glutathione couple.
Fig. 2 shows the FRET response after exposure to 1 mM
diamide. The microfluidic flow is switched from a perfusion
comprised of only DMEM to a flow with DMEM plus 1 mM
diamide (solid vertical line) for 3 min. Fig. 2(c)–(e) are confocal
microscopic images that illustrate the dramatic change in
FRET after exposure to diamide. The (false-colored) yellow
is related to the increase in FRET response. Fig. 2(c) is a
false-color, two-dimensional projection integrated over the
three-dimensional confocal image of the cells, showing the
FRET channel observed two minutes after exposure to
1 mM diamide, while Fig. 2(d,e) show two slices of the image
in (c) taken at z = 0.5 mm and z = 4.5 mm along the optic axis
from the same CHO cells under the same conditions. From
these images it appears that the response is compartmentalized.
The change in fluorescence is spatially dependent on a scale
well beyond the lateral and axial resolution, which is estimated
to be 0.61*l/NA = 285 nm and 2l/(NA)2 = 778 nm,
respectively. It is well known that redox potential is
compartmentalized in eukaryotes.31,32 Within organelles and
intracellular compartments, a cell maintains specific redox
potentials in correspondence with its functionality.33
Consistent with this assertion, the sensor response is observed
to vary spatially throughout the cell indicating that the redox
potential is changing at various locations through the cell.
Figs. 2(f,g) indicate that sensitivity of our FRET redox
biosensor in the ROIs is exclusively due to the nature of the
redox linker. These Figures compare the time lapse response of
the FRET constructs with two different linkers: (f) RL7
comprised of L-helical sequence with four embedded cysteine
residues and (g) P14 comprised of 14 proline residues, expressed
in CHO cells, to sequential treatment with diamide. Positive
responses to diamide were not observed for CY-P14, the
negative control construct. On the other hand, the initial state
of the CY-RL7 biosensor (before oxidative challenge) is
characterized by a low FRET signal, which demonstrates that
CY-RL7 is fully reduced in accordance with the physiological
state of the cell. The FRET response was normalized against
ECFP and EYFP expression levels and to remove the stochastic
variation from cell to cell (as described in the Methods section);
typically DNFRET E 0.15, but the low FRET signal varies from
one ROI to the next, which may be attributed (at least in part) to
the spatial variation of the FRET within the cell. Finally, the
CY-RL7 construct shows a better response to GSH/GSSG
ratios representing a significant improvement over previously
reported constructs.22 Various attributes of the sensor response
are described in more detail elsewhere.34
Subsequently, the time development of FRET was followed
in regions of interest (ROIs) in the cell. As illustrated in the
supplemental Fig. S1,w the cell recovery time, measured by a
Fig. 2 Validation of the CY-RL7 redox sensor in CHO cells. (a)
Microfluidic channel showing the tubing used for fluid exchange (left)
and CHO cell FRET channel image with the regions of interest (ROI)
enumerated (right). (b) Fluorescence micrograph showing CHO cells
imaged in the microfluidic channel in a low flow (48 mL min�1) at t= 0,
just prior to a diamide pulse (see the corresponding Fig. (f) as well).
(c,d,e) Confocal images of CHO cells show that, on exposure to a 1 mM
diamide pulse, the spatial distribution and intensity of the FRET signal
changes, indicating a change in the redox environment in the cytoplasm.
The three confocal images compare (c) the integrated two dimensional
projection of the three dimensional confocal image constructed from the
change in YFP channel with (d,e) showing slices taken from (c) along the
optic axis at z = 0.5 mm and z = 4.5 mm respectively. (f,g) Time lapse
of the fluorescence of a few ROIs demonstrates the response of the
CY-RL7 and CY-P14 FRET constructs respectively expressed in CHO
cells after treatment with 1 mM exogenous oxidant diamide (solid
vertical line at t = 5 min) followed by removal of oxidant (dashed
vertical line, t=8min). The ROIs associated with CY-RL7 shown in (f)
are indicated in (b), while the ROIs associated with CY-P14 are taken
from other cells not shown. (h) Three sequential cycles, comprised of an
oxidative insult with 1 mM diamide (solid vertical lines) followed by
removal of oxidant by brief washing (dashed vertical lines) 4 min later,
were applied to CHO cells (not shown), illustrating the reversible nature
of the CY-RL7 response. The data are representative of 12 independent
experiments using a minimum of 4 ROIs.
Dow
nloa
ded
on 2
8 D
ecem
ber
2010
Publ
ishe
d on
http
://pu
bs.r
sc.o
rg |
doi:1
0.10
39/C
0IB
0007
1JView Online

This journal is c The Royal Society of Chemistry 2010 Integr. Biol.
return to the FRET level prior to diamide exposure, depends
on the strength of the diamide challenge. However, the change
in FRET depends only weakly on concentration, as illustrated
in Fig. S2.w So, to minimize the recovery time, while
maximizing the change in FRET, the cells were washed,
switching from a diamide in DMEM flow back to the
DMEM-only flow (dashed line), with a minimized wash
duration. The diamide treatment does not seem to cause any
irreversible damage. After the oxidative insult is removed the
original thiol status is apparently recovered as evident from
Fig. 2(f). To unequivocally demonstrate the reversible
character of the sensor, three consecutive cycles of oxidative
challenge were applied to the same cells as illustrated by
Fig. 2(h). Each treatment cycle includes perfusion with
DMEM medium containing 1 mM diamide (solid vertical
lines), time lapse image acquisition at oxidized state in
presence of diamide followed by perfusion in DMEM-only at
48 mL min�1 (dashed vertical lines). A rapid cell recovery is
evident from the decrease in FRET to the initial level observed
for all three cycles.
Biosensor oxidation occurs quickly (ino12 s) with exposure
to diamide, which is evidenced by the rapid increase of the
FRET signal shown in Fig. 2(f) near t = 5 min. The diamide
eventually overwhelms the GSH buffer and so disulfide bonds
form in CY-RL7 forcing the coiled state. In steady-state, the
rate of the oxidation of GSH has to be equal to the rate of the
chemical reaction regenerating GSH. After the diamide is
washed away, reaction (2) eventually re-establishes the
reducing environment of the cell after a delay corresponding
to the time required to exhaust the remaining diamide. Thus,
the FRET signal tracks the recovery in the GSH concentration
according to reactions (2) and (3) as demonstrated in Fig. S1.wTo further illuminate the kinetics of redox changes
characterized by the GSSG/2GSH couple, the effect of GSH
deficiency on the redox restoration was examined by the
imaging of live CHO cells pretreated with BSO or BCNU
followed by an oxidative insult with diamide. First, to establish
a control, untreated CHO cells were exposed to 1 mM diamide
in DMEM (Fig. 3(b), solid vertical line). After a 4–5 min
oxidative stress, diamide was washed out with DMEM. The
control shown in Fig. 3(a,b) indicates that cell oxidation occurs
quickly with exposure to diamide, as shown by the rapid
increase of the FRET signal near t = 4 min. Following the
diamide insult, the cells recover quickly, within 2–3 min.
Subsequently, the CHO cells were exposed to another form
of oxidative stress: 0.5 mM BSO in DMEM for 24 h. BSO is a
non-toxic and selective inhibitor of the enzyme GCL in
GSH biosynthesis and thereby generates oxidative stress by
Fig. 3 Effect of diamide with and without BSO and BCNU pretreatment on CHO cell recovery. Fluorescence micrographs showing CHO cells
stably transfected with CY-RL7, imaged in the microfluidic channel under low flow conditions (48 mL min�1) at t=0, just prior to a diamide pulse
(a) without pretreatment, (c) after pretreatment with 0.5 mM BSO for 24 h and (e) after 2 h of BCNU pretreatment. (b), (d), and (f) show the
corresponding ratiometric analyses of the CY-RL7 fluorescence for the ROIs indicated in the respective Figures. The imaging commenced under
low flow conditions (48 mL min�1) at t= 0, just prior to exposure to a diamide pulse. Generally, the FRET changes dramatically after exposure to
1 mM diamide in DMEM (solid vertical line) at t = 4 min. The FRET signal recovers rapidly (within 2 min) once the diamide is washed out at
t=8min (dashed vertical line) without BSO/BCNUpretreatment, (see (b)), but recovers only after a delay with a pretreatment (d,f). These data are
representative of 3 independent experiments using a minimum of 4 ROIs.
Dow
nloa
ded
on 2
8 D
ecem
ber
2010
Publ
ishe
d on
http
://pu
bs.r
sc.o
rg |
doi:1
0.10
39/C
0IB
0007
1JView Online

Integr. Biol. This journal is c The Royal Society of Chemistry 2010
decreasing the GSH pool.35 This assertion is supported by our
prior observation of a 410-fold decrease in GSH by reaction
with monochlorobomane (mBCl), a common technique to
measure GSH in cultured cells.22,36 After 24 h treatment with
BSO, the image-acquisition of cells was started. The cell’s
appearance, depicted in Fig. 3(c), confirms that pretreatment
with BSO for 24 h does not produce noticeable changes in the
redox sensor response. This can be explained by the low FRET
state of the biosensor during the first four minutes before
oxidative insult with diamide. These data are supported by
similar (static) results on roGFP2 in mammalian cells.37 This
BSO pretreatment was followed by a second oxidant insult
using 1 mM diamide in DMEM for 4–5 min with a subsequent
wash in DMEM. The time dependence of the FRET signal in
several ROIs shown in Fig. 3(d) consistently demonstrates a
rapid increase in FRET immediately following the diamide
insult, but a delayed return to the initial reduced state.
Although the delay in restoration of redox homeostasis
varied from cell to cell, ranging from 10 to 25 min, it is in
stark contrast to the 2 min recovery time exhibited by cells
oxidized only by diamide illustrated in Fig. 3(b).
Finally, the effect of GSH deficiency was also studied by
pre-exposure of CHO cells to 0.5 mM BCNU in DMEM for
2 h. After in situ decomposition, the alkylating cytostatic
drug, BCNU, produces oxidative stress by inactivating
GR, producing an accumulation of GSSG.38,39 According
to reaction (2), GR catalyzes the reduction of oxidized
glutathione by NADPH, which sensitizes a cell to oxidative
stress. Fig. 3(e,f) show that BCNU has a similar effect to BSO.
Just like BSO, the pretreatment with BCNU does not produce
noticeable changes in the redox sensor response. Subsequently,
the pretreatment with BCNU was followed by 1 mM diamide
in DMEM for 4–5 min. Again, a rapid response to the onset of
the diamide challenge and a rapid, but delayed return of the
FRET sensor to the initial reduced state was observed.
Although the delay in restoration of redox homeostasis
ranged from 10 to 30 min depending on the cell, the recovery
time is much longer than that observed in cells oxidized only by
diamide. Apparently, in the absence of diamide in the medium,
the recovery time in CHO cells is delayed by thiol regeneration,
which requires consumption of the remaining reagent. This
assertion is supported by the shortening of the recovery time
with decreasing diamide concentration shown in Fig. S1.wTherefore, regeneration is slow to occur in cells lacking GR
due to inhibition by BCNU, or in cells in which biosynthesis of
GSH is blocked.
Taken altogether, these data demonstrate unequivocally,
not only the efficacy of the new CY-RL7 biosensor for
tracking redox, but also that mammalian cells are capable of
restoring a reduced intracellular redox environment on a time
scale as short as B2 min after an acute oxidative insult is
removed. Neither BSO nor BCNU was observed to oxidize the
biosensor. On the other hand, diamide, which is a de-facto thiol
oxidant, oxidizes the biosensor when it permeates the
cell membrane. However, thiol regeneration kinetics after the
oxidative insult is removed must drive the biosensor reduction
since the response time changes with BSO or BCNU
treatments, which deplete the intracellular GSH pool. Thus,
it is inferred that the biosensor tracks the initial steps in
cytosolic regeneration of GSH depleted by the pretreatment
with BSO or BCNU and the subsequent diamide insult. To our
knowledge, these are the first data on the time-response of
depletion of GSH in real-time after an oxidative insult. In this
regard, the data highlight the importance of considering this
rapid cellular response when conducting studies on the role of
GSH in redox homeostasis.
Elevated and prolonged oxidative stress has been associated
with several pathophysiologies, including cancer. But until
recently the limitations with respect to tools for measuring
the intracellular redox status has crippled research at
the molecular level. The new redox-sensitive FRET-based
CY-RL7 biosensor remedies some of these limitations and
provides an opportunity to examine perturbations of
intracellular redox homeostasis. The efficacy of therapies
targeting redox homeostasis was tested in an experimental
setting directly related to cancer biology using the CY-RL7
redox sensor. As illustrated in Fig. 4, the same challenge and
recovery experiments described above were performed with
161-C and 161-T cells transiently transfected with CY-RL7,
evaluating the effect of oxidative stress by BSO or BCNU
followed by a second oxidant insult to the same cells using
1 mM diamide in DMEM for 4–5 min. Only a limited number
of cells fluoresce within a field of view because of the
inefficiency of the transfection. However, the results reported
are typical of those obtained from multiple experiments
following the same protocol.
The 161 cell line provides a valuable opportunity to
interrogate the contributions of redox signalling in well
defined cancer signalling pathways. The two cells lines tested,
derived from embryonic pig cells, consist of a nontransformed
control (161-C), which is subject to contact-inhibited cell
growth, and a companion tumorigenic cell line (161-T) that
harbors six oncogenes, which have been rigorously defined in
regards to their tumorigenic properties.23 The response and
recovery to diamide challenge with and without pretreatments
with 0.5 mM BSO for 24 h and 0.5 mM BCNU for 2 h is
quantitatively similar to that observed with CHO cells
described above. Fig. 4(b) shows a ratiometric analysis of the
CY-RL7 fluorescence for three ROIs indicated in Fig. 4(a).
The FRET parameter changes dramatically upon exposure to
1 mM diamide in DMEM (solid vertical line) at t= 4 min and
recovers rapidly, within 2 min once the diamide is washed out
at t = 8 min (dashed vertical line). On the other hand, after a
pretreatment with 0.5 mM BSO for 24 h, there is a rapid but
delayed return of the FRET sensor to the initial reduced state
following the 1 mM diamide challenge; the total recovery time is
extended to 35–42 min, which is about twice as long as the
recovery time measured in CHO cells under the same conditions
as shown in Fig. 4(c,d). Likewise, as illustrated in Fig. 4(e,f) after
treatment with 0.5 mM BCNU for 2 h, the recovery time after a
1 mM diamide challenge and wash is extended to 15–18 min,
which is within the range of responses found for CHO cells. In
each case, the recovery time is much longer than the 2 min delay
observed in cells oxidized only by diamide.
As illustrated in Fig. 4(g–n), the same challenge and recovery
experiments were performed with the isogeneic 161-T cancer
cell line transiently transfected with CY-RL7. While the
recovery seems to be qualitatively similar to the results
Dow
nloa
ded
on 2
8 D
ecem
ber
2010
Publ
ishe
d on
http
://pu
bs.r
sc.o
rg |
doi:1
0.10
39/C
0IB
0007
1JView Online
This journal is c The Royal Society of Chemistry 2010 Integr. Biol.
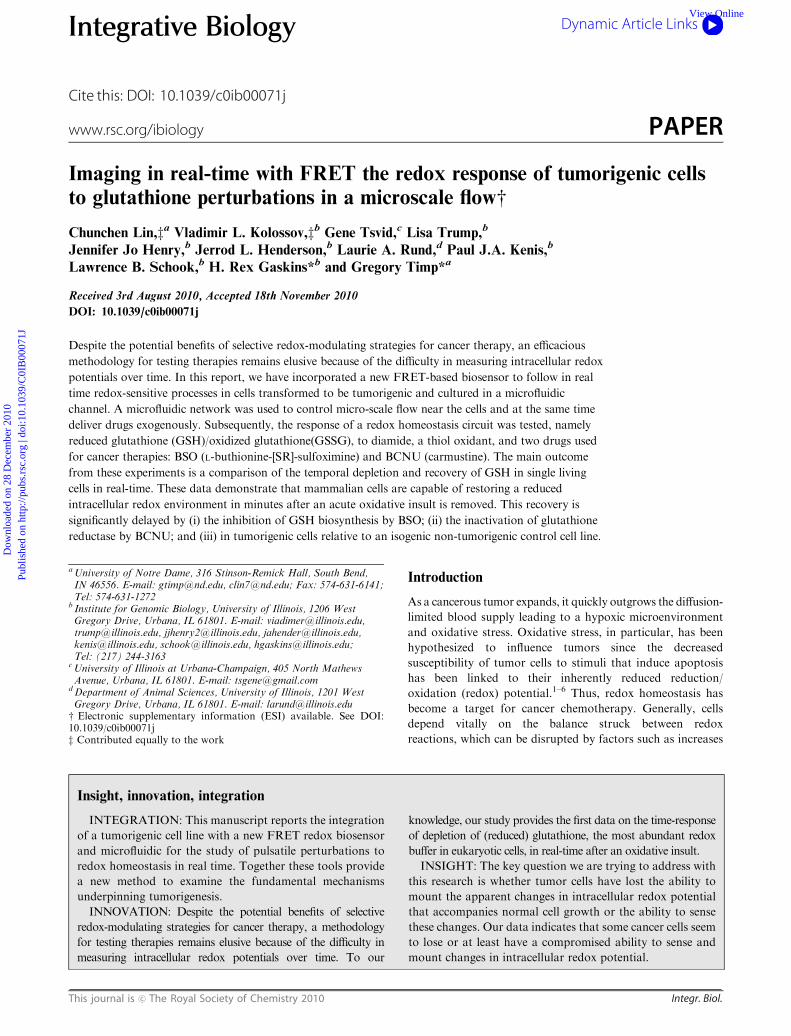
Fig. 4 Effect of diamide with and without BSO and BCNU pretreatment on recovery of 161-C control (nontransformed) and transformed
161-T cells. Fluorescence micrographs showing 161-C cells transiently transfected with CY-RL7, imaged in the microfluidic channel under
low flow conditions (48 mL min�1) at t = 0, just prior to a diamide pulse (a) without pretreatment, (c) after pretreatment with 0.5 mM BSO
for 24 h and (e) after 2 h of BCNU pretreatment. (b), (d) and (f) show the corresponding ratiometric analyses of ROIs after cell exposure to
1 mM diamide in DMEM (solid vertical line) followed by brief washing (dashed vertical line) under pretreatment conditions indicated in (a),
(c) and (e), respectively. The imaging commenced under low flow conditions (48 mL min�1) at t = 0, just prior to exposure to a diamide pulse.
Generally, the FRET changes dramatically in the cytoplasm after exposure to 1 mM diamide in DMEM (solid vertical line) at t = 4 min. The
FRET signal recovers rapidly (within 2 min) once the diamide is washed out at t = 8 min (dashed vertical line) without BSO/BCNU
pretreatment, but recovers only after a delay with a pretreatment. These data are representative of 3 independent experiments using a
minimum of 4 ROIs. Fluorescence micrographs showing 161-T cells transiently transfected with CY-RL7, imaged in the microfluidic channel
under low flow conditions (48 mL min�1) at t = 0, just prior to a diamide pulse (g) without pretreatment, (i) after pretreatment with 0.5 mM
BSO for 24 h and (k) after 2 h of BCNU pretreatment. Panels (h), (j) and (l) show the corresponding ratiometric analyses of ROIs after cell
exposure to 1 mM diamide in DMEM (solid vertical line) followed by brief washing (dashed vertical line) under pretreatment conditions
indicated in (g), (i) and (k), respectively. The imaging commenced under low flow conditions (48 mL min�1) at t = 0, just prior to exposure to
a diamide pulse. Generally, the FRET changes dramatically in the cytoplasm after exposure to 1 mM diamide in DMEM (solid vertical line)
at t = 4 min. The FRET signal recovers rapidly (within 2 min) once the diamide is washed out at t = 8 min (dashed vertical line) with a
pretreatment, but recovers only after a much longer delay with a pretreatment. To emphasize the affect of the duration of the pretreatment on
the delay, panels (m) and (n) present data from 7 h of pretreatment with BCNU. These data are representative of 3 independent experiments
using a minimum of 4 ROIs.
Dow
nloa
ded
on 2
8 D
ecem
ber
2010
Publ
ishe
d on
http
://pu
bs.r
sc.o
rg |
doi:1
0.10
39/C
0IB
0007
1JView Online
Integr. Biol. This journal is c The Royal Society of Chemistry 2010
obtained with 161-C cells, i.e. there is a rapid, but delayed
return of the FRET sensor to the initial reduced state, the
161-T cells either did not or took a substantially longer time to
recover from the diamide oxidative challenge. Fig. 4(h) shows a
ratiometric analysis of the CY-RL7 fluorescence for four ROIs
indicated in Fig. 4(g). The NFRET parameter changes
dramatically upon exposure to 1 mM diamide in DMEM
(solid vertical line) at t = 4 min and recovers rapidly, within
2 min once the diamide is washed out at t = 8 min (dashed
vertical line). On the other hand, after a pretreatment with
0.5 mM BSO for 24 h, there is a rapid but delayed return of the
FRET sensor to the initial reduced state following the 1 mM
diamide challenge; the total recovery time is extended to
80–90 min (Fig. 4(i,j)). Likewise, as illustrated in Fig. 4(k,l)
after treatment with 0.5 mM BCNU for 2 h, the recovery time
after a 1 mM diamide challenge is extended to 37–50 min. In
each case, the recovery time is much longer (42�) than the
delay observed in 161-C control cells and longer still than the
2 min delay encountered in 161-T oxidized only by diamide.
Conclusion
We have demonstrated that mammalian cells are capable of
restoring a reduced intracellular redox environment on a time
scale of a few minutes after an acute oxidative insult is
removed. This is significant because the redox environment
exerts a profound influence on normal cellular processes like
DNA synthesis, enzyme activation, selective gene expression,
cell cycle progression, proliferation, differentiation, and
apoptosis. This recovery time is therefore relevant to all these
normal cellular processes.40 In addition, oxidative stress is
thought to be a strongly influential factor in aging, cancer,
and various inflammatory disorders.41 In regards to cancer,
there is evidence indicating that the decreased susceptibility of
tumors to stimuli that induce apoptosis can be linked to their
inherently reduced redox potential.42,43 Although less defined
at the molecular level, intracellular redox status also affects cell
cycle progression.44,45 For example, several redox-sensitive
proteins involved in cell cycle progression have been
identified, including p53,46 AP-1,47 NF-kB,48 PKC,49 and
low molecular-weight protein tyrosine phosphatases.50 These
and possibly other unidentified cell cycle proteins harboring
redox-sensitive motifs may constitute a mechanistic link
between the intracellular redox environment and cell
cycle progression.51–53 Therefore, a means to investigate and
characterize macromolecular interactions is crucial for
elucidating the mechanisms underlying tumorigenesis.
The tools developed in this work provide a new and unique
method to examine the fundamental mechanisms underpinning
tumorigenesis. The initial tests of these tools on tumorigenic
cells indicate that BSO and BCNU grossly affect thiol
regeneration preferentially in cancer cells, which in turn
increases the duration of oxidative stress on the cell. Some,
but not all cancer cells seem to lose or at least have a
compromised ability to sense and mount apparent changes in
intracellular redox potential, since the response time seems to be
at least 2� longer than observed in normal control cells. But it
remains to be seen how the longer response time directly relates
to the effectiveness of selective redox-modulating drug therapies.
These tools could ultimately affect the development and
dosing recommendations of GR inhibitors as drugs against
tumor cells, as well. For example, Fig. 4(m,n) show that by
increasing the exposure to BCNU from 2 h to 7 h, there is a
concomitant increase in the recovery time: after a 1 mMdiamide
challenge the recovery time is extended to 63–125min. However,
these results should be interpreted cautiously because the
targeted cells could survive even when GR is completely
inhibited because the thioredoxin system, working in parallel,
seems to be capable of maintaining high GSSG fluxes.54
Experimental
Cell culture
The porcine control (161-C) and tumor (161-T) cell lines were
maintained at 37 1C in 5% CO2 in Dulbecco’s modfied eagle
medium (DMEM)/F-10, supplemented with 15% fetal bovine
serum, streptomycin (5000 U L�1), penicillin (5000 U L�1),
and fungizone (250 mg L�1) in T-75 cell culture flasks (Costar,
Cambridge, MA). Chinese hamster ovary (CHO) fibroblasts
were cultured in Dulbecco’s modified eagle medium (DMEM)
supplemented with 10% FetalPlex and above mentioned
antibiotics. Mammal cells transfected with the sensor were
cultured in presence of G418 (15 ml ml�1).
Genetic constructs
Redox-sensitive linker (RL) RL7 and polyproline linker P14
were designed using methods similar to those described
earlier.22 New constructs CY-RL7 and CY-P14 (Fig. 1(b,c)
were built by the insertion of linkers between ECFP/EYFP
pair cloned into mammalian vector pECFP-C.
Microchannel
All cells were subsequently seeded in Ibidi m-Slide VI with tissue
culture treated coating (Model #: 80606) at density close to 50%
confluency, approximately 24 h prior to observation. The
flowchamber has six microchannels with the following
dimensions: 0.4 mm � 3.8 mm � 17 mm long and with a 30 mlvolume. Cells were observed in DMEMmedium without phenol
red and subsequently oxidized with 1 mM diamide
((CH3)2NCONQNCON(CH3)2, Sigma Chemical) in DMEM
solution. The addition of diamide affected the pH of the solution
only marginally. DMEM without diamide showed a pH of 7.95,
while DMEM with diamide showed a pH of 8.27. For
physiological redox recovery experiments the diamide was
washed out after 3–5 min with the initial DMEM medium. A
photograph of a microchannel with tubing for fluid exchange is
shown in Fig. 2(a). Fluids are always removed from one side by a
waste collection tube and refilled from the other side by either
DMEM ll-in tube or diamide in DMEM ll-in tube (Fig. 2(a)).
The wash passed twice the reservoir volume (2�70 mL) throughthe 30 mL channel.
FRET microscopy
The time development of FRET in ROIs in the cell was
examined. Cells were imaged on a Zeiss Axio-Observer
inverted microscope with a Zeiss Achroplan 100� oil
immersion objective (1.3NA). The microscope is equipped
Dow
nloa
ded
on 2
8 D
ecem
ber
2010
Publ
ishe
d on
http
://pu
bs.r
sc.o
rg |
doi:1
0.10
39/C
0IB
0007
1JView Online

This journal is c The Royal Society of Chemistry 2010 Integr. Biol.
with an environmental chamber that is temperature controlled
to 37 1C during live cell imaging. In addition, a m-slide (Ibidi,Germany) was placed inside a closed microincubator
(BioscienceTools, TC-MI) for more accurate CO2 control. A
Pecon CO2 controller controls 5% CO2 content as measured
inside the controller and not at the slide location. Images were
taken with 1024 � 1024 EMCCD camera (Andor, DU-888)
operated at �70 1C.
The inverted microscope has a three-filter cube system for
FRET assay.25 A three-filter cube system eliminates the
cross-talk between donor and acceptor fluorescence with
carefully selected fluorophore pairs. Thus, FRET analysis
was performed with three channels: FRET, CFP and YFP.
The FRET channel was defined by an excitation filter with a
438/24 nm center wavelength/bandwidth, a dichroic mirror
with a 458 nm edge wavelength, and an emission filter
542/27 nm. Similarly, the CFP channel filter parameters
were excitation 438/24 nm, dichroic edge at 458 nm, emission
483/32 nm. The YFP had an excitation filter 500/24 nm with
a dichroic edge at 520 nm and an emission filter at 542/27
nm. The excitation was provided by a EXFO X-Cite
120 metal halide lamp operated at 12% iris to reduce
photobleaching. To minimize photobleaching the exposure
times were kept at 20 ms using a camera high gain (typically
50 to 100 on the scale 0–255) with images taken every
15–60 s. Data acquisition and analysis was automated
using NI Labview.
Fluorescence images were background-corrected by manual
selection of cell-free regions. FRET analysis was based on
mean values taken over regions of interest (ROI) within the
cells or was carried out pixel by pixel as shown in Fig. 2. To
account for slight cell movements that occur during the time
lapse acquisition, the ROIs were automatically adjusted to
track the same regions. ROIs were chosen randomly for each
cell and a net FRET (nF) was calculated according to:
nF = IFRET � IYFP � a � ICFP � b where IFRET, IYFP
and ICFP are fluorescence intensities in each ROI.
Coefficients a and b are the norms of bleed-through to FRET
channel from EYFP and ECFP, respectively.25 The coefficient
a was determined as a fraction of yellow light excited by
438 nm light relative to 500 nm excitation when cells
expressing only EYFP are used. Similarly, b is determined as
a fraction, IFRET /ICFP, when cells expressing only ECFP are
measured. For our system a = 0.19, b = 0.47.
In these experiments, the expression level of the FRET
biosensor varied from cell to cell. To reliably quantify FRET
signal in cells independent of the expression levels of redox
biosensor, the net FRET was normalized against expression
levels of ECFP and EYFP throughNFRET ¼ nF=ffiffiffiffiffiffiffiffiffiffiffiffiffiffiffiffiffiffiffiffiffiffiffiffi
IYFP � ICFPp
as described elsewhere.25 This normalization procedure is seen
to remove the stochastic variation in FRET from cell to cell.
Moreover, while the FRET channel accurately reflects the
oxidative state of the cell, the dynamics in the recovery
region exhibited a common increase in intensities in all
channels. nF, the amplitude of the response to oxidation,
increased but an increase of the signal in the recovery region
was also observed. The NFRET normalization removes this
effect and shows a return to the original redox state found prior
to the application of diamide.
Unexpectedly, a reproducible peak in the FRET signal is
observed just after the diamide is flushed from the microfluidic
(as illustrated in Fig. 2(f,g)). This peak in the recovery varies in
size from experiment to experiment, but is not affected by a
change in flow in the microfluidic, and it disappears completely
if the diamide concentration is stepped to zero over a 5 min
interval, or after cell pretreatment with BSO or BCNU (as
illustrated in Fig. 3(g,i)).
Confocal microscopy and image processing
To illustrate explicitly the 3D aspects of the FRET response
cells were imaged using a laser scanning confocal microscope
(Zeiss LSM 710) with a 40�, 1.2NA water immersion objective
and with a pinhole size of set at 31 mm and scaling in x, y, and z
were 0.198 � 0.198 � 0.400 mm, respectively. CFP and FRET
images were excited with a 458 nm laser and collected
using a 465–490 nm and 540–580 nm filters respectively.
Eighteen z-stack images were taken every 2 min. Images were
deconvolved with Huygens (SVI) and iso-surfaces constructed
from confocal image stacks with Imaris software (Bitplane)
incorporating MATLAB(Mathworks). We estimate a typical
lateral and axial resolution to be 0.61*l/NA = 285 nm and
2l/(NA)2 = 778 nm, respectively.
Acknowledgements
We gratefully acknowledge support from NSF TH2008-01040
ANTC (GT) and from NIHEB004513 (PJAK & HRG).
References
1 N. Ballatori, S. M. Krance, S. Notenboom, S. J. Shi, K. Tieu andC. L. Hammond, Biol. Chem., 2009, 390(3), 191–214.
2 S. Mena, A. Ortega and J. M. Estrela,Mutat. Res., Genet. Toxicol.Environ. Mutagen., 2009, 674(1–2), 36–44.
3 S. G. Menon, E. H. Sarsour, D. R. Spitz, R. Higashikubo,M. Sturm, H. Zhang and P. C. Goswami, Cancer Res., 2003,63(9), 2109–2117.
4 P. Hainaut and J. Milner, Cancer Res., 1993, 53(19), 4469–4473.5 P. Chiarugi, IUBMB Life, 2001, 52(1), 55–59.6 J. E. Conour, W. V. Graham and H. R. Gaskins, PhysiologicalGenomics, 2004, 18(2), 196–205.
7 D. P. Jones, Y. M. Go, C. L. Anderson, T. R. Ziegler,J. M. Kinkade and W. G. Kirlin, FASEB J., 2004, 18(9), 1246–8.
8 O. Bjornberg, H. Ostergaard and J. R. Winther, Antioxid. RedoxSignaling, 2006, 8(3–4), 354–361.
9 A. Meister and M. E. Anderson, Annu. Rev. Biochem., 1983, 52,711–60.
10 O.W. Griffith and R. T.Mulcahy,Adv. Enzymol. Relat. AreasMol.Biol., 1999, 73, 209–67.
11 F. Ursini, M. Maiorino, R. Brigeliusflohe, K. Aumann, A. Roveri,D. Schomburg and L. Flohe, Biothiols, Pt. B, Methods Enzymol.,1995, 252, 38–53.
12 A. Meister, J. Biol. Chem., 1988, 263(33), 17205–8.13 A. Holmgren and F. Aslund,Methods Enzymol., 1995, 252, 283–92.14 H. Ostergaard, A. Henriksen, F. G. Hansen and J. R. Winther,
EMBO J., 2001, 20(21), 5853–62.15 G. T. Hanson, R. Aggeler, D. Oglesbee, M. Cannon, R. A. Capaldi,
R. Y. Tsien and S. J. Remington, J. Biol. Chem., 2003, 279(13),13044–53.
16 M. Gutscher, A.-L. Pauleau, L. Marty, T. Brach, G. H. Wabnitz,Y. Samstag, A. J. Meyer and T. P. Dick, Nat. Methods, 2008, 5(6),553–559.
17 D. J. Cline, C. Thorpe and J. P. Schneider, Anal. Biochem., 2004,325(1), 144–50.
18 K. Lee, V. Dzubeck, L. Latshaw and J. P. Schneider, J. Am. Chem.Soc., 2004, 126(42), 13616–7.
Dow
nloa
ded
on 2
8 D
ecem
ber
2010
Publ
ishe
d on
http
://pu
bs.r
sc.o
rg |
doi:1
0.10
39/C
0IB
0007
1JView Online

Integr. Biol. This journal is c The Royal Society of Chemistry 2010
19 E. W. Miller, S. X. Bian and C. J. Chang, J. Am. Chem. Soc., 2007,129(12), 3458–9.
20 M. Fricker, J. Runions and I. Moore, Annu. Rev. Plant Biol., 2006,57, 79–107.
21 D. M. Chudakov, S. Lukyanov and K. A. Lukyanov, TrendsBiotechnol., 2005, 23(12), 605–13.
22 V. L. Kolossov, B. Q. Spring, A. Sokolowski, J. E. Conour,R. M. Clegg, P. J. A. Kenis and H. R. Gaskins, Exp. Biol. Med.,2008, 233(2), 238–48.
23 S. J. Adam, L. A. Rund, K. N. Kuzmuk, J. F. Zachary,L. B. Schook and C. M. Counter, Oncogene, 2007, 26(7),1038–1045.
24 A. Miyawaki, J. Llopis, R. Heim, J. M. McCaffery, J. A. Adams,M. Ikura and R. Y. Tsien, Nature, 1997, 388(6645), 882–7.
25 Z. P. Xia and Y. H. Liu, Biophys. J., 2001, 81(4), 2395–2402.26 W. Timp, U. Mirsaidov, P. Matsudaira and G. Timp, Lab Chip,
2009, 9(7), 925–934.27 H. Yu, C. M. Alexander and D. J. Beebe, Lab Chip, 2007, 7,
726–730.28 M. Adler, M. Polinkovsky, E. Gutierrez and A. Groisman, Lab
Chip, 2010, 10, 388–391.29 N. S. Kosower and E. M. Kosower, Methods Enzymol., 1995, 251,
123–133.30 N. S. Kosower, E. M. Kosower, B. Wertheim and W. S. Correa,
Biochem. Biophys. Res. Commun., 1969, 37, 593–596.31 F. Q. Schafer and G. R. Buettner, Free Radical Biol. Med., 2001,
30(11), 1191–212.32 J. M. Hansen, Y. M. Go and D. P. Jones, Annu. Rev. Pharmacol.
Toxicol., 2006, 46, 215–34.33 J. T. Hancock, R. Desikan, S. J. Neill and A. R. Cross, J. Theor.
Biol., 2004, 226(1), 65–68.34 V. L. Kolossov, B. Q. Spring, J. J. Henry, A. Sokolowski,
R. M. Clegg, P. J. A. Kenis, H. R. Gaskins, in press.35 A. Meister, J. Biol. Chem., 1994, 269(13), 9397–9400.36 H. Kamencic, A. Lyon, P. G. Paterson and B. H. J. Juurlink, Anal.
Biochem., 2000, 286(1), 35–7.
37 C. T. Dooley, T. M. Dore, G. T. Hanson, W. C. Jackson,S. J. Remington and R. Y. Tsien, J. Biol. Chem., 2004, 279(21),22284–93.
38 C. Cereser, S. Boget, P. Parvaz and A. Revol, Toxicology, 2001,163(2–3), 153–62.
39 J. G.Muller, U. S. Bucheler, K. Kayser, R. H. Schirmer, D.Wernerand R. L. Krauth-Siegel, Cell. Mol. Biol., 1993, 39, 389–396.
40 M. S. Attene-Ramos, K. Kitiphongspattana, K. Ishii-Schrade andH. R. Gaskins, Am. J. Physiol.: Cell Physiol., 2005, 289(5),C1220–C1228.
41 J. M. Mates, J. A. Segura, C. Perez-Gomez, L. Rosado, L. Olalla,M. Blanca and F. M. Sanchez-Jimenez, Blood Cells, Mol. Dis.,1999, 25(7), 103–109.
42 N. Ballatori, S. M. Krance, S. Notenboom, S. J. Shi, K. Tieu andC. L. Hammond, Biol. Chem., 2009, 390(3), 191–214.
43 S. Mena, A. Ortega and J. M. Estrela,Mutat. Res., Genet. Toxicol.Environ. Mutagen., 2009, 674(1–2), 36–44.
44 S. G. Menon, E. H. Sarsour, D. R. Spitz, R. Higashikubo,M. Sturm, H. Zhang and P. C. Goswami, Cancer Res., 2003,63(9), 2109–2117.
45 J. Smith, E. Ladi, M. Mayer-Proschel and M. Noble, Proc. Natl.Acad. Sci. U. S. A., 2000, 97(18), 10032–10037.
46 P. Hainaut and J. Milner, Cancer Res., 1993, 53(19), 4469–4473.47 R. E. Shackelford, W. K. Kaufmann and R. S. Paules, Free Radical
Biol. Med., 2000, 28(9), 1387–1404.48 M. Hinz, D. Krappmann, A. Eichten, A. Heder, C. Scheidereit and
M. Strauss, Mol. Cell. Bio., 1999, 19(4), 2690–2698.49 J. D. Black, Front. Biosci., 2000, 5, D406–D423.50 P. Chiarugi, IUBMB Life, 2001, 52(1), 55–59.51 J. E. Conour, W. V. Graham and H. R. Gaskins, Physiol.
Genomics, 2004, 18(2), 196–205.52 W. C. Burhans and N. H. Heintz, Free Radical Biol. Med., 2009,
47(9), 1282–1293.53 D. Hanahan and R. A. Weinberg, Cell, 2000, 100(1), 57–70.54 S. M. Kanzok, R. H. Schirmer, I. Turbachova, R. Iozef and
K. Becker, J. Biol. Chem., 2000, 275(51), 40180–40186.
Dow
nloa
ded
on 2
8 D
ecem
ber
2010
Publ
ishe
d on
http
://pu
bs.r
sc.o
rg |
doi:1
0.10
39/C
0IB
0007
1JView Online