Embed Size (px)
Citation preview
Integrating Talent Management to
Drive Business Outcomes
Scott P. Mondore, Ph.D.
Shane S. Douthitt, Ph.D.
Strategic Management Decisions

Learning Objectives
• Link core talent management processes (e.g., performance
management, employee surveys, succession planning, etc.)
to key business outcomes.
• Calculate the ROI for talent management processes.
• Integrate the key HR drivers of business outcomes into a
unified dashboard for senior leaders, front-line managers, and
staff.
• Build a compelling business case for investing in talent
management initiatives – transform HR into a profit center!
2

About SMD: Driving Business Results Through Talent Management
Our Platform
• Implement Talent Management processes based on analytics, linking people to critical business outcomes
• Partner with our clients to create and execute people strategies that drive business outcomes and maximize ROI
Our Results
• Linkage of Talent Management (e.g., engagement survey results, training, performance ratings, competency assessments) to a variety of business outcomes:
▫ Operations Metrics (e.g., operating margin)
▫ Financial Metrics (e.g., sales dollars, productivity)
▫ Customer Satisfaction
▫ Turnover/Retention
▫ Employee Safety
• Significant bottom-line improvements and return-on-investment for our clients.
Connecting Employees
to Business Results • HR Strategy & Planning
• Human Capital Measurement
• Talent Management
• Leadership Development
• Executive Assessment & Coaching
• Organizational Effectiveness 3

Session Agenda
• The current state of Talent Management
• Building an Integrated Talent Management platform:
– Linking talent management data to business outcomes
– Strategically prioritizing talent management initiatives
– Calculating an ROI for talent management initiatives
– Bringing HR data and initiatives to front-line leaders
4

Applied Research and Trends

The Impact of Human Resources
www.metrus.com
38%
41%
42%
44%
44%
46%
46%
46%
48%
52%
58%
68%
0% 20% 40% 60% 80%
Marketing
Human Resources
Procurement
Legal
Research & Development
Finance/Accounting
Security
IT
Communications/Public Affairs
Customer Service
Manufacturing/Operations
Quality
Organizational Impact Ratings by Department
% High Impact
6

What Our Clients Are Saying…
“I need to prove the bottom line value of talent management initiatives.”
“HR is always the first place Sr. Leaders look to cut expenses.”
“We don’t have the resources for these types of analytics.”
“We say our people are the key, but we don’t invest much in them.”
“I can never get the funding for HR investments.”
7

Typical Approach to Talent Management
• Focus on independent execution of individual talent
management processes
• Assume that people investments drive business
performance…but struggle to demonstrate the impact
• React to customer needs and to requests; Limited
ability to influence leaders without a true business case
• Limited resources and focus on execution limits ability
to take actions that drive business performance
• Often viewed as a barrier by front-line leaders
8

The Opportunity
• To identify the people factors (e.g., competencies, skills,
experiences, etc.) that drive business outcomes.
• To build a compelling business case based on ROI.
• To make talent management investment decisions based
on facts and data – not assumptions.
• To integrate talent management tools/processes and
align with strategic business priorities.
• To be viewed as a strategic partner that drives business
results – transform HR into a profit center!
9

Rethink Your Approach to HR

RETHINK Your Approach to HR!
Make HR a Profit Center
• Quantify the impact of employees on business outcomes
• Calculate an expected ROI for investments in employees
• Define the relationship between HR processes and business outcomes
Connect Key HR Processes
• Provide a single, integrated view of key HR processes
• Reduce your HR related costs through integration and strategic alignment
• Connect HR processes to business results
Spend More Time Driving Results
• Align HR professionals, organizational leaders, & employees to focus on actions that drive results
• Provide customized analytics and simplified reporting through business-focused scorecards
11

Integrate Key HR Processes
Business Outcomes
Performance Management
Selection
Employee Survey
360 Feedback
Succession Planning
Competency Builder
Career Development
Training
Examples of Business Outcomes
People • Turnover • Employee Engagement
Service • Customer Satisfaction • Wait Times
Quality • Clinical Outcomes • Product Defects
Finance • Performance to Budget • Cost Reduction
Growth • Sales Growth • Margin Growth
12

Link People Data to Business Outcomes:
Business Partner RoadMapTM
13
AN
ALY
ZE
Analyze linkages between data and business outcomes to identify key drivers of performance
AC
T Translate results into action by providing senior and frontline leaders with easy-to-interpret reports and follow-up training
AC
HIE
VE Track results/goals on
leader’s performance plans and the organization’s balanced scorecard
1. Determine Critical Outcomes
2. Create Cross-Functional Data
Team
3. Assess Measures
4. Analyze the Data
5. Build Program & Execute
6. Measure & Adjust

Analytic Approach:
Structural Equation Modeling
• Traditional data analysis includes: • Qualitative analysis or gap analysis (strengths/weaknesses) • Correlation • Regression
• Advantages of SEM: • Consider multiple independent & dependent measures
concurrently • Imply causality • Calculate ROI • Correct for measurement errors
• SEM is commonly used in other industries (econometrics, market research)
14

15
Critical Business Outcome (e.g. Sales)
Leadership Competencies
Personality Factors
Experience
The linkage analysis will demonstrate the level of impact that each competency, experience, skill, etc. has on individual performance and business outcomes. This allows leaders to focus on the most important competencies, skills, experiences and determine the appropriate level to invest in developing each area.
Employee Attitudes
Technical Skills/Abilities
Execution Competencies
Hire, train, & reward based on KNOWN drivers of bottom line results!
Analytic Approach:
Identify Drivers of Business Outcomes

A Case Study

Background
• Large retail organization with over 1,000 stores nationally
• Currently losing $93 million annually to product shrink
Proposed Solution
Create a Business-Focused HR Strategy:
• Empirically link employee data to meaningful business outcomes (e.g., shrink)
• Identify ‘invisible levers’ in employee attitudes, skills and behaviors that will drive outcomes
• Leverage existing data to create the strategic framework
• Prioritize employee-focused interventions to drive improvements in performance on business outcomes
• Provide customized solutions to target strategic priorities and drive bottom line performance
Case Study:
Background and Proposed Solution
17

Case Study:
Collection of Data
Business Outcomes
2. Performance Management
Selection
3. Employee
Survey
360 Feedback
Succession Planning
4. Competency
Builder
Career Development
1. Training
Talent Management Data
1. LMS Training Completion Data
2. Performance Ratings
3. Employee Opinion Survey Results
4. Competency Ratings
18
Business Outcome Data
People: Store Turnover
Service: Customer Satisfaction
Quality: Store-Level Shrink
Finance: Store-Level Costs

Case Study:
Employee Survey Dimensions
19
Engagement
Regard for Employees
Manager Effectiveness
Career Development
Recognition & Perf. Mgmt.
Resources Available
Job-Person Match
Policies Hours Worked
Customer Focus Work Environment
Benefits
Each dimension was comprised of 2 to 5 survey items.
Coefficient Alphas ranged from 0.79 to 0.91.

Case Study:
Salaried Employee Competencies
20
Employee Development Leadership
Strategic Decision Making
Cross-Organizational Collaboration &
Teamwork
Execute With Excellence Achieve Extraordinary
Results
Individual Competency Ratings for the Store Manager and Assistant Mangers were used.

Case Study:
Identifying Drivers of Shrink
21
Shrink Legend
Employee Survey
Training Participation
Terminations
Competency Ratings
1a
Numbers in paths indicate the intervention priority based on the magnitude of the relationship with shrink.
Job-Person Match
Manager Effectiveness
Engagement
Dishonesty Terminations
Ethics Course Participation
Achieve Results
Shrink Course Participation
1b
1
2
2
2
3

Case Study:
Prioritizing the Drivers of Shrink
• The drivers of shrink can be further prioritized based on the magnitude of their relationship with shrink:
1. Achieving Extraordinary Results Ethics Course
2. Shrink Course
3. Dishonesty Terminations
4. Job-Person Match
22

Case Study:
Intervention Framework
23
People Technology Process

Case Study:
Planned Interventions & Cost
• Build optional shrink training courses for specific roles
• Budget: $300k Training
• Deploy a store-level incentive program for meeting quarterly shrink goals
• Budget: $5 million
Recognition & Reward
• Nothing planned Selection
• Insert shrink focused messaging in a larger “customer experience” initiative
• Budget: $250k
OD & Leadership
Development 24

Code of Ethics Course
• Course participation has a direct, significant impact on shrink (i.e., higher participation, lower shrink)
• Opportunity to re-train or conduct refresher courses with managers and employees
• Reinforce training by having Senior Leaders regularly re-communicate the key messages from the Code of Ethics
Sales and Shrink Course
• Course participation has a direct, significant impact on shrink (i.e., higher participation, lower shrink)
• Currently not mandatory
• Opportunity to make the course mandatory and re-train all managers and employees
Case Study:
Recommended Training Interventions
25

Case Study:
Revised Interventions & Cost
• Enhance and update ethics and shrink course – make both mandatory
• Budget: $50k Training
• Nothing Planned Recognition &
Reward
• Improve selection process for front-line employees – background checks & integrity testing
• Budget: $2 million Selection
• Develop shrink management routines
• Develop shrink partnering program
• Budget: $50k
OD & Leadership
Development 26

Case Study:
Actions Taken and Actions Cut
• Initial budget was $5.55 million
• Revised budget was $2.1 million – Cut incentive plan
– Cut major training build
– Cut “shrink focused” customer experience programs
• Data-Driven Rationale: – Did not identify pay/benefits as a major driver of shrink
– Showed the existing training courses were having an impact
– Did not identify “customer focus” as a major driver of shrink
– Showed that “dishonesty terminations” were a significant driver of shrink
• Created an HR Strategy with a known impact on shrink
27

ROI Calculation

Case Study:
Drivers of Shrink
29
Shrink Legend
Employee Survey
Training Participation
Terminations
Competency Ratings
1a
Numbers in paths indicate the intervention priority based on the magnitude of the relationship with shrink.
Job-Person Match
Manager Effectiveness
Engagement
Dishonesty Terminations
Ethics Course Participation
Achieve Results
Shrink Course Participation
1b
1
2
2
2
3

Calculating Impact & ROI
Intervention Impact Level (Beta)
Potential Shrink Impact Level of Investment
Manager Competency .14 $13.0 million Under-investing
Ethics Course .10 $9.3 million Under-investing
Shrink Course .09 $8.4 million Under-investing
Dishonesty Terminations -.08 $7.4 million Under-investing
Engagement .04 $3.7 million Appropriate
Reward & Recognition ns ns Over-investing
Customer Satisfaction ns ns Over-investing
• Currently losing $93 million in annualized shrink
• Example: Average Manager Competency score of 3.92
Improving the average score by 0.30 could result in additional savings of $984,897
Approximate cost of $200,000 (build, employee time)
Expected ROI: 497%
Actual Impact: Reduced annual shrink to $43 million in 1.5 years 30

The Integrated HR Dashboard

Integrating Line-of-Business and
HR Priorities
LOB Priorities
Linkage Priorities
HR Priorities
BECOMING A STRATEGIC BUSINESS PARTNER
32

Ease of Access to
Core HR Processes & Business Drivers
33

Impact on Revenue (Beta Weight)
Pe
rfo
rma
nce
Tools for Prioritizing Interventions:
Strategic Survey HeatMap
34

Dimensions falling within the Focus area are key drivers of business outcomes (e.g., Net Revenue) that are scoring below the target/goal level of performance.
Tools for Prioritizing Interventions:
Key Focus Area Dimensions/Items
35
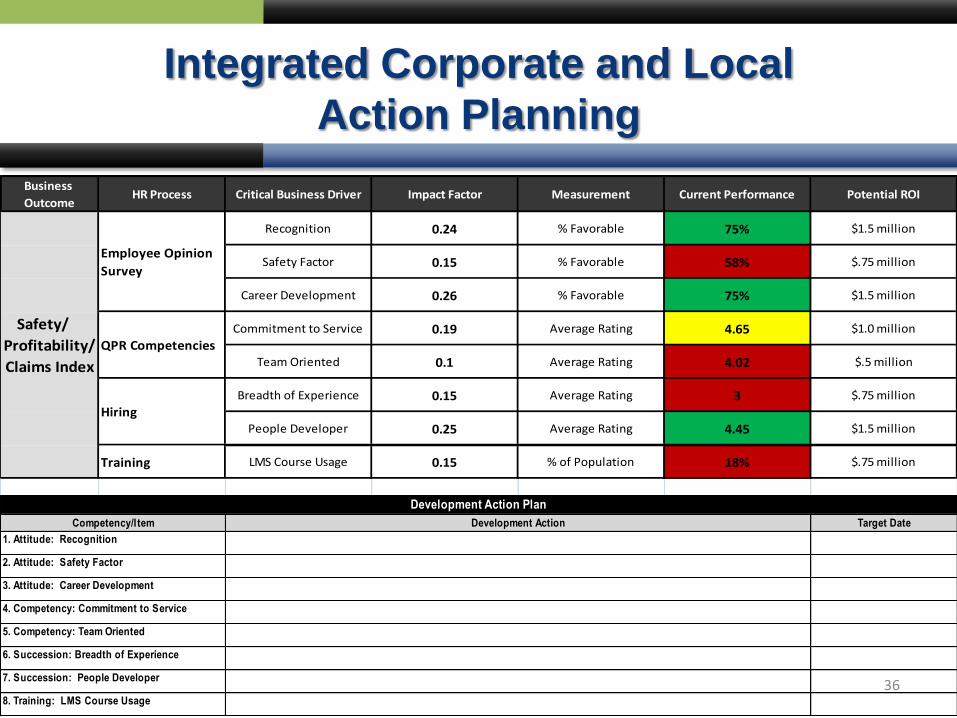
Integrated Corporate and Local
Action Planning
Business
OutcomeHR Process Critical Business Driver Impact Factor Measurement Current Performance Potential ROI
Recognition 0.24 % Favorable 75% $1.5 million
Safety Factor 0.15 % Favorable 58% $.75 million
Career Development 0.26 % Favorable 75% $1.5 million
Commitment to Service 0.19 Average Rating 4.65 $1.0 million
Team Oriented 0.1 Average Rating 4.02 $.5 million
Breadth of Experience 0.15 Average Rating 3 $.75 million
People Developer 0.25 Average Rating 4.45 $1.5 million
Training LMS Course Usage 0.15 % of Population 18% $.75 million
Target Date
4. Competency: Commitment to Service
5. Competency: Team Oriented
Employee Opinion
Survey
QPR Competencies
Hiring
Safety/
Profitability/
Claims Index
Development Action Plan
Competency/Item
1. Attitude: Recognition
2. Attitude: Safety Factor
3. Attitude: Career Development
Development Action
6. Succession: Breadth of Experience
7. Succession: People Developer
8. Training: LMS Course Usage
36

Integrated Scorecard Aligned to
Business Outcomes
Business Outcome
HR Process Business Drivers Impact Measurement Current Performance Estimated ROI
GR
OW
TH:
Incr
eas
e R
eve
nu
e b
y $
10
mill
ion
Employee Opinion Survey
Leadership 0.24 % Top Box 75% $1.5 million
Safety 0.15 % Top Box 58% $1.0 million
Career Development 0.26 % Top Box 85% $1.5 million
360 Feedback (Competency Assessment)
Commitment to Service 0.19 Average ‘Other’ Rating (1 – 7)
4.65 $1.0 million
Team Oriented 0.10 Average ‘Other’ Rating (1 – 7)
4.02 $1.0 million
Selection
Commitment to Service 0.22 Average Rating (1 – 7)
5.04 $1.5 million
Communication 0.15 Average Rating (1 – 7)
5.85 $1.0 million
Succession Planning
Performance 0.32 Average Performance Rating (1 – 5)
3.90 $2.0 million
Breadth of Experience 0.15 Average Rating (1 – 5)
3.00 $1.0 million
People Developer 0.25 Average Rating (1 – 5)
4.45 $1.5 million
37

Practical Tips
• “Apples to Apples” Comparison: Line up each leader’s or employee’s individual data (e.g. 360, employee survey) with their performance outcomes (e.g. percent to goal on business outcomes)
• Identify Key Drivers: Run statistical analyses (i.e., SEM) to identify the individual factors that evidence the strongest relationships with performance outcomes
• Utilize local universities/graduate student if in-house statistical expertise is not available
• Leverage your existing talent management platform (if you have one); Where possible, look to integrate talent management tools and processes
38

What We Have Covered
How to make Talent Management business-focused by:
• Linking core talent management processes (e.g., performance management, employee surveys, succession planning, etc.) to key business outcomes.
• Calculating the ROI for talent management processes.
• Integrating the key HR drivers of business outcomes into a unified dashboard for senior leaders, front-line managers, and staff.
• Building a compelling business case for investing in talent management initiatives – transform HR into a profit center!
39

Q&A
Scott Mondore, Ph.D. Managing Partner
[email protected] 404.808.4730
To Contact Us:
Shane Douthitt, Ph.D. Managing Partner
[email protected] 704.975.6820
www.smdhr.com

Presenter Bio – Scott Mondore
Scott Mondore, PhD
Scott has over 15 years of experience in the areas of strategy, talent management, measurement, customer experience and organizational development. He has internal and consulting experience across a variety of industries including transportation, healthcare, manufacturing, pharmaceuticals, utilities, and hospitality.
Scott is currently a managing partner of Strategic Management Decisions (SMD). Before SMD, he served as East Region President for Morehead Associates, a healthcare HR company. Before joining Morehead, Scott worked as a Corporate Strategy Director at Maersk, Inc. He also worked as an Organizational Effectiveness Leader at UPS, focusing on employee assessment and measurement as well working as a consultant to large and small organizations in both the private and public sector.
He is the co-author of “Investing in What Matters: Linking Employees to Business Outcomes” and “Business Focused HR: 11 Processes to Drive Results.” He has also published several articles on various topics, including employee turnover, employee safety, coaching, litigation and leadership. Scott is an Adjunct Professor of Psychology at the University of Georgia, Fairleigh Dickinson University & the University of North Carolina-Charlotte.
Scott holds a Master's degree and Doctorate in Applied Psychology from the University of Georgia.
42

Presenter Bio – Shane Douthitt
Shane Douthitt, PhD
Shane S. Douthitt, Ph.D. is a managing partner of Strategic Management Decisions (SMD). He has
more than 15 years of experience in the areas of measurement, talent management, executive
assessment and coaching, and organizational development across a variety of industries including
banking, manufacturing, utilities, pharmaceuticals and information technology.
Shane is the co-author of “Investing in What Matters: Linking Employees to Business Outcomes”
(SHRM, 2009) and “Business-Focused HR: 11 Processes to Drive Results” (SHRM, 2011). In
addition, he has published several articles in leading journals on a variety of topics, including HR
strategy, measurement, teams, individual differences and diversity, employee selection, group
dynamics, and careers, and recently co-authored a leadership development article in the Center for
Creative Leadership’s quarterly periodical “Leadership in Action.”
Shane is an adjunct professor at the University of North Carolina-Charlotte and teaches
organizational science courses focusing on leadership and organizational development. He holds a
master's degree and doctorate in applied psychology from the University of Georgia, as well as a
master’s degree in Industrial/Organizational Psychology from the University of Tulsa.