Embed Size (px)
Citation preview
Integrating Synchrophasors and Oscillography for Wide-Area Power System Analysis
Dora Nakafuji, Hawaiian Electric Company Laura Rogers, Hawaii Electric Light Company
Jared Bestebreur, Michael Rourke, and Greg Zweigle, Schweitzer Engineering Laboratories, Inc.
Abstract—The Hawaii Electric Light Company has successfully implemented an automated system to collect synchrophasor and intelligent electronic device (IED) oscillographic reports. They are realizing the benefits of analyzing these two data types together. This paper shares power system disturbances from their system. It also discusses the advantages of integrating time-stamped synchrophasor and IED oscillographic reports together in one power system analysis application.
Modern IEDs provide high-accuracy, time-stamped power system measurements primarily in two formats—streaming synchrophasors and high-sample-rate oscillographic reports. Although historically these measurement classes have been treated separately, modern technology is bringing them together and enabling new applications.
Synchrophasor measurements are a growing part of real-time operations at utilities during power system disturbances. They provide operators and engineers with a window into the present operating condition of the power grid that is not visible with the typical supervisory control and data acquisition (SCADA) measurement rates.
Traditional post-disturbance analysis involves analyzing high-sample-rate oscillographic reports in order to understand the specific details of a disturbance and the IED operation during the disturbance. The advent of synchrophasors has driven the deployment of global timing signals to IEDs. Because of this, oscillographic reports are now time-stamped with the same high-precision timing source as synchrophasors.
Combining synchrophasor measurements and IED oscillographic reports during post-disturbance analysis provides a wide-area context for a better understanding of the conditions leading up to and following a disturbance. Furthermore, integrating the collection of time-aligned IED oscillographic report summaries results in a system that automatically collects and displays these reports along with the synchrophasor data. These oscillographic report summaries can help further characterize the detected disturbance by providing IED information, fault location, fault current, and faulted phases to power system operations personnel.
I. INTRODUCTION Electric power systems can span hundreds of thousands of
square kilometers. The most economic configuration has much of the infrastructure above ground and exposed to the elements. The system includes a wide variety of generators, machines, transformers, conducting lines, towers, and other apparatus. As such, it is inevitable that disturbances will happen and interrupt or alter the normal flow of power. These events include short-circuit conditions, equipment failure,
weather-induced disruptions, and accidents leading to temporarily damaged equipment.
The electric power system includes a variety of protection and control devices that automatically sense and isolate these disturbances [1]. This minimizes the probabilities of permanent infrastructure damage and electric power-related injuries. With the advent of renewable generation, additional classes of disturbances, such as transient, weather-induced generation loss and localized islanding, are also possible.
Although it is preferable that these events not occur, detailed data capture and analysis provides the ability to learn much about their causes and impacts. Identifying the root cause helps engineers determine if the source of the problem was a temporary effect or if it was due to an inherent weakness in the system design that requires correcting. Engineers typically perform root cause analysis offline, well after the disturbance was detected and cleared.
Local, isolated disturbances can in some cases evolve into wide-area events. In these cases, it is important to maintain situational awareness of the event progression and sometimes even near real-time understanding of the underlying causes. Contingency studies cover many events that occur over seconds when there is little an engineer can do besides monitor the actions of automated controls. For more slowly evolving disturbances that span minutes or longer, it is helpful to receive fast information about the nature of the disturbance. This information can aid real-time analysis of the security of the power system and enable operators to take mitigating actions.
The applications of event files stored in protective relays and of synchrophasor data streamed from phasor measurement units (PMUs) have each contributed toward power system analysis. This paper describes in detail the design of a system that combines these two technologies. The system automatically retrieves event report files, collects streaming synchrophasor data, and then aligns both into a common portal for analysis. The Hawaii Electric Light Company (HELCO) implementation of this system is presented. The description includes the information network that was developed to support the required data rates, quality, and security. The paper shares the results of the analysis system, including the performance of the network and the availability of the data, and discusses a power system event that was effectively analyzed using a combination of event data and synchrophasors. The advantages of combining both high-

sample-rate local information with lower sample-rate wide-area information, all aligned to a common time reference, are demonstrated.
II. TECHNICAL OVERVIEW
A. Root Cause Analysis With Event Reports The intelligent electronic device (IED) event report is an
important tool for event analysis and was included with some of the first digital relays [2]. Originally, the event report contained data sampled at a variable rate of four times each cycle. The event report file was a human-readable ASCII document. The data in the file were aligned with respect to the relay trip time, and the relay included manually set internal time-keeping functionality.
As the computational and storage capacities of digital relays increased, the sampling rate of event report data and the associated event report file size similarly increased. By the early twenty-first century, relay event reports were sampled at an interval in the range of hundreds of microseconds. Recently, these reports have even pushed into the one-microsecond range [3]. Newer relays also have the capacity to generate fixed-rate event reports in addition to the frequency tracking variable rate described previously. Modern relay event reports enable great precision in analyzing and finding the root cause for events.
B. Synchrophasors for Wide-Area Analysis While offline event report analysis technology was
advancing, systems that included wide-area time-synchronized phasor measurements were also moving forward [4]. It was well known that the raw supervisory control and data acquisition (SCADA) system measurements used for real-time operations did not include phase angles. Phase angles were only available as outputs from a nonlinear power system state estimator. State estimator phase angle outputs do not typically update frequently enough to aid operators with real-time contingency mitigation.
Global positioning satellite systems enabled a new paradigm of power system measurement. Initially designed for high-accuracy position measurements, they also included high-precision time measurements as a side benefit. This technology provided the wide-area precise time synchronization mechanism necessary for direct phase angle measurements. Subsequently, synchrophasor measurement devices, also called PMUs, could be developed as a practical power system monitoring technology [5]. Unlike traditional SCADA processing, which is an asynchronously polled data acquisition approach, synchrophasors are inherently time-synchronized at standardized sampling intervals.
The increased penetration of synchrophasor measuring devices led to precise time signals becoming generally available in the substation. It was a natural progression to begin connecting these time sources to IEDs in addition to the PMUs. Therefore, the event reports generated by modern relays now include the same precise time synchronization as PMUs.
C. Local and Wide-Area Integration Although event reports and synchrophasors followed
separate paths of development, today they share important features. They are both sampled at a fixed rate, and they are both time-stamped to microsecond accuracy and precision. They also have important differences. The event report data are reported at thousands of samples per second, and each event report covers a local area of measurements. Synchrophasor data are typically reported at up to hundreds of samples per second and cover a wide area of measurements.
These similarities and differences have led to event reports and synchrophasors becoming a complementary approach for event analysis. Because they can both report data at a fixed rate, mathematically rigorous signal processing techniques are applicable. With their common time source, they are precisely aligned in time.
The diagram in Fig. 1 illustrates a system that consists of both of these types of data. The IED/PMU represents either two separate devices or a single multifunction device that includes a PMU. Each IED/PMU takes measurements from a local portion of the power system. The event files and synchrophasor data are sent to an analysis application for display. This basic architecture is elaborated in greater detail in Section III.
Analysis
Electric Power System
1 2
IED/PMU IED/PMU
Fig. 1. System for wide-area power system analysis.
Fig. 2 illustrates these two types of data integrated together in a common display. The event data consist of short segments of high-sample-rate measurements. Each segment is initiated by a triggering condition and spans a duration set by a post-fault setting. The individual event report samples are not shown because they are indistinguishable at this scale. For example, at 8,000 samples per second on a 60 Hz system, each period of the voltage or current waveform is sampled approximately 133 times. The reported event data are either the directly sampled power system oscillographic waveforms or minimally filtered waveforms.
1
2
12
PMU
Event
Fig. 2. Event data and synchrophasor (PMU) data.
The synchrophasor data consist of a sustained stream of reported values. There is no triggering mechanism and no possibility of missing data due to incorrect triggering. Synchrophasor streams can include power system magnitudes, angles, power, and frequency. Unlike event report data,
synchrophasor data undergo significant filtering to focus primarily on a narrow bandwidth around the nominal frequency.
In Fig. 2, the PMU data might represent the frequency or relative phase angle. The samples for each source are aligned in time. While the event report data are precisely time-stamped, they may not be sampled at the same instants as the synchrophasor data.
Note that synchrophasors are a streaming data format, while event reports are files that must be retrieved individually. This has limited the ability to use both approaches together for analysis. The system presented in this paper overcomes this difficulty through an automated approach for collecting events and presenting them alongside synchrophasors. Event files are gathered into a central repository and then integrated into the analysis software that also includes synchrophasor data. Common time stamps allow the precise alignment of these different types of data. The system described shortens the interval from the time an event occurs until the time both the synchrophasor data and event file data are available for analysis.
D. Application Overview The Hawaiian Islands are located far from the mainland
U.S.A. and therefore have limited access to energy resources. With the state’s recently announced 100-percent renewable portfolio standard (RPS), the Hawaiian utilities are working toward reliably accommodating an abundance of solar and wind energy. On the island of Hawaii, the power system routinely integrates over 50 percent renewable power from wind, geothermal, and solar resources, including high penetrations of distributed roof-top photovoltaic (PV) systems. On Hawaii, renewable sources are connected to a 69 kV transmission infrastructure; with no back-up interconnections to neighboring utilities for supporting generation, islanded grids are often subjected to significant voltage, frequency, and power swings during disturbance events. For example, a recent three-phase fault caused a frequency increase of 410 mHz and a voltage decline to 0.42 per unit [6].
To maintain and increase reliability, safety, and economic efficiency, the Hawaiian utilities are modernizing the grid and piloting a number of advanced technologies to develop new bounding conditions for operating the power system with high penetrations of renewables and more diverse distributed generating resources. Under the SynchroVIEEU project [7], one area of emphasis is improving both offline event analysis and real-time situational awareness. For real-time situational awareness, operators have been using synchrophasor technology since 2011.
III. SYSTEM DESIGN AND HAWAIIAN UTILITY IMPLEMENTATION
The system implemented by the Hawaiian utilities includes a number of primary systems and a wide-area network (WAN)
of IEDs. This section discusses the architecture and functions of each system and how they work in conjunction with each other.
A. Traditional Event Collection Systems As discussed in Section II, protective relays and other IEDs
measure and record information relative to power system disturbances in the form of event reports that contain local analog and digital measurements captured at user-configurable rates and durations. The IEDs store these reports locally in nonvolatile memory until such time that they can be retrieved and subsequently deleted from the relay. Many utilities use these reports as a key part of post-event analysis and corrective action development. Event reports related to certain primary apparatus must be collected and stored securely to comply with regulatory requirements.
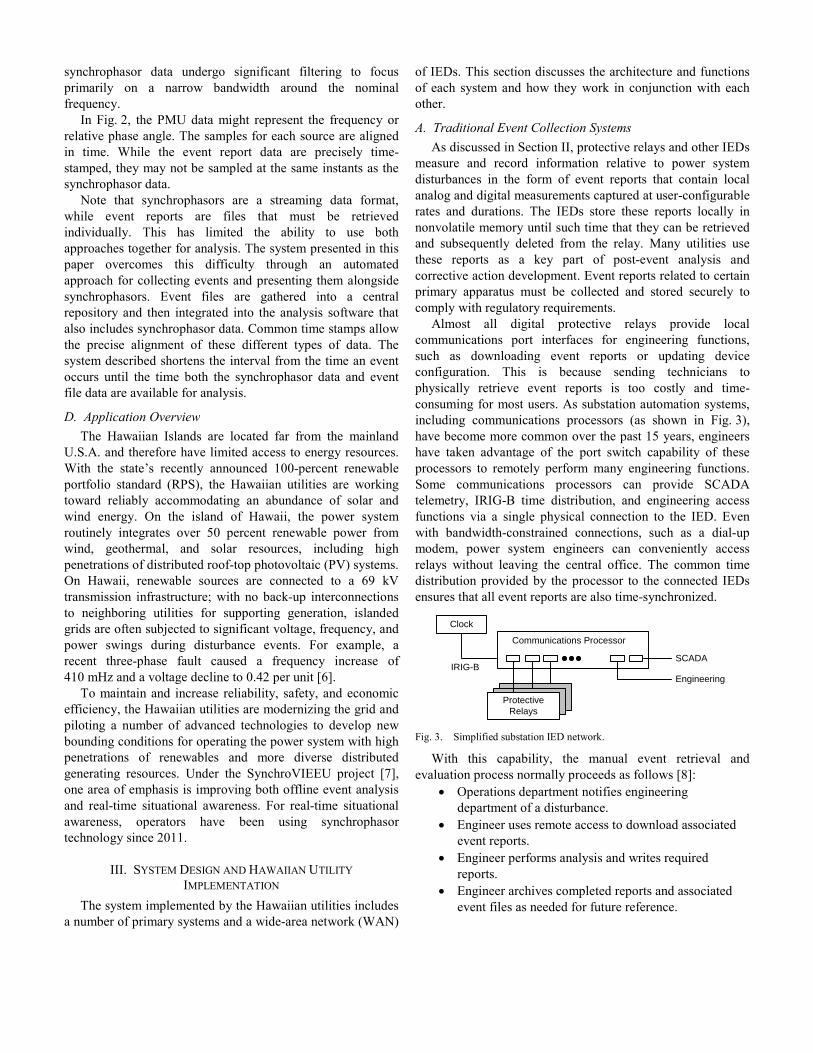
Almost all digital protective relays provide local communications port interfaces for engineering functions, such as downloading event reports or updating device configuration. This is because sending technicians to physically retrieve event reports is too costly and time-consuming for most users. As substation automation systems, including communications processors (as shown in Fig. 3), have become more common over the past 15 years, engineers have taken advantage of the port switch capability of these processors to remotely perform many engineering functions. Some communications processors can provide SCADA telemetry, IRIG-B time distribution, and engineering access functions via a single physical connection to the IED. Even with bandwidth-constrained connections, such as a dial-up modem, power system engineers can conveniently access relays without leaving the central office. The common time distribution provided by the processor to the connected IEDs ensures that all event reports are also time-synchronized.
Clock
IRIG-BSCADA
Engineering
Communications Processor
Protective Relays
Fig. 3. Simplified substation IED network.
With this capability, the manual event retrieval and evaluation process normally proceeds as follows [8]:
• Operations department notifies engineering department of a disturbance.
• Engineer uses remote access to download associated event reports.
• Engineer performs analysis and writes required reports.
• Engineer archives completed reports and associated event files as needed for future reference.
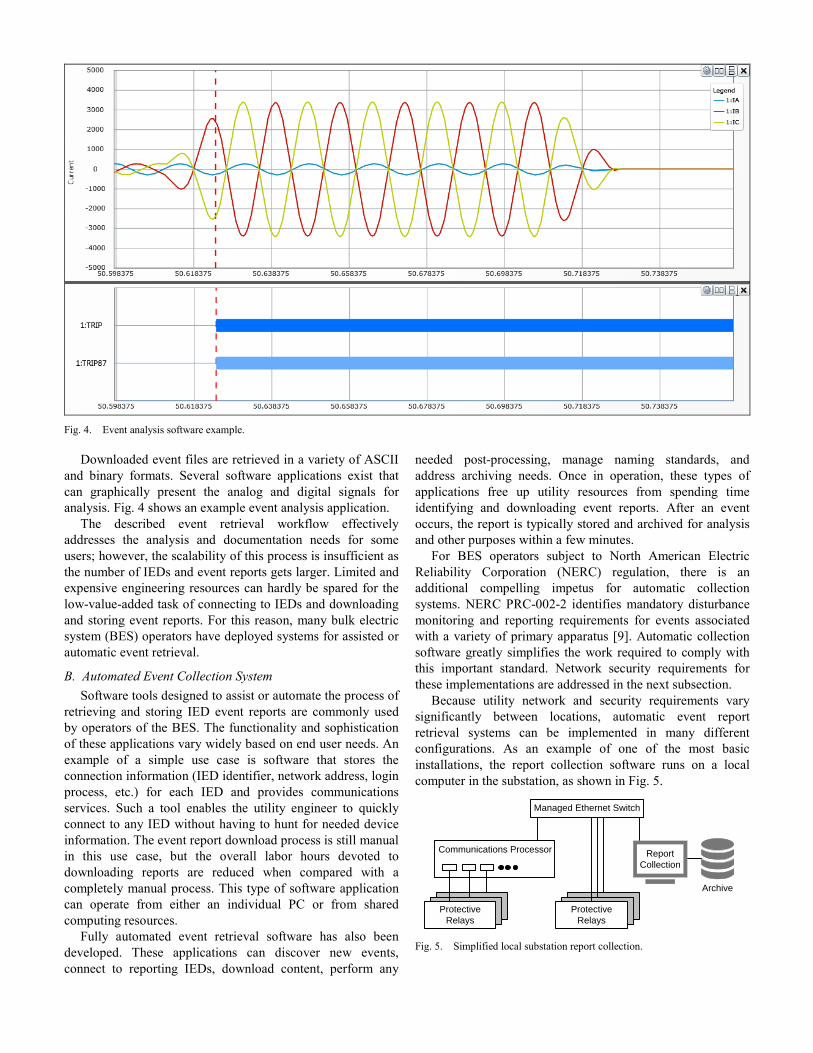
Fig. 4. Event analysis software example.
Downloaded event files are retrieved in a variety of ASCII and binary formats. Several software applications exist that can graphically present the analog and digital signals for analysis. Fig. 4 shows an example event analysis application.
The described event retrieval workflow effectively addresses the analysis and documentation needs for some users; however, the scalability of this process is insufficient as the number of IEDs and event reports gets larger. Limited and expensive engineering resources can hardly be spared for the low-value-added task of connecting to IEDs and downloading and storing event reports. For this reason, many bulk electric system (BES) operators have deployed systems for assisted or automatic event retrieval.
B. Automated Event Collection System Software tools designed to assist or automate the process of
retrieving and storing IED event reports are commonly used by operators of the BES. The functionality and sophistication of these applications vary widely based on end user needs. An example of a simple use case is software that stores the connection information (IED identifier, network address, login process, etc.) for each IED and provides communications services. Such a tool enables the utility engineer to quickly connect to any IED without having to hunt for needed device information. The event report download process is still manual in this use case, but the overall labor hours devoted to downloading reports are reduced when compared with a completely manual process. This type of software application can operate from either an individual PC or from shared computing resources.
Fully automated event retrieval software has also been developed. These applications can discover new events, connect to reporting IEDs, download content, perform any
needed post-processing, manage naming standards, and address archiving needs. Once in operation, these types of applications free up utility resources from spending time identifying and downloading event reports. After an event occurs, the report is typically stored and archived for analysis and other purposes within a few minutes.
For BES operators subject to North American Electric Reliability Corporation (NERC) regulation, there is an additional compelling impetus for automatic collection systems. NERC PRC-002-2 identifies mandatory disturbance monitoring and reporting requirements for events associated with a variety of primary apparatus [9]. Automatic collection software greatly simplifies the work required to comply with this important standard. Network security requirements for these implementations are addressed in the next subsection.
Because utility network and security requirements vary significantly between locations, automatic event report retrieval systems can be implemented in many different configurations. As an example of one of the most basic installations, the report collection software runs on a local computer in the substation, as shown in Fig. 5.
Communications Processor
Managed Ethernet Switch
Protective Relays
Protective Relays
Report Collection
Archive
Fig. 5. Simplified local substation report collection.
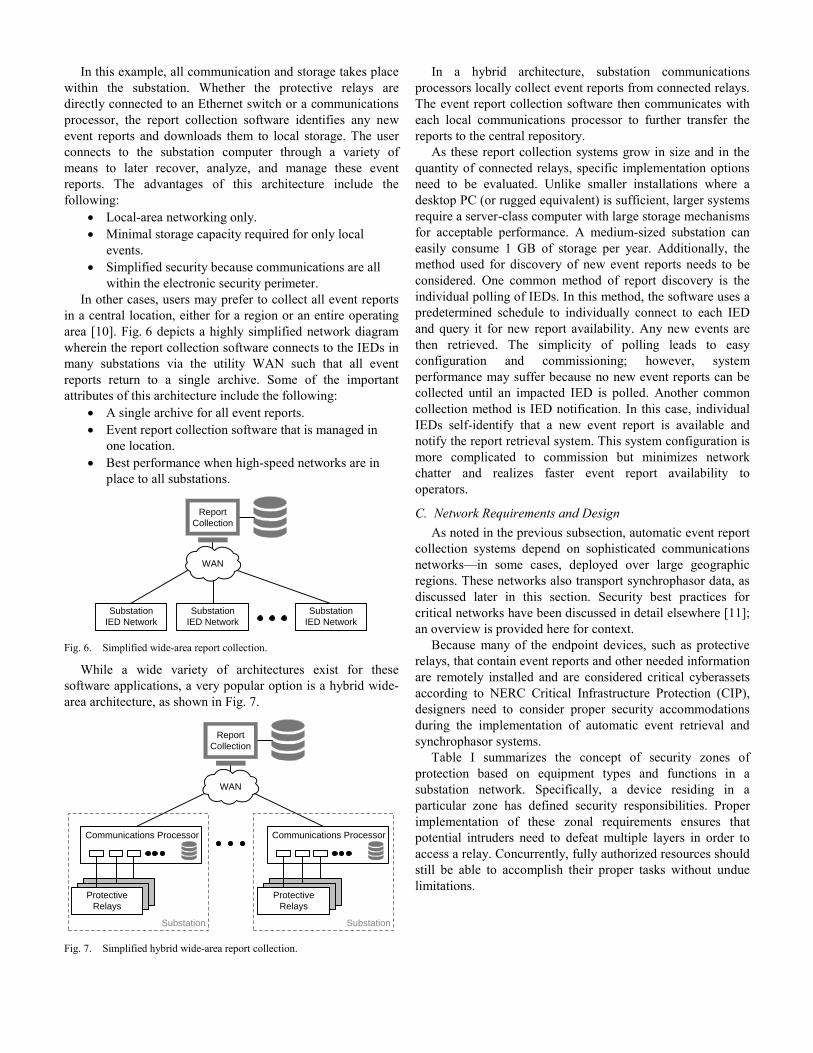
In this example, all communication and storage takes place within the substation. Whether the protective relays are directly connected to an Ethernet switch or a communications processor, the report collection software identifies any new event reports and downloads them to local storage. The user connects to the substation computer through a variety of means to later recover, analyze, and manage these event reports. The advantages of this architecture include the following:
• Local-area networking only. • Minimal storage capacity required for only local
events. • Simplified security because communications are all
within the electronic security perimeter. In other cases, users may prefer to collect all event reports
in a central location, either for a region or an entire operating area [10]. Fig. 6 depicts a highly simplified network diagram wherein the report collection software connects to the IEDs in many substations via the utility WAN such that all event reports return to a single archive. Some of the important attributes of this architecture include the following:
• A single archive for all event reports. • Event report collection software that is managed in
one location. • Best performance when high-speed networks are in
place to all substations.
Substation IED Network
Report Collection
WAN
Substation IED Network
Substation IED Network
Fig. 6. Simplified wide-area report collection.
While a wide variety of architectures exist for these software applications, a very popular option is a hybrid wide-area architecture, as shown in Fig. 7.
Report Collection
WAN
Communications Processor
Protective Relays
Communications Processor
Protective Relays
Substation Substation
Fig. 7. Simplified hybrid wide-area report collection.
In a hybrid architecture, substation communications processors locally collect event reports from connected relays. The event report collection software then communicates with each local communications processor to further transfer the reports to the central repository.
As these report collection systems grow in size and in the quantity of connected relays, specific implementation options need to be evaluated. Unlike smaller installations where a desktop PC (or rugged equivalent) is sufficient, larger systems require a server-class computer with large storage mechanisms for acceptable performance. A medium-sized substation can easily consume 1 GB of storage per year. Additionally, the method used for discovery of new event reports needs to be considered. One common method of report discovery is the individual polling of IEDs. In this method, the software uses a predetermined schedule to individually connect to each IED and query it for new report availability. Any new events are then retrieved. The simplicity of polling leads to easy configuration and commissioning; however, system performance may suffer because no new event reports can be collected until an impacted IED is polled. Another common collection method is IED notification. In this case, individual IEDs self-identify that a new event report is available and notify the report retrieval system. This system configuration is more complicated to commission but minimizes network chatter and realizes faster event report availability to operators.
C. Network Requirements and Design As noted in the previous subsection, automatic event report
collection systems depend on sophisticated communications networks—in some cases, deployed over large geographic regions. These networks also transport synchrophasor data, as discussed later in this section. Security best practices for critical networks have been discussed in detail elsewhere [11]; an overview is provided here for context.
Because many of the endpoint devices, such as protective relays, that contain event reports and other needed information are remotely installed and are considered critical cyberassets according to NERC Critical Infrastructure Protection (CIP), designers need to consider proper security accommodations during the implementation of automatic event retrieval and synchrophasor systems.
Table I summarizes the concept of security zones of protection based on equipment types and functions in a substation network. Specifically, a device residing in a particular zone has defined security responsibilities. Proper implementation of these zonal requirements ensures that potential intruders need to defeat multiple layers in order to access a relay. Concurrently, fully authorized resources should still be able to accomplish their proper tasks without undue limitations.
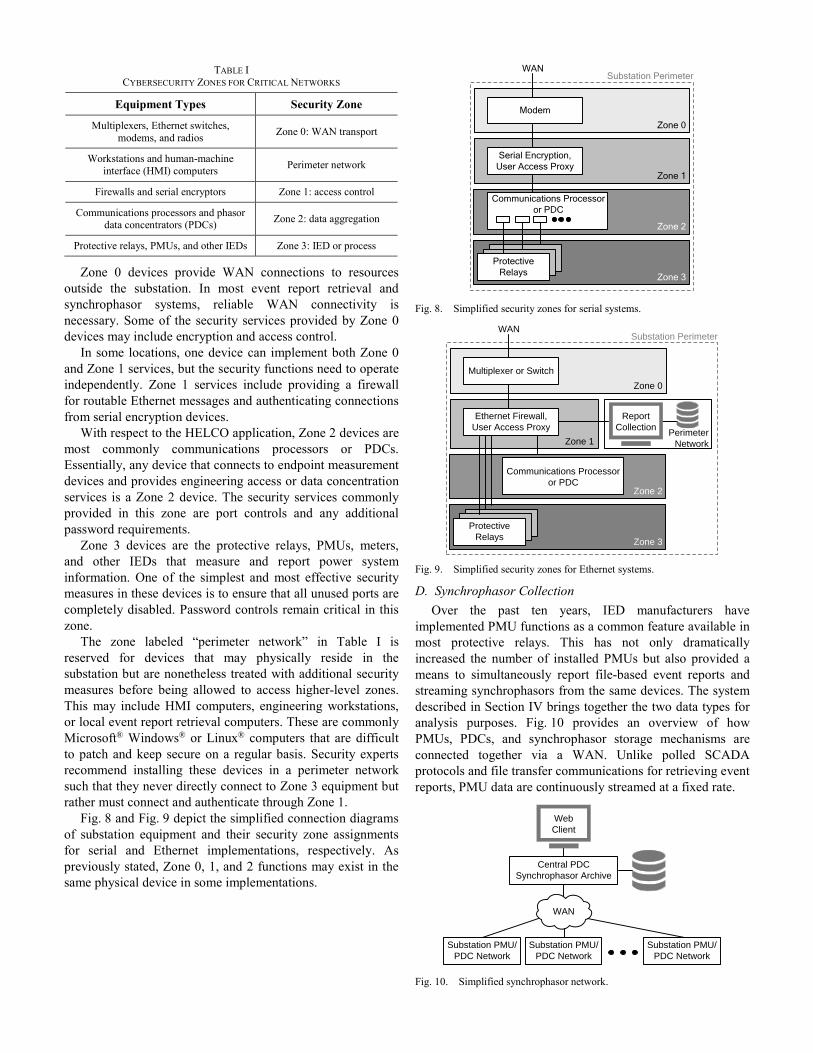
TABLE I CYBERSECURITY ZONES FOR CRITICAL NETWORKS
Equipment Types Security Zone
Multiplexers, Ethernet switches, modems, and radios Zone 0: WAN transport
Workstations and human-machine interface (HMI) computers Perimeter network
Firewalls and serial encryptors Zone 1: access control
Communications processors and phasor data concentrators (PDCs) Zone 2: data aggregation
Protective relays, PMUs, and other IEDs Zone 3: IED or process
Zone 0 devices provide WAN connections to resources outside the substation. In most event report retrieval and synchrophasor systems, reliable WAN connectivity is necessary. Some of the security services provided by Zone 0 devices may include encryption and access control.
In some locations, one device can implement both Zone 0 and Zone 1 services, but the security functions need to operate independently. Zone 1 services include providing a firewall for routable Ethernet messages and authenticating connections from serial encryption devices.
With respect to the HELCO application, Zone 2 devices are most commonly communications processors or PDCs. Essentially, any device that connects to endpoint measurement devices and provides engineering access or data concentration services is a Zone 2 device. The security services commonly provided in this zone are port controls and any additional password requirements.
Zone 3 devices are the protective relays, PMUs, meters, and other IEDs that measure and report power system information. One of the simplest and most effective security measures in these devices is to ensure that all unused ports are completely disabled. Password controls remain critical in this zone.
The zone labeled “perimeter network” in Table I is reserved for devices that may physically reside in the substation but are nonetheless treated with additional security measures before being allowed to access higher-level zones. This may include HMI computers, engineering workstations, or local event report retrieval computers. These are commonly Microsoft® Windows® or Linux® computers that are difficult to patch and keep secure on a regular basis. Security experts recommend installing these devices in a perimeter network such that they never directly connect to Zone 3 equipment but rather must connect and authenticate through Zone 1.
Fig. 8 and Fig. 9 depict the simplified connection diagrams of substation equipment and their security zone assignments for serial and Ethernet implementations, respectively. As previously stated, Zone 0, 1, and 2 functions may exist in the same physical device in some implementations.
Communications Processor or PDC
Protective Relays
Substation Perimeter
Serial Encryption, User Access Proxy
Modem
WAN
Zone 0
Zone 1
Zone 2
Zone 3
Fig. 8. Simplified security zones for serial systems.
Perimeter Network
Communications Processor or PDC
Protective Relays
Substation Perimeter
Ethernet Firewall, User Access Proxy
Multiplexer or Switch
WAN
Zone 0
Zone 1
Zone 2
Zone 3
Report Collection
Fig. 9. Simplified security zones for Ethernet systems.
D. Synchrophasor Collection Over the past ten years, IED manufacturers have
implemented PMU functions as a common feature available in most protective relays. This has not only dramatically increased the number of installed PMUs but also provided a means to simultaneously report file-based event reports and streaming synchrophasors from the same devices. The system described in Section IV brings together the two data types for analysis purposes. Fig. 10 provides an overview of how PMUs, PDCs, and synchrophasor storage mechanisms are connected together via a WAN. Unlike polled SCADA protocols and file transfer communications for retrieving event reports, PMU data are continuously streamed at a fixed rate.
Substation PMU/PDC Network
Central PDC Synchrophasor Archive
WAN
Substation PMU/PDC Network
Substation PMU/PDC Network
Web Client
Fig. 10. Simplified synchrophasor network.
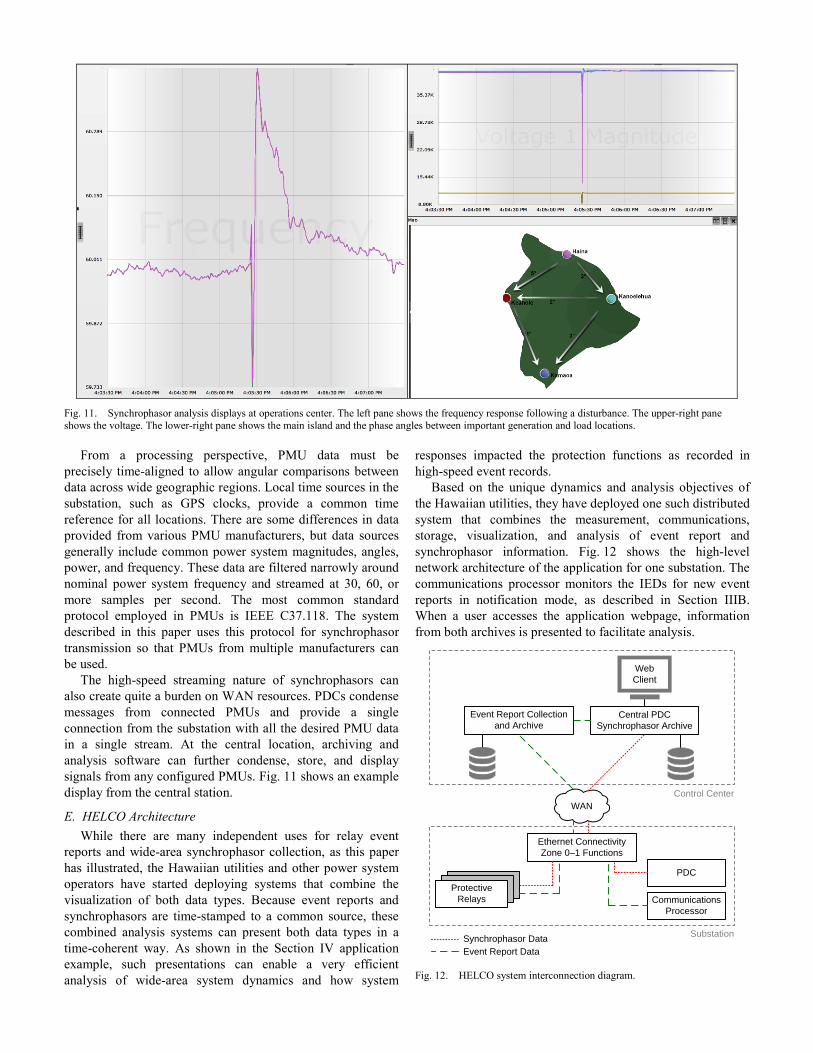
Fig. 11. Synchrophasor analysis displays at operations center. The left pane shows the frequency response following a disturbance. The upper-right pane shows the voltage. The lower-right pane shows the main island and the phase angles between important generation and load locations.
From a processing perspective, PMU data must be precisely time-aligned to allow angular comparisons between data across wide geographic regions. Local time sources in the substation, such as GPS clocks, provide a common time reference for all locations. There are some differences in data provided from various PMU manufacturers, but data sources generally include common power system magnitudes, angles, power, and frequency. These data are filtered narrowly around nominal power system frequency and streamed at 30, 60, or more samples per second. The most common standard protocol employed in PMUs is IEEE C37.118. The system described in this paper uses this protocol for synchrophasor transmission so that PMUs from multiple manufacturers can be used.
The high-speed streaming nature of synchrophasors can also create quite a burden on WAN resources. PDCs condense messages from connected PMUs and provide a single connection from the substation with all the desired PMU data in a single stream. At the central location, archiving and analysis software can further condense, store, and display signals from any configured PMUs. Fig. 11 shows an example display from the central station.
E. HELCO Architecture While there are many independent uses for relay event
reports and wide-area synchrophasor collection, as this paper has illustrated, the Hawaiian utilities and other power system operators have started deploying systems that combine the visualization of both data types. Because event reports and synchrophasors are time-stamped to a common source, these combined analysis systems can present both data types in a time-coherent way. As shown in the Section IV application example, such presentations can enable a very efficient analysis of wide-area system dynamics and how system
responses impacted the protection functions as recorded in high-speed event records.
Based on the unique dynamics and analysis objectives of the Hawaiian utilities, they have deployed one such distributed system that combines the measurement, communications, storage, visualization, and analysis of event report and synchrophasor information. Fig. 12 shows the high-level network architecture of the application for one substation. The communications processor monitors the IEDs for new event reports in notification mode, as described in Section IIIB. When a user accesses the application webpage, information from both archives is presented to facilitate analysis.
Central PDC Synchrophasor Archive
WAN
Web Client
Event Report Collection and Archive
Control Center
Ethernet Connectivity Zone 0–1 Functions
Protective Relays
PDC
Communications Processor
Substation
Event Report DataSynchrophasor Data
Fig. 12. HELCO system interconnection diagram.
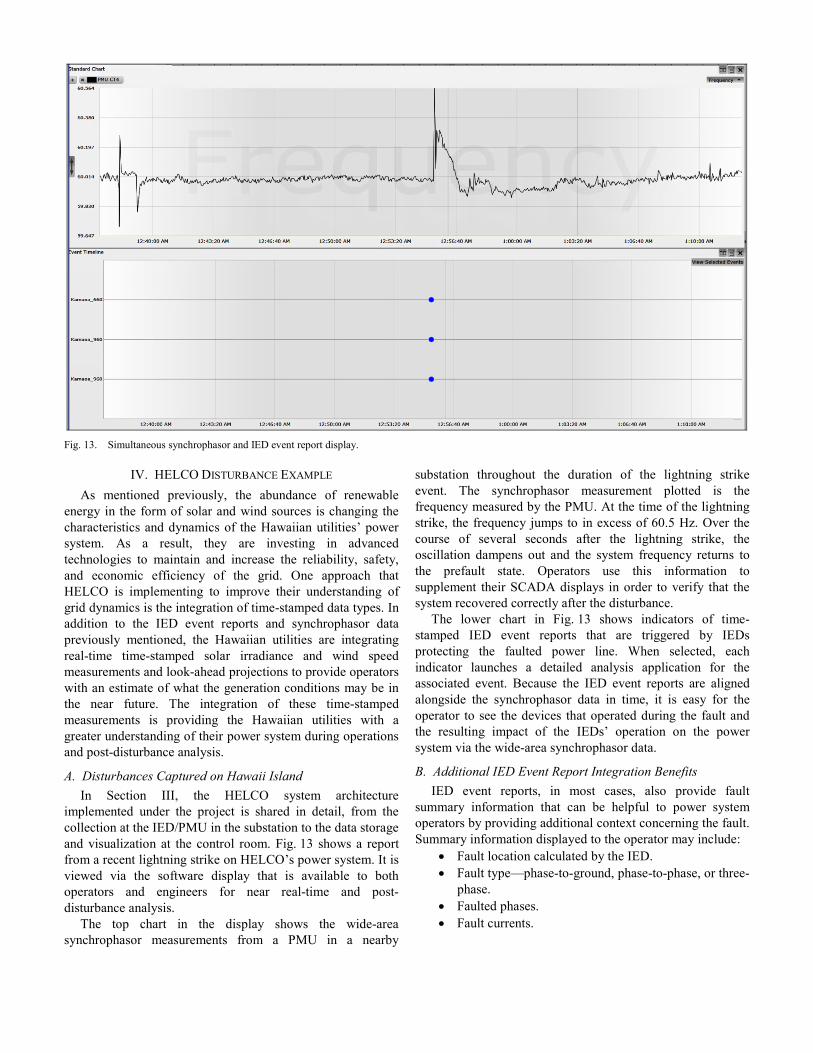
Fig. 13. Simultaneous synchrophasor and IED event report display.
IV. HELCO DISTURBANCE EXAMPLE As mentioned previously, the abundance of renewable
energy in the form of solar and wind sources is changing the characteristics and dynamics of the Hawaiian utilities’ power system. As a result, they are investing in advanced technologies to maintain and increase the reliability, safety, and economic efficiency of the grid. One approach that HELCO is implementing to improve their understanding of grid dynamics is the integration of time-stamped data types. In addition to the IED event reports and synchrophasor data previously mentioned, the Hawaiian utilities are integrating real-time time-stamped solar irradiance and wind speed measurements and look-ahead projections to provide operators with an estimate of what the generation conditions may be in the near future. The integration of these time-stamped measurements is providing the Hawaiian utilities with a greater understanding of their power system during operations and post-disturbance analysis.
A. Disturbances Captured on Hawaii Island In Section III, the HELCO system architecture
implemented under the project is shared in detail, from the collection at the IED/PMU in the substation to the data storage and visualization at the control room. Fig. 13 shows a report from a recent lightning strike on HELCO’s power system. It is viewed via the software display that is available to both operators and engineers for near real-time and post-disturbance analysis.
The top chart in the display shows the wide-area synchrophasor measurements from a PMU in a nearby
substation throughout the duration of the lightning strike event. The synchrophasor measurement plotted is the frequency measured by the PMU. At the time of the lightning strike, the frequency jumps to in excess of 60.5 Hz. Over the course of several seconds after the lightning strike, the oscillation dampens out and the system frequency returns to the prefault state. Operators use this information to supplement their SCADA displays in order to verify that the system recovered correctly after the disturbance.
The lower chart in Fig. 13 shows indicators of time-stamped IED event reports that are triggered by IEDs protecting the faulted power line. When selected, each indicator launches a detailed analysis application for the associated event. Because the IED event reports are aligned alongside the synchrophasor data in time, it is easy for the operator to see the devices that operated during the fault and the resulting impact of the IEDs’ operation on the power system via the wide-area synchrophasor data.
B. Additional IED Event Report Integration Benefits IED event reports, in most cases, also provide fault
summary information that can be helpful to power system operators by providing additional context concerning the fault. Summary information displayed to the operator may include:
• Fault location calculated by the IED. • Fault type—phase-to-ground, phase-to-phase, or three-
phase. • Faulted phases. • Fault currents.

Fig. 14. Currents from four time-synchronized event reports.
Protection engineers are often interested in determining whether or not the protection scheme properly removed the fault from the system. The primary source of information that protection engineers rely on for this analysis is the IED event report. Fig. 14 shows the high-sample-rate IED event report data captured during the previously mentioned lightning strike. Because the IEDs protecting the power line are time-synchronized, engineers are able to display information from the primary and secondary protection IEDs. It is also possible to analyze data from local and remote protection IEDs in one display to validate the performance of the protection logic. This can be especially helpful when differential protection schemes are implemented, because the measurements from the local and remote ends of the line are required for this protection scheme.
C. Additional PMU Integration Benefits In addition to providing wide-area power system context
during a disturbance when time-aligned alongside IED event reports, synchrophasor measurements provide locational information to power system operators to more quickly detect, isolate, and recover from the disturbance. As mentioned earlier, one of the primary benefits of synchrophasors is access to direct phase angle measurements across a wide area. These phase angle measurements across the power system alert the operator to any potential stress on the power system. Fig. 15 shows (via a geospatial display) the direction of power flow and the phase angle difference between key transmission locations in the HELCO system during normal operation.
Fig. 15. Power flow and phase angle display.
The described phase angle applications for synchrophasors highlight just a few of the many applications the power system industry is implementing. Significant improvement is expected in the following areas with synchrophasor technology when compared with using traditional methods:
• Oscillation detection. • Voltage stability. • Line thermal monitoring. • Model validation.
V. CONCLUSION Hawaiian electric companies are proactively engaging with
industry and utility partnerships to develop and enhance existing analytical and modeling tools that rely on SCADA data with new, non-SCADA data streams (i.e., phasor data, real-time forecasts, customer use data) in order to inform grid modernization needs. A system to perform this advanced monitoring and analysis using a combination of synchrophasor and IED data has been implemented and is being field-tested for analysis of real-time events on the HELCO system. Combining synchrophasor measurements and IED oscillographic reports during near real-time and post-disturbance analysis is providing a better understanding of the conditions leading up to and following a disturbance, and visualization tools are helping to speed up analysis.
The increased availability of precise time signals provided for synchrophasors at substations and the improved secure communications channels between the substation and control center have made this integrated analysis approach feasible. The IED and PMU devices have the potential to provide utility operators with additional information to support post-event analysis. The additional information also helps to quantify observed area-wide changes in voltage and frequency on systems with increasing distributed resources and changing grid conditions due to high penetrations of renewable sources.
VI. ACKNOWLEDGEMENTS The authors would like to acknowledge the support of Lisa
Dangelmaier, Manager of Operations and System Planning, and Robert Kaneshiro, Assistant Superintendent of System Operations at Hawaii Electric Light Company, for their support, their insights on system events, and for being proactive in adopting nontraditional tools for managing and maintaining a modern grid.
The Hawaiian Electric Company implementation portion of this project would not be possible without support from the U.S. Department of Energy Office of Electricity Delivery and Energy Reliability (OE) under Funding Opportunity Announcements (FOA) grant funding (DE-EE0006331).
VII. REFERENCES [1] J. L. Blackburn and T. J. Domin, Protective Relaying Principles and
Applications, Fourth Edition. CRC Press, Taylor & Francis Group, Boca Raton, FL, 2014.
[2] J. Roberts and E. O. Schweitzer, III, “Analysis of Event Reports,” proceedings of the 16th Annual Western Protective Relay Conference, Spokane, WA, October 1989.
[3] E. O. Schweitzer, III, A. Guzmán, M. V. Mynam, V. Skendzic, B. Kasztenny, and S. Marx, “Locating Faults by the Traveling Waves They Launch,” proceedings of the 40th Annual Western Protective Relay Conference, Spokane, WA, October 2013.
[4] J. S. Thorp, A. G. Phadke, and K. J. Karimi, “Real Time Voltage-Phasor Measurements for Static State Estimation,” IEEE Transactions on Power Apparatus and Systems, Vol. PAS-104, Issue 11, November 1985, pp. 3098–3106.
[5] D. E. Bakken, A. Bose, C. H. Hauser, D. E. Whitehead, and G. C. Zweigle, “Smart Generation and Transmission with Coherent, Real-Time Data,” Proceedings of the IEEE, Vol. 99, Issue 6, June 2011, pp. 928–951.
[6] D. Nakafuji, “Making Sense of Synchrophasor Data for Utilities (SynchroVIEEU Project),” proceedings of the North American SynchroPhasor Initiative Working Group Meeting, San Mateo, CA, March 2015.
[7] U.S. Department of Energy, “Energy Department Invests Over $10 Million to Improve Grid Reliability.” June 2014. Available: http://www.energy.gov/articles/energy-department-invests-over-10-million-improve-grid-reliability-and-resiliency.
[8] K. Zimmerman and D. Costello, “Impedance-Based Fault Location Experience,” proceedings of the 31st Annual Western Protective Relay Conference, Spokane, WA, October 2004.
[9] NERC Standard PRC-002-2 – Disturbance Monitoring and Reporting Requirements. Available: http://www.nerc.com.
[10] T. Rosenberger, D. Prestwich, M. Watkins, and M. Weber, “Automated Event Retrieval Reduces Operating Costs,” proceedings of the 61st Annual Conference for Protective Relay Engineers, College Station, TX, April 2008.
[11] P. Robertson, C. Gordon, and S. Loo, “Implementing Security for Critical Infrastructure Wide-Area Networks,” proceedings of the Power and Energy Automation Conference, Spokane, WA, March 2013.
VIII. BIOGRAPHIES Dora Nakafuji is the Director of Renewable Energy Planning at Hawaiian Electric Company and is the PI on the SynchroVIEEU effort. Her division is responsible for pilot efforts helping to reduce the risks of integrating high penetrations of renewables on the island grids. She holds a Ph.D. in aeronautical and mechanical engineering focused on experimental and computational analysis from the University of California, Davis. Dora is a member of IEEE.
Laura Rogers is a project lead engineer for substation and communication projects at Hawaii Electric Light Company and has been responsible for the installation of synchrophasors and IED integration hardware and software on the island of Hawaii. She has a bachelor of science in electronic engineering from California Polytechnic State University, San Luis Obispo and has a master of science in electrical engineering from the University of California, Santa Barbara. She is a registered PE in the state of Hawaii.
Jared Bestebreur is an engineer at Schweitzer Engineering Laboratories, Inc. and serves as the synchrophasor and relay event analysis software product manager. He has supported the implementation of wide-area monitoring systems around the world. Jared holds a bachelor of science degree in electrical engineering from Washington State University. He is also an active member in the North American SynchroPhasor Initiative (NASPI) community.
Michael Rourke is a principal engineer at Schweitzer Engineering Laboratories, Inc., focusing on end user applications for software. He has a master of engineering in electrical engineering and a bachelor of science in electrical engineering from the University of Idaho.
Greg Zweigle serves as a Schweitzer Engineering Laboratories, Inc. fellow engineer and leads a research team and a software development department. He holds a Ph.D. in electrical engineering and computer science, a master of science degree in (physical) chemistry, and a master of science degree in electrical engineering from Washington State University. He also has a bachelor of science degree in physics from Northwest Nazarene University. Greg is a senior member of the IEEE.
20170130 • TP6750