Embed Size (px)
Citation preview
ENERGY CENTER
State Utility Forecasting Group (SUFG)
Integrating Renewable
Energy into Supply Planning
Presented by:
Douglas J. Gotham
State Utility Forecasting Group
Energy Center
Purdue University
Presented to:
Institute of Public Utilities
13th Advanced Regulatory Studies Program
October 8, 2008
ENERGY CENTER
State Utility Forecasting Group (SUFG)
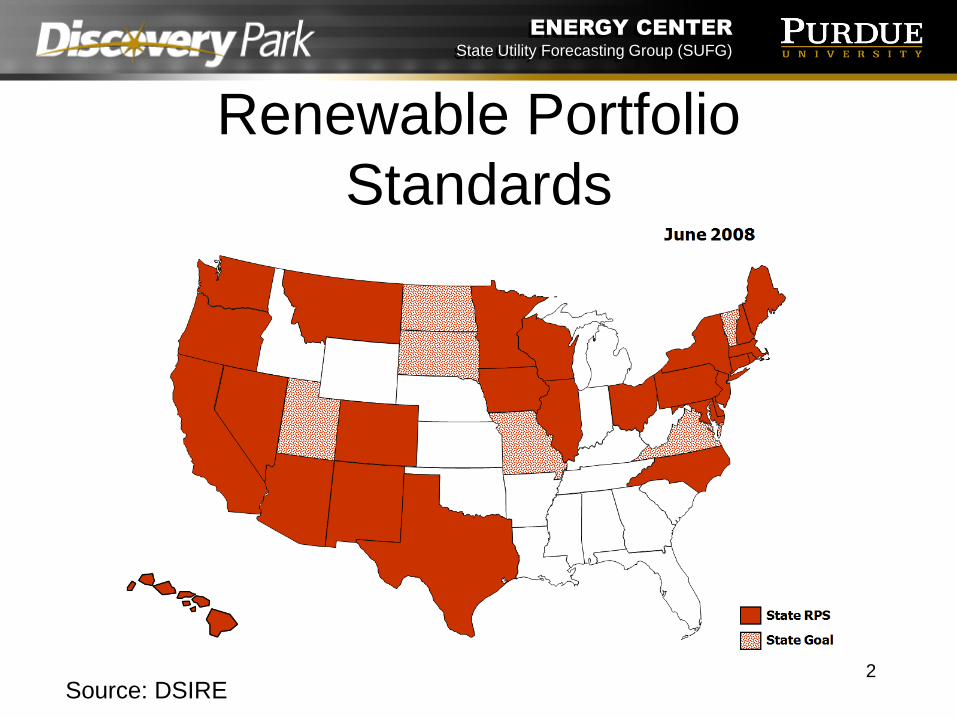
Renewable Portfolio
Standards
Source: DSIRE2
ENERGY CENTER
State Utility Forecasting Group (SUFG)
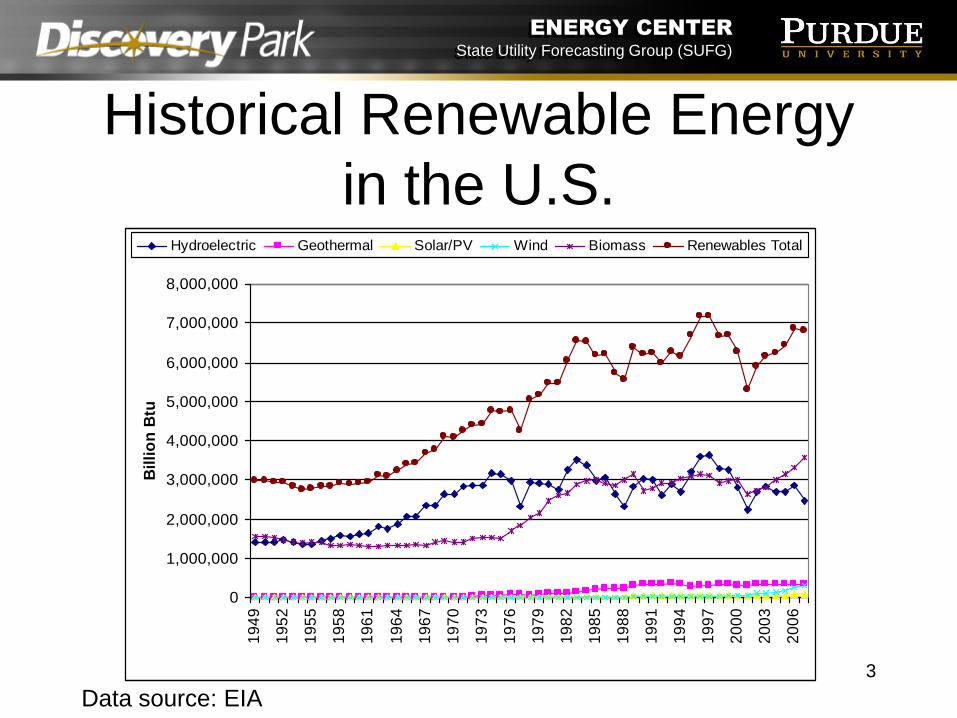
Historical Renewable Energy
in the U.S.
0
1,000,000
2,000,000
3,000,000
4,000,000
5,000,000
6,000,000
7,000,000
8,000,000
19
49
19
52
19
55
19
58
19
61
19
64
19
67
19
70
19
73
19
76
19
79
19
82
19
85
19
88
19
91
19
94
19
97
20
00
20
03
20
06
Bil
lio
n B
tu
Hydroelectric Geothermal Solar/PV Wind Biomass Renewables Total
Data source: EIA
3

ENERGY CENTER
State Utility Forecasting Group (SUFG)
2006 U.S. Electricity
Generation by Energy Source
Coal49.0%
Petroleum liquids1.1%
Petroleum Coke0.5%
Natural gas20.0%
Other gases0.4%
Nuclear19.4%
Other0.3%
Hydroelectric Conventional
76.3%
Hydroelectric pumped storage-1.7%
Waste Biomass4.2%
Wood & derived fuels10.2%
Geothermal3.8%
Solar0.1%
Wind7.0%
Renewable9.3%
Data source: EIA 4
ENERGY CENTER
State Utility Forecasting Group (SUFG)
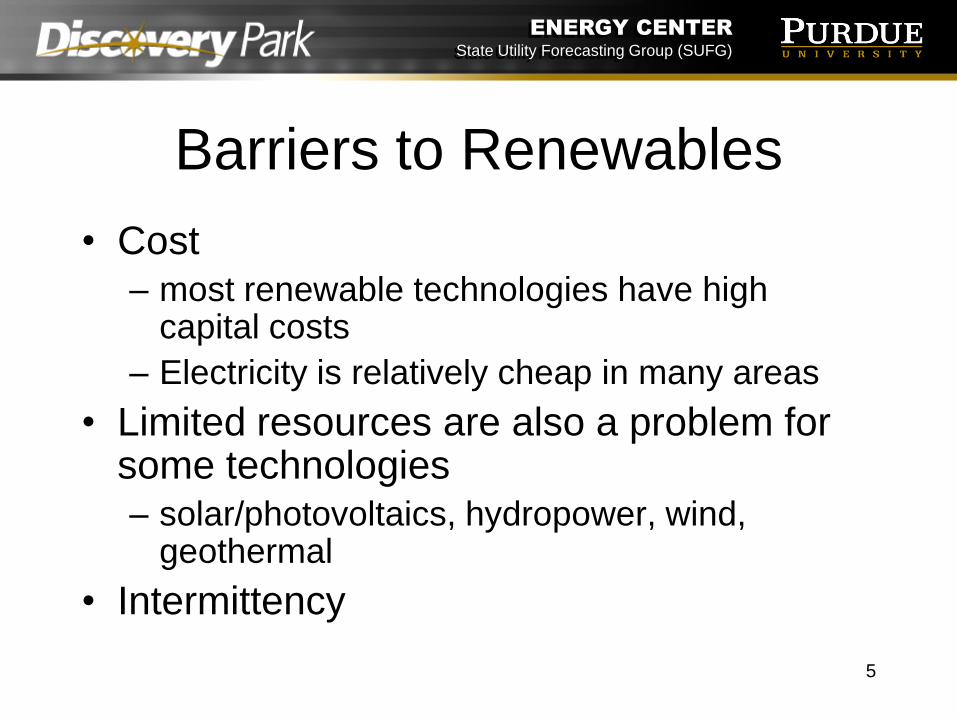
Barriers to Renewables
• Cost
– most renewable technologies have high capital costs
– Electricity is relatively cheap in many areas
• Limited resources are also a problem for some technologies
– solar/photovoltaics, hydropower, wind, geothermal
• Intermittency
5

ENERGY CENTER
State Utility Forecasting Group (SUFG)
Incentives for Renewables
• Federal– tax credits and exemptions (production tax credit)
– grant programs
• State– net metering rule
– grant programs
– tax credits
– emissions credits
• Utilities– green pricing programs
6
ENERGY CENTER
State Utility Forecasting Group (SUFG)
Wind
• Advantages
– inexhaustible
– free fuel
– clean
– modular
– scalable
– high system
reliability
– uses no water
• Disadvantages
– intermittent
– usually located far
from load centers
– bird mortality
– radar interference
– somewhat
geographically
limited
7
ENERGY CENTER
State Utility Forecasting Group (SUFG)
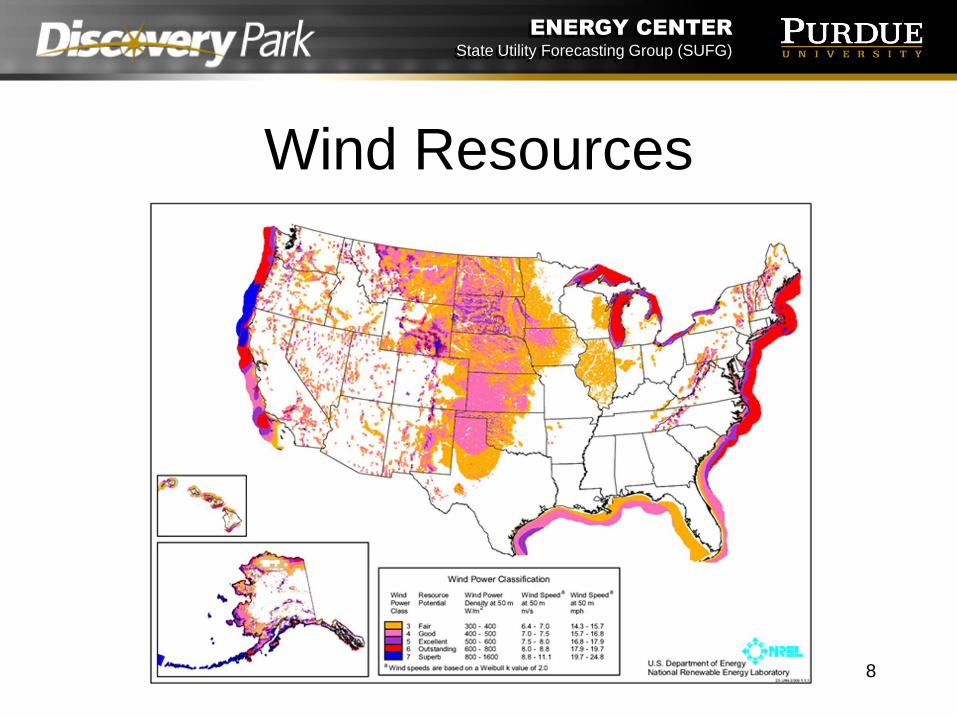
Wind Resources
8
ENERGY CENTER
State Utility Forecasting Group (SUFG)
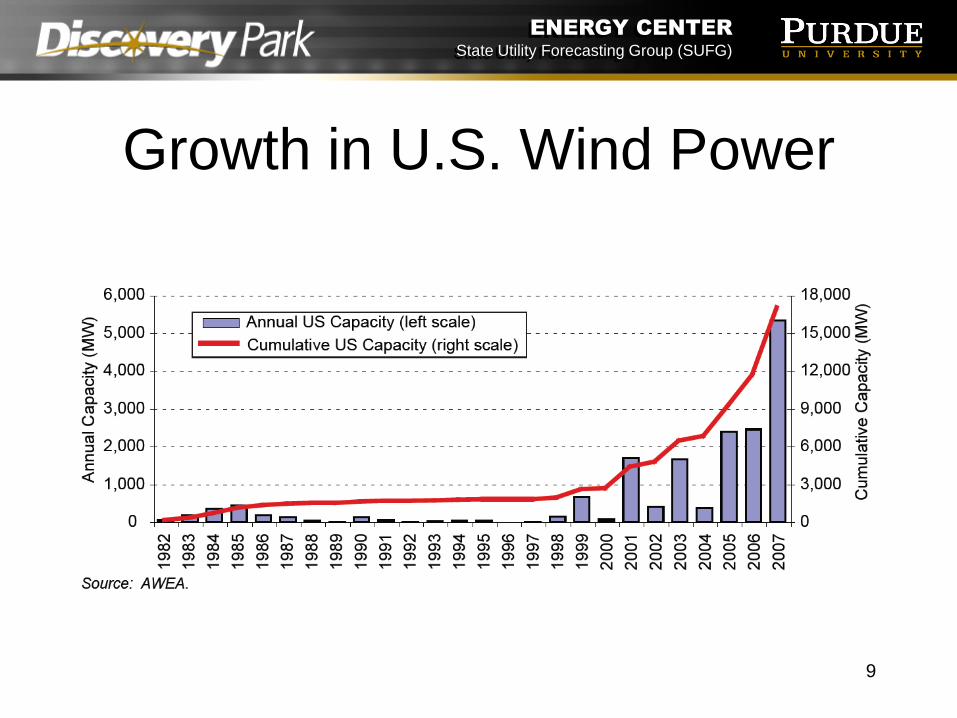
Growth in U.S. Wind Power
9
ENERGY CENTER
State Utility Forecasting Group (SUFG)
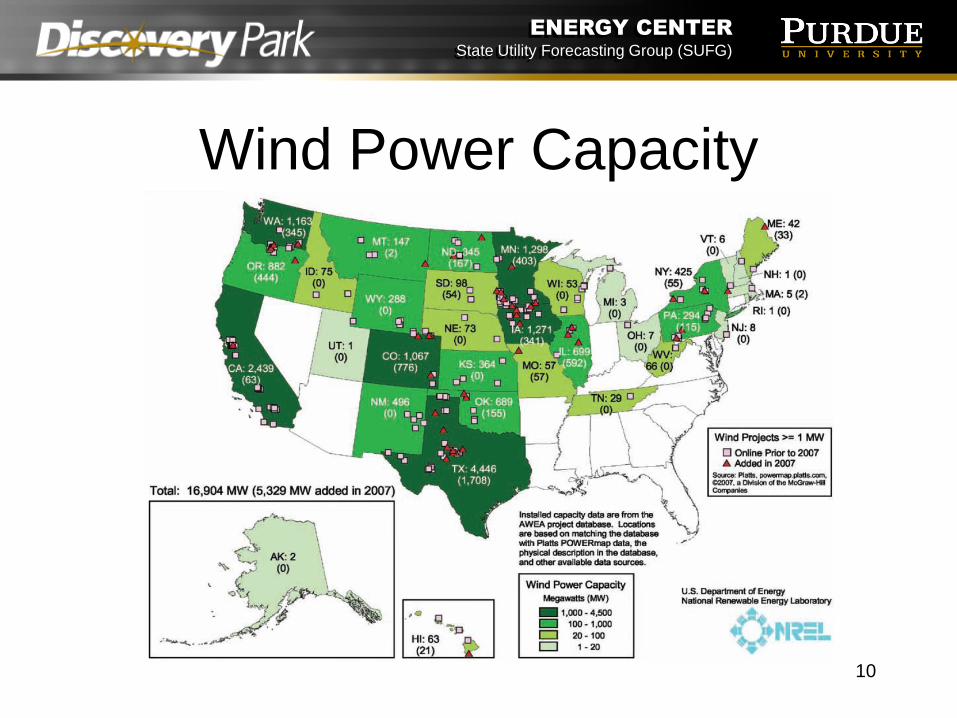
Wind Power Capacity
10
ENERGY CENTER
State Utility Forecasting Group (SUFG)
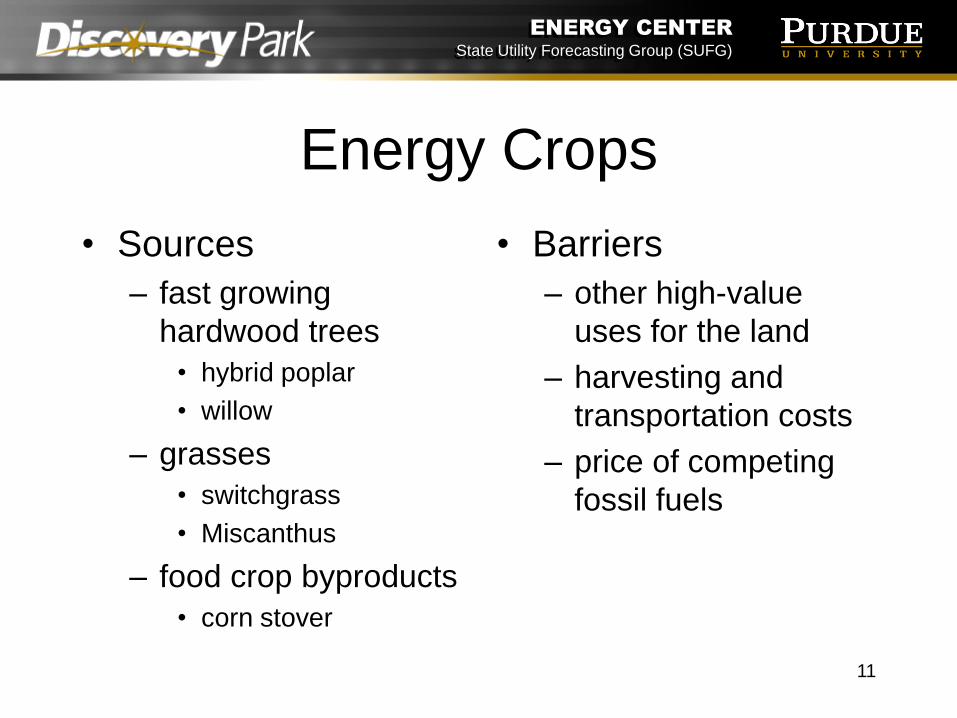
Energy Crops
• Sources
– fast growing
hardwood trees
• hybrid poplar
• willow
– grasses
• switchgrass
• Miscanthus
– food crop byproducts
• corn stover
• Barriers
– other high-value
uses for the land
– harvesting and
transportation costs
– price of competing
fossil fuels
11
ENERGY CENTER
State Utility Forecasting Group (SUFG)
Organic Waste Biomass
• Wood waste
• Landfill gas
• Municipal solid waste
• Animal waste biogas
• Wastewater treatment
12
ENERGY CENTER
State Utility Forecasting Group (SUFG)
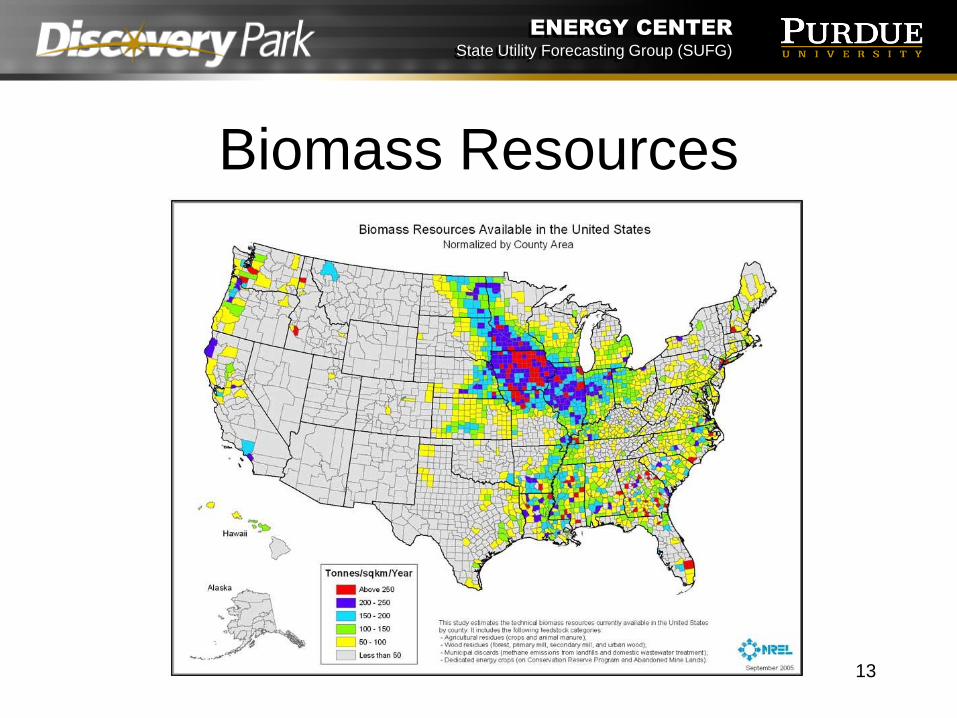
Biomass Resources
13
ENERGY CENTER
State Utility Forecasting Group (SUFG)
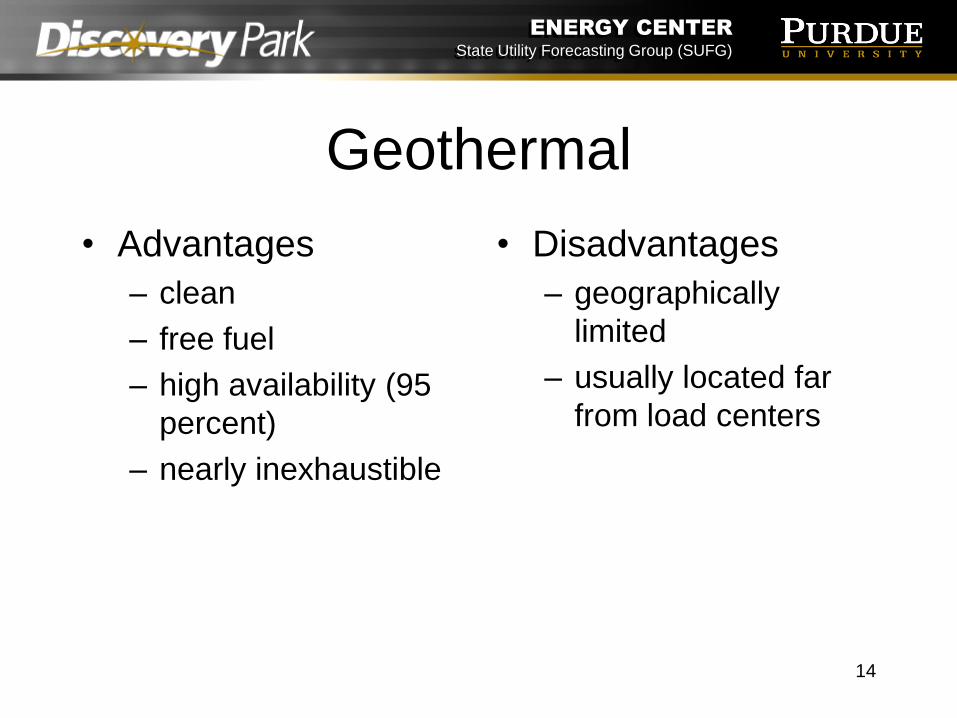
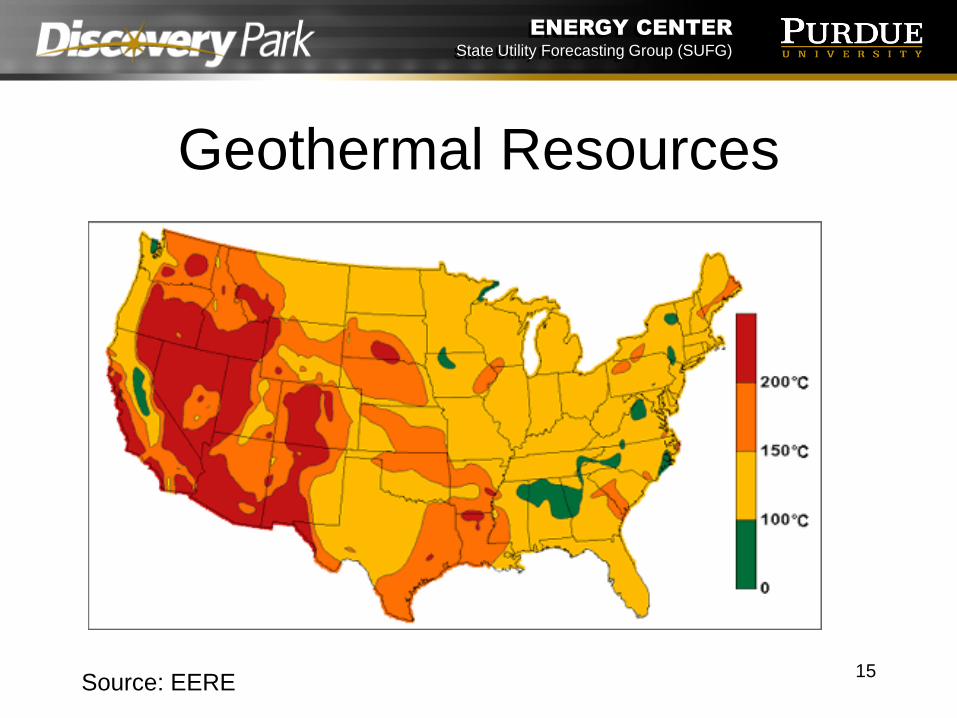
Geothermal
• Advantages
– clean
– free fuel
– high availability (95
percent)
– nearly inexhaustible
• Disadvantages
– geographically
limited
– usually located far
from load centers
14
ENERGY CENTER
State Utility Forecasting Group (SUFG)
Geothermal Resources
Source: EERE 15

ENERGY CENTER
State Utility Forecasting Group (SUFG)
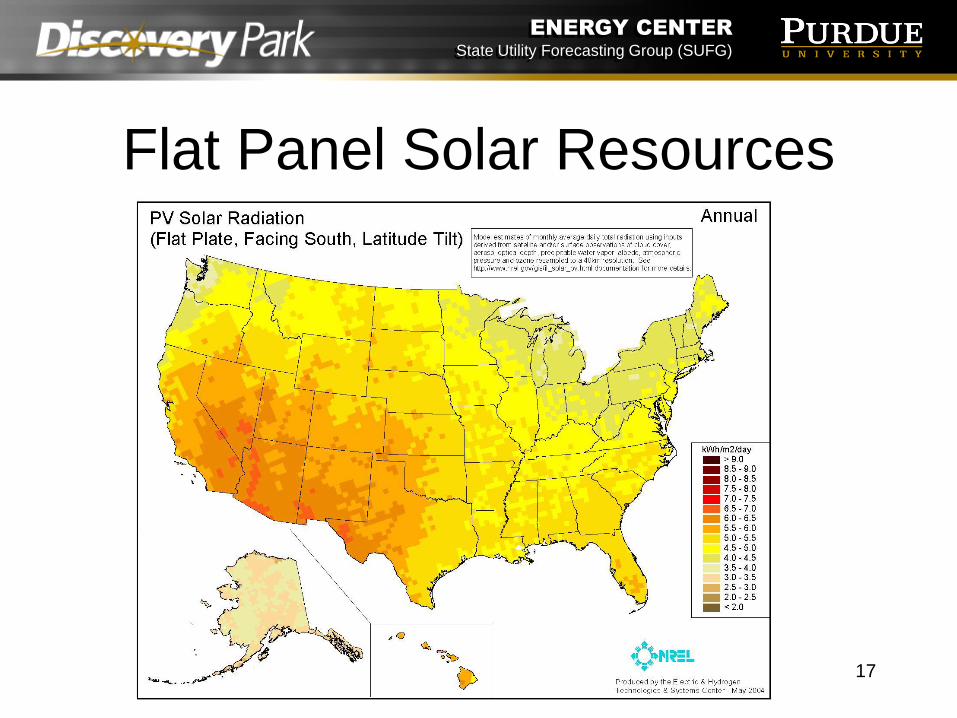
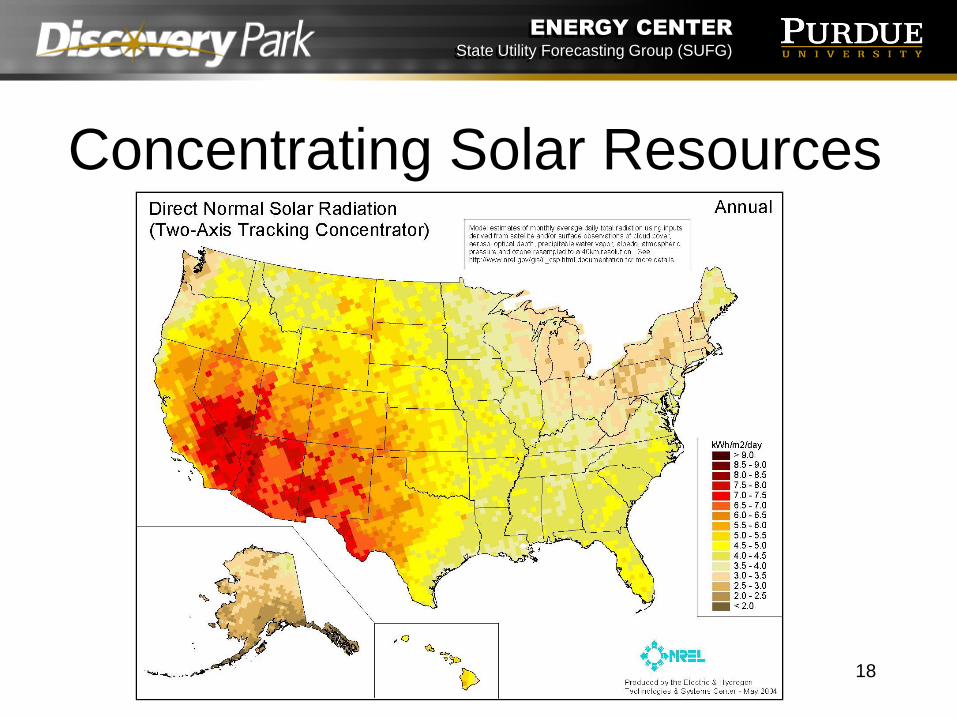
Solar
• Advantages
– inexhaustible
– free fuel
– clean
– modular
– scalable
– high system
reliability
– uses no water
• Disadvantages
– intermittent
– high capital cost
– geographically
limited
16
ENERGY CENTER
State Utility Forecasting Group (SUFG)
Flat Panel Solar Resources
17
ENERGY CENTER
State Utility Forecasting Group (SUFG)
Concentrating Solar Resources
18
ENERGY CENTER
State Utility Forecasting Group (SUFG)
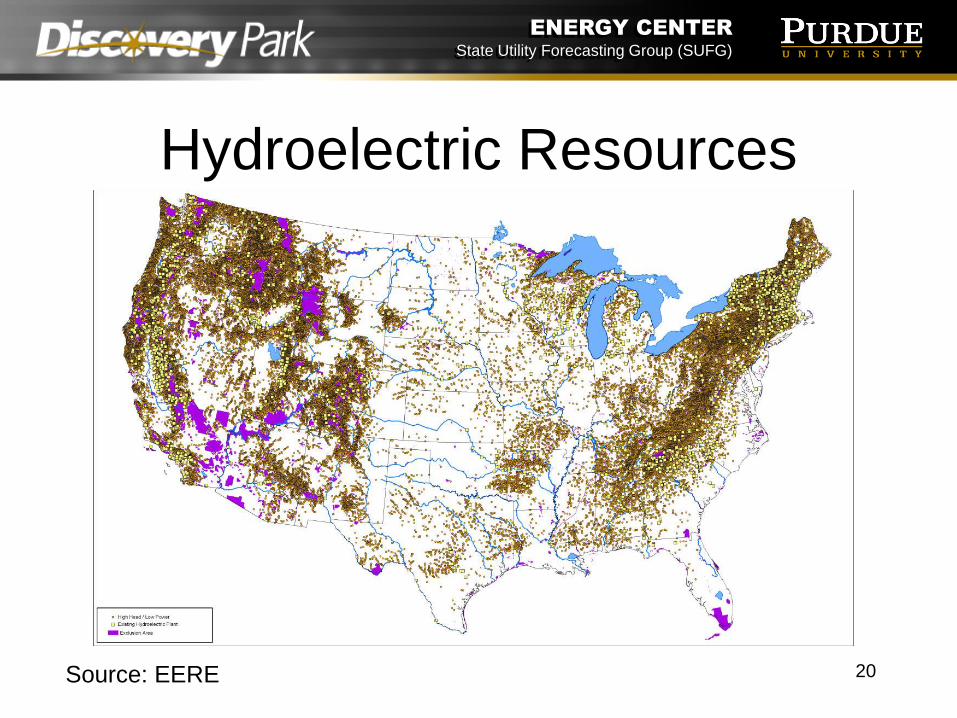
Hydroelectricity
• Advantages
– inexhaustible
– free fuel
– clean
– operational flexibility
• Disadvantages
– geographically
limited
– impact on aquatic life
– changes in water
quantity/quality
downstream
19
ENERGY CENTER
State Utility Forecasting Group (SUFG)
Hydroelectric Resources
Source: EERE 20

ENERGY CENTER
State Utility Forecasting Group (SUFG)
Intermittency
• All generators have some amount of
uncertainty when it comes to availability
– mechanical failure
– environmental factors
• Some renewable resources experience
this problem on a far greater scale
21
ENERGY CENTER
State Utility Forecasting Group (SUFG)
Intermittency Problems
• Operational
– Low output + high demand
– High output + low demand
– Rapid change in output
• Scheduling
– Unit commitment
– Gas purchase
• Planning22
ENERGY CENTER
State Utility Forecasting Group (SUFG)
Intermittency in Planning
• Need to estimate two factors
– Amount of capacity that will be available
when needed (MW)
– Type of capacity (baseload, intermediate,
cycling)
23

ENERGY CENTER
State Utility Forecasting Group (SUFG)
Rule of Thumb Method
• Simple and easy to understand
• There is no standard
• Does not account for geographic
variability of load or resource
24
ENERGY CENTER
State Utility Forecasting Group (SUFG)
Historical Availability
• Use the percentage of full output that is
available when the system peak
demand occurs
• Accounts for local factors
• Large variations from one year to
another
25
ENERGY CENTER
State Utility Forecasting Group (SUFG)
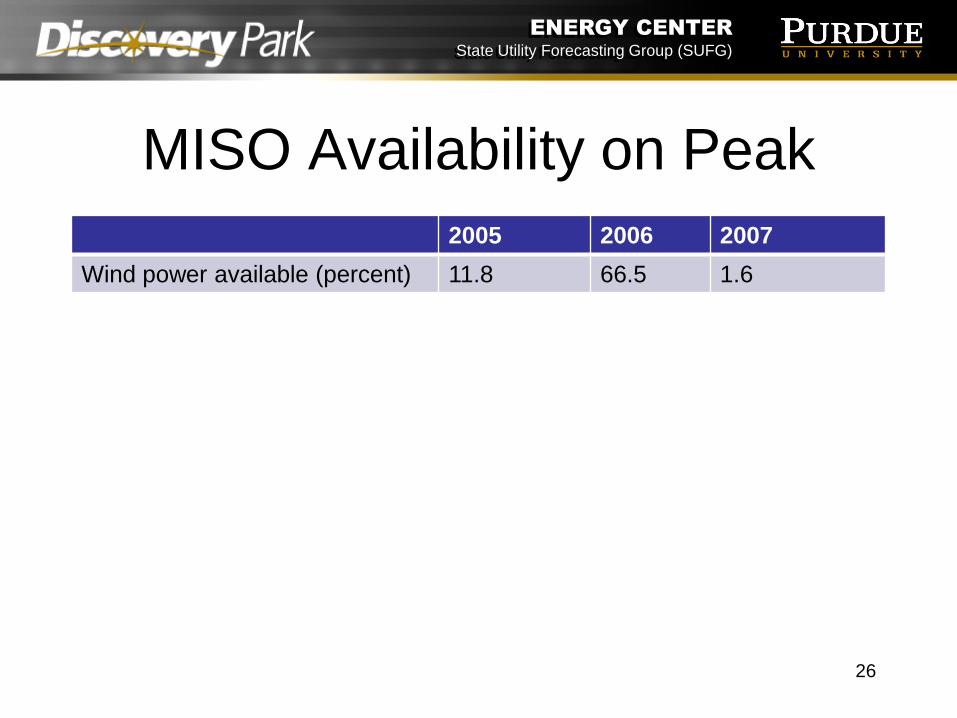
MISO Availability on Peak
2005 2006 2007
Wind power available (percent) 11.8 66.5 1.6
26

ENERGY CENTER
State Utility Forecasting Group (SUFG)
Effective Load Carrying
Capability• ELCC is the amount of new load that
can be added with a given amount of
new generation while maintaining a
constant loss of load probability
27
ENERGY CENTER
State Utility Forecasting Group (SUFG)
Estimated Wind Capacity
• A number of entities have estimated the
capacity value of wind
• Results vary considerably, from a low of
5% (Idaho Power) to 33% (Portland
General Electric)
• SUFG used 10% in its most recent
forecast projections
28
ENERGY CENTER
State Utility Forecasting Group (SUFG)
Perceptions about Wind
• Wind is strongest in the winter/spring
and weakest in the summer
• Wind is strongest in the middle of the
night
• Wind speed is low when electricity
demand is high
29
ENERGY CENTER
State Utility Forecasting Group (SUFG)
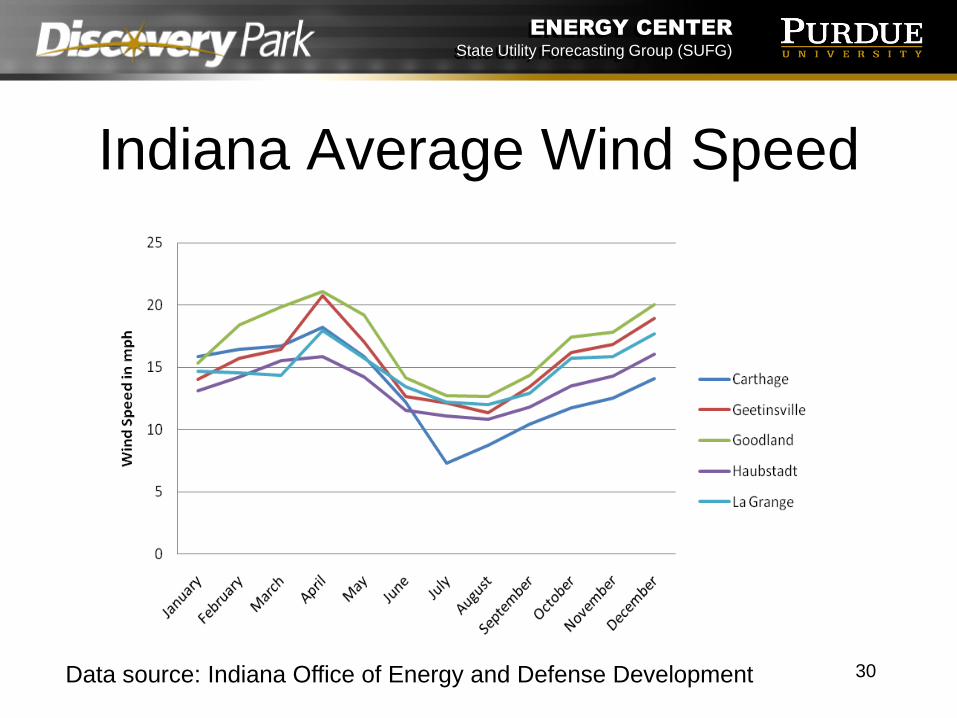
Indiana Average Wind Speed
Data source: Indiana Office of Energy and Defense Development 30
ENERGY CENTER
State Utility Forecasting Group (SUFG)
Solar Power
• Solar power is also intermittent, but is
more predictable than wind
– the sun will not be out in the middle of the
night
– solar intensity tends to be greater in the
summer
– cloud cover can introduce short term
variations in output
31
ENERGY CENTER
State Utility Forecasting Group (SUFG)
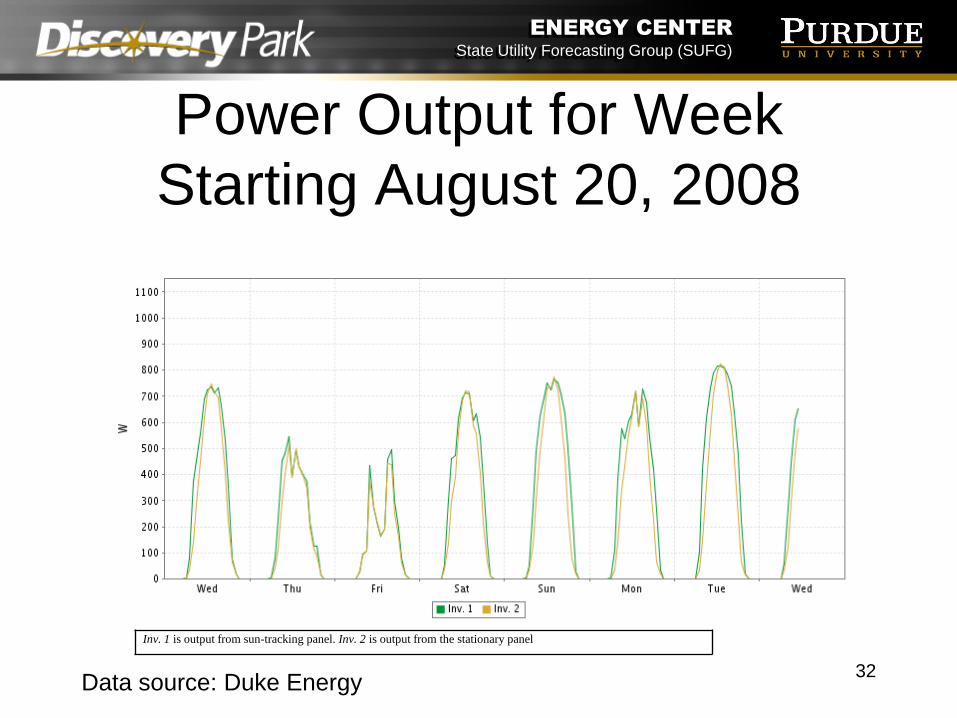
Power Output for Week
Starting August 20, 2008
Inv. 1 is output from sun-tracking panel. Inv. 2 is output from the stationary panel
Data source: Duke Energy32

ENERGY CENTER
State Utility Forecasting Group (SUFG)
Water Power
• Run-of-the-river hydroelectric power is
also variable
• Output is very predictable in the short
term
• Wave and tidal power are also variable
but largely predictable
33
ENERGY CENTER
State Utility Forecasting Group (SUFG)
Hydrothermal Coordination
• If the amount of water is limited in an
impoundment hydro facility (a dam), the
economic dispatch order is changed
34

ENERGY CENTER
State Utility Forecasting Group (SUFG)
Geographic Diversity
• As intermittent resources are developed
in diverse locations, intermittency issues
tend to be mitigated somewhat
– If the wind stops blowing at one location, it
may be still blowing at another
35
ENERGY CENTER
State Utility Forecasting Group (SUFG)
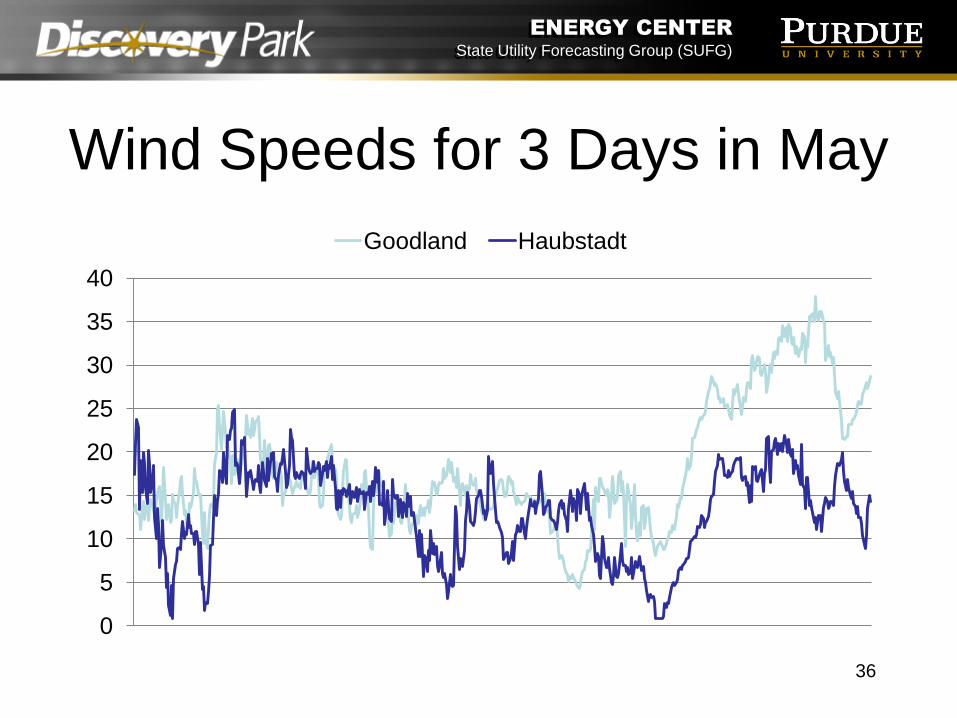
Wind Speeds for 3 Days in May
0
5
10
15
20
25
30
35
40
Goodland Haubstadt
36
ENERGY CENTER
State Utility Forecasting Group (SUFG)
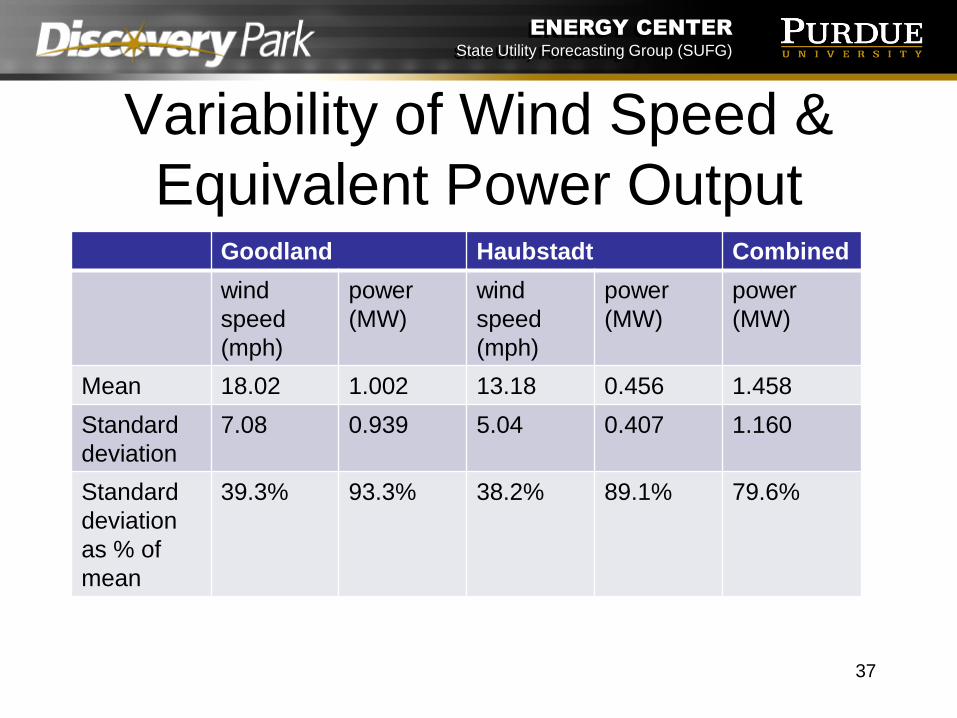
Variability of Wind Speed &
Equivalent Power OutputGoodland Haubstadt Combined
wind
speed
(mph)
power
(MW)
wind
speed
(mph)
power
(MW)
power
(MW)
Mean 18.02 1.002 13.18 0.456 1.458
Standard
deviation
7.08 0.939 5.04 0.407 1.160
Standard
deviation
as % of
mean
39.3% 93.3% 38.2% 89.1% 79.6%
37

ENERGY CENTER
State Utility Forecasting Group (SUFG)
An Academic Exercise
38
ENERGY CENTER
State Utility Forecasting Group (SUFG)
Actual Indiana Data
• Statewide electricity consumption data
for every hour of the year
• Wind speed data for every 10 minutes
over a 12-month period
– 5 missing data points, values interpolated
• Consumption and wind speed data
come from different years
– Correlation between wind and demand is
lost 39
ENERGY CENTER
State Utility Forecasting Group (SUFG)
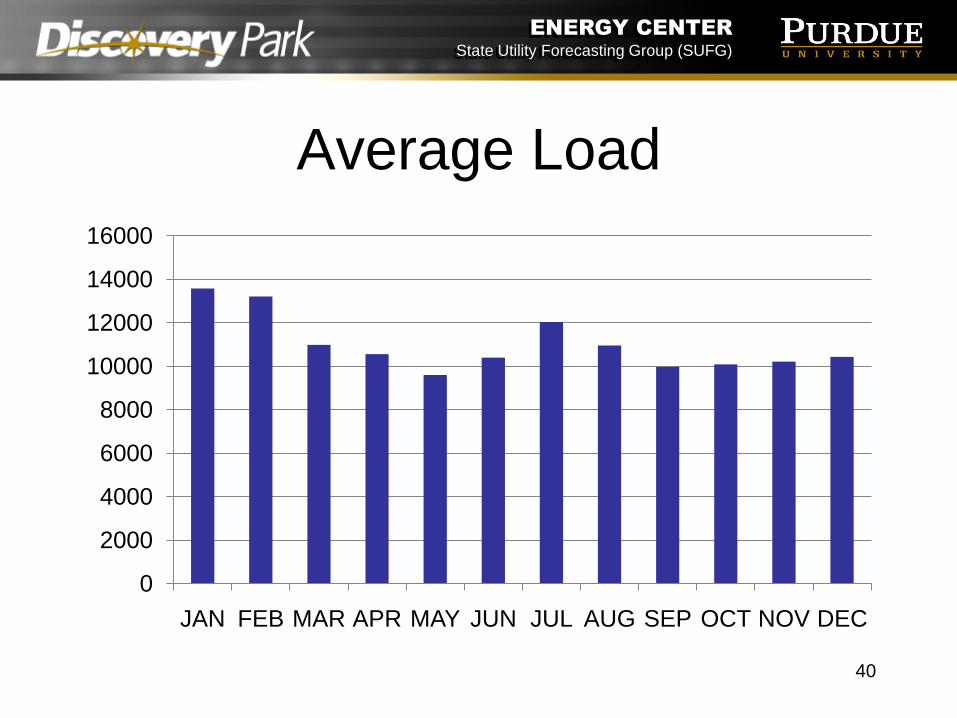
Average Load
0
2000
4000
6000
8000
10000
12000
14000
16000
JAN FEB MAR APR MAY JUN JUL AUG SEP OCT NOV DEC
40
ENERGY CENTER
State Utility Forecasting Group (SUFG)
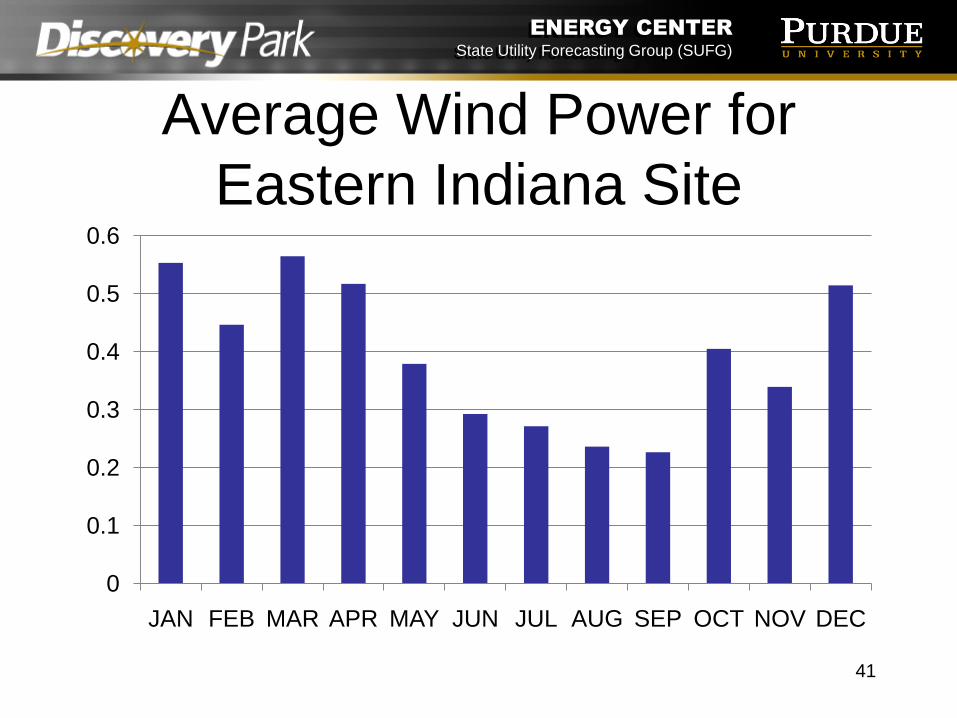
Average Wind Power for
Eastern Indiana Site
0
0.1
0.2
0.3
0.4
0.5
0.6
JAN FEB MAR APR MAY JUN JUL AUG SEP OCT NOV DEC
41
ENERGY CENTER
State Utility Forecasting Group (SUFG)
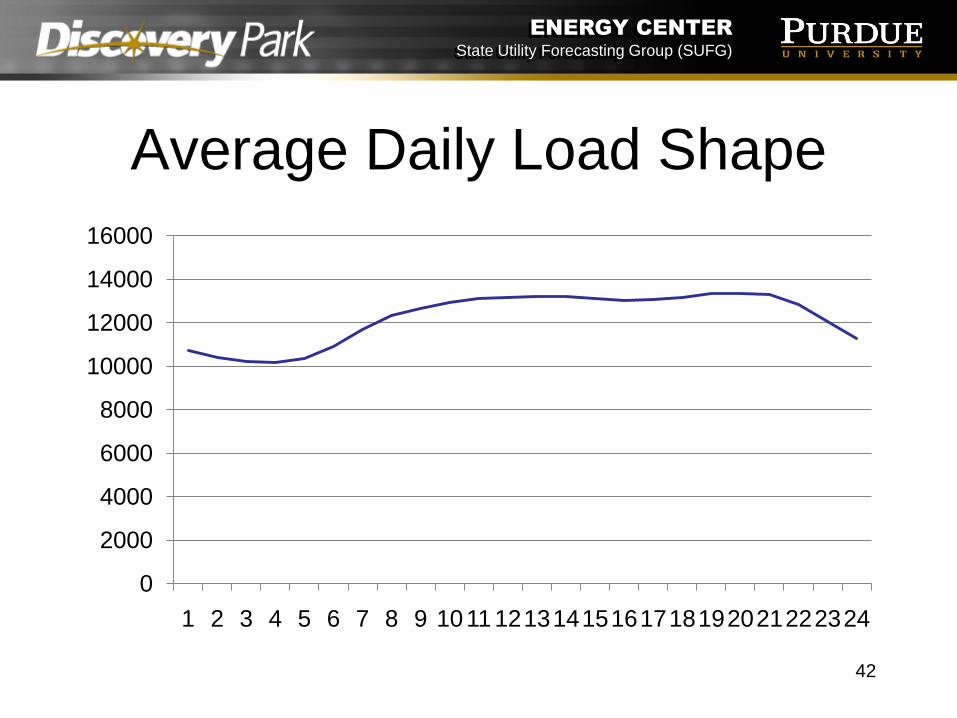
Average Daily Load Shape
0
2000
4000
6000
8000
10000
12000
14000
16000
1 2 3 4 5 6 7 8 9 1011 12131415161718192021222324
42
ENERGY CENTER
State Utility Forecasting Group (SUFG)
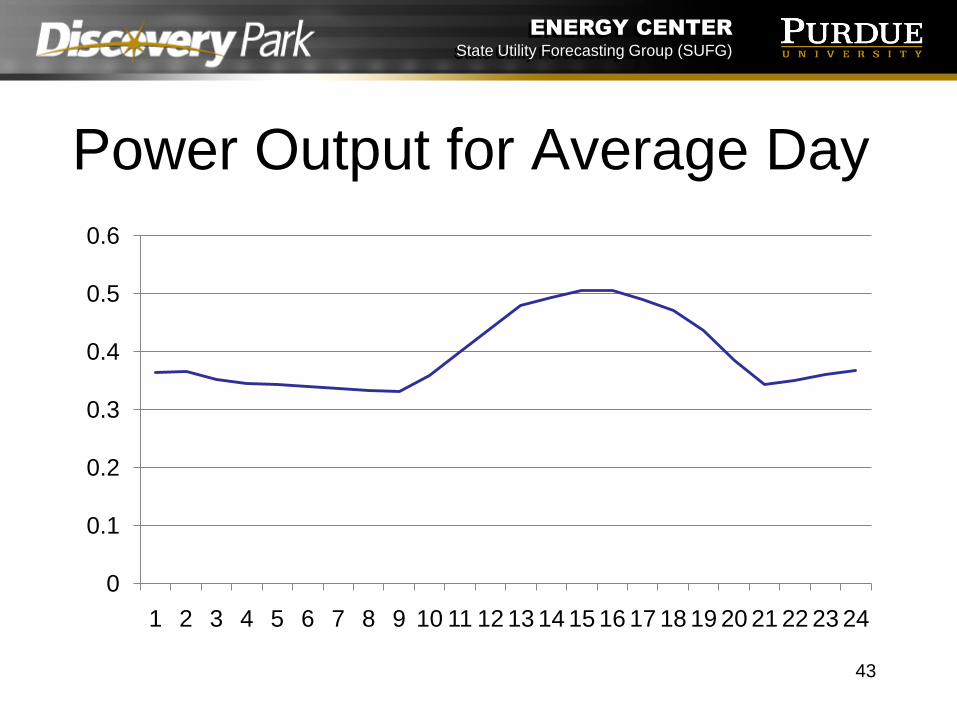
Power Output for Average Day
0
0.1
0.2
0.3
0.4
0.5
0.6
1 2 3 4 5 6 7 8 9 10 11 12 13 14 15 16 17 18 19 20 21 22 23 24
43
ENERGY CENTER
State Utility Forecasting Group (SUFG)
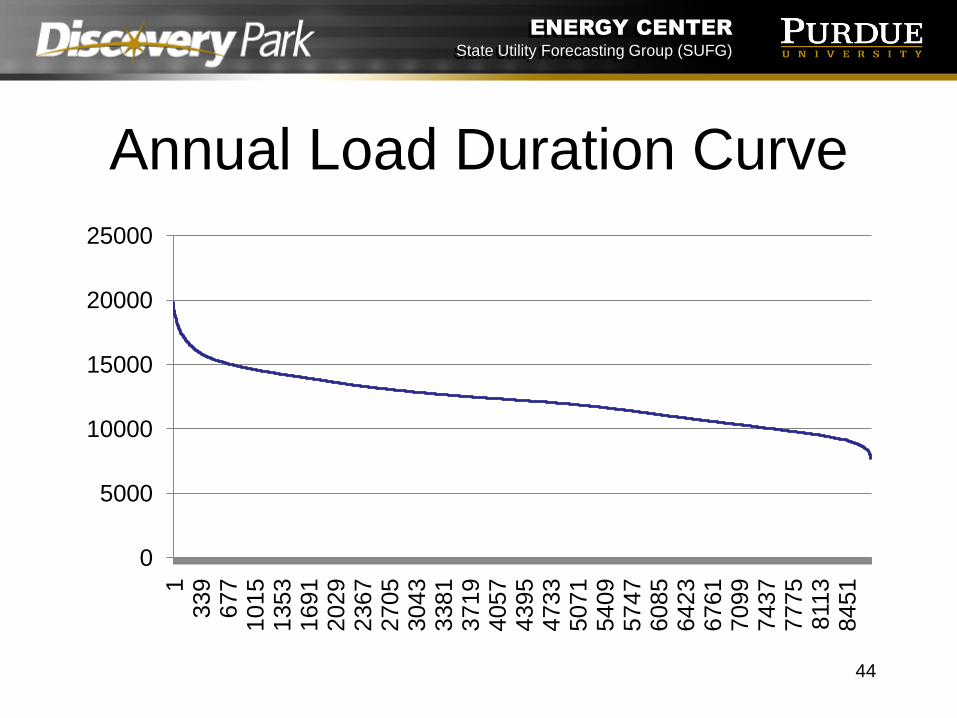
Annual Load Duration Curve
0
5000
10000
15000
20000
25000
1339
677
1015
1353
1691
2029
2367
2705
3043
3381
3719
4057
4395
4733
5071
5409
5747
6085
6423
6761
7099
7437
7775
8113
8451
44
ENERGY CENTER
State Utility Forecasting Group (SUFG)
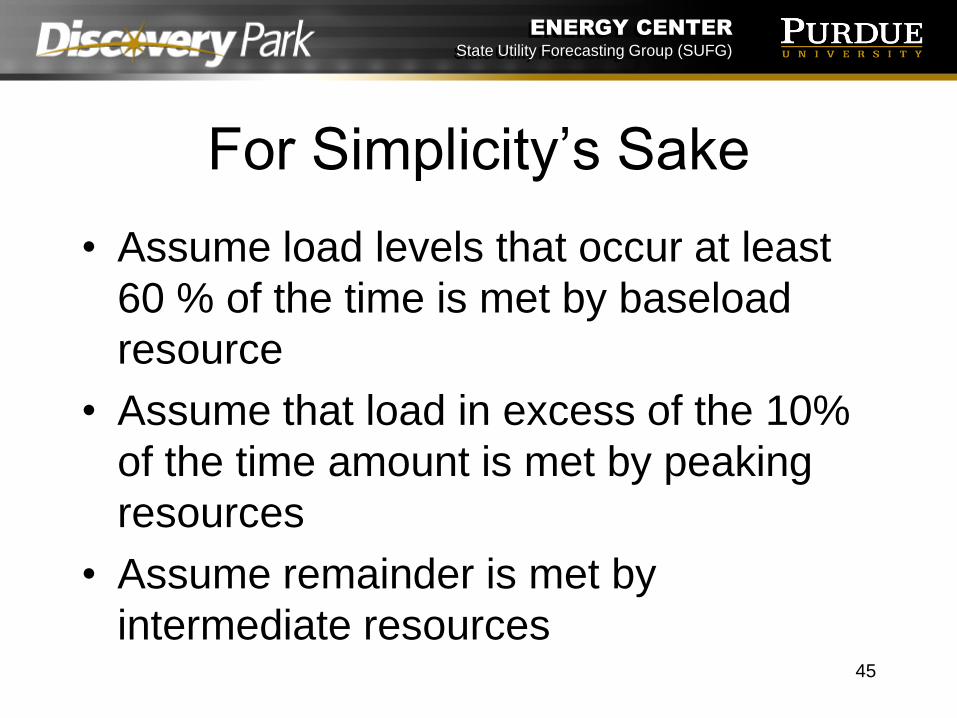
For Simplicity’s Sake
• Assume load levels that occur at least
60 % of the time is met by baseload
resource
• Assume that load in excess of the 10%
of the time amount is met by peaking
resources
• Assume remainder is met by
intermediate resources45
ENERGY CENTER
State Utility Forecasting Group (SUFG)
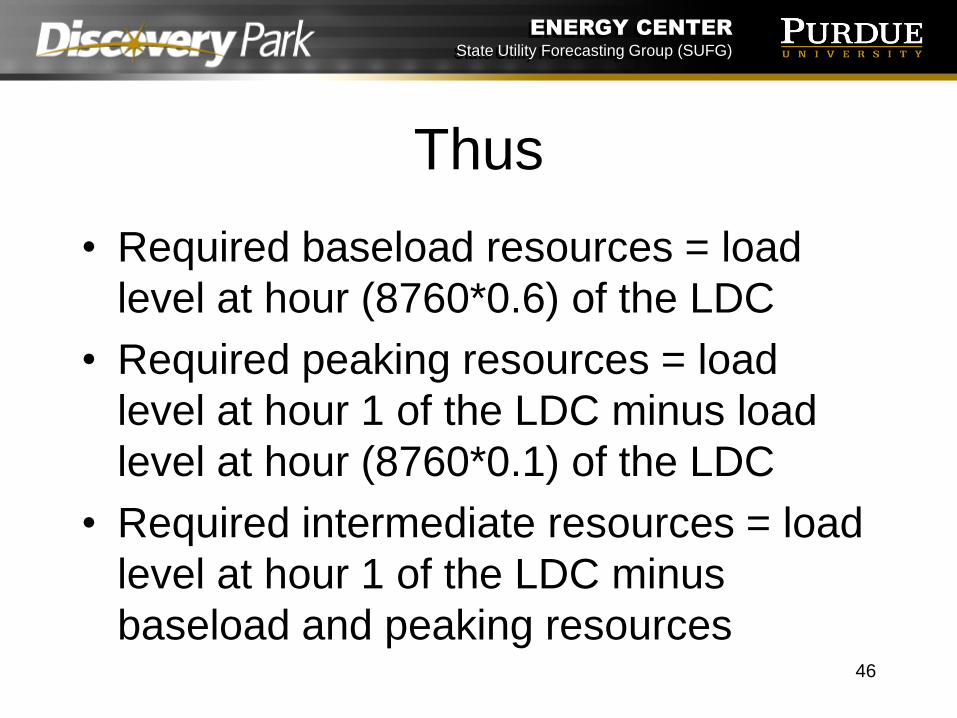
Thus
• Required baseload resources = load
level at hour (8760*0.6) of the LDC
• Required peaking resources = load
level at hour 1 of the LDC minus load
level at hour (8760*0.1) of the LDC
• Required intermediate resources = load
level at hour 1 of the LDC minus
baseload and peaking resources46
ENERGY CENTER
State Utility Forecasting Group (SUFG)
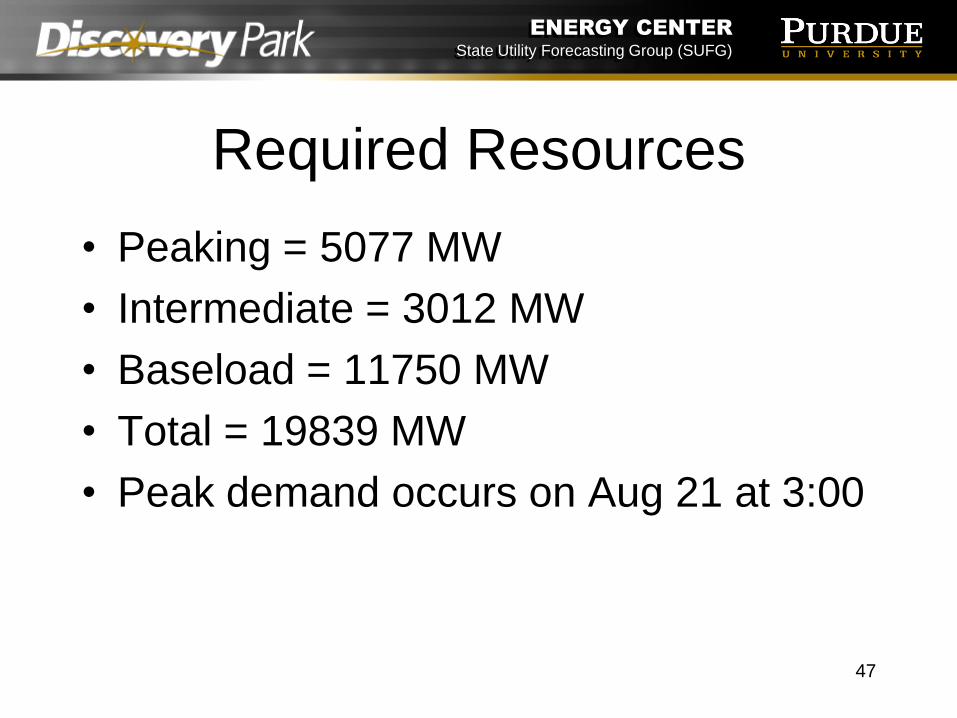
Required Resources
• Peaking = 5077 MW
• Intermediate = 3012 MW
• Baseload = 11750 MW
• Total = 19839 MW
• Peak demand occurs on Aug 21 at 3:00
47
ENERGY CENTER
State Utility Forecasting Group (SUFG)
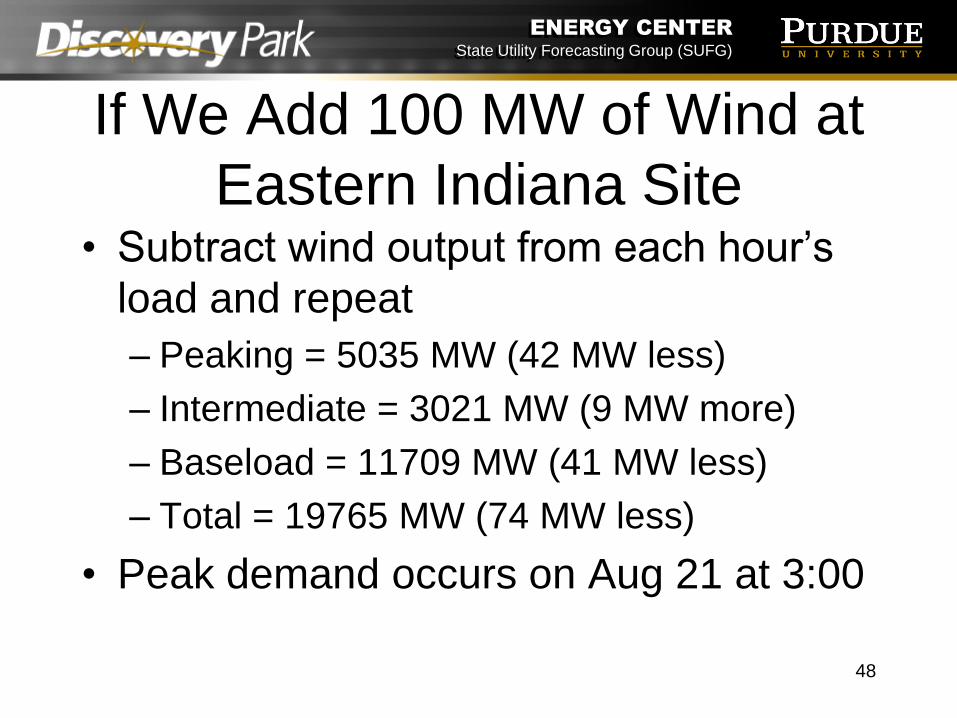
If We Add 100 MW of Wind at
Eastern Indiana Site• Subtract wind output from each hour’s
load and repeat
– Peaking = 5035 MW (42 MW less)
– Intermediate = 3021 MW (9 MW more)
– Baseload = 11709 MW (41 MW less)
– Total = 19765 MW (74 MW less)
• Peak demand occurs on Aug 21 at 3:00
48
ENERGY CENTER
State Utility Forecasting Group (SUFG)
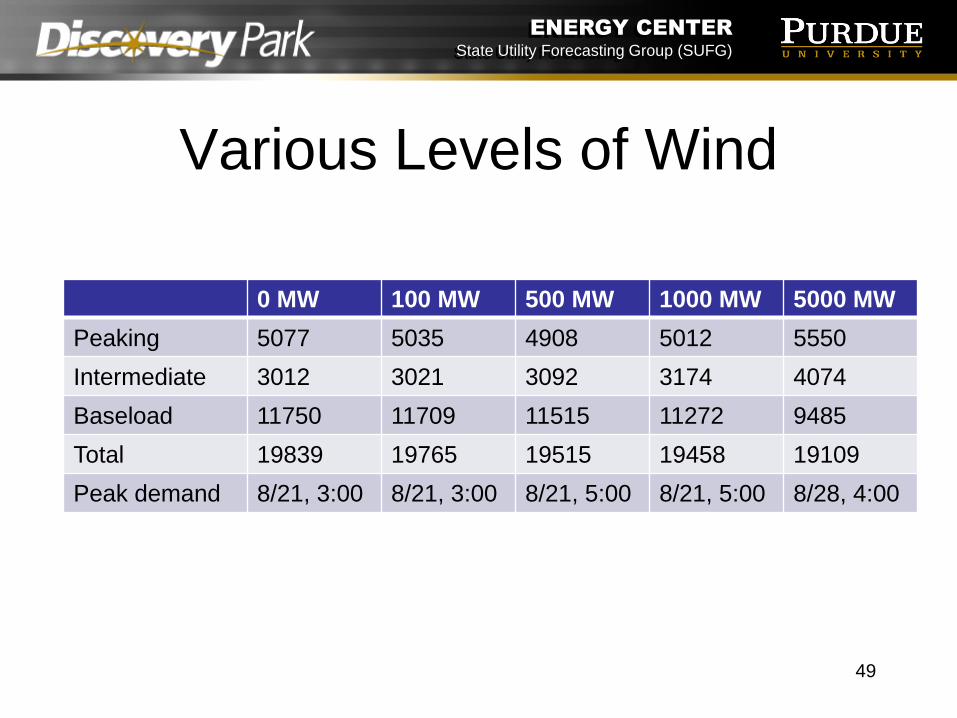
Various Levels of Wind
0 MW 100 MW 500 MW 1000 MW 5000 MW
Peaking 5077 5035 4908 5012 5550
Intermediate 3012 3021 3092 3174 4074
Baseload 11750 11709 11515 11272 9485
Total 19839 19765 19515 19458 19109
Peak demand 8/21, 3:00 8/21, 3:00 8/21, 5:00 8/21, 5:00 8/28, 4:00
49
ENERGY CENTER
State Utility Forecasting Group (SUFG)
Geographic Diversity
• Artificially simulate geographic wind
diversity by delaying wind profile by 24
hours to create second site
• Keeps average wind for a given hour
the same
• Does not change seasonal wind speeds
• Some correlation exists between 2 sites
50
ENERGY CENTER
State Utility Forecasting Group (SUFG)
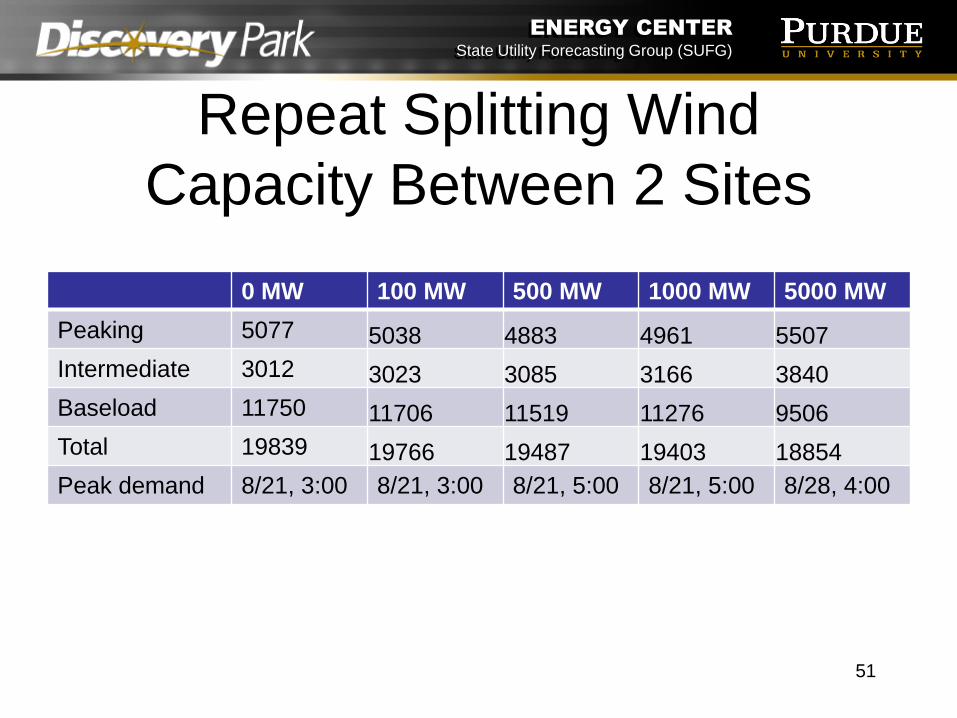
Repeat Splitting Wind
Capacity Between 2 Sites
0 MW 100 MW 500 MW 1000 MW 5000 MW
Peaking 5077 5038 4883 4961 5507
Intermediate 3012 3023 3085 3166 3840
Baseload 11750 11706 11519 11276 9506
Total 19839 19766 19487 19403 18854
Peak demand 8/21, 3:00 8/21, 3:00 8/21, 5:00 8/21, 5:00 8/28, 4:00
51
ENERGY CENTER
State Utility Forecasting Group (SUFG)
Summary
• Adding large scale wind tends to
decrease remaining capacity needs
– reduces remaining baseload needs
– increases remaining peaking &
intermediate needs
• Geographic diversity tends to increase
capacity value
52
ENERGY CENTER
State Utility Forecasting Group (SUFG)
Further Information
• State Utility Forecasting Group
– http://www.purdue.edu/dp/energy/SUFG/
53