Embed Size (px)
Citation preview

Integrated Solid Waste Management: An Approach for Enhancing Climate Co-benefits through Resource Recovery
S.N.M.Menikpura, Janya SANG-ARUN and Magnus Bengtsson
Sustainable Consumption and Production Group Institute for Global Environmental Strategies (IGES)
Symposium for Launching of the Special Volume of the Journal of Cleaner Production (Elsevier) on Climate Co-Benefits in Urban Asia, 16 October 2013, UNU, Yokohama, Japan

Introduction
• Municipal solid waste (MSW) management is becoming increasingly pressing matter in many developing countries
• In Asia, MSW generation surpasses 760,000 tonnes/day and, this figure will increase to 1.8 million tonnes /day in 2025
• Many developing Asian countries are practicing open dumping and sanitary landfilling without gas recovery as main disposal methods
• Such poor waste management has caused severe deterioration of environment, economic losses and social burdens
• Application of high-end technologies may not be the immediate solution since such technologies cannot best suit to the local conditions of the developing countries
2
Introduction Methodology Results and Discussion Conclusion
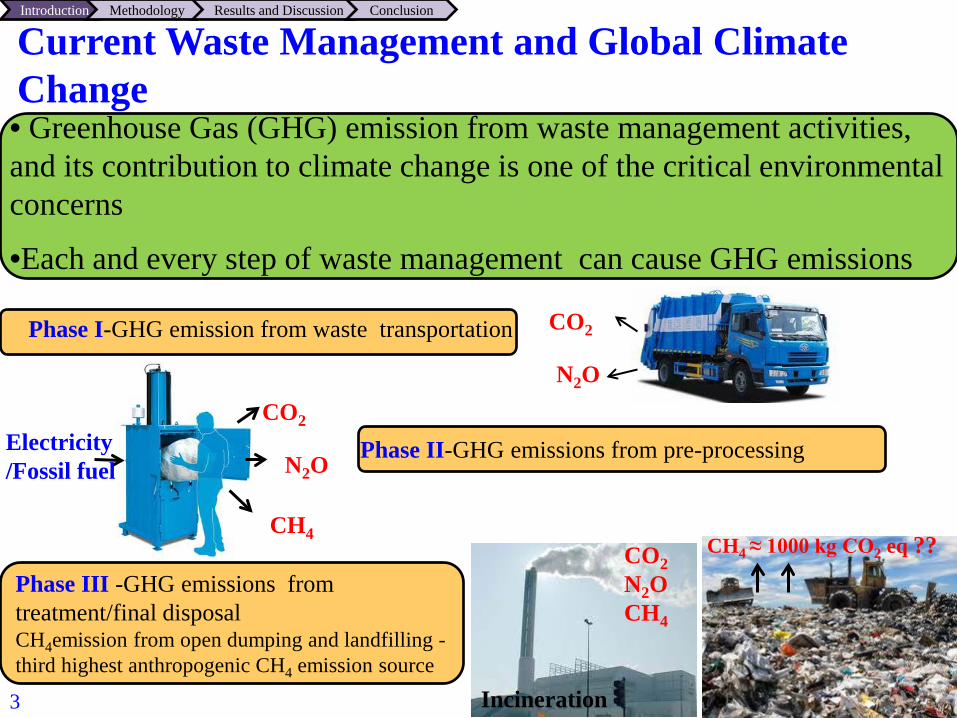
Current Waste Management and Global Climate Change • Greenhouse Gas (GHG) emission from waste management activities, and its contribution to climate change is one of the critical environmental concerns
•Each and every step of waste management can cause GHG emissions
Phase I-GHG emission from waste transportation CO2
N2O
Phase II-GHG emissions from pre-processing Electricity /Fossil fuel
CO2
N2O
CH4 Phase III -GHG emissions from treatment/final disposal CH4emission from open dumping and landfilling -third highest anthropogenic CH4 emission source Incineration
CO2 N2O CH4
CH4 ≈ 1000 kg CO2 eq ??
3
Introduction Methodology Results and Discussion Conclusion

Integrated Solid Waste Management (ISWM): A Practical Solution Towards Zero GHG Emission
Integrated waste
management
Improve the efficiency waste management and reduce the emissions to
air, water, soil
Recovery of materials and energy from waste
and replace the conventional production
processes
Improve the well-being of the local community
-Creation of jobs - Improving the indirect income generation ways
Creation of ways of revenue generation to all the stakeholders in waste
management process chain
Environmental benefits
Environmental benefits Economic benefits
Social benefits
•ISWM would be the most promising approach to solve the waste management crisis since it provides multiple benefits from waste
4
•These benefits from ISWM can be achieved by selecting and adapting the best suited technologies to a particular municipality
Introduction Methodology Results and Discussion Conclusion

Materials and energy recovery from waste could contribute to significant GHG reduction that would otherwise occur through the conventional processes
Collection of recyclables
Pre-processing : cutting, cleaning, baling
Energy, materials
Energy, materials
Emissions e.g: GHG
Emissions e.g: GHG
Energy, materials Emissions
e.g: GHG
Transportation to the recycling facility )
Energy, materials
Emissions e.g: GHG
Recycling process
Avoided Energy, materials
Avoided GHG Emissions
Recovery of materials and avoided virgin production chains
3
How Does ISWM System Contribute for GHG Mitigation?
5
Example
Introduction Methodology Results and Discussion Conclusion

Waste Plastic
Recycled Plastic
Recycling
Waste Paper Recycled Paper
Plastic recycling
Paper recycling
Energy
GHG
Replace virgin plastic Energy crude oil as raw materials
GHG
Energy
GHG
Energy
GHG
Replace virgin paper
6
How Does ISWM System Contribute for GHG Mitigation?
Introduction Methodology Results and Discussion Conclusion

Anaerobic digestion
Organic waste Marketable compost
Composting
Biogas production
Energy GHG
Energy GHG
Energy GHG
Energy GHG
Avoid conventional fossil fuel Biogas production form organic waste
Compost production from organic waste Avoid conventional
fertilizer
7
How Does ISWM System Contribute for GHG Mitigation?
Organic waste
Avoid organic waste landfilling
Energy GHG
Avoid organic waste landfilling
Energy GHG
Introduction Methodology Results and Discussion Conclusion

• GHG mitigation potential via ISWM was evaluated by using an example in practice
• The Muangklang Municipality is located in Rayong Province (190 km from East Bangkok)
• It has a total of 13 communities and covers 14.5 km2
• The registered population within the Municipality -17,200 (Dec 2010)
• This municipality has initiated an ISWM system as a sustainable solution by incorporating effective waste collection and transportation service, waste sorting facility for recovery of recyclables, anaerobic digestion facility, composting facility, raising some farm animals to feed organic waste and so on
Methodology
8
Introduction Methodology Results and Discussion Conclusion
Selection of the study location

Existing ISWM in Mungklang Municipality, Thailand
9
Introduction Methodology Results and Discussion Conclusion

Development of LCA Framework for Estimating GHG Emissions from ISWM System
Introduction Methodology Results and Discussion Conclusion
•Life Cycle Assessment (LCA) is a useful methodology for estimating the possible mitigation options of environment impacts •LCA framework designed considering all the phases of integrated system •Inventory analysis was performed to account fossil fuel and electricity consumption, recovery of materials/energy from waste treatment methods and potential avoidance of materials/energy production from virgin processes
10
Introduction Methodology Results and Discussion Conclusion
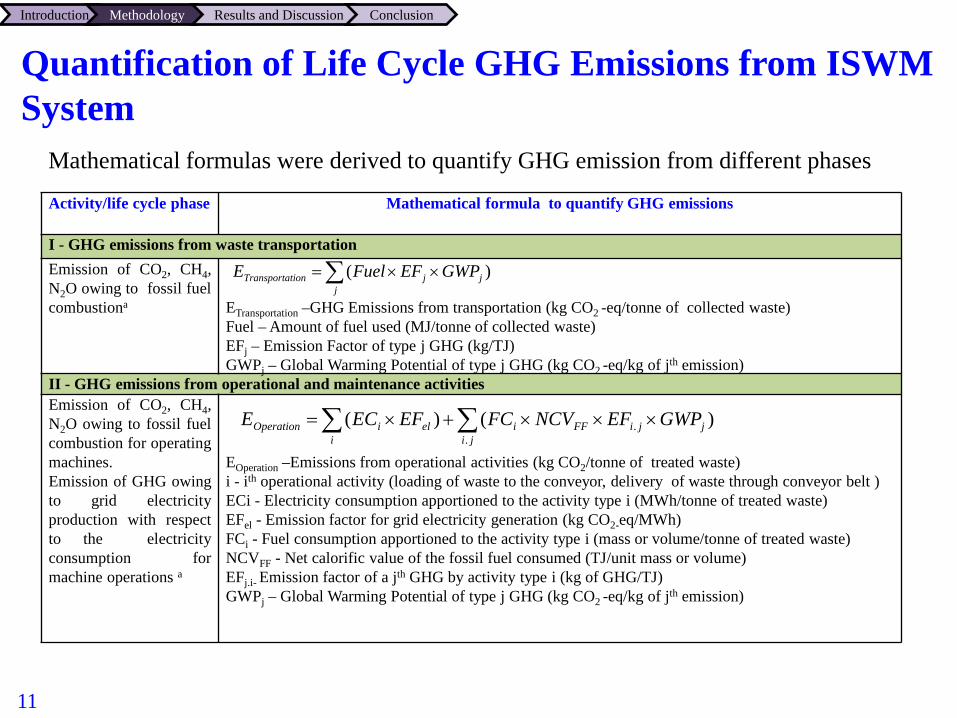
Quantification of Life Cycle GHG Emissions from ISWM System
Mathematical formulas were derived to quantify GHG emission from different phases
Activity/life cycle phase Mathematical formula to quantify GHG emissions
I - GHG emissions from waste transportation Emission of CO2, CH4, N2O owing to fossil fuel combustiona
ETransportation –GHG Emissions from transportation (kg CO2 -eq/tonne of collected waste) Fuel – Amount of fuel used (MJ/tonne of collected waste) EFj – Emission Factor of type j GHG (kg/TJ) GWPj – Global Warming Potential of type j GHG (kg CO2 -eq/kg of jth emission)
II - GHG emissions from operational and maintenance activities Emission of CO2, CH4, N2O owing to fossil fuel combustion for operating machines. Emission of GHG owing to grid electricity production with respect to the electricity consumption for machine operations a
EOperation –Emissions from operational activities (kg CO2/tonne of treated waste) i - ith operational activity (loading of waste to the conveyor, delivery of waste through conveyor belt ) ECi - Electricity consumption apportioned to the activity type i (MWh/tonne of treated waste) EFel - Emission factor for grid electricity generation (kg CO2-eq/MWh) FCi - Fuel consumption apportioned to the activity type i (mass or volume/tonne of treated waste) NCVFF - Net calorific value of the fossil fuel consumed (TJ/unit mass or volume) EFj.i- Emission factor of a jth GHG by activity type i (kg of GHG/TJ) GWPj – Global Warming Potential of type j GHG (kg CO2 -eq/kg of jth emission)
∑ ××=j
jjtionTransporta GWPEFFuelE )(
)()( ..
jjiFFi ji
ieliOperation GWPEFNCVFCEFECE ×××+×=∑ ∑
11

Quantification of Life Cycle GHG Emissions from ISWM System
Introduction Methodology Results and Discussion Conclusion
Activity/life cycle phase
Mathematical formula to quantify GHG emissions
III - GHG emissions from biological treatment: Anaerobic digestion and composting Emission of CH4 and N2O from the biological degradation of organic wasteb
ETreatment – Emissions from treatment of organic waste (kg CO2/tonne of organic waste) ECH4- Emission of CH4 during waste degradation (kg of CH4/tonne of organic waste) GWPCH4- Global warming potential of CH4 (25 kg CO2/kg of CH4) EN2O- Emission of N2O during waste degradation (kg of N2O/tonne of organic waste) GWPN2O- Global warming potential of N2O (310 kg CO2/kg of N2O)
IV - GHG emissions from use of organic waste as animal feed CH4 emissions from animal manure management. CH4 emission from enteric fermentation is assumed to be negligible from the type of animals raised at Muangklangb
ETreatment = Emissions from treatment by utilizing organic waste as an animal feed (kg CO2/tonne of organic waste) Ei- Emission factor from manure management for ith livestock category (kg CH4 head-1year-1 ai – No of animals belongs to ith category x – Total amount of organic waste used as animal feed materials (tonnes/year) GWPCH4- Global Warming Potential of CH4 (kg CO2 -eq/kg of CH4)
V - GHG emissions from final disposal at the sanitary landfill CH4 emissions during the waste degradation in the landfillb
IPCC 2006 waste model was used to quantify the CH4 emission from waste degradation
)( 2244 ONONCHCHTreatment GWPEGWPEE ×+×=
41)( CH
iiiTreatment GWP
xaEE ×××=∑
GHG Direct emissions = E Transportations + E Operations + E Treatment GHG Avoidance = )( ii
i EFPA ×∑GHG Net emissions = GHG Direct emissions – GHG Avoidance 12

Results and Discussions Introduction Methodology Results and Discussion Conclusion
Inventory Analysis
Life cycle phase/Treatment method
Unit Amount of input energy/ materials
Amount of recovered energy/materials
Avoided energy/materials consumption for conventional production processes
Transportation Per tonne of waste Diesel fuel – 2.13 L 0.00 0.00
Recycling
Sorting of per tonne of mixed recyclables
Electricity – 1.54 kWh Recovered mixed recyclables – 1000 kg 0.00
Recycling of per tonne of mixed recyclables
Electricity – 193 kWh Hard coal – 146 kg Soft coal – 350 kg Heavy fuel oil – 29 kg Natural Gas – 304 m3
Recycled paper –357.2 kg Plastic granules – 360 kg Aluminium ingot –38 kg Recycled steel – 45 kg Recycled glass – 95 kg
Electricity – 1043 kWh Hard coal – 261 kg Soft coal – 240 kg Heavy fuel oil – 376 kg Natural Gas – 364 m3
Anaerobic digestion
Per tonne of organic slurry
Diesel fuel – 0.29 L Biogas – 49.33 m3 LPG – 40.8 L
Composting Per tonne of organic waste
Diesel fuel – 1.76 L Compost – 194 kg c N –1.38 kg P – 0.79 kg K – 1.05 kg
Landfilling Per tonne of mixed waste
Diesel Fuel – 4.52 L 0.00 0.00
•Quantification of input energy, recovered and avoided energy and materials (through the conventional processes) from different treatment methods are the key information to estimate GHG emission
13

-3500
-3000
-2500
-2000
-1500
-1000
-500
0
500
1000
1500
Recycling Anaerobicdigestion
Composting Use asanimal feed
Landfilling Existingintegrated
system
-1674
-270
-1111 -848
572 287
GH
G (
kg o
f CO
2-eq
/tonn
e of
was
te)
Gross GHG emissions from treatmentTotal GHG savings (materials/energy recovery + avoided landfilling)Net GHG emissions
Net GHG emission potential from individual technologies and ISWM system
•Estimated results reflected GHG savings potential from all the technologies except landfilling •However, net impact from the ISWM system is still positive (GHG emission) due to high fraction of waste landfilling (69.6%)
14
+ Values = GHG emission
-Values = GHG savings
Net GHG emission from ISWM system
Introduction Methodology Results and Discussion Conclusion
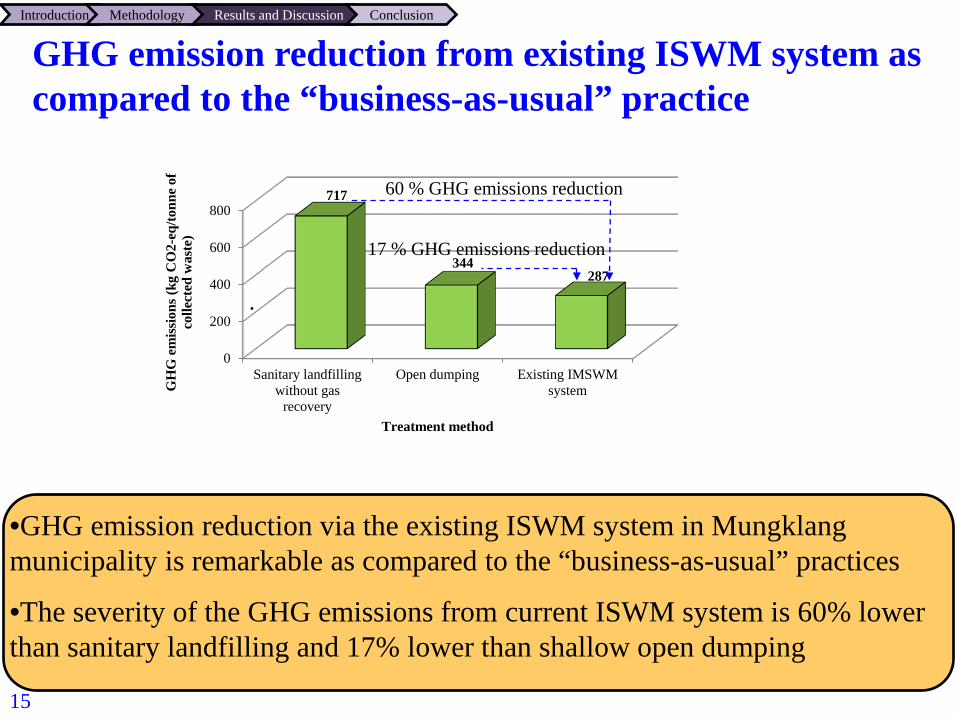
GHG emission reduction from existing ISWM system as compared to the “business-as-usual” practice
•GHG emission reduction via the existing ISWM system in Mungklang municipality is remarkable as compared to the “business-as-usual” practices
•The severity of the GHG emissions from current ISWM system is 60% lower than sanitary landfilling and 17% lower than shallow open dumping
.
15
Introduction Methodology Results and Discussion Conclusion
0
200
400
600
800
Sanitary landfillingwithout gas
recovery
Open dumping Existing IMSWMsystem
717
344 287
GH
G e
miss
ions
(kg
CO
2-eq
/tonn
e of
co
llect
ed w
aste
)
Treatment method
60 % GHG emissions reduction
17 % GHG emissions reduction
Conclusions
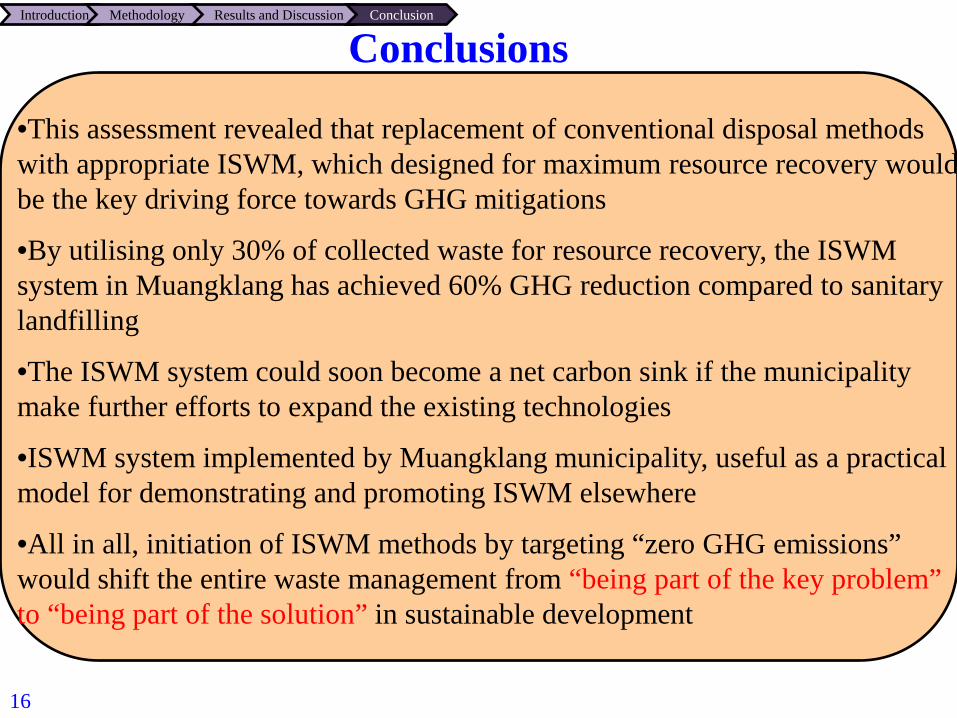
•This assessment revealed that replacement of conventional disposal methods with appropriate ISWM, which designed for maximum resource recovery would be the key driving force towards GHG mitigations
•By utilising only 30% of collected waste for resource recovery, the ISWM system in Muangklang has achieved 60% GHG reduction compared to sanitary landfilling
•The ISWM system could soon become a net carbon sink if the municipality make further efforts to expand the existing technologies
•ISWM system implemented by Muangklang municipality, useful as a practical model for demonstrating and promoting ISWM elsewhere
•All in all, initiation of ISWM methods by targeting “zero GHG emissions” would shift the entire waste management from “being part of the key problem” to “being part of the solution” in sustainable development
16
Introduction Methodology Results and Discussion Conclusion
Acknowledgement
•The authors would like to thank the Mayor of the Muangklang municipality, and his staff for their support extended to conduct the field survey and to collect necessary information and data •The authors acknowledge the financial support from the Ministry of the Environment Japan (MOEJ) under the project of MRV capacity building in Asia for the establishment of new market mechanisms
21
Nirmala Menikpura, PhD
Sustainable Consumption and Production (SCP) Group
Institute of Global Environmental Strategies (IGES)
E-mail: [email protected]