Embed Size (px)
Citation preview

NORTH CAROLINA LAW REVIEW
Volume 88 | Number 3 Article 7
3-1-2010
Integrated Education and Mathematics Outcomes:A Synthesis of Social Science ResearchRoslyn Arlin Mickelson
Martha Bottia
Follow this and additional works at: http://scholarship.law.unc.edu/nclr
Part of the Law Commons
This Article is brought to you for free and open access by Carolina Law Scholarship Repository. It has been accepted for inclusion in North CarolinaLaw Review by an authorized administrator of Carolina Law Scholarship Repository. For more information, please contact [email protected].
Recommended CitationRoslyn A. Mickelson & Martha Bottia, Integrated Education and Mathematics Outcomes: A Synthesis of Social Science Research, 88 N.C. L.Rev. 993 (2010).Available at: http://scholarship.law.unc.edu/nclr/vol88/iss3/7
INTEGRATED EDUCATION ANDMATHEMATICS OUTCOMES: A SYNTHESIS OF
SOCIAL SCIENCE RESEARCH*
ROSLYN ARLIN MICKELSON** AND MARTHA BOTIIA***
Mastery of mathematics and science by this nation's youth isessential for the nation's future development as well as students'personal growth and economic well-being. Yet the performance ofU.S. students in mathematics and science is unimpressive comparedto other advanced industrialized nations. In addition, stark racialand socioeconomic status ("SES") disparities in mathematicsknowledge, skills, and achievement compound the predicamentpresented by the overall mediocre performance of U.S. students. Agrowing corpus of social science research indicates school racialand socioeconomic segregation are institutional sources of thedisparate outcomes. Ironically, while the empirical evidenceregarding the positive effects of racially and socioeconomicallyintegrated learning environments has grown clearer and moredefinitive, the 2007 Supreme Court decision in Parents Involved inCommunity Schools v. Seattle School District No. 1 has made itmore difficult to create diverse schools.
This Article clarifies the social science record about schoolcomposition effects on mathematics outcomes in K-12 schools bypresenting a comprehensive synthesis of the educational,behavioral, and social science literatures on the topic. It combinesnarrative and vote-counting approaches to synthesize fifty-nine
* © 2010 Roslyn Arlin Mickelson and Martha Bottia. An earlier version of this Article
was presented at Looking to the Future: Legal and Policy Options for Racially IntegratedEducation in the South and the Nation, April 2, 2009, Chapel Hill, North Carolina. Thisresearch is supported by grants to the first author from the National Science Foundation(REESE-060562), the American Sociological Association, and the Poverty and RaceResearch Action Council.
** Professor of Sociology and Public Policy, Information Technology, and Women'sStudies, University of North Carolina at Charlotte. Ph.D., 1984, M.A., 1981, M.A., 1974,B.A., 1969, University of California Los Angeles.*** Ph.D. candidate in Public Policy, University of North Carolina at Charlotte. Ph.D.,
2010, M.A., 2006, University of North Carolina at Charlotte; M.A., 2003, B.S., 2001,Universidad de Los Andes.

994 NORTH CAROLINA LAW REVIEW [Vol. 88
articles that met inclusion criteria that included: researchdisseminated in 1990 or later; reported effects of school racialand/or socioeconomic composition on mathematics outcomes;utilized a quantitative measure of any type of mathematicsoutcomes as a dependent variable; and employed appropriatestatistical techniques given the structure of the data. Together, thefifty-nine articles demonstrate the relevance of school racial andsocioeconomic diversity for enhancing mathematics outcomes forelementary, middle, and high school students. Mathematicsoutcomes are likely to be higher for students from all grade levels,racial, and SES backgrounds who attend racially andsocioeconomically integrated schools. Given these findings, parents,educators, policy makers, and jurists should address the role ofschool racial segregation and concentrated poverty in thepersistence of achievement gaps in mathematics outcomes.
INTROD U CTIO N ....................................................................................... 9951. B A CKGROUND ............................................................................ 1001II. THE SCOPE OF THE PROBLEM .................................................. 1007III. TERM INOLOGY ........................................................................... 1012IV . M ETH O D S .................................................................................... 1016
A . D atabase Searches ............................................................... 1019B . Inclusion Criteria ................................................................. 1021C. Coding the Studies ............................................................... 1023D. Standards for Drawing Conclusions from theE vidence ....................................................................................... 1024
1. Q uality ............................................................................ 10242. Quantity and Strength of the Evidence ...................... 1025
V. FINDINGS-OVERVIEW OF EFFECTS OF SCHOOL-LEVELINTEGRATION ON MATHEMATICS OUTCOMES ...................... 1026A. Findings by Student Race .................................................... 1029
1. B lacks .............................................................................. 10322. W hites ............................................................................. 10333. L atinos/as ........................................................................ 10344. A sians ............................................................................. 10355. N ative A m ericans .......................................................... 10356. Im m igrants ..................................................................... 10367. M inorities ....................................................................... 1036
B. Findings by Student SES ..................................................... 1036C. Findings by Grade Level ..................................................... 1038
1. H igh School Sam ples .................................................... 10382. High School and Middle School Samples ................... 1039

2010] ED UCA TION & MATH 0 UTCOMES 995
3. M iddle School Sam ples ................................................. 10404. Elementary School Samples ......................................... 10405. Middle and Elementary School Samples .................... 10416. Combined Elementary, Middle, and High School
Sam ples ........................................................................... 1041V I. D ISCU SSIO N ................................................................................. 1042C O N CLU SIO N ......................................................................................... 1048A PPE N D IX .............................................................................................. 1052
INTRODUCTION
Overall mathematics and science performance by U.S. students isrelatively unimpressive compared to the performance of studentsfrom other industrialized nations.1 Mastery of mathematics andscience by this nation's youth is essential for societal advancement.Innovations in the fields of science, technology, engineering,transportation, medicine, public health and safety, and commercerequire citizens with mathematical knowledge and skills. The nation'sability to prepare the next generation to enter the increasinglytechnical workplace requires the public school system, where the vastmajority of children receive their formal educations,2 to successfullyteach mathematics to all children.
Striking racial and socioeconomic status ("SES") disparities inmathematics knowledge, skills, and achievement compound theurgent predicament presented by the overall mediocre performanceof U.S. students.3 White, Asian, and middle-class students scorehigher on achievement tests, are more likely to enroll in morerigorous courses during high school, to attend college, and to choosescientific, mathematical, engineering, and technical majors than their
1. Maria Glod, Scores on Science Test Causing Concerns in U.S., WASH. POST, Dec.10, 2008, at A10; see NAT'L MATHEMATICS ADVISORY PANEL, U.S. DEP'T OF EDUC.,FINAL REPORT OF THE NATIONAL MATHEMATICS ADVISORY PANEL, at xii (2008),available at http://www.ed.gov/about/bdscomm/list/mathpanel/report/final-report.pdf.
2. NAT'L CTR. FOR EDUC. STATISTICS, U.S. DEP'T OF EDUC., NCES 2009-081,Indicator 5-Private School Enrollment, in THE CONDITION OF EDUCATION 2009, at 12,12-13 (2009), available at http://nces.ed.gov/pubs2009/2009081.pdf.
3. NAT'L CTR. FOR EDUC. STATISTICS, U.S. DEP'T OF EDUC., NCES 2006-453, THENATION'S REPORT CARD: MATHEMATICS 2005, at 6-8 (2005), available athttp://nces.ed.gov/nationsreportcard/pdf/main2005/2006453.pdf; NAT'L CTR. FOR EDUC.STATISTICS, U.S. DEP'T OF EDUC., NCES 2006-466, THE NATION'S REPORT CARD:
SCIENCE 2005, at 8-9 (2006), available at http://nces.ed.gov/nationsreportcard/pdf/main2005/2006466.pdf; NAT'L MATHEMATICS ADVISORY PANEL, supra note 1, at xii.

NORTH CAROLINA LAW REVIEW
less advantaged working-class, Black, Latino/a, and Native Americancounterparts.4 Weak mathematics knowledge and skills are not onlydetrimental for disadvantaged youths' futures and their communities'well-being, but collectively their poor mathematics outcomes areproblematic for the nation's future workforce given the relativeyouthfulness and high growth rates of Black, Latino/a, NativeAmerican, and low-income populations.'
The importance of numeracy to students' long-term educationaland occupational success is increasing. Workers across almost everyoccupational strata employ mathematical concepts in their everydaylives.6 Math educator and MacArthur Foundation Genius Awardwinner Robert Moses characterizes numeracy, particularly in algebra,as a civil right.7 Mastery of algebra is a gateway to higher levelmathematics, science, and technology courses during secondaryschool.8 Moses argues that economic access and full citizenshipdepend crucially upon math and science literacy.9 He comparesdisadvantaged youths' struggles for opportunities to learnmathematics and science to their parents' struggles to secure politicalaccess in the form of voting rights during the 1950s and 1960s.10
Economic access-in particular, professional and entrepreneurialopportunities in the information economy-is largely restricted tothose with knowledge, skills, and understandings of mathematics,
4. COLLEGE BD., COLLEGE-BOUND SENIORS 2008: TOTAL GROUP PROFILEREPORT 3-4 (2008), http://professionals.collegeboard.com/profdownload/TotalGroup_Report.pdf; NAT'L CTR. FOR EDUC. STATISTICS, U.S. DEP'T OF EDUC., NCES 2007-467,AMERICA'S HIGH SCHOOL GRADUATES: RESULTS FROM THE 2005 NAEP HIGH
SCHOOL TRANSCRIPT STUDY 26-33 (2007), available at http://nces.ed.gov/nationsreportcard/pdf/studies/2007467.pdf.
5. NAT'L MATHEMATICS ADVISORY PANEL, supra note 1, at xii.6. Id.; see COMM'N ON MATHEMATICS & SCI. EDUC., THE CARNEGIE CORP. OF
N.Y., THE OPPORTUNITY EQUATION: TRANSFORMING MATHEMATICS AND SCIENCEEDUCATION FOR CITIZENSHIP AND THE GLOBAL ECONOMY, at vii (2008), available athttp://www.opportunityequation.org/TheOpportunityEquation.pdf; Gail Burrill,Mathematics Education: The Future and the Past Create a Context for Today's Issues, inTHE GREAT CURRICULUM DEBATE 25, 25-26 (Tom Loveless ed., 2001).
7. ROBERT P. MOSES & CHARLES E. COBB, JR., RADICAL EQUATIONS: MATH
LITERACY AND CIVIL RIGHTS 12-22 (2001) (describing the case for why mathematicsliteracy is a contemporary civil rights issue for low-income minority students and how theAlgebra Project in rural Mississippi approaches the challenge of meeting the numeracychallenge).
8. Id.9. Id.
10. Id.
[Vol. 88

ED UCA TION & MATH 0 UTCOMES
science, and technology."I Reconceptualizing the nature of the gaps asbetween children of color and low-income youths' currentunderachievement and their potential to meet criterion levels ofperformance,12 rather than as among the races or the classes, as istypically done, positions educators and policy makers to identify thesocial structural sources of the gaps.
Social structural, or institutional, sources constitute only oneaspect of a complex dynamic that underlies the gaps. This dynamicinvolves individual motivation and abilities; family financial, cultural,and social capital resources; community forces such as norms andvalues; as well as the social structure of opportunities to learn. 3 Thesestructural and historical processes organize access and give meaningto an individual's mathematics participation and achievement.' 4
Importantly, institutional contributions to racial and SES gaps inmathematics outcomes are more amenable to change through policyactions than factors like motivation, cultural norms, or family income.
School racial segregation is a notorious institutional source of thedisparities. From the era of Brown v. Board of Education15 throughthe early 1990s, Supreme Court opinions 6 and many public policies
11. William F. Tate, School Mathematics and African American Students: ThinkingSeriously About Opportunity-to-Learn Standards, 31 EDuC. ADMIN. Q. 424,424-34 (1995).
12. Asa G. Hilliard III, No Mystery: Closing the Achievement Gap Between AfricanAmericans and Excellence, in YOUNG GIFTED AND BLACK 131, 138 (Theresa Perry,Claude Steele & Asa G. Hilliard III eds., 2003).
13. DANIEL CHAZAN, BEYOND FORMULAS IN MATHEMATICS AND TEACHING:
DYNAMICS OF THE HIGH SCHOOL ALGEBRA CLASSROOM 55-57 (2000); DANNY
BERNARD MARTIN, MATHEMATICS SUCCESS AND FAILURE AMONG AFRICAN-
AMERICAN YOUTH: THE ROLES OF SOCIOHISTORICAL CONTEXT, COMMUNITY FORCES,
SCHOOL INFLUENCE, AND INDIVIDUAL AGENCY, at vii (2000).14. CHAZAN, supra note 13, at 55-57; Rogers Hall, Book Review, EDUC.
RESEARCHER, Oct. 2002, at 39, 39 (reviewing ROBERT P. MOSES & CHARLES E. COBB,JR., RADICAL EQUATIONS: MATH LITERACY AND CIVIL RIGHTS (1999), DANNY
BERNARD MARTIN, MATHEMATICS SUCCESS AND FAILURE AMONG AFRICAN-
AMERICAN YOUTH: THE ROLES OF SOCIOHISTORICAL CONTEXT, COMMUNITY FORCES,SCHOOL INFLUENCE, AND INDIVIDUAL AGENCY (2000)).
15. 347 U.S. 483 (1954). In Mendez v. Westminster School District, 161 F.2d 774, 780(9th Cir. 1947) (en banc), the Ninth Circuit held that the segregation of Mexican Americanstudents violated state law and, only by extension, their constitutional rights. Although theruling applied to segregation in California public schools, it foreshadowed Brown. SeeVicki L. Ruiz, We Always Tell Our Children They Are Americans: Mendez v. Westminsterand the California Road to Brown v. Board of Education, 2003 C. BD. REV. 1, 3.
16. Jack Boger, A Quick Look at the Remedial Responsibilities Under the FederalConstitution for School Districts Found to Have Practiced De Jure, or IntentionalSegregation of Their Public Schools-And a Judicial Consideration of the RelationBetween Continuing School Segregation and Private Housing Choices in Formerly
2010]

NORTH CAROLINA LAW REVIEW [Vol. 88
had been directed-with varying degrees of clarity and success-atcreating schools that are not organized along racial lines. The nationmade substantial progress toward this goal through the 1980s,especially in the South, after federal court orders to desegregate wereeventually implemented. 7 Since the mid-1980s, however, progresstoward integrated education has faltered as the federal governmentstepped back from pursuing desegregation, and once-desegregatedschools in many areas began to resegregate. 8 School socioeconomicsegregation, which is closely correlated with racial segregation,intensified as well.19
One aspect of the debate about the effects of school race andschool SES composition concerns whether race effects are, in fact,actually SES effects. Racial gaps in achievement and othereducational outcomes persist even after researchers control forparental income, education, and other measures of socioeconomicstatus. 20 Importantly, racial gaps in mathematics achievement remainafter statistically controlling for mechanisms widely believed to be theunderlying explanations for SES gaps in achievement.2'
Segregated School Districts 1-3 (May 2, 2002) (unpublished manuscript, on file with theNorth Carolina Law Review) (summarizing Supreme Court jurisprudence). See generallyANGELO N. ANCHETA, SCIENTIFIC EVIDENCE AND EQUAL PROTECTION OF THE LAW
(2006) (analyzing the role of scientific evidence in judicial processes in key equalprotection cases); RICHARD KLUGER, SIMPLE JUSTICE: THE HISTORY OF BROWN V.BOARD OF EDUCATION AND BLACK AMERICA'S STRUGGLE FOR EQUALITY (1975)(chronicling the twentieth-century history of school segregation and desegregation effortsthat culminated in the 1954 Brown decision).
17. Erwin Chermerinsky, The Segregation and Resegregation of American PublicEducation: The Courts' Role, in SCHOOL RESEGREGATION: MUST THE SOUTH TURNBACK? 29, 29 (John Charles Boger & Gary Orfield eds., 2005).
18. See GARY ORFIELD & ERICA FRANKENBERG, THE CIVIL RIGHTSPROJECTIPROYECTO DERECHOS CIVILES (UCLA), THE LAST HAVE BECOME FIRST:RURAL AND SMALL TOWN AMERICA LEAD THE WAY ON DESEGREGATION 6 (2008),available at http://www.civilrightsproject.ucla.edu/research/deseg/lasthavebecomefirst.pdf(reporting on trends in racial and economic segregation by type and size of community).
19. Id. at 8; GARY ORFIELD, THE CIVIL RIGHTS PROJECr/PROYECTO DERECHOSCIVILES (UCLA), REVIVING THE GOAL OF AN INTEGRATED SOCIETY: A 21STCENTURY CHALLENGE 9 (2009), available at http://www.civilrightsproject.ucla.edu/research/deseg/revivingthe._goal mlk. 2009.pdf.
20. Eric Grodsky, John Robert Warren & Erika Felts, Testing and Social Stratificationin American Education, 34 ANN. REV. SoC. 385, 387 (2008); Stephanie Moller et al.,Smooth and Rough Roads to Academic Achievement: Retention and Race/Class Disparitiesin High School, 35 SOC. SCI. RES. 157, 159, 167 (2006).
21. Katerina Bodovski & George Farkas, "Concerted Cultivation" and UnequalAchievement in Elementary School, 37 SOC. SCI. RES. 903, 917 (2008); Jacob E. Cheadle,
ED UCA TION & MATH 0 UTCOMES
Unpacking the unique contributions of racial composition andSES composition to achievement outcomes is a methodologicalchallenge with striking implications for educational policy andpractice. For example, if SES and race are not interchangeableconstructs, using SES as a criterion for pupil assignment will notachieve racially diverse schools.22 Statistically decomposing raceeffects from SES effects is premised on a belief that they are distinctsocial forces. Even though the analytic strategies used in many of thestudies synthesized in this Article isolate the effects of a school'sracial composition from the effects of its socioeconomic composition,in practice the two social constructs are interwoven-sometimesseamlessly-in the lived realities of students and schools. The actualexperience of attending a racially diverse low-poverty school is verydifferent from attending a racially diverse high-poverty school.Similarly, students experience their lives at the intersections of theirown race, class, and gender as White working-class females or Blackmiddle-class males, or as wealthy Asian immigrants, or as low-incomeLatinas, and so on. But being able to statistically identify the uniquecontribution of race and SES to school effects should not allow us todisregard how the two constructs interact, and how the resultingexperience is different than merely the sum of their distinct parts.
This Article focuses on the relationships between persistent gapsin mathematics achievement and the racial and socioeconomiccomposition of the K-12 schools students attend.23 Contemporaryefforts to improve mathematics outcomes generally focus onimproving curricula, enhancing teacher quality, and the three linkedreform strategies of standards, assessment, and accountability.24
Compared to much of the second half of the twentieth century whendesegregation efforts were front-and-center to reform efforts, today
Educational Investment, Family Context, and Children's Math and Reading Growth fromKindergarten Through the Third Grade, 81 SOc. EDUC. 1, 13-15 (2008).
22. See Brief of Amicus Curiae Walt Sherlin in Support of Respondents at 2-4,Parents Involved in Cmty. Sch. v. Seattle Sch. Dist. No. 1, 551 U.S. 701 (2007) (Nos. 05-908& 05-915); Sean F. Reardon, John T. Yun & Michal Kurlaender, Implications of Income-Based School Assignment Policies for Racial School Segregation, 28 EDUC. EVALUATION& POL'Y ANALYSIS 49, 55-57, 67 (2006).
23. This Article is the first in a series of manuscripts the authors plan to write.Subsequent articles will synthesize the social and behavioral science literatures on scienceoutcomes, reading and verbal achievement, and nonacademic outcomes that unfold overthe life course (e.g., interracial friendship patterns, occupational attainment,characteristics of adult neighborhoods and workplaces, and criminal justice outcomes).
24. See NAT'L MATHEMATICS ADVISORY PANEL, supra note 1, at xvi-xxv.
2010]

NORTH CAROLINA LAW REVIEW
policy makers and researchers pay much less attention to the role thatschool racial composition has on educational outcomes.25
Recent empirical research demonstrates that compositionalcharacteristics of schools and classrooms are important contributingfactors to persistent race, ethnic, and social class differences inachievement.26 A sizable body of high quality social science researchreports that students attending schools with concentrations of low-income and disadvantaged minority populations achieve much lessacademic progress than their counterparts in integrated schools.27
Ironically, while the empirical evidence regarding the positiveeffects of racially and socioeconomically integrated learningenvironments has grown clearer and more definitive, the 2007Supreme Court decision in Parents Involved in Community Schools v.Seattle School District No. 128 has made it more difficult to creatediverse schools. In Parents Involved, the Court concluded that theways the Seattle and Louisville school districts used an individualstudent's race as a component of their voluntary desegregationassignment plans were unconstitutional because the plans wereinsufficiently narrowly tailored to meet the Court's standards forstrict scrutiny.29 The decision limits the ways in which school districtsare able to use individual students' race for school assignments. 0
Significantly, five Justices recognized the state's compelling interest increating diverse public schools and in overcoming the growing racialisolation within them.3'
25. See Janice Petrovich, The Shifting Terrain of Educational Policy, in BRINGINGEQUITY BACK: RESEARCH FOR A NEW ERA IN AMERICAN EDUCATIONAL POLICY 3,6-
7 (Janice Petrovich & Amy Stuart Wells eds., 2005).26. See generally Roslyn Arlin Mickelson, Twenty-First Century Social Science on
School Racial Diversity and Educational Outcomes, 69 OHIO ST. L.J. 1173 (2008)(discussing new research on racial diversity in schools); Jacob L. Vigdor & Jens Ludwig,Segregation and the Test Score Gap, in STEADY GAINS AND STALLED PROGRESS:INEQUALITY AND THE BLACK-WHITE TEST SCORE GAP 181 (Katherine Magnuson &Jane Waldfogel eds., 2008) (reviewing test gap literature).
27. See infra Part V; Appendix.28. 551 U.S. 701 (2007).29. Id. at 720, 747-48.30. Posting of Jim Ryan to Supreme Court-School Integration, http://scintegration
.blogspot.com2007/06/guest-blogger-seattle-schools-and-bakke.html (June 28, 2007, 14:19EST).
31. Parents Involved, 551 U.S. at 782 (Kennedy, J., concurring); id. at 840 (Breyer, J.,dissenting).
1000 [Vol. 88

ED UCA TION & MATH 0 UTCOMES
The Article proceeds as follows. After discussing its relevance inlight of Parents Involved, the Article describes the nature of race andSES disparities in mathematics outcomes. The Article then explainsthe methodology used to conduct the integrative synthesis of theliterature, presents findings, and concludes with a discussion of theirimplications for further research and school reform policies aimed atboth improving mathematics outcomes for all students and narrowingthe race and SES gaps in performance.
I. BACKGROUND
Scholars of the Court have raised serious questions about socialscience's influence in Supreme Court decision making, especially indesegregation cases.32 The extent to which social science researchinfluenced the Justices' decision making in Parents Involved isunclear.33 Nonetheless, several Justices referred to social science
32. Scholars from many disciplines have commented extensively on the use of socialscience amicus briefs in educational rights cases. This lively debate is, however, beyond thescope of this paper. See, e.g., ANCHETA, supra note 16, passim; MARK A. CHESLER,JOSEPH SANDERS & DEBRA S. KALMUSS, SOCIAL SCIENCE IN COURT: MOBILIZINGEXPERTS IN THE SCHOOL DESEGREGATION CASES passim (1988); Angelo Ancheta, CivilRights, Education Research, and the Courts, 35 EDUC. RESEARCHER Jan.-Feb. 2006, at 26,26-27; Lee Epstein & Jack Knight, Mapping Out the Strategic Terrain: The InformationalRole of Amici Curiae, in SUPREME COURT DECISION-MAKING: NEW INSTITUTIONALISTAPPROACHES 215 passim (Cornell W. Clayton & Howard Gillman eds., 1999); HerbertGarfinkel, Social Science Evidence and the School Segregation Cases, 21 J. POL. 37, 38(1959); Murray Levine & Barbara Howe, The Penetration of Social Science into LegalCulture, 7 LAW & POL'Y 173 passim (1985); Samuel R. Lucas & Marcel Paret, Law, Race,and Education in the United States, 1 ANN. REV. L. & SOC. SC. 203, 203-04 (2005); Kelly J.Lynch, Best Friends?: Supreme Court Law Clerks on Effective Amicus Curiae Briefs, 20J.L. & POL. 33, 34-36 (2004); Beverly I. Moran, Constructing Reality: Social Science andRace Cases, 25 N. ILL. U. L. REV. 243 passim (2005); Ronald Roesch et al., Social Scienceand the Courts: The Role of Amicus Curiae Briefs, 15 LAW & HUM. BEHAV. 1, 2-3 (1991);Michael Rustad & Thomas Koenig, The Supreme Court and Junk Social Science: SelectiveDistortions in Amicus Briefs, 72 N.C. L. REV. 91, 119-39 (1993); James E. Ryan, TheLimited Influence of Social Science Evidence in Modern Desegregation Cases, 81 N.C. L.REV. 1659, 1659-61 (2003); Janet Ward Schofield & Linda R. M. Hausmann, SchoolDesegregation and Social Science Research, 59 AM. PSYCHOLOGIST 538, 543-45 (2004);William L. Taylor, Introduction and Overview: The Role of Social Science in SchoolDesegregation Efforts, 66 J. NEGRO EDUC. 196 passim (1997).
33. An opinion may not cite an amicus brief although its arguments may haveinfluenced a Justice's opinion. See Lynch, supra note 32, at 36. Conversely, as with the caseof the famous social science citations in Brown's footnote 11, Brown v. Board ofEducation (Brown 1), 347 U.S. 483, 494 n.11 (1959), which was not crucial to the Browndecision, 2 KLUGER, supra note 16, at 706, a citation of an amicus briefs social scienceargument does not necessarily mean it was vital to the Justice's opinion.
2010] 1001

NORTH CAROLINA LAW REVIEW
research in their opinions. The majority, concurring, and dissentingopinions expressed diametrically different interpretations of thesocial science research record on whether or not student body racialcomposition affects achievement. The opinions of Justice Breyer andJustice Thomas are emblematic of this tension: Justice Breyerreferred repeatedly to the voluminous social science research recordthat shows positive effects of racial desegregation on educationaloutcomes to support his opinion that there are broad compellinginterests in diversity and in avoiding racial isolation.34 In contrast,Justice Thomas wrote that the scientific record is too ambiguous andcontradictory to support a compelling interest in diversity." Hisopinion quoted directly from the text of two social science amicusbriefs filed on behalf of the petitioners to support his view: " '[i]nstudy after study, racial composition of a student body, when isolated,proves to be an insignificant determinant of student achievement,' "36and again with respect to the inferences about compelling interestsfrom the school diversity literature: " 'the research shows that there isno clear and consistent evidence of [educational] benefits' " of diverseschools.37
The references to social science research in the other ParentsInvolved opinions were more oblique. Chief Justice Roberts'splurality opinion did not cite any social science research or any of thesocial science briefs.38 But he noted that "[t]he parties and their amicidispute whether racial diversity in schools in fact has a marked impact
34. Parents Involved, 551 U.S. at 839-45 (Breyer, J., dissenting).35. Id. at 761 (Thomas, J., concurring). Justice Thomas's opinion selectively cited
from the corpus of social science and from portions of specific works of social science. Forinstance, Justice Thomas correctly noted that even in desegregated schools, Blacks areoften resegregated by academic tracking. His opinion ignored the other findings in thesame articles that demonstrated the benefits for Black and White students of attending aracially diverse school despite the deleterious effects of tracking. See Roslyn ArlinMickelson, Subverting Swann: First- and Second-Generation Segregation in the Charlotte-Mecklenburg Schools, 38 AM. EDuc. RES. J. 215, 233-34 (2001) (describing this practice inthe Charlotte-Mecklenburg Schools system); Susan Yonezawa et al., Choosing Tracks:"Freedom of Choice" in Detracting Schools, 39 AM. EDUc. RES. J. 37, 38 (2002)(discussing voluntary detracking programs and their effectiveness).
36. Parents Involved, 551 U.S. at 762 (Thomas, J., concurring) (alteration in original)(quoting Brief of Amici Curiae Drs. Murphy et al. in Support of Petitioners at 8, ParentsInvolved, 551 U.S. 701 (Nos. 05-908 & 05-915)).
37. Id. at 763 (alteration in original) (quoting Brief for David J. Armor et al. as AmiciCuriae Supporting Petitioners at 29, Parents Involved, 551 U.S. 701 (Nos. 05-908 & 05-915)).
38. Id. at 708-48 (plurality opinion).
1002 [Vol. 88

ED UCA TION & MATH 0 UTCOMES
on test scores and other objective yardsticks or achieves intangiblesocialization benefits."39 Neither Justice Kennedy's opinion norJustice Stevens's dissent directly referred to a social science study orto a specific social science amicus brief.'
Putting aside the question of how much the social science recorddid or did not contribute to the Justices' opinions, their conflictinginterpretations of the social science record suggest a need to clarifyprecisely what is known about the effects of school racial and SEScomposition on mathematics outcomes.
The primary aim of this Article is to clarify the social sciencerecord about school composition effects on mathematics outcomes inK-12 schools by presenting a comprehensive synthesis of theeducational, behavioral, and social science literatures on the topic.The need to clarify the scientific record arises not only from theconflicting interpretations displayed in the Parents Involved opinionsbut also because of the serious and persistent race and SES gaps inmathematics performance among the nation's youth.
Many eminent social scientists have summarized this literaturewithin the last two decades. Almost half of the amicus briefs filed inParents Involved included summaries of some of the relevant socialscience.41 It is, thus, reasonable to ask what benefits to scientificknowledge or public policy a new synthesis will offer. There areseveral reasons this Article's synthesis is timely and useful.
This Article is a more comprehensive and current review of thescientific literature on school compositional effects on mathematicsoutcomes than any of the recent syntheses that appeared either aspublished research or amicus briefs. In recent years, the corpus ofhigh quality research on the topic of compositional effects hasincreased dramatically, but many of the high quality newer empiricalworks were not included in the previous social science syntheses.42
39. Id. at 726.40. See id. at 782-98 (Kennedy, J. concurring); id. at 798-803 (Stevens, J., dissenting).41. COMM. ON SOC. SCI. RESEARCH EVIDENCE ON RACIAL DIVERSITY IN SCH.,
NAT'L ACAD. OF EDUC., RACE CONSCIOUS POLICIES FOR ASSIGNING STUDENTS TOSCHOOLS: SOCIAL SCIENCE RESEARCH AND SUPREME COURT CASES 1 (Robert L. Linn& Kevin G. Welner eds., 2007) [hereinafter NAEd REPORT 1, available athttp://www.naeducation.org/Meredith-Report.pdf (summarizing the social scienceresearch found in the sixty-four amicus briefs submitted in Parents Involved).
42. See generally David J. Armor, Desegregation and Academic Achievement, inSCHOOL DESEGREGATION IN THE 21ST CENTURY 147 (Christine H. Rossell, David J.Armor & Herbert J. Walberg eds., 2002) (arguing that desegregation offers too few
2010] 1003

NORTH CAROLINA LAW REVIEW
Even the most conscientious efforts to include the current research ina comprehensive synthesis unavoidably exclude key studies becauseof the constant appearance of new studies on any given topic.
More recent research on the topic is superior in quality to olderstudies of compositional effects on educational outcomes. Many earlystudies were experiments or quasi-experiments of desegregation plansimplemented in a single school district, where researchers employedsmall samples to evaluate a specific desegregation plan's outcomeswithin one or two years of the plan's implementation.43 A number ofthe early experimental studies on school desegregation were affectedby sample attrition, nonrandom assignment to experimental andcontrol conditions, weak measures of key constructs, or incomplete orinappropriate implementation of the desegregation treatment-allthreats to the studies' internal validity." Much of the research aboutthe effects of desegregation on Black students' achievementconducted between 1959 and the mid-1970s was inconsistent in itsfindings largely because it was methodologically inadequate.45
Even when the earlier research designs were experimentalstudies that randomly assigned subjects to the desegregationtreatment, their subjects were not randomly selected to participate inthe study.46 Therefore, at best, the early studies tell us aboutdesegregation effects in a particular community, but they cannot be
benefits and too many costs to be a viable school reform strategy); Jomills HenryBraddock III & Tamela McNulty Eitle, The Effects of School Desegregation, inHANDBOOK OF RESEARCH ON MULTICULTURAL EDUCATION 828 (James A. Banks ed.,2d ed. 2003) (indicating how school desegregation stimulates positive cognitive and socialpsychological outcomes for majority and minority youth); Maureen T. Hallinan, DiversityEffects on Student Outcomes: Social Science, 59 OHIO. ST. L.J. 733 (1998) (summarizingsocial science evidence on school diversity effects); Linda R. Tropp & Mary A. Prenovost,The Role of Intergroup Contact in Predicting Children's Interethnic Attitudes: Evidencefrom Meta-Analytic and Field Studies, in INTERGROUP ATTITUDES AND RELATIONS INCHILDHOOD THROUGH ADULTHOOD 236 (Sheri R. Levy & Melanie Killen eds., 2008)(synthesizing research that demonstrates why diverse schooling fosters positive intergroupattitudes); Amy S. Wells & Robert L. Crain, Perpetuation Theory and the Long-TermEffects of School Desegregation, 64 REv. EDUC. RES. 531 (1994) (synthesizing socialscience research that distinguishes the short- and long-term outcomes of schooldesegregation); Kevin G. Welner, K-12 Race-Conscious Student Assignment Policies: Law,Social Science, and Diversity, 76 REV. EDUC. RES. 349 (2006) (summarizing social scienceevidence on school diversity effects and placing research in a legal context).
43. Mickelson, supra note 26, at 1194.44. Id. at 1186, 1195.45. Lawrence A. Bradley & Gifford W. Bradley, The Academic Achievement of Black
Students in Desegregated Schools: A Critical Review, 47 REv. EDUC. RES. 299,444 (1977).46. See id.; Mickelson, supra note 26, at 1195.
1004 [Vol. 88

2010] EDUCATION & MATH OUTCOMES 1005
generalized to the larger population. At worst, the early studies tell useven less because of the multiple threats to their internal validitydiscussed above.47
Later studies used survey research with representative nationalsamples. Compared to earlier studies, the later ones were more likelyto employ sophisticated measures of achievement and to control forpossible mediating factors like family background, school quality, andother important predictors of achievement. 48 The advanced statisticalmethods available in recent decades, in conjunction with betterquality data, enhanced social scientists' capacities to isolate the roleof school racial composition on outcomes apart from other influentialfactors like school socioeconomic composition, student and teachercharacteristics, and family socioeconomic status.49
The important differences between early and later studies ofschool compositional effects are noteworthy because so many of theParents Involved amicus briefs summarized the social scienceliterature on the topic," making aspects of the briefs resemble a
47. Mickelson, supra note 26, at 1195-96. Two examples illustrate the limitations ofearly studies. The first was an evaluation of the Riverside, California, elementary schooldesegregation plan. The plan was initiated in 1965 shortly after the Watts riots in nearbyLos Angeles and implemented one year later. The plan consisted of one-way transfers ofBlack and Latino/a students to White schools. When the plan began, a minority child was,on average, one of two children of color in a classroom. It was not until the sixth and finalyear of the study that the percent of minority children in the classrooms (twenty percent)approximated the distribution of the minority children in the district. These (and other)implementation and design flaws undermined the integrity of the desegregation"treatment" and, hence, compromised the study's internal validity. See HAROLD B.GERARD & NORMAN MILLER, SCHOOL DESEGREGATION: A LONG TERM STUDY 58
(1975). Another study was an experiment of a city-to-suburban voluntary transfer programof Black children. Stanley M. Zdep, Educating Disadvantaged Children in SuburbanSchools: An Evaluation, 1 J. APPLIED SOC. PSYCHOL. 173, 181 (1971). Thirteen Black,inner-city first-grade volunteers were distributed among six suburban first-gradeclassrooms, and twelve second-grade volunteers were distributed among six second-gradeclassrooms. After one year, the results showed significant positive effects for outcomesamong first graders but no significant effects for second graders. The study's small sample,weak research design, and short implementation limited its internal validity and restrictedthe external validity of its conclusions. See Bradley & Bradley, supra note 45, at 438.
48. Mickelson, supra note 26, at 1195-96.49. Id. at 1196.50. See generally NAEd REPORT, supra note 41 (summarizing research on race-
conscious student assignment policies utilizing amicus curiae briefs filed before theSupreme Court); Linda R. Tropp, Amy E. Smith & Faye J. Crosby, The Use of Research inthe Seattle and Jefferson County Desegregation Cases: Connecting Social Science and theLaw, 7 ANALYSES SOC. ISSUES & PUB. POL'Y 93 (2007) (analyzing the use of socialscience in the Parents Involved decision). Although there were many more than five

NORTH CAROLINA LAW REVIEW
literature synthesis. But it is unwise for amicus briefs to be mistakenfor literature syntheses because they are rarely as comprehensive orobjective as a scholarly synthesis of a scientific literature.51 This isunderstandable given that briefs and scholarly syntheses, such as thisArticle, have different purposes. Amicus briefs are designed to bringto the attention of the Justices information relevant to parties' legaltheory. 2 But in the final analysis, all amicus briefs are to varyingdegrees an advocacy tool designed to convince the Court on one ormore issues.
Several influential social science amicus briefs in ParentsInvolved are illustrative of this larger point. The majority of thecitations to social science research in the briefs filed on behalf of thepetitioners53 relied on older studies (pre-1990) and ignored manyavailable newer ones (post-1990) not consistent with their legaltheory. 4 Without a current and complete survey of the social scienceliterature, these amicus briefs were dated and incomplete translationsof the scientific literature. By comparison, the vast majority of thestudies cited in the key social science amicus briefs filed on behalf ofthe respondents by the American Psychological Association,55 the
amicus briefs filed in Parents Involved, sections of five key briefs authored by socialscientists or organizations representing social scientists illustrate elements of a literaturesynthesis. See Brief of Amici Curiae Drs. Murphy et al. in Support of Petitioners at 8,Parents Involved in Cmty. Sch. v. Seattle Sch. Dist. No. 1, 551 U.S. 701 (2007) (Nos. 05-908& 05-915); Brief for David J. Armor et al. as Amici Curiae Supporting Petitioners at 5,Parents Involved, 551 U.S. 701 (Nos. 05-908 & 05-915); Brief for 553 Social Scientists asAmici Curiae Supporting Respondents at 2, Parents Involved, 551 U.S. 701 (Nos. 05-908 &05-915); Brief for the American Educational Research Ass'n as Amicus Curiae SupportingRespondents at 3, Parents Involved, 551 U.S. 701 (Nos. 05-908 & 05-915); Brief for AmiciCuriae the American Psychological Ass'n and the Washington State Psychological Ass'nin Support of Respondents at 2, Parents Involved, 551 U.S. 701 (Nos. 05-908 & 05-915).
51. See Ronald Roesch et al., supra note 32 at 2-3. See generally Rustad & Koenig,supra note 32 (examining the tension between objective social science research and thesocial science research included in amicus briefs); Ryan, supra note 32 (analyzing theimpact of social science research on modern desegregation cases).
52" See ANCHETA, supra note 16, at 135; Ancheta, supra note 32, at 28.53. See Brief of Amici Curiae Drs. Murphy et al. in Support of Petitioners, supra note
50, passim; Brief for David J. Armor et al. as Amici Curiae Supporting Petitioners, supranote 50, passim. The briefs filed by Armor et al., and Murphy et al., were quoted in JusticeThomas's opinion. Parents Involved, 551 U.S. at 762 (Thomas, J., concurring).
54. See NAEd REPORT, supra note 41, at 17-18; Mickelson, supra note 26, at 1197.55. See Mickelson, supra note 26, at 1197 (observing that eighty percent of the social
science citations in the Brief for Amici Curiae the American Psychological Ass'n and theWashington State Psychological Ass'n in Support of Respondents, supra note 50, werefrom 1990 or later).
1006 [Vol. 88

ED UCA TION & MATH 0 UTCOMES
American Educational Research Association,56 and 553 SocialScientists57 were disseminated or published after 1990,58 making themmore reflective of the cumulative knowledge available on the topic.
Unlike the social science amicus briefs filed on behalf of theparties in Parents Involved, this Article's survey of the scholarlyliterature offers a comprehensive and current synthesis of the effectsof school racial and SES composition on mathematics outcomes in K-12 schools. Additionally, unlike amicus briefs, but consistent withestablished conventions that require scholars to describe the methodsthey employed in conducting a synthesis of a body of literature, thisArticle specifies the methods used to search the literature, the criteriaemployed to select articles for inclusion, and the evaluation standardsused to draw conclusions from the studies included in the synthesis.
This synthesis's focus on mathematics outcomes is unique amongrecent reviews of the scientific record on school compositional effects.None of the prior scholarly synthesis or the Parents Involved amicusbriefs specifically addressed mathematics. Given the nationalimperative to raise overall mathematics knowledge and skills and toclose race and SES gaps, a comprehensive and objective examinationof the contributions of school racial and SES composition tomathematics outcomes is appropriate.
II. THE SCOPE OF THE PROBLEM
Students' mathematics performance correlates with their raceand SES. Table 1 presents mean 2009 National Assessment ofEducational Progress ("NAEP")"9 mathematics scale scores for
56. See id. (observing that seventy-nine percent of the social science citations in theBrief for the American Educational Research Ass'n as Amicus Curiae SupportingRespondents, supra note 50, were from 1990 or later).
57. See id. (observing that seventy-seven percent of the social science citations in theBrief for 553 Social Scientists as Amici Curiae Supporting Respondents, supra note 50,were from 1990 or later).
58. See id. By way of comparison, forty-eight percent of the social science citations inthe Brief for David J. Armor et al. as Amici Curiae Supporting Petitioners, supra note 50,and forty-five percent of the social science citations in the Brief of Amici Curiae Drs.Murphy et al. in Support of Petitioners, supra note 50, were from 1990 or later. See NAEdREPORT, supra note 41, at 17; Mickelson, supra note 26, at 1197.
59. Nat'l Ctr. for Educ. Statistics, U.S. Dep't of Educ., The Nation's Report Card,Frequently Asked Questions, http://nces.ed.gov/nationsreportcard/faq.asp (last visitedFeb. 13, 2010). The National Assessment of Educational Progress ("NAEP") has beenconducted for more than thirty years and is sponsored by the U.S. Department ofEducation. NAEP is administered in grades four and eight at the state level, and in grade
2010] 1007

1008 NORTH CAROLINA LAW REVIEW [Vol. 88
students in grades four and eight and Table 2 presents the mean 2005scores for those in grade twelve.'
Tables 1 and 2 indicate that Asian and White students scorehigher than Black, Latino/a, and Native American youth in allgrades.6 Socioeconomic differences in scores exist as well; studentsfrom higher SES families outperform youths from lower SESfamilies.62
twelve at the national level. It assesses a variety of academic subjects including science,reading, mathematics, civics, economics, geography, U.S. history, and the arts throughboth multiple-choice and constructed-response questions. Subject-matter achievement isreported as scale scores and as achievement levels. NAEP scale scores give a numericsummary of students' knowledge about a particular subject and are presented for differentdemographic groups. The NAEP Web site describes NAEP scores as the only studentachievement measure of performance of students in the US that is comparable acrossstates. See Nat'l Ctr. for Educ. Statistics, U.S. Dep't of Educ., NAEP-Overview,http://nces.ed.gov/nationsreportcard/about/ (last visited Feb. 23, 2010). The nationalNAEP sample includes all the state samples of public school students, a national sample ofnonpublic school students, as well as a determinate number of students and schools innonparticipating states. Although the majority of the participation in NAEP is voluntaryfor every state, school district, school, and student, all states that receive federal educationfunds are required by federal law to participate in NAEP mathematics and reading fourthand eighth grades' assessments. Id.
60. Nat'l Ctr. for Educ. Statistics, U.S. Dep't of Educ., The Nation's Report Card,Mathematics, Interpreting NAEP Mathematics Results, http://www.nces.ed.gov/nationsreportcard/mathematics/interpret-results.asp (last visited Feb. 23, 2010). Theperformance of students on the Mathematics NAEP tests is reported on a scale of zero tofive hundred for fourth and eighth grades, and a scale from zero to three hundred fortwelfth grade. The range in the twelfth grade math scale score changed in 2005. In thepast, the range was zero to five hundred, similar to the other two grades. Id.
61. NAT'L CTR. FOR EDUC. STATISTICS, U.S. DEP'T EDUC., NCES 2010-451, THE
NATION'S REPORT CARD: MATHEMATICS 2009, at 4 (2009), available at http://nces.ed.gov/nationsreportcard/pdf/main2009/2010451.pdf (providing data for fourth and eighthgraders). The most recent published report for NAEP scores of twelfth graders dates from2007, reporting results from 2005. See NAT'L CrR. FOR EDUC. STATISTICS, U.S. DEP'T OF
EDUC., NCES 2007-468, THE NATION'S REPORT CARD: 12TH GRADE READING ANDMATHEMATICS 2005, at 17 (2007), available at http://nces.ed.gov/nationsreportcard/pdf/main2005/2007468.pdf, NAEP reports results by fourth and eighth grade students'socioeconomic status ("SES") in terms of whether their family qualifies for free and/orreduced price lunches ("FRL"). Because high school student data on FRL status is notalways reliable, NAEP reports results for twelfth grade students by their parents'educational attainment.
62. NAT'L CTR. FOR EDUC. STATISTICS, THE NATION'S REPORT CARD:
MATHEMATICS 2009, supra note 61, at 4; NAT'L CTR. FOR EDUC. STATISTICS, THENATION'S REPORT CARD: 12TH GRADE READING AND MATHEMATICS 2005, supra note
61, at 17.

2010] ED UCA TION & MATH 0 UTCOMES 1009
Table 1. Grade 4 and 8 NAEP Mathematics Scale Scores by Race andFree and/or Reduced Price Lunch ("FRL ") Eligibility, 2009
Native Free Reduced Not F1Adan Black Latlaa White Lunch LunchEligible EEiigib
Grade 251 220 226 226 246 225 236 2494
Grade 295 255 262 264 289 263 274 291
Table 2. Grade 12 NAEP Mathematics Scale Scores by Race andParental Educational Attainment, 2005
.A san.. ac... ..... w hite Colege Some H
AmrcarrdaolgeSholehGrade 163 127 133 134 157 161 148 138 13(
12
Mathematics scale scores have improved during the past twodecades for all racial and SES groups.63 Between 1975 and the late1980s, the Black-White NAEP mathematics gap narrowed at allassessed grades.6' According to National Assessment of EducationalProgress Long-Term Trend data ("NAEP-LTT"),65 mathematics gapscontinued to converge through the mid-1980s, largely because of therelative improvements by Black students. Between 1978 and 1986, thegap declined from thirty-two to twenty-five points for nine-year-oldsand from forty-two to twenty-four points for thirteen-year-olds. 66
After the late 1980s, progress in closing the gap stalled and heldrelatively steady.67
63. NAT'L CTR. FOR EDUC. STATISTICS, THE NATION'S REPORT CARD:MATHEMATICS 2009, supra note 61, at 24. The gap between Black and White eighthgraders narrowed slightly between 2005 and 2009. Id.
64. Katherine Magnuson & Jane Waldfogel, Introduction, in STEADY GAINS ANDSTALLED PROGRESS: INEQUALITY AND THE BLACK-WHITE TEST SCORE GAP, supranote 26, at 7-8.
65. NAT'L CTR. FOR EDUC. STATISTICS, U.S. DEP'T OF EDUC., NCES 2009-479,NAEP 2008 TRENDS IN ACADEMIC PROGRESS 34 (2007), available at http://nces.ed.govlnationsreportcard/pdf/main2008/2009479.pdf.
66. Magnuson & Waldfogel, supra note 64, at 8.67. Id. The overall gap between White and Latino/a students has not changed in
significant ways. Trend data regarding other ethnic and racial groups are not available forthe same time period. Id. at 7-10.
1010 NORTH CAROLINA LAW REVIEW [Vol. 88
The time period during which race gaps in test scores narrowedcoincided with greater school integration. Recent cross-sectional andtime series data point to a strong association between levels ofsegregation and achievement gaps.' The period of stagnation in thenarrowing of the gap corresponds with the period when desegregationstalled and income inequality grew.69
The trends in test score gaps should be considered in conjunctionwith striking changes in the demographic profile of U.S. public schoolstudents who today are more ethnically and racially diverse than theircounterparts four decades ago. In 1968, eighty percent of publicschool students were White, fourteen percent were Black, fivepercent were Latinos/as, and one percent was Asian and NativeAmerican.7" In 2006, the student population was fifty-seven percentWhite, twenty percent Latinos/as, seventeen percent Black, fivepercent Asian, and one percent Native American."' At present, amajority of public school students in California, Florida, and Texasare children of color.72 Census Bureau projections suggest that by2025, fifty-two percent of youth aged fifteen to nineteen will be fromminority groups.73 Student populations have increasing numbers of
68. Mark Berends & Roberto V. Pefialoza, Increasing Racial Isolation and Test ScoreGaps in Mathematics: A 30-Year Perspective, 112 TCHRS. C. REC. (forthcoming 2010);Vigdor & Ludwig, supra note 26, at 181, 204-05.
69. Magnuson & Waldfogel, supra note 64, at 7-8,15.70. See ERICA FRANKENBERG, CHUNGMEI LEE & GARY ORFIELD, THE CIVIL
RIGHTS PROJECTIPROYECTO DERECHOS CIVILES (HARVARD), A MULTIRACIALSOCIETY WITH SEGREGATED SCHOOLS: ARE WE LOSING THE DREAM? 23 (2003),available at http://www.civilrightsproject.ucla.edu/research/reseg03/AreWeLosingtheDream.pdf (reporting demographic shifts in American studentpopulations and levels of school segregation by race and socioeconomic status).
71. GARY ORFIELD & CHUNGMEI LEE, THE CIVIL RIGHTS PROJECr/PROYECTO
DERECHOS CIVILES (UCLA), HISTORIC REVERSALS, ACCELERATINGRESEGREGATION, AND THE NEED FOR NEW INTEGRATION STRATEGIES 16 (2007),available at http://www.civilrightsproject.ucla.edu/research/deseg/reversals-reseg.-need.pdf(updating demographic shifts in American student populations and levels of schoolsegregation by race and socioeconomic status through 2006).
72. NAT'L CTR. FOR EDUC. STATISTICS, U.S. DEP'T OF EDUC., NCES 2007-039,STATUS AND TRENDS IN THE EDUCATION OF RACIAL AND ETHNIC MINORITIES 29(2007), available at http://nces.ed.gov/pubs2007/2007039.pdf; EDUC. INFO. &ACCOUNTABILITY SERVICES, FLA. DEP'T OF EDUC., 2009-07D, MEMBERSHIP IN
FLORIDA'S PUBLIC SCHOOLS, FALL 2009 (2010), http://www.fldoe.org/eias/eiaspubs/word/pkl2mbrshp.doc.
73. See U.S. Census Bureau, National Population Projections Released 2008 (Basedon Census 2000), Summary Tables, http://www.census.gov/population/www/projections/summarytables.html (last visited Feb. 23, 2010).

ED UCA TION & MATH 0 UTCOMES
immigrants, too. In the last decade of the twentieth century,approximately fifty percent of school-aged children in New Yorkcame from an immigrant family.74 Nationwide, approximately ninetypercent of Asian American students and fifty-nine percent ofLatino/a youth were immigrants or children of immigrants." Theproportion of immigrant children tends to be higher in urban schooldistricts.
In response to the recent dramatic shifts in the ethnic and racialbackgrounds of student populations, the demographic compositionsof American public schools in urban, suburban, and ruralcommunities are changing as well. All types of communities todayhave higher percentages of Black and Latino/a students in their publicschools compared to the past.76 Additionally, levels of racial andsocioeconomic segregation are increasing in public schools located incities and suburbs.77 Although there is some disagreement amongscholars over the extent to which U.S. schools are resegregating,78
even those who raise questions about levels of resegregationacknowledge that progress toward desegregation "has faltered sincethe early 1990's."79
Segregation among school districts now surpasses segregationwithin school districts.80 Almost half of Black and Latino/a studentsattend schools in inner-ring suburban communities of large
74. CAROLA SUAREZ-OROZCO & MARCELO M. SUAREZ-OROZCO, CHILDREN OF
IMMIGRATION 2, 53 (2001). See generally ALEJANDO PORTES & RUBEN G. RUMBAUT,
IMMIGRANT AMERICA: A PORTRAIT (3d ed. 2006) (reporting experiences of twentieth-century immigrants to the United States with a. focus on generational changes inadaptation and assimilation).
75. Min Zhou, Growing Up American: The Challenge Confronting ImmigrantChildren and Children of Immigrants, 23 ANN. REV. SOc. 63, 64 (1997).
76. See ORFIELD & FRANKENBERG, supra note 18, at 4-8 (discussing changes inschool composition).
77. Id.78. Compare id. at 2 (arguing that their data show "steadily growing [rates of]
segregation for both black and Latinos on both a national and regional level since 1990"),with JOHN LOGAN, LEWIS MUMFORD CTR. FOR COMPARATIVE URBAN & REG'L RES.,
RESEGREGATION IN AMERICAN PUBLIC SCHOOLS? NOT IN THE 1990s, at 15-16 (2004),
http://www.s4.brown.edu/cen2000/noresegregation/noresegregation-report.pdf (arguingthat the evidence of purported resegregation after 1990 is primarily due to the shiftingracial composition of the school-age population, not the greater racial polarization ofstudents across schools).
79. LOGAN, supra note 78, at 15.80. CHARLES T. CLOTFELTER, AFTER BROWN: THE RISE AND RETREAT OF SCHOOL
DESEGREGATION 73 (2004) (indicating that among all metropolitan areas with a totalsegregation of 0.326, the between-district component of segregation was 0.225).
2010] 1011

NORTH CAROLINA LAW REVIEW
metropolitan areas." Two-thirds of the schools that Blacks andLatinos/as attend are intensely racially segregated with highconcentrations of poor students.' Asians are more likely to attendintegrated schools than any other ethnic group.83 Whites are the leastlikely of any student group to attend segregated minority schools,especially if their families live outside of central cities.'
Demographic shifts in student populations mean that,increasingly, the proportion of the U.S. student population fromadvantaged backgrounds, who tend to score well in mathematics, isshrinking relative to the proportion of students from less advantagedbackgrounds, who are less likely to perform well. The resegregationof public schools also means that students from disadvantagedfamilies are increasingly likely to attend schools with children fromsimilar backgrounds. Together, these trends make the instrumentalreasons and moral imperatives to address the racial and SESdisparities in mathematics outcomes even more urgent.
III. TERMINOLOGY
Although all the social science studies discussed in this Articleexamined related outcomes, their foci, research designs, measurementof key constructs, and terminology differ across the disciplines andthe decade in which a particular study was conducted. The followingsection describes variations in terminology for key constructs thatwere employed by the authors of the fifty-nine articles synthesized inthis Article.
School Composition-A particular study included in this Articlemay have examined desegregation, integration, segregation, schoolracial composition, minority composition, or diversity. Studies thatappeared prior to 1990 tended to be experiments or quasi-experiments on the effects of court-ordered desegregation in a singleschool district.8" Since the late 1980s, desegregation researchers have
81. ORFIELD & FRANKENBERG supra note 18, at 4.82. Id.83. Id.84. Id.85. Mickelson, supra note 26, at 1195; see also Thomas Cook, What Have Black
Children Gained Academically from School Integration? Examination of the Meta-AnalyticEvidence, in SCHOOL DESEGREGATION AND BLACK ACHIEVEMENT 6, 40-41 (ThomasCook ed., 1984) (presenting results of several meta-analyses of nineteen selecteddesegregation experiments conducted in the 1970s and 1980s).
1012 [Vol. 88

ED UCA TION & MATH 0 UTCOMES
shifted to using social surveys with representative samples orstatewide populations because of the declining number of schoolsystems under court orders86 and the increasing difficulty inconducting experimental research with school children.' Differencesin the terminology across studies reflect important distinctions inunderlying conceptual frameworks, research designs, the nature ofthe relationships under investigation, and the social and politicalrealities of the time frames in which the studies were conducted.Nevertheless, the core issue of interest in all the studies is essentiallythe same: the relationship between a school's racial and/or SEScomposition and mathematics outcomes of students who attend them.
Segregated-Most studies synthesized in this Article examine therelationship between varying levels of racial segregation andmathematics outcomes. This literature uses a variety of terms toconvey the notion that a school's population was disproportionatelycomposed of students from one race relative to a standard for racialbalance that was tied to a community's racial and ethnic mix. Theterms used include "segregated," "racially imbalanced" (or"isolated") "White," "racially imbalanced Black," "raciallyimbalanced Latino/a," "racially imbalanced minority," "segregatedWhite," "segregated Black," "segregated Latino/a," and "segregatedminority." Some recent research uses the term "concentratedminority" as a synonym for "segregated." Unless a particular type ofsegregation is specified (such as racially isolated White schools), thephrases "minority," "concentrated minority," "racially imbalanced,""racially isolated," and "segregated" describe schools that havedisproportionate numbers of racial or ethnic minority studentsrelative to the community's composition.
Integrated-A smaller group of studies focuses on therelationship between varying levels of racial integration andmathematics outcomes. Integrated schools are the goal of the processof desegregation. In the context of U.S. history, school desegregationis a legal, social, and policy process designed to transform segregatedschools into schools that do not separate students by race. Anintegrated school has achieved the desegregation of its students, staff,curricula, extra- and co-curricular activities, and the school culture inways that reflect the demographic balance of the community. In
86. Mickelson, supra note 26, at 1182.87. NAEd REPORT, supra note 41, at 15; Mickelson, supra note 26, at 1185-86.
2010] 1013

NORTH CAROLINA LAW REVIEW
practice, many desegregated schools are not truly integrated becauseof racially correlated curricular tracking.8 This important distinctionaside, the terms "desegregated," "integrated," "racially balanced,"and "diverse" are used interchangeably in the literature synthesizedin this Article.
Race-"Race" and "ethnicity" are used interchangeably acrossthe fifty-nine studies discussed in this Article. Typically, the studiescategorized students as Asian (or Asian American, Pacific Islander),Black (or African American), Latinos/as (Hispanic), NativeAmerican (also Alaskan Native, Aleut, American Indian), Other(typically reserved for international or mixed-race students), or White(European American). In cases where very few Asian, NativeAmericans, or mixed race students remained in the sample, authorscollapsed all students of color into the category of minority, whichwas then contrasted with Whites. Many recent studies examine theeffects of race at the student level and at the school level, therebypermitting the researcher to report findings about how school racialcomposition affects mathematics outcomes for students from differentracial or ethnic backgrounds.
This Article uses the terms "Blacks," "Whites," "Latinos/as,""Asians," "Native Americans," and "Other" to refer to members ofthe racial groups discussed above because they correspond to thecategories used in the research. Admittedly, these commonly usedracial labels blur meaningful within-race ethnic differences relevant toeducational outcomes. For instance, among Asians, Hmong andChinese students have distinct outcomes; among Latinos/as,
88. CLOTFELTER, supra note 80, at 126; SAMUEL R. LUCAS, TRACKINGINEQUALITY: STRATIFICATION AND MOBILITY IN AMERICAN HIGH SCHOOLS 1 (1999)(describing the ways that curricular tracking with instructional differentiation has evolvedinto a less rigid practice during the recent past but how its effects, nonetheless, still createeducational inequality for those who learn in the lower tracks); JEANNIE OAKES,KEEPING TRACK: HOW SCHOOLS STRUCTURE INEQUALITY, at xi (2d ed. 2005)(demonstrating how the practice of tracking and ability grouping results in feweropportunities to learn for those in lower tracks, who tend to be children of color and fromlower income families); KEVIN G. WELNER, LEGAL RIGHTS, LOCAL WRONGS: WHENCOMMUNITY CONTROL COLLIDES WITH EDUCATIONAL EQUITY 163-68 (2001)(presenting case studies of communities that used tracking to circumvent desegregation,and how efforts to detrack public schools challenged the educational privileges of middle-class families); Samuel R. Lucas, Effectively Maintained Inequality: Education Transitions,Track Mobility, and Social Background Effects, 106 AM. J. SOC. 1642, 1642 (2001)(modeling how tracking reproduces educational inequalities by race and SES).
[Vol. 881014

ED UCA TION & MATH 0 UTCOMES
Colombian and Mexican youths are likely to perform differently. 9
The number of generations a student's family has been in the UnitedStates further complicates racial and ethnic categorization.'
The vast majority of early school composition studies focusedsolely on Blacks and Whites. Historically, with exceptions ofLatinos/as in California and the Southwest and Asians on the WestCoast, there have been too few Latino/a, Asian, or Native Americanstudents in local school districts to allow for comprehensive analysesof diversity effects on their outcomes. The shift by researchers tousing large-scale national surveys improved the chances that sampleswould have sufficiently large numbers of Latino/a, Asian, or NativeAmerican participants to permit subgroup analyses. Although morerecent studies utilizing nationally representative survey data setsinclude larger numbers of these groups in the samples, there are stillrelatively few contemporary studies that report findings for all racialand ethnic groups in the U.S. student population.
Socioeconomic Status-Socioeconomic status ("SES") is oftenused in the literature interchangeably with the term social class orfamily background.91 SES is a complex construct that reflects therelative rank of an individual's or a family's location in a socialhierarchy based on combined rankings of income, occupationalprestige, and educational attainment. SES is both strongly correlatedwith race and highly predictive of school outcomes.92 Recent researchexamines the effects of SES at the student level and at the schoollevel.
Studies operationalize SES in a variety of ways. A frequentlyused but crude measure of SES is free and/or reduced price lunch("FRL") eligibility. This measure distinguishes only poor children
89. Roslyn A. Mickelson, Race, Ethnicity, and Education, in HANDBOOK OFEDUCATION POLICY RESEARCH 240, 241-44 (Gary Sykes, Barbara Schneider & David N.Plank eds., 2009).
90. See PORTES & RUMBAUT, supra note 74, at 75.91. The concepts of SES and social class are based on different sets of theoretical
assumptions about the nature of social stratification in society. Class location cannot bemeasured by educational or occupational attainment, the typical indicators of SES.Scholars who conduct quantitative analyses of social class are likely to use indicators ofownership, authority, and expertise. See ERIK 0. WRIGHT, CLASSES 283 (1985). However,SES measures generally do not include a family's wealth, a critical dimension of economicwell-being and social location. See MELVIN L. OLIVER & THOMAS M. SHAPIRO, BLACK
WEALTH/WHITE WEALTH 55 (2006).92. See infra Part V.B.
2010] 1015

NORTH CAROLINA LAW REVIEW
whose parents sign them up for FRL from those who are either notpoor or who are poor but whose parents do not sign them up. Abetter SES indicator is parental education, typically denoted bymother's educational attainment. Superior SES indicators combineparental income, educational, and occupational attainment. Somestudies use well-known indices such as the Duncan SocioeconomicIndex ("SEI") 9 3 to measure SES. This Article uses the term SES torefer to all the operationalizations of socioeconomic status, socialclass, and family background described above.
Early Studies-For purposes of this Article, "early studies" refersto studies of school composition effects that were disseminated orpublished before 1990."4
Later Studies-For purposes of this Article, "later studies" refersto research about school composition effects that was disseminated orpublished in 1990 or after.
Mathematics Outcomes-Over half of the fifty-nine relevantstudies' mathematics outcomes are standardized test scores. 95 Theremaining studies either report composite achievement scores thatincluded mathematics (such as grade point averages), state highschool exit exams, proficiency levels on state standardized tests, orthe number and rigor of mathematics courses completed during highschool. Unless a specific outcome is described (e.g., test score), thebroad term "mathematics outcomes" refers to any one of thesevarious measures.
IV. METHODS
This Article is a synthetic review of the educational, social, andbehavioral science literatures on the effects of school composition on
93. See, e.g., Keiko Nakao & Judith Treas, Updating Occupational Prestige andSocioeconomic Scores: How the Measures Measure Up, 24 SOC. METHODOLOGY 1, 3(1993) (evaluating the quality and design of the 1989 General Social Survey study onoccupational prestige). For an overview of the Duncan Socioeconomic Index scale, seegenerally Otis Dudley Duncan, A Socioeconomic Index for All Occupations, inOCCUPATIONS AND SOCIAL STATUS 109 (Albert J. Reiss, Jr. ed., 1961); Otis DudleyDuncan, Properties and Characteristics of the Socioeconomic Index, in OCCUPATIONS ANDSOCIAL STATUS 139 (Albert J. Reiss, Jr. ed., 1961).
94. Mickelson, supra note 26, at 1185-87, 1194-2000 (contrasting the methodologies,samples, data, and statistical analyses of the pre-1990s studies with the post-1990 studies).
95. See Appendix.
1016 [Vol. 88

ED UCA TION & MATH 0 UTCOMES
mathematics outcomes.96 It becomes increasingly difficult to generatea comprehensive, coherent summary of a scientific literature as thesize and complexity of the entire corpus of research on a topic growsover time. This challenge transcends disciplinary boundaries.97 Thevalidity and reliability of any synthesis depends on (a) howcompletely and unambiguously a researcher formulates the topic ofinterest; (b) how thoroughly the extant literature is searched andrelevant studies are identified; (c) how reliably the researcher uses anexplicit protocol of inclusion and exclusion criteria to evaluate allpossible studies identified in the search; (d) whether the researcherdeals with the quality of a study when incorporating its results intothe synthesis; and (e) the consistency, clarity, and rigor with which theresearcher combines information across studies and interpretsfindings.98
There is no one right way to survey and synthesize the literaturefield.99 Three common strategies for synthesizing and integratingresearch on a topic are: (1) narrative literature reviews that combineprevious findings and interpret them in a qualitative or descriptivefashion; (2) vote-counting approaches that tally the number ofempirical studies reporting statistically significant positive effects,negative effects, or no effects across the defined set of studies; and (3)meta-analyses that statistically aggregate the respective size or
96. The late scholar of higher education, Ernest Boyer, distinguished among thescholarship of discovery (basic research), the scholarship of integration of knowledgethrough synthesis, the scholarship of application of knowledge to social issues of the time,the scholarship of teaching, and the scholarship of engagement that connects the abovedimensions to civic and ethical problems. ERNEST BOYER, SCHOLARSHIPRECONSIDERED: PRIORITIES OF THE PROFESSORIATE 15-25, 75-81 (1990).
97. Rob Greenwald, Larry V. Hedges & Richard D. Laine, When Reinventing theWheel Is Not Necessary: A Case Study in the Use of Meta-Analysis in Educational Finance,20J. EDUC. FIN. 1, 1 (1994).
98. See WILLIAM D. CRANO & MARILYN B. BREWER, PRINCIPLES AND METHODSOF SOCIAL RESEARCH 331 & n.1 (2d ed. 2002) (recognizing inherent problems withliterature reviews in narrative studies); LARRY V. HEDGES & INGRAM OLKIN,STATISTICAL METHODS FOR META-ANALYSIS, at xv (1985) (acknowledging that thevalidity of meta-analytic studies is affected by the studies included in them and theassumption that the selected studies are narrowly tailored to address the same question);NAEd REPORT, supra note 41, at 14 n.11; Greenwald et al., supra note 97, at 6-7.
99. See Sandra Graham, Narrative Versus Meta-Analytic Reviews of Race Differencesin Motivation: A Comment on Cooper and Dorr, 65 REV. EDUC. RES. 509,513 (1995).
2010] 1017
NORTH CAROLINA LAW REVIEW
magnitude of effects across all empirical studies that meet inclusioncriteria.'0
Both qualitative and quantitative approaches to synthesizingresearch literatures have strengths and weaknesses.1 '' Narrativereviews present a qualitative, holistic interpretation of the findings inthe summarized relevant literature. Arguably, they offer a morenuanced and textured view of the theoretical and substantive findingsthan the quantitative vote-counting or meta-analysis approachesprovide. Narrative reviews also tend to be more subjective thanquantitative syntheses, and they do not report the magnitude of theeffects they describe.0 2
Quantitative syntheses that rely on vote-counting approaches areobjective and their results are readily accessible to readers. Typically,they do not provide a measure of the magnitude of effect size. Andbecause they are conservative estimates of overall effects, they aresubject to underestimating outcomes of interest.103 Conservativeestimates of overall effects can be results of a Type II error, whichoccurs when results falsely indicate there are no effects when, in fact,there are significant, substantive outcomes of interest. 1°4
Meta-analyses are another widely used technique to statisticallysummarize the findings from a body of research. A meta-analysisestimates the size and consistency of the effects of certain factors on agiven phenomenon across multiple empirical studies on the sametopic.10 5 Meta-analyses allow researchers to examine overall patternsof effects across many studies, to explore whether additional variablesmoderate those effects,0 6 and to statistically test the possibility that
100. Phillip D. Rumrill, Jr. & Shawn M. Fitzgerald, Using Narrative Literature Reviewsto Build a Scientific Knowledge Base, 16 WORK 165, 165 (2001).
101. See Graham, supra note 99, at 513 (comparing narrative and meta-analyticreviews); Rumrill & Fitzgerald, supra note 100, at 168.
102. See Graham, supra note 99, at 513; Rumrill & Fitzgerald, supra note 100, at 168.103. GENE V. GLASS, BARRY MCGAW & MARY LEE SMITH, META-ANALYSIS IN
SOCIAL RESEARCH 94 (1981); HEDGES & OLKIN, supra note 98, at 48-52.104. Results of scientific studies are subject to two types of statistical errors. A Type I
error conveys a false positive (e.g., indicating school composition has effects onmathematics outcomes when, in fact, it has none), while a Type II error indicates a falsenegative (e.g., indicating composition has no effects on mathematics outcomes when, infact, it has an influence). See THOMAS D. COOK & DONALD T. CAMPBELL, QUASI-EXPERIMENTATION: DESIGN & ANALYSIS ISSUES FOR FIELD SETTINGS 41-43 (1979).
105. Tropp et al., supra note 50, at 106 n.4; NAEd REPORT, supra note 41, at 14 n.1l.106. Tropp et al., supra note 50, at 106 n.4; NAEd REPORT, supra note 41, at 14 n.11.
1018 [Vol. 88

ED UCA TION & MATH 0 UTCOMES
studies' outcomes were affected by their methodological quality10 7 orthe time period during which they were conducted. Meta-analyseshave been criticized because typically they do not establish a prioriquality criteria for inclusion, and they treat all studies as equal datapoints.0 8 They tend not to be readily accessible to readers unfamiliarwith inferential statistics.
The authors' selection of an approach to synthesize the schoolcomposition effects research for this Article took into considerationtheir goal of providing accessible information to the wide audience ofthis law journal, and the strengths and weaknesses of the variousapproaches to research integration. They chose to combine narrativeand vote-counting approaches. Doing so permits them to present anuanced and holistic integration of the research literature based on anobjective and detailed analysis of the fifty-nine studies that metspecific inclusion criteria. The following paragraphs describe thetechniques the authors employed in collecting and summarizing thefindings presented in this Article. This methodological informationwill enable readers to judge the validity and reliability of theconclusions the authors have drawn from their synthesis.
A. Database Searches
From 2006 through 2009, the two authors searched theeducational, social, and behavioral science literatures for scholarshipreporting the effects of school and classroom composition on a broadarray of educational outcomes.0 9 The authors identifiedapproximately four hundred articles that address some aspect of therelationship of school composition and various outcomes broadly
107. Tropp et al., supra note 50, at 106 n.4; NAEd REPORT, supra note 41, at 14 n.11.108. GLASS ET AL., supra note 103, at 22.109. The American Sociological Association's Sydney Spivack Program in Applied
Social Research and Social Policy awarded Professor Kathryn Borman and the first authorinitial support for a survey and synthesis of the social science research about schoolcompositional effects. In 2006, the first author received additional support for the projectfrom the Poverty and Race Research Action Council ("PRRAC") and from the NationalScience Foundation ("NSF"). Her research team developed a searchable database, theSpivack Archive, into which detailed two-page abstracts of the four hundred studies havebeen entered. The Spivack Archive includes quantitative and qualitative social scientificstudies about the relationship of school and classroom diversity to various educationaloutcomes that have been conducted during the past four decades. The Spivack Archivewill be posted on the American Sociological Association's Web site at the conclusion ofthe project in early 2010. A Preliminary Spivack Archive is on file with the North CarolinaLaw Review.
2010] 1019

NORTH CAROLINA LAW REVIEW
conceived as achievement, attainment, intergroup relations, racialattitudes, and adult life course outcomes. The findings in this Articlefocus on the subset of the fifty-nine relevant studies that addressschool race and/or SES compositional effects on mathematicsoutcomes.
The search of the literature was conducted in three phases. First,during 2006 and 2007, the authors conducted intensive searches ofeducation, social, and behavioral science electronic databases forstudies on effects of school and classroom composition onmathematics and science outcomes.110 The keywords used included:"mathematics," "mathematics achievement," "science," "scienceachievement," "verbal achievement," "reading," "ability grouping,""tracking," "desegregation," "integration," "segregation,""diversity," "race," "ethnicity," "SES," "family background," and"school racial composition." Based on information provided inabstracts of the studies that emerged from the electronic searches, fullarticles, chapters, books, and reports were obtained for furtherconsideration. The authors also examined a number of review articlesand amicus briefs on the topic for relevant studies that were possiblyoverlooked in the database searches. Second, once relevant studieswere identified in the manner described above, their own referencesections were examined for potential literature. Third, during 2008and 2009, the authors conducted follow-up searches of the databasesto identify the newest literature on the topic."'
110. Search databases included: JSTOR, Psychology Abstracts, Sociology Abstracts,Google Scholar, ERIC, Educational Research Complete, Academic Search Premier,Project Muse, and Dissertation Abstracts.
111. In 2010, Teachers College Record will publish a collection of twenty-two articleson school and classroom composition effects on educational outcomes in a three-issue setof Special Issues edited by Kathryn Borman and Roslyn Mickelson. 112 TCHRS. C. REC.(forthcoming 2010). In addition to maintaining rigorous scientific standards for themanuscripts accepted for publication, see Am. Educ. Res. Ass'n, Standards for Reportingon Empirical Social Science Research in AERA Publications, 35 EDUC. RES. 33, 33-40(2006), the editors also sought to ensure the integrity of the editorial process. Theytherefore instituted a process that insulated their decisions as much as possible fromsubjectivities arising from their own scholarship and values about school composition andeducational outcomes. On several occasions, Professor Gary Natriello, Executive Editorof Teachers College Record, participated in editorial decisions about specific manuscriptsthat posed conflicts of interest for one or the other of the editors. For greater details seeRoslyn A. Mickelson, Goals, Grades, Fears, and Peers: Introductory Essay for SpecialIssues on the Effects of School and Classroom Racial and SES Composition on EducationalOutcomes, 112 TCHRS. C. REC. (forthcoming 2010).
1020 [Vol. 88

ED UCA TION & MATH 0 UTCOMES
B. Inclusion Criteria
This Article's focus on mathematics outcomes required theProject Team to identify the subset of the four hundred SpivackArchive's entries with mathematics outcomes. Fifty-nine studies metthe following inclusion criteria:
* Studies employed quantitative research methods.11 2
* Studies reported effects of school racial and/or socioeconomiccomposition on mathematics outcomes.
* Dependent variables were a quantitative measure of eithermathematics outcomes (typically test scores), proficiencylevels in mathematics, a composite measure that includedmath achievement (e.g., grade point average or high schoolproficiency), and the number and rigor of mathematicscourses completed, among others.
* Appropriate statistical techniques were employed given thestructure of the data.
* Reported findings were valid given the study's researchdesign, data, sample, and analytic methods.
* Results appeared in a peer-reviewed journal, a book chapter,a book, a report issued by a professional or scientificorganization (e.g., National Bureau of Economic Research,U.S. Commission on Civil Rights, established think tanks),papers presented at professional meetings, and dissertations.Unpublished manuscripts that otherwise met the other criteriawere included as well.
* Publication or dissemination date of 1990 or later."1 3 Thehigher quality data and more sophisticated statistics employed
112. The authors' choice to focus on quantitative studies rests, in part, on a decision toengage those who claim that, based on their review of selective portions of thequantitative literature, the social science evidence is too ambiguous or contradictory tosupport a compelling state interest in fostering diverse schooling and avoiding racialisolation. See Brief of Amici Curiae Drs. Murphy et al. in Support of Petitioners, supranote 50, at 8; Brief for David J. Armor et al. as Amici Curiae Supporting Petitioners, supranote 50, at 35.
113. Social science methods, data, and statistical tools improved in the years followingthe design, implementation, and evaluation of the initial wave of post-Browndesegregation programs. The year 1990 was selected to distinguish earlier from laterstudies because it marks the decade when the use of advanced statistical tools (likemultilevel modeling) with nationally representative data sets became widespread amongsocial scientists.
2010] 1021

1022 NORTH CAROLINA LAW REVIEW [Vol. 88
in the later studies warranted limiting the scope of therelevant literature to work that appeared after 1990.114
0 No more than one study per author using the same sample,outcomes, and data set." 5
114. Mickelson, supra note 26, discusses in great detail the differences between early(pre-1990) and later (post-1990) social science on race and SES composition. Two well-known syntheses of pre-1990 research about the effects of desegregation on blackachievement illustrate some of the weakness of early studies. The first synthesis wasconducted in 1975 by psychologist Nancy St. John. NANCY H. ST. JOHN, SCHOOLDESEGREGATION: OUTCOMES FOR CHILDREN passim (1975). The second was conductedin 1984 by a panel convened by the National Institute of Education. See THOMAS COOK,NAT'L INST. OF EDUC., SCHOOL DESEGREGATION AND BLACK ACHIEVEMENT 2-5(1984) [hereinafter NIE Study]. St. John's narrative review was cited by Justice Thomas,the Armor Amici Curiae Brief, and the brief of the 553 Social Scientists. See ParentsInvolved in Cmty. Sch. v. Seattle Sch. Dist. No. 1, 551 U.S. 701, 770 (Thomas, J.,concurring); Brief for David J. Armor et al. as Amici Curiae Supporting Petitioners, supranote 50, at 13; Brief for 553 Social Scientists as Amici Curiae Supporting Respondents,supra note 50, at app.3 n.4. A content analysis of research cited by St. John revealed thatthe majority of the studies of black achievement she included in her synthesis wereconducted before 1970. Almost all of them were case studies of a single school system'sdesegregation efforts. Roughly half of the studies had fewer than one hundred subjects,and some had as few as fifteen in the experimental group. Of the studies that providedinformation about the implementation of the desegregation plan being evaluated, almostsixty percent reported the plans were evaluated after one year or less of implementation.The NIE panel's meta-analysis focused on the nineteen studies it considered the bestamong the 157 that existed at that time. Fifteen of the nineteen studies were conductedbefore 1974. All nineteen studies were evaluations of specific desegregation plans that hadbeen implemented in particular communities many years earlier. Only a few of the studiesprovided detailed information about the implementation of the desegregation plan. Manyof the characteristics of the report's nineteen studies were problematic, even though thestudies were designed as experiments or quasi-experiments. Only two of the nineteenstudies had been published. The first published study was an experiment of a city-to-suburban voluntary transfer program that involved twenty-five black children who wereplaced in twelve different first or second grade classrooms. See Zdep, supra note 47, at173. The author of the second published study cautioned that his findings were limited bythe fact that his subjects were not randomly assigned to the treatment and control groupsand therefore his results were confounded by selection bias. See Daniel S. Sheehan, BlackAchievement in a Desegregating School District, 107 J. SOC. PSYCHOL. 185, 188 (1979).Nine of the nineteen studies were unpublished doctoral dissertations or master's theses.The other eight studies were reports produced by school districts' research units or paperspresented at scholarly meetings. The characteristics of the fifty-nine studies included inthis Article-all post-1990 research-appear in the Appendix. The high quality of theirdesigns, samples, data, and analytic strategies sharply contrasts with the weaker qualitiesof the studies included in the St. John and Cook syntheses of early research just discussed.
115. In three cases, this Article cites an earlier version and a later version of the samemanuscript. In one case, information regarding optimal diversity ranges for mathematicsachievement (and other subjects) appeared in the unpublished version, see Shelly Brown,High School Racial Composition: Balancing Excellence and Equity (Aug. 1999)(unpublished manuscript, on file with the North Carolina Law Review) (presented at the

2010] ED UCA TION & MATH 0 UTCOMES 1023
C. Coding the Studies
Each article was read, coded, and entered into the SpivackArchive electronic database. Graduate student research assistantmembers of the Project Team coded the articles under thesupervision of the first author. The second author conducted themajority of the coding. All articles were coded for key words,research questions or hypotheses; research design; data; samplingframe, sample type, and sample characteristics; unit of analysis;analytic strategies; dependent, independent, and control variables;and findings related to school and classroom compositional effects.The reliability of the coding for the four hundred entries was assessedby an independent coding of a random subsample of articles by a
annual meeting of the American Sociological Association), but not in the later publishedarticle, which focused on mathematics achievement. Shelly Brown-Jeffy, School Effects:Examining the Race Gap in Mathematics Achievement, 13 J. AFR. AM. STUD. 388, 402(2009). In another instance, the authors reported results by student SES that were notincluded in the later version. Compare Douglas Ready & Megan Silander, Estimating theInfluence of School Racial and Socioeconomic Composition on Student Learning:Methodological Challenges and Alternative Solutions (Apr. 2, 2009) (unpublishedmanuscript, on file with the North Carolina Law Review) (presented at Looking to theFuture: Legal and Policy Options for Racially Integrated Education in the South and theNation, Chapel Hill, North Carolina) (later version), with Douglas Ready & MeganSilander, Estimating the Influence of School Racial and Socio-Economic Composition onStudent Learning: Methodological Challenges and Alternative Solutions (2008)(unpublished manuscript, on file with the North Carolina Law Review) (presented at theannual meeting of the American Educational Research Association, N.Y., N.Y.) (earlierversion). In the third instance, the authors cite a revised version of an unpublishedmanuscript because the later version reported a significant finding that previously had notbeen reported as significant. Compare Elizabeth Covay, Composition Matters: RacialDifferences in Access to and Returns from Advanced Math Course Taking 29 (Sept. 2009)(unpublished manuscript, on file with the North Carolina Law Review), with ElizabethCovay, Composition Matters: The Relationship Between Race and School Composition inExplaining the Black-White Gap 25-28 (Sept. 2008) (unpublished manuscript, on file withthe North Carolina Law Review) (presented at the American Sociological AssociationAnnual Meeting, Boston, Mass.). In a personal communication to the first author,professors Brown-Jeffy and Ready explain that their original results hold but were notincluded in the later version of their respective manuscripts for simplicity of presentationof the primary focus of their research. E-mail from Shelly Brown-Jeffy to Roslyn ArlinMickelson (July 29, 2009, 17:37 EST) (on file with the North Carolina Law Review); E-mail from Douglas Ready to Roslyn Arlin Mickelson (July 9, 2009, 10:00 EST) (on filewith the North Carolina Law Review). In a third personal communication, Ms. Covayindicates that subsequent analyses changed one finding that is now reported in the laterversion of her manuscript. E-mail from Elizabeth Covay to Roslyn Arlin Mickelson (Feb.9, 2010, 14:02 EST) (on file with the North Carolina Law Review). For purposes ofcounting the total number of studies in this synthesis, the authors treat the earlier and laterversions of each paper as one study.

NORTH CAROLINA LAW REVIEW
graduate student whose ratings were then compared to the originalones. The first author resolved any discrepancies between the firstand second codings by returning to the document and analyzing theoriginal text to determine which of the two codes was appropriate.The authors performed a final reliability check by jointly reviewingthe codings for each of the fifty-nine studies that are included in thisArticle.
D. Standards for Drawing Conclusions from the Evidence
Interpreting results and drawing conclusions from the synthesisrequired the authors to evaluate the quality of the studies andquantity and strength of evidence pertinent to each finding. Thecriteria for assessing the quality of the research reported in eacharticle and for drawing conclusions from sets of articles follow thosefound in the Report of the Subcommittee on Standards of Evidence ofthe Final Report of the National Mathematics Advisory Panel.11 6
1. Quality
The standards for assessing the scientific quality of the evidencepresented in a social science article are based on an assessment of thestudy's research design, the quality of variables used to operationalizethe core concepts under investigation, the size and representativeness
116. NAT'L MATHEMATICS ADVISORY PANEL supra note 1, at 82-85. The report ofthe panel generated a great deal of critical response from methodologists and mathematicseducation experts. The December 2008 issue of Educational Researcher (Volume 37, Issue9) was devoted to critics' analysis of the report. See Anthony E. Kelly, Reflections on theNational Mathematics Advisory Panel Final Report, 37 EDUC. RESEARCHER 561, 561(2008). Criticisms included the development and the content of the report. Much of thedebate concerned the panel's reliance on "scientifically-based" research (that is,randomized trials and other quantitative studies) and the exclusion of any qualitativeresearch from consideration as scientifically based evidence. See, e.g., Jo Boaler, WhenPolitics Took the Place of Inquiry: A Response to the National Mathematics AdvisoryPanel's Review of Instructional Practices, 37 EDUC. RESEARCHER 588, 592 (2008). Criticscharged that doing so was political, unjustifiable on a scientific basis, and resulted inignoring the crucial social context of learning and teaching mathematics. See, e.g., JamesG. Greeno & Allan Collins, Commentary on the Final Report of the National MathematicsAdvisory Panel, 37 EDUC. RESEARCHER 618,620-21 (2008). While the authors agree withmany of these criticisms, they nonetheless rely on only quantitative studies for thesynthesis. The authors adapted the panel's criteria for judging the quality of research ineach of the fifty-nine studies, and the number (quantity) of studies required to drawconclusions about a particular issue.
[Vol. 881024
ED UCA TION & MATH 0 UTCOMES
of the samples, the appropriateness of the statistical analysis, and thegeneralizability of the findings beyond the study itself."7
Following the National Mathematics Advisory Panel'sSubcommittee Report, the authors utilized three broad categoriesinto which research falls and the corresponding claims that can bemade based on that research. 8 The first category is the highestquality scientific evidence. A study is judged to be of the highestscientific quality based on the strength of the "design, the validity andreliability of measures, the size and diversity of student samples, andsimilar considerations of internal and external validity." '19 Eightypercent of the fifty-nine studies met the criteria for being of thehighest quality.
Twenty percent of the fifty-nine articles fell into the moderatequality category. According to the National Mathematics AdvisoryPanel, moderate quality studies are promising or suggestive studiesthat do not meet the highest standards of scientific evidence, but theyrepresent sound scientific research that needs to be furtherinvestigated or extended.' The third category of studies includesthose that are based on weak evidence or the values of theresearcher.12 Weak studies present "essentially unfounded claims,"with "scientifically [unijustified conclusions, z1 22 and none are includedin this Article's synthesis.
2. Quantity and Strength of the Evidence
The National Mathematics Advisory Panel acknowledged thatthe number of studies necessary for evaluating the strength of aconclusion is a debatable issue.12 a Following the panel's practice, theauthors define the evidence of a finding as strong if a preponderanceof the applicable high quality studies in the synthesis reported similarfindings and there were at least "three independent studies withdifferent relevant samples and settings or one large high qualitymultisite study. "124
117. NAT'L MATHEMATICS ADVISORY PANEL supra note 1, at 82.118. Id. at 83-85.119. Id. at 82.120. See id. at 82-83.121. Id. at 82.122. Id.123. See id. at 83.124. Id.
2010] 1025

NORTH CAROLINA LAW REVIEW
The panel defines the evidence of a finding as moderately strongwhen "there are fewer than three high quality studies (but at leastone), or the effects have not been independently replicated bydifferent researchers, or they do not involve different samples (i.e.,diversity of characteristics) and settings." '125 They consider theevidence of a finding as suggestive when there are either (a) "somehigh quality studies that support the conclusion (statisticallysignificant effects, significant mean effects) but others that do not(non-significant), but those that do not are null, not negative (non-significant effects or mean effects but not significant negative effects).Any moderate quality studies show a comparable pattern or better,"or (b) "[t]here are no high quality studies, but all the applicablemoderate quality studies support the conclusion ... and there are atleast three such studies. "126
The authors consider the evidence of a finding as inconsistentwhen evidence depends on relevant studies with conflicting outcomes,when they found the quality of the studies' designs to be weak, orwhen the methods employed in the studies were outmoded. 127 Theresults of high-quality designs trumped the results of lower qualitydesigns. Following the panel's criteria, "[m]ixed results of high and/ormoderate quality studies that are not consistent enough to fall intoany of the above categories, and cannot be adjudicated bymethodological criteria," were deemed inconsistent. 128 Finally, theauthors evaluated evidence for a conclusion as weak when there wereonly low quality studies and no applicable high or moderate qualitystudies. 12 9 No evaluation is possible if there are insufficient data.
V. FINDINGS-OVERVIEW OF EFFECTS OF SCHOOL-LEVELINTEGRATION ON MATHEMATICS OUTCOMES
The preponderance of the fifty-nine studies synthesized in thisArticle employed diverse samples, used valid and reliable data, andconducted sophisticated analyses that replicated results of otherstudies. 3 ' Of the fifty-nine studies, forty-four reported statistically
125. Id.126. Id.127. See id.128. Id.129. See id. at 84.130. The Appendix provides detailed information about each of the fifty-nine articles,
chapters, books, or papers synthesized herein including author, source of data utilized,
1026 [Vol. 88

2010] ED UCA TION & MATH OUTCOMES 1027
significant effects of racial composition on outcomes.13' The strengthof the association between composition and outcomes varied acrossthe studies (this Article does not address the magnitude of theeffects). Six reported that while racial composition was important tooutcomes, the effects were not statistically significant or wereinconsistent because racial effects were expressed through SEScompositional effects;13 2 seven focused on SES composition of schoolsand reported that it was important to outcomes;13 3 two suggested thatwhile they found no significant race effect, racial composition likely
samples, analytic methods, variables and measures, and categories of findings obtained.The authors provide full pinpoint citations when they report substantive findings. Theydirect readers to the Appendix when the citation refers to a characteristic of a researchstudy, such as its sample characteristics, as providing full pinpoint citations about studycharacteristics for every report would require extensive repetition.
131. See Appendix.132. See Appendix: James Benson & Geoffrey Borman, Family, Neighborhood, and
School Settings Across Seasons: When Do Socioeconomic Context and Racial CompositionMatter for the Reading Achievement Growth of Young Children?, 112 TCHRS. C. REC.(forthcoming 2010); JOHN E. CHUBB & TERRY M. MOE, POLITICS, MARKETS &
AMERICA'S SCHOOLS 126-27 (1990); Valerie E. Lee, Julia B. Smith & Robert G.Croninger, Course-Taking, Equity, and Mathematics Learning: Testing the ConstrainedCurriculum Hypothesis in U.S. Secondary Schools, 19 EDuC. EVALUATION & POL'YANALYSIS 99, 112 (1997) [hereinafter Lee et al., Course-Taking]; Daniel AddisonMcCathern, Jr., The Relationship Between PreK-5 and K-5 Elementary School Size andStudent Achievement of Grade 5 Students on the MAT7 in South Carolina for the SchoolYears 1996-97 and 1997-98, at 201 (2004) (unpublished Ph.D. dissertation, University ofSouth Carolina) (on file with the North Carolina Law Review); Richard J. Murnane et al.,Understanding Trends in the Black-White Achievement Gaps During the First Years ofSchool, in BROOKINGS-WHARTON PAPERS ON URBAN AFFAIRS 2006, at 97, 125-27(2006); Russell W. Rumberger & Gregory J. Palardy, Does Segregation Still Matter? TheImpact of Student Composition on Academic Achievement in High School, 107 TCHRS. C.REC. 1999, 2020 (2005).
133. See Appendix: Stephen J. Caldas & Carl Bankston III, Effect of School PopulationSocioeconomic Status on Individual Academic Achievement, 90 J. EDUC. RES. 269, 274-75(1997); Thomas B. Hoffer, Middle School Ability Grouping and Student Achievement inScience and Mathematics, 14 EDUC. EVALUATION & POL'Y ANALYSIS 205, 223-26 (1992);KIRK A. JOHNSON, THE HERITAGE CTR. FOR DATA ANALYSIS, COMPARING MATH
SCORES OF BLACK STUDENTS IN D.C.'S PUBLIC AND CATHOLIC SCHOOLS 11 (1999),
available at http://www.eric.ed.gov/ERICDocs/data/ericdocs2sql/contentstorage-O1/0000019b/80/16/2a/7c.pdf; Valerie E. Lee & Julie B. Smith, Effects of School Restructuringon the Achievement and Engagement of Middle-Grade Students, 66 SOC. EDUC. 164, 179(1993); Gregory J. Palardy, Differential School Effects Among Low, Middle, and HighSocial Class Composition Schools: A Multiple Group, Multilevel Latent Growth CurveAnalysis, 19 SCH. EFFECTIVENESS & SCH. IMPROVEMENT 21, 21 (2008); Kevin J. Payne &Bruce J. Biddle, Poor School Funding, Child Poverty, and Mathematics Achievement,EDUC. RESEARCHER, Aug.-Sept. 1999, at 4, 11; Linda Ruth Williams Sorhaindo, TheRelationship Between Degrees of Poverty and Student Achievement 34 (May 2003)(unpublished Ph.D. dissertation, University of Miami).
NORTH CAROLINA LAW REVIEW
still mattered for outcomes but either their sample size or the natureof their data could not capture the effects of school composition;1 3'and one author found no significant race effects. 135
Findings show either that integrated education is associated withhigher achievement in math or that as concentrations of minoritystudents increase, math outcomes decrease. 36 The quantity andquality of the studies that discuss the effects of racial compositioncollectively offer strong evidence that racially isolated minorityschools hinder mathematics outcomes and diverse schools fosterhigher performance. Several studies report that racially diverseschools offer more students the chance to excel in math than eitherracially isolated White schools or isolated minority schools. 37 Thesefindings offer suggestive evidence that racially diverse schools are, infact, superior to racially isolated White schools for the mathematicsoutcomes of some students.138
Overall, the studies that describe the effects of SES compositioncollectively offer strong evidence that schools with concentratedpoverty hinder mathematics outcomes and socioeconomically diverseschools foster higher performance. Forty-two of the fifty-nine studiesreported the effects of school SES on mathematics outcomes. 139
Irrespective of the type of school, age, or ethnicity of the sample, or
134. See Appendix: Mary A. Burke & Tim R. Sass, Classroom Peer Effects and StudentAchievement 11 (Fed. Reserve Bank of Boston, Working Paper No. 08-5, 2008), availableat http://www.bos.frb.org/economic/wp/wp2008/wpO805.pdf; Payne & Biddle, at 11.
135. See Appendix: David J. Armor & Shanea H. Watkins, School Composition andHispanic Achievement 1 (Feb. 10, 2007) (unpublished manuscript, on file with the NorthCarolina Law Review) (presented at the Sociology of Education Association Conferencein Asilomar, Cal.).
136. See Appendix.137. See Appendix: Pat Ant6nio Goldsmith, All Segregation Is Not Equal: The Impact
of Latino and Black School Composition, 46 Soc. PERSP. 83, 100-01 (2003) (finding noeffects of percent Black on Black students' mathematics scores but a significant positiveeffect of percent Latinos/as in the school on the performance of Whites, Latinos/as, andBlacks); Stephanie Southworth, The Effects of Institutional Characteristics of Schools onNorth Carolina Elementary and Middle School Student Achievement 197 (2008)(unpublished Ph.D. dissertation, University of North Carolina at Charlotte) (on file withthe North Carolina Law Review).
138. See Appendix: Shelly Brown-Jeffy, School Effects: Examining the Race Gap inMathematics Achievement, 13 J. AFR. AM. STUD 388, 388, 402 (2009); Jorden Schiff,William Firestone & John Young, Organizational Context for Student Achievement: TheCase of Student Racial Compositions 13 (Apr. 1999) (unpublished manuscript, on file withthe North Carolina Law Review) (presented at the annual conference of the AmericanEducational Research Association in Montreal, Quebec, Canada); Southworth, at 94.
139. See Appendix.
1028 [Vol. 88

ED UCA TION & MATH 0 UTCOMES
research design, without exception, the forty-two studies show that asconcentrations of low-income students increase, math outcomesdecrease.
The preceding paragraphs discussed general patterns of race andSES findings based on the preponderance of evidence reported in thefifty-nine studies that met the inclusion criteria. In the next sections,the Article presents a more granular picture of school race and SEScomposition influences on mathematics outcomes for specific race,SES, or grade-level samples. These results draw upon the subsets ofstudies that provided detailed findings for students from specific race,SES, or grade levels.
A. Findings by Student Race
Fifty-seven of the fifty-nine studies analyzed include Blackstudents in their samples, 4 ° fifty-four include Whites,'41 thirty-twoinclude Latinos/as,'14 2 sixteen include Asians, 143 and seven studies
140. See Appendix. Only the Robert Crosnoe, The Diverse Experiences of HispanicStudents in the American Educational System, 20 SOC. F. 561 (2005), and Igor Ryabov &Jennifer Van Hook, School Segregation and Academic Achievement Among HispanicChildren, 36 SOC. SCI. RES. 767 (2007), studies did not analyze Black students in theirsamples.
141. See Appendix.142. See Appendix. Two studies restricted their sample to only Latinos/as. See
Appendix: Crosnoe, at 567; Ryabov & Van Hook, at 772.143. See Appendix: Benson & Borman; Brown-Jeffy, at 392; Rebecca Callahan et al.,
ESL Placement and Schools: Effects on Immigrant Achievement, 23 EDUC. POL'Y 355, 364(2009); Roger D. Goddard, Serena J. Salloum & Dan Berbitsky, Trust as a Mediator of theRelationships Between Poverty, Racial Composition, and Academic Achievement: Evidencefrom Michigan's Public Elementary Schools, 45 EDUC. ADMIN. Q. 292, 302 (2009);DOUGLAS N. HARRIS, CTR. FOR AM. PROGRESS, LOST LEARNING, FORGOTTENPROMISES-A NATIONAL ANALYSIS OF SCHOOL RACIAL SEGREGATION, STUDENT
ACHIEVEMENT, AND "CONTROLLED CHOICE" PLANS 28 (2006),http://www.americanprogress.orgissues/2006/11/pdf/lostlearning.pdf; Melissa R. Herman,The Black-White-Other Test Score Gap: Academic Achievement Among Mixed RaceAdolescents, 81 SOC. EDUC. 20, 22 (2009); Chandra Muller et al., Race and AcademicAchievement in Racially Diverse High Schools: Opportunity and Stratification, 112 TCHRS.C. REC. (forthcoming 2010); Xioxia Newton, End of High School Mathematics Attainment:How Did Students Get There?, 112 TCHRS. C. REC. (forthcoming 2010); Lindsay C. Page,Richard J. Murnane & John B. Willett, Trends in the Black-White Achievement Gap:Clarifying the Meaning of Within and Between School Achievement Gaps 26 (Nat'l Bureauof Econ. Research, Working Paper No. 14213, 2008); Gregory J. Palardy, DifferentialSchool Effects Among Low, Middle, and High Social Class Composition Schools: AMultiple Group, Multilevel Latent Growth Curve Analysis, 19 SCH. EFFECTIVENESS &SCH. IMPROVEMENT 21, 33 (2008); Payne & Biddle, at 9-10; Suet-ling Pong, The SchoolCompositional Effect of Single Parenthood on 10th-Grade Achievement, 71 SOC. EDUC. 23,
2010] 1029

1030 NORTH CAROLINA LAW REVIEW [Vol. 88
include Native Americans.' More than half of the fifty-seven studies(N=35) discussed in detail the effects of school composition on themath outcomes for Blacks, but only twelve of the fifty-four studieswith Whites in their samples thoroughly discussed results forWhites.'45 Detailed results for other racial groups are discussed onlyin some of the studies: sixteen of the thirty-two studies withLatinos/as discussed results directly related to them,146 three of the
30 (1998); Alejandro Portes & Lingxin Hao, The Schooling of Children and Immigrants:Contextual Effects on the Educational Attainment of the Second Generation, 101 PROC.NAT'L ACAD. SCI. U.S.A. 11,920, 11,922 (2004); Russell W. Rumberger & J. DouglasWillms, The Impact of Racial and Ethnic Segregation on the Achievement Gap inCalifornia High Schools, 14 EDUC. EVALUATION & POL'Y ANALYSIS 377, 380 (1992);Southworth, at 63; Tenisha L. Tevis, African-American Students' College TransitionTrajectory: An Examination of the Effect of High School Composition and Expectationson Degree Attainment 53, 54 (Dec. 2007) (unpublished Ph.D. dissertation, PennsylvaniaState University) (on file with Penn State Electronic Thesis and Dissertation Collection).
144. See Appendix: Benson & Borman; Harris, at 28; Newton; Page, at 26; Payne, at 33;Southworth, at 79; Tevis, at 54.
145. See Appendix: Brown-Jeffy, at 398-402; Caldas & Bankston III, at 550-52;Elizabeth Covay, Racial Differences in Access to and Returns from Advanced MathCourse Taking 25-28 (Sept. 2008) (unpublished manuscript, on file with the NorthCarolina Law Review); Doris R. Entwisle & Karl L. Alexander, Summer Setback: Race,Poverty, School Composition, and Mathematics Achievement in the First Two Years ofSchool 57 AM. SOC. REV. 72, 75-81 (1992); Christy Lleras, Race, Racial Concentration,and the Dynamics of Educational Inequality Across Urban and Suburban Schools 45 AM.EDUC. RES. J. 886, 899-900 (2008); Julianne Kirgis McNalley, "We Value Diversity,but..." Academic Achievement of White, Middle Class Elementary Students inSegregated and Integrated Schools 53 (May 2005) (unpublished Ph.D. dissertation,University of Iowa) (on file with the North Carolina Law Review); Roslyn ArlinMickelson, How Middle School Segregation Contributes to the Race Gap in AcademicAchievement 11-13 (Sept. 2008) (unpublished manuscript, on file with the North CarolinaLaw Review); Roslyn Arlin Mickelson, Subverting Swann: First- and Second-GenerationSegregation in the Charlotte-Mecklenburg Schools 38 AM. EDUC. RES. J. 215, 231-36(2001); Vincent J. Roscigno, Race and the Reproduction of Educational Disadvantage, 76Soc. FORCES 1033, 1050 (1998); Rumberger & Palardy, at 2032-36; Schiff et al., at 12-13;Southworth, at 91.
146. See Appendix: Armor & Watkins (2007), at 10-11; Valentina A. Bali & R.Michael Alvarez, The Race Gap in Student Achievement Scores: Longitudinal Evidencefrom a Racially Diverse School District, 32 POL'Y STUD. J. 393, 398-405 (2004); Benson &Borman; MARK BERENDS ET AL., RAND CORP., EXAMINING GAPS IN MATHEMATICS
ACHIEVEMENT AMONG RACIAL-ETHNIC GROUPS, 1972-1992, at 71-75 (2005); Brown-Jeffy, at 397-401; Crosnoe, at 582-83; Goldsmith, at 101-02; Harris, at 17-18; Herman, at38-39; Hoffer, at 214; Ge Liu & William Carbonaro, Friendship Networks andRacial/Ethnic Differences in Academic Outcomes 14-16 (Aug. 4, 2008) (unpublishedmanuscript, on file with the North Carolina Law Review) (presented at the AmericanSociological Association Annual Meeting, Boston, Mass.); Chandra Muller et al., Race,Social Class and Academic Achievement in U.S. High Schools 9 (2004) (unpublishedmanuscript, on file with the North Carolina Law Review) (presented at the American

ED UCA TION & MATH 0 UTCOMES
sixteen with Asians in the samples actually discussed Asians, 47 andnone of the seven studies with Native Americans in the samplereported specific findings about them. Six studies presented findingsfor minorities in general, 148 and four reported findings onimmigrants.149 Table 3 summarizes the quality of the findings by typeof school composition for specific racial, ethnic, and SES groups.
Table 3. Strength of Findings About School Racial and SESComposition by Student Race and SES
School Racial School S CompositionRCoposition and and Evidence of
Race and SES Evidence of SegregationsStudents Segregati' Harm/D ty
Harm/Diversity's BeefitsBenefits
Student Race
Black Strong StrongWhite Strong Moderately strong
Latino/a Strong SuggestiveAsian Strong Insufficient Data
Native American Insufficient Data Insufficient Data
Immigrant Suggestive Insufficient DataMinority Strong Insufficient Data
Student SES
Low Income Insufficient Data Moderately StrongNot Low Income Insufficient Data Moderately strong
Sociological Association Annual Meeting, S.F., Cal.); Muller et al. (forthcoming 2010);Portes & Hao, at 11,926; Ryabov & Van Hook, at 782-83.
147. See Appendix: Brown-Jeffy, at 398-99; Palardy, at 26, 32; Portes & Hao, at 11,923-26.
148. See Appendix: Liu & Carbonaro, at 16; Muller et al. (forthcoming 2010); Newton;Vincent J. Roscigno, Donald Tomaskovic-Devey & Martha Crowley, Education and theInequalities of Place, 84 SOC. FORCES 2122, 2139 (2006); Rumberger & Willms, at 393;Schiff et al., at 14-15.
149. See Appendix: Rebecca Callahan et al., at 355; Goldsmith, at 102; Portes & Hao,at 11920; Ryabov & Van Hook, at 767.
2010] 1031

1032 NORTH CAROLINA LAW REVIEW [Vol. 88
1. Blacks
The preponderance of the studies that discussed the effect ofracial composition on Black achievement concluded that racialdiversity in schools positively affects Black students' mathachievement, 5 ° or that racial segregation negatively affects theirmathematics performance.'51 Among studies that reported significanteffects for Blacks and Whites, several sources specified thatsegregation had a larger impact for Blacks than for Whites. 5 2 Of thethirty-five that specifically discussed Blacks, only one study found nosignificant relationship between Black concentration and math
150. See Appendix: Brown-Jeffy, at 399-400; Harris, at 21; Liu & Carbonaro, at 16;Schiff et al., at 12-13; Southworth, at 147; see also Bali & Alvarez, at 410 (suggesting thisfinding).
151. See Appendix: David J. Armor & Stephanie Duck, The Effect of Black Peers onBlack Test Scores 14 (May 28, 2007) (unpublished manuscript, on file with The NorthCarolina Law Review); David J. Armor & Shanea J. Watkins, School Segregation andBlack Achievement: New Evidence from the 2003 NAEP, in THE BENEFITS OF RACIALAND ETHNIC DIVERSITY IN ELEMENTARY AND SECONDARY EDUCATION 28, 34-37(U.S. Comm'n on Civil Rights ed., 2006); Carl Bankston III & Stephen J. Caldas, MajorityAfrican American Schools and Social Injustice: The Influence of De Facto Segregation onAcademic Achievement, 75 SOC. FORCES 535, 543-49 (1996); Berends et al. (2005), at 74-75; Mark Berends, Samuel R. Lucas & Roberto V. Pefialoza, How Changes in Familiesand Schools Are Related to Trends in Black-White Test Scores, 81 SOC'Y. EDUC. 313, 329(2008); Kathryn M. Borman et al., Accountability in a Postdesegregation Era: TheContinuing Significance of Racial Segregation in Florida's Schools, 41 AM. EDUC. RES. J.605, 624 (2004); Dennis J. Condron, Social Class, School and Non-School Environments,and Black/White Inequalities in Children's Learning, 74 AM. SOC. REV. 683, 699 (2009);Entwisle & Alexander, at 82; Covay, at 17; William J. Glenn, Separate but Not Yet Equal:The Relation Between School Finance Adequacy Litigation and African American StudentAchievement, 81 PEABODY J. EDUC. 69, 85, 91 (2006); Eric A. Hanushek & Steven G.Rivkin, School Quality and the Black-White Achievement Gap 23 (Nat'l Bureau of Econ.Research, Working Paper No. 12651, 2006); Eric A. Hanushek & Steven G. Rivkin,Harming the Best: How Schools Affect the Black-White Achievement Gap 21 (Nat'l Bureauof Econ. Research, Working Paper No. 14211, 2008); Eric A. Hanushek, John F. Kain &Steven G. Rivkin, New Evidence About Brown v. Board of Education: The ComplexEffects of School Racial Composition on Achievement, 27 J. LAB. ECON. 349, 375 (2009);Lleras, at 901-02; Mickelson (2001), at 229-31; Mickelson (2008), at 19-20; Muller et al.(2004), at 12-14; Muller et al. (forthcoming 2010); Douglas Ready & Megan Silander,Estimating the Influence of School Racial and Socioeconomic Composition on StudentLearning: Methodological Challenges and Alternative Solutions (Apr. 2, 2009)(unpublished manuscript at 24, on file with the North Carolina Law Review) (presented atLooking to the Future: Legal and Policy Options for Racially Integrated Education in theSouth and the Nation, Chapel Hill, N.C.); Roscigno, at 1045; Rumberger & Willms, at 390-91; Schiff et al., at 12-13.
152. See Appendix: Armor & Watkins (2006), at 31; Bankston & Caldas, at 552; Covay,at 18; Liu & Carbonaro, at 1; Muller et al. (2004), at 10.

2010] ED UCA TION & MATH 0 UTCOMES 1033
achievement." 3 Four studies found that Black school composition wasnot as important as SES. 1'54 Research on the effects of SEScomposition on Black students' achievement reported that lowconcentrations of poor children are positively related to mathachievement. 5 ' Together, these findings offer strong evidence thatattending diverse schools is associated with positive mathematicsoutcomes for Blacks and that racial and/or SES segregation hasnegative effects on their achievement.
2. Whites
Almost all of the studies summarized in this Article includeWhites in their sample, yet only twelve of them discuss the effects ofracial or SES composition for White students in detail. 56 Of these,seven reported that as minority segregation increases, Whites' mathoutcomes decrease. 57 One study noted that the relationship betweenracially isolated minority schools and diminished achievement forWhites is weaker than it is for Blacks.'58 Three of the twelve studiesfound that while attending a diverse school had no positive effect onthe math achievement of Whites, neither did it have a negative
153. See Appendix: Goldsmith, at 83.154. See Appendix: Benson & Borman; Chubb & Moe, at 127-28; McCathern, at 201;
Rumberger & Palardy, at 1999.155. See Appendix: Johnson, at 11; Palardy, at 33.156. See Appendix: Brown-Jeffy, at 398-402; Caldas & Bankston III, at 550-52; Covay,
at 25-28; Entwisle & Alexander, at 75-81; Lleras, at 899-900; McNalley, at 16-17;Mickelson (2001), at 231-36; Mickelson (2008), at 11-13; Roscigno, at 1050; Rumberger &Palardy, at 33; Schiff et al., at 12-13; Southworth, at 91. The absence of a discussion ofcompositional effects on Whites, even though data are available to do so, may reflectunderlying assumptions that Whites are a criterion category or that only students of color,not all students in a school, are the beneficiaries of diversity. This limitation is glaringlyrepeated throughout the school racial composition literature and, in the authors' opinion,reflects a major shortcoming. By focusing interpretations and discussions of compositionaleffects only on children of color, researchers miss the opportunity to report theimplications of integration for White students' mathematics outcomes. Robert Gardamakes a similar argument with respect to Whites' broader interests in integratededucation. See generally Robert A. Garda, Jr., The White Interest in School Integration(2009) (unpublished manuscript), available at http://ssrn.com/abstract=1463598 (arguingthat Whites have broad interests in integrated education).
157. See Appendix: Bankston & Caldas, at 535; Entwisle & Alexander, at 80; Lleras, at1; Mickelson (2001), at 230; Mickelson (2008), at 21; Roscigno, at 1047. Elizabeth Covayalso reported this in an updated version of an earlier manuscript. See Elizabeth Covay,Racial Differences in Access to and Returns from Advanced Math Course Taking 29(Sept. 2009) (unpublished manuscript, on file with the North Carolina Law Review).
158. See Appendix: Bankston & Caldas, at 552.

NORTH CAROLINA LAW REVIEW
effect. 59 Two studies reported that, for Whites, schools with raciallydiverse student bodies (within specific thresholds) foster higher mathachievement than do racially isolated White schools."6 Several studiesreport the positive correlation of low-poverty school compositionwith the achievement of White students.1 61 Together, these studiespresent strong evidence that minority segregation negatively affectsthe achievement of Whites and that attending diverse schools doesnot harm the mathematics achievement of White students.Additionally, there is moderately strong evidence that a school's SEScomposition is important for its students' math achievement.
3. Latinos/as
Eleven out of the sixteen studies that discussed outcomesspecifically for Latinos/as reported that as racial diversity increases inschools, mathematics outcomes do as well, 62 or that racial segregationnegatively affects Latino/a achievement in mathematics. 163 Twoarticles found a positive effect for Latino/a segregation on themathematics achievement of students."6 The positive segregationeffect is likely rooted in the benefits of immigrant concentrationrather than in Latino/a concentration per se.16' Only one study reportsno significant effect of segregation on Latino/a achievement.' 66
Socioeconomic composition also influences Latino/a mathachievement. Two articles reported that socioeconomic compositionwas closely related to math achievement of Latino/a students.1 67
Overall, the research record presents strong evidence that segregationundermines Latinos/as' mathematics achievement and moderatelystrong evidence that attending diverse schools fosters it. In addition,there is suggestive evidence that concentrated poverty is also
159. See Appendix: Brown-Jeffy, at 398; McNalley, at 40; Schiff et al., at 13.160. See Appendix: Brown-Jeffy, at 398; Southworth, at 147.161. See Appendix: Entwisle & Alexander, at 82; Rumberger & Palardy, at 1999;
Southworth, at 147.162. See Appendix: Brown-Jeffy, at 400; Liu & Carbonara, at 16; see also Bali &
Alvarez, at 410 (suggesting this finding).163. See Appendix: Berends & Pefialoza, at 21; Berends et al. (2005), at 73; Crosnoe, at
579; Muller et al. (forthcoming 2010); Muller et al. (2004), at 2; Harris, at 17; Herman, at36-39; see also Ryabov & Van Hook, at 767 (reporting that the relationship holds only inthe case of foreign-born Latinos/as).
164. See Appendix: Goldsmith, at 96; Portes & Hao, at 11,926.165. See Appendix: Goldsmith, at 97.166. See Appendix: Armor & Watkins (2007), at 1.167. See Appendix: Benson & Borman; Hoffer, at 225.
1034 [Vol. 88

ED UCA TION & MATH 0 UTCOMES
negatively related to Latino/a math achievement. The exception tothese trends is ethnic segregation's possible positive effects for mathoutcomes of Latino/a immigrants.
4. Asians
Sixteen studies included Asians in their samples,168 but only threeof these studies reported outcomes specifically for Asians'mathematics achievement.169 Twelve of the studies that includedAsians in their samples reported positive effects of diversity, althoughnot all studies reported effects of diversity specifically for Asians.Findings from the other three showed that attending a school withmore privileged students benefits Asians' math achievement. 7 ° Oneof the three studies concluded that Asian concentration acts as apositive leveling factor for other Asian students.1 71 Another studyreported that Asian students have better outcomes in schools that areoverwhelmingly White and/or Asian,"' and the third one indicatedthat attending school with concentrations of high income studentsbenefits Asians more than it does Whites. 173
5. Native Americans
The seven studies that included Native Americans in theirsamples reported that attending either a racially or socioeconomicallydiverse school has a positive effect on mathematics outcomes,174 butnone of the studies discussed the effect of racial and/or SEScomposition specifically with regard to Native American mathematicsachievement. Without specific findings about Native Americansamples, there is insufficient evidence to draw conclusions about theeffects of either racial or SES composition on their mathematicsachievement.
168. See Appendix: Benson & Borman; Brown-Jeffy, at 388; Callahan et al., at 364;Goddard et al., at 301; Harris, at 3; Herman, at 26; Muller et al. (forthcoming 2010);Newton; Page et al., at 23; Palardy, at 26; Payne & Biddle, at 4; Pong, at 23; Portes & Hao,at 11,921; Rumberger & Willms, at 380; Southworth, at 3; Tevis, at 54.
169. See Appendix: Brown-Jeffy, at 402; Palardy, at 32; Portes & Hao, at 11,926.170. See Appendix: Brown-Jeffy, at 402; Palardy, at 32; Portes & Hao, at 11,926.171. See Appendix: Portes & Hao, at 11,926.172. See Appendix: Brown-Jeffy, at 402.173. See Appendix: Palardy, at 32.174. See Appendix: Benson & Borman; Harris, at 18; Newton, at 8; Page et al., at 33;
Palardy, at 31; Southworth, at 100, 107; Tevis, at 57.
2010] 1035

NORTH CAROLINA LAW REVIEW
6. Immigrants
Two of the four studies that report school compositional effectson immigrant students' mathematics achievement find that Asian andLatino/a immigrants perform better in schools with greater numbersof their co-ethnics. 75 Another study reported that high concentrationsof immigrants have an indirect effect on math outcomes throughgreater likelihood of ESL program placement, which itself positivelyaffects mathematics achievement. 7 6 In contrast, a fourth articlereported that an increase in school minority composition has anegative effect on grades in the case of Latino/a immigrants (but notLatinos/as in general). 77 Together, the four studies present suggestiveevidence that for Asian and Latino/a immigrant students, there is apositive relationship between higher concentrations of their co-ethnics and their mathematics achievement.
7. Minorities
Five articles referred to effects of racial composition onmathematics outcomes for minorities in general. Four of these articlesreported that increases in minority concentration correspond todecreases in minority students' mathematics achievements. 7 8 Theremaining study found that diversity is particularly beneficial for theacademic achievement of minorities because of the opportunities togain social capital that diverse schooling offers.179 Overall, studies thatreport findings about minority students offer strong evidence thatschool racial segregation is negatively related to minority mathachievement.
B. Findings by Student SES
The social science literature is quite clear that school racialcomposition is not equivalent to school socioeconomic composition,although they are highly correlated."8 The research record is also
175. See Appendix: Goldsmith, at 97; Portes & Hao, at 11,925.176. See Appendix: Callahan et al., at 376.177. See Appendix: Ryabov & Van Hook, at 776.178. See Appendix: Newton, at 12; Rumberger & Willms, at 393; Roscigno, at 2136;
Schiff et al., at 14.179. See Appendix: Liu & Carbonaro, at 16.180. See generally DAVID GRUSKY, SOCIAL STRATIFICATION IN SOCIOLOGICAL
PERSPECTIVE: RACE, CLASS, AND GENDER (2d ed. 2001) (presenting social science
1036 [Vol. 88

ED UCA TION & MATH 0 UTCOMES
unambiguous about the overall effects of school socioeconomiccomposition on mathematics outcomes: concentrated school povertyhas a negative effect on the mathematics outcomes of all students whoattend such institutions.8 1 The general literature indicates thatchildren from less advantaged families benefit academically from SESintegration while those from the middle class are not hurt, and maybenefit from it."
Empirical studies differentiating the influence of schools' racialand SES composition on mathematics outcomes for students fromdifferent socioeconomic backgrounds are relatively rare. Only five ofthe fifty-nine studies included in this synthesis discuss in detail theimpact of variations in school SES composition 183 on the mathematicsachievement of students categorized by their own socioeconomicbackgrounds."8' The five studies provide moderately strong evidencethat students from various socioeconomic strata are differentiallyaffected by a school's SES composition. Two studies reported thatSES effects are comparable for students from any SES background. 185
Two others report low-SES youth are more strongly affected byschool SES than children from more advantaged backgrounds. 186 Thefifth study reports that the mathematics achievement of White,middle class students is not affected by the SES composition of aschool.187
research on the structure of social inequality organized around three distinct, but related,concepts of race, class, and gender).
181. See generally RICHARD KAHLENBERG, ALL TOGETHER Now: CREATINGMIDDLE-CLASS SCHOOLS THROUGH PUBLIC SCHOOL CHOICE (2001) (presenting abroad overview of twenty years of research that shows how and why concentrated schoolpoverty negatively affects achievement).
182. See id. at 39; Appendix: Palardy, at 21.183. None of the five addressed the impact of racial composition.184. See Appendix: Valerie E. Lee, Julia B. Smith & Robert G. Croninger, How High
School Organization Influences the Equitable Distribution of Learning in Mathematics andScience, 70 SOC. EDUC. 128, 137-38 (1997) [hereinafter Lee et al., High SchoolOrganization]; McNalley, at 32; Palardy, at 32-34; Rumberger & Palardy, at 2012-14;Ready & Silander, at 20-30. This Article focuses exclusively on research conducted withU.S. students, although international studies report similar findings.
185. See Appendix: Lee et al. High School Organization, at 138; Rumberger & Palardy,at 1999.
186. See Appendix: Palardy, at 21; Ready & Silander, at 14-19.187. See Appendix: McNalley, at 32.
20101 1037

NORTH CAROLINA LAW REVIEW
C. Findings by Grade Level
The fifty-nine studies synthesized in this Article utilized samplesof students from elementary, middle, and high school. Of these,thirty-one included high school students in their sample,188 twenty-seven studies reported on middle school students,18 9 and twenty-twodealt with kindergarten and elementary school students. 9 Somestudies combined elementary and middle school samples, middle andhigh school samples, and so on. The majority focused exclusively ononly one grade level. Table 4 summarizes the quality of the evidencefor school race and SES compositional effects by grade level structureof the samples.
Table 4. Strength of Findings About School Racial and SESComposition and Grade Structure of Sample
Hign 3cnooi umny Mtrong ttn
High, Middle, and Suggestive Insufficient DataElementarv Schoo
iddle choolOnySrn
Nid1e~in FlernentmMod )[rtmly
Elementary Only Suggestive Strong
1. High School Samples
The results of the twenty-three studies with exclusively highschool samples19 show that both racial segregation192 and
188. See Appendix.189. See Appendix.190. See Appendix.191. See Appendix.
1038 [Vol. 88

ED UCA TION & MATH 0 UTCOMES
concentrated poverty 93 are detrimental for mathematics achievement.The one study that focused on diversity, rather than segregation,suggested that high school racial diversity within certain parametersfosters achievement. 94 Another study reported that SES compositionhas stronger effects on gains in mathematics achievement duringgrades eleven through twelve than on gains made during grades eightthrough ten.'95 Two of them found no significant relationshipsbetween racial composition and achievement. 196 Overall, with thepossible exception of schools with large concentrations of immigrantyouth,"9 the evidence is strong that both minority segregation andpoverty concentration undermine the mathematics achievement ofhigh school students.
2. High School and Middle School Samples
Almost all of the studies that use samples containing both highschool and middle school students show that racial segregation has anegative impact on mathematics achievement. 198 The only exceptionto this finding was a single study that found that racial concentrationhad no effect on mathematics achievement of high school and middleschool Black students, although the same study found a positive effectin the case of Latino/a immigrant concentration.' 99 Studies thataddress the impact of school SES found that concentrated poverty hasa negative effect on math achievement. 2°° Like the findings from the
192. See Appendix: Bankston & Caldas, at 535; Berends & Pefialoza, at 21; Berends etal. (2005), at 73; Berends et al. (2008), at 329; Caldas & Bankston III, at 275; Covay, atabstract; Crosnoe, at 579; Herman, at 36-37; Liu & Carbonaro, at 16; Mickelson (2001), at215; Muller et al. (forthcoming 2010); Pong, at 33; Roscigno, at 1047; Rumberger &Palardy, at 2020; Tevis, at 54.
193. See Appendix: Lee et al. Course-Taking, at 112; Roscigno et al., at 2136-38;Rumberger & Palardy, at 2014; Tevis, at 52-58; Adrian N. Welcher, Head of the Class:Black/White Inequality, Cultural and Social Capital, and High School Math Achievement27 (Jan. 17, 2008) (unpublished manuscript, on file with the North Carolina Law Review)(presented at the annual meeting of the American Sociological Association AnnualMeeting, Sheraton Boston and the Boston Marriott Copley Place, Boston, Mass., 2008).
194. See Appendix: Brown-Jeffy, at 399-400.195. See Appendix: Lee et al., High School Organization, at 137.196. See Appendix: Chubb & Moe, at 126, 127; Lee et al., Course-Taking, at 112.197. See Appendix: Callahan, at 376.198. See Appendix: Lleras, at 23; Muller et al. (2004), at 12; Newton, at 28; Ryabov &
Van Hook, at 767 (reporting that this finding holds only in the case of foreign bornLatinos/as).
199. See Appendix: Goldsmith, at 101.200. See Appendix: Muller et al. (2004), at 5; Ryabov & Van Hook, at 782.
2010] 1039

NORTH CAROLINA LAW REVIEW
high school-only samples, results from these combined samples offerstrong evidence that racial segregation is detrimental for the mathachievement of middle and high school students.
3. Middle School Samples
Nine of the fifty-nine studies utilized a sample of exclusivelymiddle school students.2 1 The majority of these studies either foundthat racial segregation has negative effects on math outcomes,2 °Q orthey concluded that concentrated school poverty has a negative effecton math achievement.2 3 One study reported that school SES interactswith family SES, compounding the already considerable advantagesof students from more privileged backgrounds. 2°4 In summary, theresearch that exclusively employs middle school student samplesoffers strong evidence that concentrated poverty and racialsegregation hinder mathematics performance.
4. Elementary School Samples
Nine studies utilized samples with only elementary students. 05
Many of the studies found that SES composition was more influentialthan racial composition for mathematics outcomes.2 6 Four studiesfound that as racial segregation increased, mathematics achievementof elementary students decreased.27 Two articles reported thatracially diverse schools may offer their students a better chance toexcel in math. 28 Three studies showed no statistically significanteffect of racial composition on mathematics achievement.2 9 While
201. See Appendix: Armor & Watkins (2006), at 30; Hoffer, at 205; Lee & Smith, at164; Mickelson (2008), at 1; Page et al., at 34; Palardy, at 22; Payne & Biddle; Portes &Hao, at 11,921; Schiff et al., at 8.
202. See Appendix: Armor & Watkins (2006), at 35-36; Schiff et al., at 14; Mickelson(2008), at 21; Page et al., at 34.
203. See Appendix: Hoffer, at 225; Lee & Smith, at 174; Palardy, at 21; Payne & Biddle,at 11.
204. See Appendix: Portes & Hao, at 11,924.205. See Appendix: Bali & Alvarez, at 397; Benson & Borman; Condron, at 689;
Entwisle &. Alexander, at 73; Goddard et al., at 299; McCathern, at 1; McNalley, at 2;Murnane et al., at 99; Ready & Silander, at 7.
206. See Appendix: Benson & Borman; McCathem, at 147 tbl.29, 171 tbl.38; Murnaneet al., at 175-76.
207. See Appendix: Condron, at 699; Entwisle & Alexander, at 82; Goddard et al., at308; Ready & Silander, at 20.
208. See Appendix: Bali & Alvarez, at 410; McNalley, at 32.209. See Appendix: Benson & Borman; McCathern, at 190; Murnane et al., at 124.
1040 [Vol. 88

ED UCA TION & MATH 0 UTCOMES
studies employing only elementary school samples offer strongevidence regarding the harmful effect of poverty concentration onmathematics achievement, they offer suggestive evidence regardingthe effects of racial composition on mathematics achievement ofelementary students.
5. Middle and Elementary School Samples
The preponderance of studies that used samples with bothelementary and middle school students show that minorityconcentration has a negative effect on mathematics achievement. 210
Four studies found a negative relationship between povertyconcentration and math achievement.21 One study found nosignificant relationship between minority concentration andachievement.212 The sole study that examined diversity effectsreported that integrated elementary and middle schools foster themathematics achievement of their students.213 In summary, theevidence from combined middle and elementary school samplesstrongly indicates that attending racially segregated schoolsnegatively affects the mathematics outcomes of these students. Thisset of research also offers moderately strong evidence that povertyconcentration negatively influences outcomes.
6. Combined Elementary, Middle, and High School Samples
Three of the studies relevant to this synthesis examined theeffects of school racial composition with samples that includedstudents in elementary through high school.214 Two of these studiesshowed that racial composition mattered for math achievement ofstudents and that integrated schools benefitted minority students inall school grades.21 5 The third study obtained very few significant
210. See Appendix: Armor & Duck, at 18; Glenn, at 91; Eric A. Hanushek & MargaretE. Raymond, Does School Accountability Lead to Improved Student Performance? 14(Nat'l Bureau of Econ. Research, Working Paper No. 10591, 2004); Hanushek & Rivkin(2008), at 13-14; Hanushek & Rivkin (2006), at 25; Hanushek et al., at 349; Southworth, at137, 146-147.
211. See Appendix: Hanushek & Raymond, at 13-14; Johnson, at 11; Sorhaindo, at 34;Southworth, at 146.
212. See Appendix; Armor & Watkins (2006), at 42.213. See Appendix: Southworth, at 147.214. See Appendix: Borman et al., at 615; Burke & Sass, at 16; Harris, at 14.215. See Appendix: Borman et al., at 626; Harris, at 17.
2010] 1041
NORTH CAROLINA LAW REVIEW
effects for the racial composition variables.216 Overall, studies usingcombined elementary, middle, and high school samples offersuggestive evidence that racial composition negatively affectsmathematics outcomes.
In summary, the preponderance of findings from the fifty-ninestudies indicates that mathematics outcomes are negatively affectedby minority racial isolation and concentrated poverty and thatmathematics outcomes are likely to be higher for students from allgrade levels, racial, and SES backgrounds if they attend integratedschools. These generalities are more tentative with respect to Asiansand Native Americans because there is insufficient research to drawreliable conclusions about them. There is also suggestive evidencethat Latino/a and Asian immigrant students may benefit fromattending school with co-ethnics. Finally, findings on elementarystudents' achievement are less definitive than the evidence aboutstudents in higher grade levels. Although six studies using elementaryschool samples show strong evidence of the negative effects of racialsegregation or the benefits of integrated education,2 7 three otherstudies showed no effects.2 18 Some of the researchers who obtainedthese findings speculate that the weaker influence of schoolcomposition on very young students' (K-2) mathematics scores islikely due to their exposure to limited mathematics curriculum in theearliest grades.219
VI. DISCUSSION
From time to time, scholars, government actors, and policyanalysts update the list of "what works" in education. 220 The findings
216. See Appendix: Burke & Sass, at 11.217. See Appendix: Bali & Alvarez, at 410; Condron, at 699; Entwisle & Alexander, at
82; Goddard et al., at 20; McNalley, at 53; Ready & Silander, at 20.218. See Appendix: Benson & Borman; McCathern, at 190; Murnane et al., at 124.219. See Appendix: Benson & Borman.220. For example, the Association for Supervision and Curriculum Development, in
conjunction with Robert Marzano, has developed a tool for educational practitionerscalled "What Works in Schools." Association for Supervision and CurriculumDevelopment, What Works in Schools: Online Survey, http://www.whatworksinschools.org (last visited Feb. 13, 2010). In 2002, the U.S. Department of Education's Institute ofEducational Sciences established a "What Works Clearinghouse." U.S. Dep't of Educ.,What Works Clearinghouse, http://ies.ed.gov/ncee/wwc/ (last visited Feb. 13, 2010). Overtwo decades ago, the Department of Education published a pamphlet entitled WhatWorks: Research About Teaching and Learning. U.S. DEP'T OF EDUC., WHAT WORKS:
1042 [Vol. 88

ED UCA TION & MATH 0 UTCOMES
from this Article indicate that for the vast majority of mathematicslearners, integrated schools could be added to the list of "whatworks." The findings demonstrate the relevance of school racial andsocioeconomic diversity for enhancing mathematics outcomes forelementary, middle, and high school students from all racial and SESbackgrounds. There is some evidence that the effects of compositionare especially keen for youth from low-income Black and Latino/afamilies.
This Article's findings will contribute to clarifying confusionsabout the empirical record on this topic as reflected in the ParentsInvolved opinions' disparate interpretations of the social scienceliterature. The current corpus of social science literature providesconsistent and unambiguous evidence that attending a racially diverseschool with low concentrations of poor children is positively relatedto mathematics outcomes for most students irrespective of their age,race, or family's SES. The inverse of this statement is also true-attending a school with high concentrations of minority or poorstudents is negatively related to mathematics outcomes for moststudents.
Because of the design flaws, sample problems, andunderdeveloped analytic strategies found in many of the studiesconducted during the first few decades after Brown, the earlyresearch record on compositional effects is inconsistent andinadequate for assessing the effects of integrated education onachievement outcomes.221 But the flaws of the early studies do notmean that more recent ones suffer from the same methodologicalweaknesses, or that the entire corpus of social science on schoolcompositional effects is inconsistent and ambiguous.222 Newer, betterstudies have superseded the older ones. Science is cumulative. As thisArticle has documented, 223 the preponderance of post-1990 researchconsistently indicates that integrated education is positivelycorrelated with mathematics achievement for almost every student
RESEARCH ABOUT TEACHING AND LEARNING (1986), available at http://www.eric.ed
.gov/ERICDocs/data/ericdocs2sql/content_storage_01/0000019b/80/2efc/ca.pdf.221. Bradley & Bradley, supra note 45, at 443-44.222. But see Parents Involved in Cmty. Sch. v. Seattle Sch. Dist. No. 1, 551 U.S. 701,
762-63 (2007) (Thomas, J., concurring) (alteration in original) (quoting Brief of AmiciCuriae Drs. Murphy et al. in support of Petitioners, supra note 50, at 8) (asserting that thesocial science literature is "inconclusive").
223. See Appendix.
2010] 1043
NORTH CAROLINA LAW REVIEW
group throughout their elementary and secondary schooling. In thefuture, some policy makers, citizens, or jurists may wish to advance anargument that there is no consistent or unambiguous body of socialscience research about the effects of integrated education. But withrespect to mathematics outcomes, it is difficult to fathom how anyonecould draw upon the current and complete social scientific record as awarrant for such a claim.
The literature synthesized in this Article does not fully addressseveral vital aspects of the topic because the research foundation todo so is weak or absent. The first gap in the research concerns thepeople school composition affects. Most research reports findings forBlacks and, to a lesser extent, for Whites. The most striking weaknessin this informational mosaic concerns the relationships of racialintegration to mathematics outcomes for Asians, Latinos/as, NativeAmericans, multiracial, and immigrant students. More research aboutstudents in these specific groups is essential, especially given theexpected demographic transformation of the U.S. student populationin the next few decades.224 In a related vein, further investigations areneeded to identify the most advantageous combinations of ethnic,racial, and socioeconomic backgrounds to optimize opportunities tolearn for all students in a school.
Even though the majority of the studies synthesized in thisArticle included Whites in their sample, the overall social scienceresearch record provides inadequate information about outcomesspecifically for White students. Forty-one of the fifty-four studies withWhite students in their samples fail to report the effects of schoolcomposition on Whites.2" Researchers' silence neglects the point thatschool diversity has the potential to benefit or harm Whites as well aschildren of color. Failing to report outcomes for Whites when thedata are available to do so is disappointing from the perspective ofbasic research and educational policy. As this Article's findingssuggest, Whites can benefit from integrated schooling. Interest-convergence theory proposes that integrated schools are unlikely to
224. See U.S. Census Bureau, 2008 National Population Projections: Summary Table,http://www.census.gov/population/www/projections/summarytables.html (last visited Feb.24, 2010).
225. See Appendix.
1044 [Vol. 88

EDUCATION & MATH OUTCOMES
be created or to garner political support from White parents unlessthey believe integrated schools serve their children's best interests.226
Similarly, even though most data sets have family SES data forevery student, only a few studies examine how a student's SESmediates the relationships among mathematics outcomes and school'sracial composition. One can apply interest-convergence theory to theSES issue as well: until middle-class parents see a value in diverseschools, they are unlikely to support them.
The second gap in the research record concerns how raciallydiverse schools foster greater mathematics achievement. There areseveral fruitful lines of inquiry in this area that are already sheddinglight on the gaps in our knowledge base.
(1) Resources distinguish integrated from segregated minorityschools, and teacher quality is emblematic of these resourcesdisparities. Better qualified teachers are less likely to teach inracially segregated minority schools or those with concentratedpoverty,227 and teacher quality (operationalized as experience,licensure, test scores, and selectivity of undergraduateinstitution) correlates with higher student performance.228
(2) Peer effects are a second factor widely known to influenceadolescents' school performance. Students who attend racially
226. See Derrick A. Bell, Jr., Brown v. Board of Education and the InterestConvergence Dilemma, 93 HARv. L. REV. 518, 523 (1980) ("The interest of blacksachieving racial equality will be accommodated only when it converges with the interestsof whites."); Garda, supra note 156, at 1.
227. Charles Clotfelter, Helen F. Ladd & Jacob L. Vigdor, School Segregation UnderColor-Blind Jurisprudence: The Case of North Carolina 17 (Duke Univ. Terry SanfordInst. of Pub. Pol'y Working Paper Series SAN08-02, 2008), available athttp://sanford.duke.edu/research/papers/SAN08-02.pdf. See generally Hamilton Lankford,Susanna Loeb & James Wyckoff, Teacher Sorting and the Plight of Urban Schools:Descriptive Analysis, 24 EDUC. EVALUATION & POL'Y ANALYSIS 37 (2002)(demonstrating that teachers leave schools with high levels of minority or low incomestudents). In fact, the resegregation of the Charlotte-Mecklenburg School system afterunitary status spurred better qualified teachers to leave newly racially isolated schools. SeeKirabo Jackson, Student Demographics, Teacher Sorting, and Teacher Quality: Evidencefrom the End of Desegregation, 27 J. LAB. ECON. 213, 216 (2009).
228. See Jackson, supra note 227, at 214; see also Charles Clotfelter, Helen F. Ladd, &Jacob L. Vigdor, Teacher-Student Matching and the Assessment of Teacher Effectiveness,41 J. HUM. RESOURCES 778, 807 (2006) (showing evidence of the superiority ofexperienced over novice teachers); Sarah Theule Lubienski, Christopher Lubienski &Corinna Crawford Crane, Achievement Differences and School Type: The Role of SchoolClimate, Teacher Certification, and Instruction, 115 AM. J. EDUC. 97, 97 (2008) (findingthat the only teacher qualifications to predict improved student performance wereexperience and licensure scores).
2010] 1045

NORTH CAROLINA LAW REVIEW
and socioeconomically diverse schools benefit from socialinteractions with peers whose social networks, cultural capital,values, beliefs, goals, and school-oriented behaviors areconducive to academic achievement. According to peer effectstheories, advantaged students (typically, but not exclusively,middle-class White and Asian youth) positively influence thepro-education beliefs, values, and behaviors of other studentswith whom they attend school through a variety of sociological,cultural, and psychological dynamics.229
(3) A third promising line of inquiry suggests that the socialstructure of a diverse school or classroom directly fostersachievement by exposing interacting peers to new ideas,cognitive skills, and problem-solving techniques.230 Diversegroups of problem solvers-people with distinctive cognitiveand technical tools sets-consistently outperform homogeneousgroups of the best and the brightest because a larger pool ofinteracting individuals means a greater array of talents isavailable for problem solving. 231' Differences in how peoplethink, in the cognitive tools they possess, and in theirperspectives translate into a broad range of techniques, skills,dispositions, and abilities available to complete the group'stasks at hand.232 When authorities (e.g., management,educators, administrators) structure interactions to maximizethe potential of the identity diversity within a group, peopletend to find better solutions and are more productive than ifthey are members of homogeneous groups.233 The military andcorporate worlds recognize the importance of diversity in theirworkforce for many of these reasons.234 Social scientists have
229. Douglas N. Harris, How Do School Peers Influence Student EducationalOutcomes? Theory and Evidence from Economics and Other Social Sciences, 112 TCHRS.C. REC. (forthcoming 2010); see Clotfelter et al., supra note 227, at 16.
230. Mark Granovetter, The Micro-Structure of School Desegregation, in SCHOOLDESEGREGATION RESEARCH: NEW DIRECTIONS IN SITUATIONAL ANALYSIS, 99-101(Jeffrey Prager, Douglas Longshore & Melvin Seeman eds., 1986); see Clotfelter et al.,supra note 227, at 14; Harris, supra note 229.
231. ScoTr E. PAGE, THE DIFFERENCE: HOW THE POWER OF DIVERSITY CREATESBETTER GROUPS, FIRMS, SCHOOLS, AND SOCIETIES 158-65 (2007).
232. See id. at xix-xx.233. See id. at 13 (stating generally that diverse groups are better at solving problems
and making predictions).234. Brief for 65 Leading American Businesses as Amici Curiae Supporting
Respondents, Gratz v. Bollinger, 539 U.S. 244 (2003) (No. 02-516) and Grutter v.Bollinger, 539 U.S. 306 (2003) (No. 02-241) ("The existence of racial and ethnic diversityin institutions of higher education is vital to amici's efforts to hire and maintain a diverse
1046 [Vol. 88

2010] ED UCA TION & MATH 0 UTCOMES 1047
designed successful pedagogical approaches for heterogeneousclassrooms based on these dynamics.235
(4) The fourth area that promises to account for the advantagesof integrated learning environments is research on humancognition. Mathematics achievement involves higher orderthinking processes. Compared with homogeneousenvironments, school settings composed of racially diversestudents are likely to produce a learning environment thatfosters the deeper, more conscious, more effortful thinking thatis associated with higher order thinking processes.236 Conscious,effortful thinking contrasts with automatic, mindless, or routinethinking. A socially diverse learning environment createsdiscrepancies, discontinuities, and disequilibria that can inhibitautomaticity in cognitive processes and trigger the effortful,reflective thinking,237 associated with better mathematicsperformance.
workforce, and to employ individuals of all backgrounds who have been educated andtrained in a diverse environment... [because] ... such a workforce is important to amici'scontinued success in the global marketplace."); Consolidated Brief of Lt. Gen. Julius W.Becton, Jr. et al. as Amici Curiae Supporting Respondents, Gratz v. Bollinger, 539 U.S.244 (2003) (No. 02-516) and Grutter v. Bollinger, 539 U.S. 306 (2003) (No. 02-241) ("[A]highly qualified, racially diverse officer corps educated and trained to command ournation's racially diverse enlisted ranks is essential to the military's ability to fulfill itsprincipal mission to provide national security.").
235. See ELIZABETH G. COHEN, DESIGNING GROUPWORK STRATEGIES FOR THEHETEROGENEOUS CLASSROOM, at xv-xvi (2d ed. 1994); Rachel A. Lotan, Stepping intoGroupwork, in TEACHING COOPERATIVE LEARNING: THE CHALLENGE FOR TEACHEREDUCATION 167, 167 (Elizabeth G. Cohen, Celeste M. Brody & Mara Sapon-Shevin eds.,2004).
236. See Patricia Gurin et al., Diversity in Higher Education: Theory and Impact onEducational Outcomes, 72 HARV. EDUC. REV 330, 330 (2002); Sylvia Hurtado, DiversityEffects on Student Cognitive and Social Cognitive Outcomes (2006, white paper preparedfor the Spivack workshop, on file with the North Carolina Law Review) (reviewingresearch that demonstrates how diversity plays a role in a student's academicdevelopment); Expert Report of Patricia Gurin § IV, Gratz v. Bollinger, No. 97-7521(E.D. Mich. 2001) and Grutter v. Bollinger, No. 97-75928 (E.D. Mich. 2001), available athttp://www.vpcomm.umich.edu/admissions/research/expertsumm.html. See generallySOCIAL PSYCHOLOGY AND THE UNCONSCIOUS: THE AUTOMATICITY OF HIGHERMENTAL PROCESSES (John A. Bargh ed., 2007) (describing unconscious or "automatic"forms of psychological and behavioral processes of which people tend to be unaware, thatoccur without intention or consent, yet influence individuals in striking ways).
237. Gurin et al., supra note 236, at 330.
NORTH CAROLINA LAW REVIEW
CONCLUSION
Racially integrated schools are not the silver bullet that willaddress all sources of racial and SES gaps in mathematics outcomes.The gaps are products of complex interrelated dynamics arising fromindividual agency, family resources, and community forces thatinteract with the structures of opportunity to learn mathematicspresent in a given school.238 Nevertheless, this Article's findings areuseful in several ways for addressing the gaps.
First, the findings provide an empirical warrant for educators,policy makers, and parents voluntarily seeking to promote integratedschools and to create diverse mathematics classrooms in them. 39
Policy choices matter. An integrated educational system is not aphenomenon, like the weather, that is largely beyond the reach ofconscious human efforts to create. School leaders make policychoices-highly conscious policy choices-when they draw districtboundaries and school attendance zones. School district boundariesand school attendance zones have historically been mechanisms fortranslating residential demographic patterns into the racial and SEScomposition of schools. 240 Attendance boundaries can duplicate orchallenge the homogeneous demographic composition of manyresidential neighborhoods. Justice Kennedy's concurrence in ParentsInvolved, suggesting various strategies to avoid racially isolatedschools and to create diverse ones, recognizes that school districtleaders can make various choices in pupil assignment with distinctconsequences for the racial and socioeconomic composition of theschools they lead.241
Next, in light of Justice Kennedy's identification of severalpossible strategies that could be used to foster diversity and avoid
238. See MARTIN, supra note 13, at 187-89.239. For literature indicating the value of diverse classrooms for mathematics, see
OAKES, supra note 88, at 61-92; Jo Baler, How a Detracked Mathematics ApproachPromotes Respect, Responsibility, and High Achievement, 45 THEORY INTO PRAC. 40, 40(2006); Janet Ward Schofield, International Evidence on Ability Grouping with CurriculumDifferentiation and the Achievement Gap in Secondary School, 112 TCHRS. C. REC.(forthcoming 2010).
240. John R. Logan, Deirdre Oakley & Jacob Stowell, School Segregation inMetropolitan Regions, 1970-2000: The Impacts of Policy Choices on Public Education, 113AM. J. Soc. 1611, 1636 (2008).
241. See Parents Involved in Cmty. Sch. v. Seattle Sch. Dist. No. 1, 551 U.S. 701, 788-89(2007) (Kennedy, J., concurring).
[Vol. 881048
2010] EDUCATION & MATH OUTCOMES 1049
242 "a fsracial isolation, a number of school districts may voluntarily takesteps to promote racial diversity in their schools. Doing so is likely totrigger litigation that could revisit the question of whether raciallyintegrated K-12 schools are a compelling state interest and if specificplans are narrowly tailored. To the extent that the corpus of socialscience research on mathematics outcomes and integrated schoolingis brought to bear on the question of compelling interests throughexpert testimony or amicus briefs, the findings in this Article willcontribute to the answer.
Social science evidence may be necessary but it is far fromsufficient for influencing public policy, judicial decisions, or changingpublic opinion on controversial issues like school integration.243 Legalscholars have repeatedly argued that social science evidence tends tohave a limited impact on modern desegregation cases.2" Nonetheless,scholars have identified several ways that social science may affectoutcomes of litigation. Thus, the third manner in which this Article'sfindings may be useful is by contributing to the nation's evolvingweltanschauung on the issue, which then indirectly shapes the Court'sopinions by becoming part of the social context in which Justicesrender their decisions.2 45 For example, Professor Kevin Welner arguesthat by changing public discourse and beliefs, social science research
242. Id. at 789-90.243. The authors wish to thank Andrew Grant-Thomas for raising this point in his
discussant remarks. Audio Recording: Looking to the Future: Legal and Policy Optionsfor Racially Integrated Education in the South and the Nation Conference, Chapel Hill,North Carolina, Andrew Grant-Thomas, Discussant Remarks for Panel 1 (Track 2). (Apr.2, 2009), https://deimos.apple.com/WebObjects/Core.woa/BrowsePrivately/unc-public.2060017869.
244. See Ancheta, supra note 32, at 26-27; Moran, supra note 32, at 244; Ryan, supranote 32, at 1661; see also Epstein & Knight, supra note 32, at 215 (discussing theinformational role of amici curiae); Levine & Howe, supra note 32, passim (discussing theuse of social science in recent Supreme Court decisions and its impact on legal culture);Lynch, supra note 32, at 65-69 (discussing results of interviews with Supreme Court clerkson the way they and their Justices perceive social science data); Roesch et al., supra note32 at 2-3 (explaining the difficulty in measuring the impact of social science data onjustices and proposing hypothetical reasons why judges may ignore such data); Rustad &Koenig, supra note 32, at 111-14 (discussing the ways in which the modern Supreme Courthas expanded their use of social science data as well as ways in which the Justices arereluctant to rely upon it).
245. Moran, supra note 32 at 244; Kevin G. Welner, Scholars as Policy Actors: SocialScience Research, Societal Beliefs, and the Shifting Zone of Judicial Constraints 10 (2009)(unpublished manuscript, on file with the North Carolina Law Review) (presented atLooking to the Future: Legal and Policy Options for Racially Integrated Education in theSouth and the Nation, Chapel Hill, N.C.).
NORTH CAROLINA LAW REVIEW
can shift the zone of judicial constraints in which the Court's decisionmaking takes place.2"
Social science research, though, is only one part of the dynamicprocess of changing public opinion and a nation's weltanschauungconcerning integrated education. Psychologist Howard Gardnerdescribes other factors that foster changes in peoples' minds. Theyinclude the use of reason, the resonance of the issues for individuals'own lives (e.g., seeing integrated schools as beneficial for theirchildren's academic futures, as laboratories for democracy and forpositive intergroup relations), representative redescriptions that moreclearly portray the issue (e.g., detailing how modern businesses,sports teams, and the military benefit from heterogeneous groups ofactors),247 resources (e.g., creating incentives for communities todevelop diverse schools), and real-world events (e.g., pressures arisingfrom demographic shifts among the nation's student population).248
Just as there was resistance to desegregation after Brown, there iscontemporary resistance to maintaining and expanding integratedschools.249 However, if the empirical research synthesized in thisArticle is disseminated to citizens and public policy decision makersin a variety of ways that appeal to their logical, cognitive, andaffective thinking,250 the likelihood of changing their minds about thebenefits of integrated education for all students may increase.
The centrality of public schools to a democratic society-and tothe lives of the millions of students who attend them-requires thatcitizens, public policy decision makers, and jurists have the most
246. Welner, supra note 245, at 12-13.247. HOWARD GARDNER, CHANGING MINDS: THE ART AND SCIENCE OF CHANGING
OUR OWN AND OTHER PEOPLE'S MINDS 15-19 (2004). Cf. PAGE, supra note 231, at xix-xx (stating that diverse groups of problem solvers will consistently outperformhomogenous groups of the "best and brightest").
248. GARDNER, supra note 247, at 16-17.249. See JONATHAN KOZOL, THE SHAME OF THE NATION: THE RESTORATION OF
APARTHEID SCHOOLING IN AMERICA 18-20 (2005); Erica Frankenberg & Chinh Q. Le,The Post-Parents Involved Challenge: Confronting Extralegal Obstacles to Integration, 69OHIO ST. L.J. 1015, 1070 (2008); James E. Ryan & Michael Heise, The Political Economyof School Choice, 111 YALE L.J. 2043, 2051-52 (2002). See generally Roslyn A. Mickelson& Carol A. Ray, Fear of Falling from Grace: The Middle Class, Downward Mobility, andSchool Desegregation, 10 RES. SOC. EDUC. & SOCIALIZATION 207 (1994) (discussing theschool system reforms in Charlotte in 1992 and arguing that parents' opposition todesegregation arises, in part, from their concerns about education's role in the statusattainment process).
250. GARDNER, supra note 247, at 30.
1050 [Vol. 88

2010] EDUCATION & MATH OUTCOMES 1051
current, comprehensive, and rigorous social science available toinform their deliberations and, ultimately, their decisions. ThisArticle's review of the social scientific literature demonstrates that,with respect to mathematics achievement and related outcomes, itmatters if schools are racially and socioeconomically integrated.Given the empirical evidence that integration has positive effects onoutcomes, parents, educators, policy makers, and jurists shouldconsider addressing the role that school racial segregation andconcentrated poverty play in the persistence of achievement gaps inmathematics outcomes.

1052 NORTH CAROLINA LAW REVIEW [Vol. 88
APPENDIX
Table 1. Articles with Statistically SignificantR ace Effects ................................................. 1054
Table 2. Articles with No Statistically SignificantR ace Effects .................................................. 1080
Table 3. Articles with No Statistically SignificantRace Effects but with Statistically SignificantSES Effects .................................................. 1080
Table 4. Articles Exclusively About SES and with StatisticallySignificant SES Effects .................................... 1084
Source Table NumberArmor & Duck Table 1 1Armor & Watkins (2007) Table 1 2Armor & Watkins (2006) Table 2 45Bali & Alvarez Table 1 3Bankston & Caldas Table 1 4Benson & Borman Table 3 47Berends & Pefialoza Table 1 5Berends et al. (2008) Table 1 6Berends et al. (2005) Table 1 7Borman et al. Table 1 8Brown-Jeffy Table 1 9Burke & Sass Table 2 46Callahan et al. Table 1 10Caldas & Bankston Table 4 53Chubb & Moe Table 3 48Condron Table 1 11Covay Table 1 12Crosnoe Table 1 13Entwisle & Alexander Table 1 14Glenn Table 1 15Goddard & Salloum Table 1 16Goldsmith Table 1 17Hanushek & Raymond Table 1 18Hanushek & Rivkin (2008) Table 1 19Hanushek & Rivkin (2006) Table 1 20Hanushek et al. Table 1 21Harris Table 1 22Herman Table 1 23

2010] ED UCA TION & MATH 0 UTCOMES
Source Table NumberHoffer Table 4 54Johnson Table 4 55Lee et al. High School Achievement Table 1 24Lee et al. Course Taking Table 3 49Lee & Smith Table 4 56Liu & Carbonaro Table 1 25Lleras Table 1 26Kirgis Table 1 27McCathern Table 3 50Mickelson (2001) Table 1 28Mickelson (2008) Table 1 29Muller et al. (forthcoming 2010) Table 1 30Muller et al. (2004) Table 1 31Mumane et al. Table 3 51Newton Table 1 32Page et al. Table 1 33Palardy Table 4 57Payne & Biddle Table 4 58Pong Table 1 34Portes & Hao Table 1 35Ready & Silander Table 1 36Roscigno Table 1 37Roscigno et al. Table 1 38Rumberger & Palardy Table 3 52Rumberger & Willms Table 1 39Ryabov & Van Hook Table 1 40Schiff et al. Table 1 41Sorhaindo Table 4 59Southworth Table 1 42Tevis Table 1 43Welcher Table 1 44
1053

NORTH CAROLINA LAW REVIEW
Table 1. Articles with Statisticall Significant Race Effects
Data Sample Size & SampleAuthor & Title Ta Data Source Tpe Demo-
Type Typegraphics
N.C. End-of-Grade tests
David J. Armor & ("EOG"), S.C. Population ofStephanie Duck, The Palmetto students in N.C.Effect of Black Peers on Achievement and S.C. grades 3
1 Black Test Scores (Sept. Longitu- Challenge tests to 8 Black and12, 2007) (unpublished dinal, at ("PACT"), - N.C. sample White, atmanuscript, on file with 11. Early Childhood 500,000 students 14.the North Carolina Law Longitudinal - S.C. sampleReview) (cited in Survey 230,000 students,Petitioners Reply Brief). ("ECLS") data. at 11.
1997-2005, at10.
David J. Armor &Shanea H. Watkins, 8th gradeSchool Composition and Latino/a studentsHispanic Achievement in Arizona,(Feb. 10,2007) California, Black,(unpublished manuscript, dinal,t 2003 NAEP at Clifori, White. andon file with the North 28. Mexico, New Latino/a,Carolina Law Review) York, and Texas. at 30:(presented at the ApproximatelySociology of EducationAssociation conference in 30,000, at 30.
Asilomar, Cal.).
1054 [Vol. 88

2010] EDUCATION & MATH OUTCOMES 1055
Analytic Outcome Variable Key Control Variables FindingsStrategy Categories
Ordinaryleastsquares("OLS"),fixed % Black students, % free lunch, Race,effects, N.C. BOG and S.C. parent education, years in same elementary,two-stage PACT,school, % highly qualified and middleleast teachers, % certified teachers, and school.squares pupils per teacher, at 29-30.with twice-lagged testscores, at24-25.
Fixed % free lunch, % Latino/a, student Race,effect Math or reading background characteristics, school elementary,
2 characteristics, and peermodels, at achievement, at 32. characteristics, at 29-30. and middle30. school.

NORTH CAROLINA LAW REVIEW
Data Sample Size & Sample# Author & Title Ta Data Source Tpe Demo-Type Type graphics
Databasecontainingreading and
Valentina A. Bali & R. math test scores, Population ofMichael Alvarez, The background, and students whoMichal Alarez Theschool
Race Gap in Student Longitu- information for were in 4th grade Black,Achievement Scores: di tu ent in 2002 in the White, andLongitudinal Evidence dinal, at students PUSD: 1,221 Latino/a,from a Racially Diverse 393. attending the students in 22 at 397.School District, 32 POL'Y Pasadena elementarySTUD. J. 393 (2004). Unified School schools, at 397.
District("PUSD"), 1999through 2002, at396.
Carl Bankston III &Stephen J. Caldas, 1990 test scoresMajority African on the Louisiana 42,041 Black andAmerican Schools and Cross on t on 4204 Black and Black and
4 Social Injustice: The sectional, Examination 10th graders, at White, atInfluence of De Facto at 541. Eminat 1 397.Segregation on Academic ("GEE"), at 541.Achievement, 75 Soc.FORCES 535 (1996).
1) NationalLongitudinalStudy of theHigh School
Mark Berends & Roberto Class of 1972
V. Pefialoza, Increasing ("NLS:72"). National random-
Racial Isolation and Test 2) High School stratified sample;and Beyond 1972:14,469 Black,
Score Gaps in Longitu- senior cohort of students; 1982: White, andMathemtics: A1 30-Yer d1982 26,000 students; Latino/a.Perspective, 112 TCHRS. ("HS&B:82"). 1992: 25,000 8th2010). 3) National grade students.
Education
LongitudinalStudy seniorcohort of 1992("NELS:92").
1056 [Vol. 88

2010] EDUCATION & MATH OUTCOMES 1057
# Analytic Outcome Variable Key Control Variables FindingsStrategy Categories
Hierarch- NCE reading and Individual and family variables,ical linear math test scores and school variables (including % Race,
3 modeling levels of high school Latinos/as in school, % Blacks in elementary("HLM"), math courses schools, and % minority teachers in school.at 400. completed, at 400. school), at 400-03.
Three components of School-level data (% Black, schoolthe GEE taken by means of individual level variable
Multilevel 10th graders 1990: and individual-level data s) Race and4 regression, math, English (demographic information and SES, high
at 543-44. language arts, and school.written composition, measures of behavioral patterns andat 541-42. habits), at 542-43.
Oaxaca Student mathematics Individual, family, and school5 decompo- achievement predictor variables (minority Race and
sition, between 1972 and composition, race-ethnicity, and SES, high
2004. .regressions. school).

1058 NORTH CAROLINA LAW REVIEW [Vol. 88
Author & Title DData ata Source Sample Size & SampleType Type Democ
graphicsNational random-
stratified sample1) NS:72 of high school
Mark Berends, Samuel R. 1) NLS:72 seniors 1972:Lucas & Roberto V. 2) HS&B:82 senior s 7Pefialoza, How Changes 3) NELS:92 14,469 students inin Families and Schools Longitu- 4) Educational 875 schools; 198 Black and
6 Are Related to Trends in dinal, at Longitudinal 905 schools; 1992: White, at
Black-White Test Scores, 318. Study senior 11,661 students in 318.81 Soc. EDUC. 313 cohort of 2004 1,245 schools;(2008). ("ELS:2004"), 2004: 12,267
at 318. students in 740schools, at 333-35.
MARK BERENDS ET AL., National random-RAND CORP., EXAMINING Longitu- 1) NLS:72 stratified sample Black,GAPS IN MATHEMATICS dinal, at 2) HS&B:82 of high school White, andACHIEVEMENT AMONG 33-35. 3) NELS:92, at seniors, 14,469 Latino/a,RACIAL-ETHNIC GROUPS, 33-35. students in 875 at 33-35.1972-1992 (2005). schools, at 34.
Kathryn M. Borman etal., Accountability in a Florida Schools FloaPostdesegregation Era: Indicators population of 2.3million studentsThe Continuing Cross Report and the in 1,547 Black and
8 Significance of Racial sectional, School Advisory elementary White, atSegregation in Florida's ationalCouncil Report els, 53 aShos41M.EU. at 617. schools, 513p615Schools, 41 Am. EDUC. for the academic middle schools,RES. J. 605 (2004) (cited year 1999-2000, and schighin Briefs of AERA and at 615. and 368 highPetitioners Reply). schools, at 615.
Shelly Brown-Jeffy, Nationalrandom- Black,School Effects: Cross High school National ram- Black,Examining the Race Gap sectional, effectiveness st ents White,in Mathematics at 392- study ("HSES"), of 3,392 students Latino/a,Achievement, 13 J. AFR. 93. at 392. in at 393.AM. STUD. 388 (2009). 1
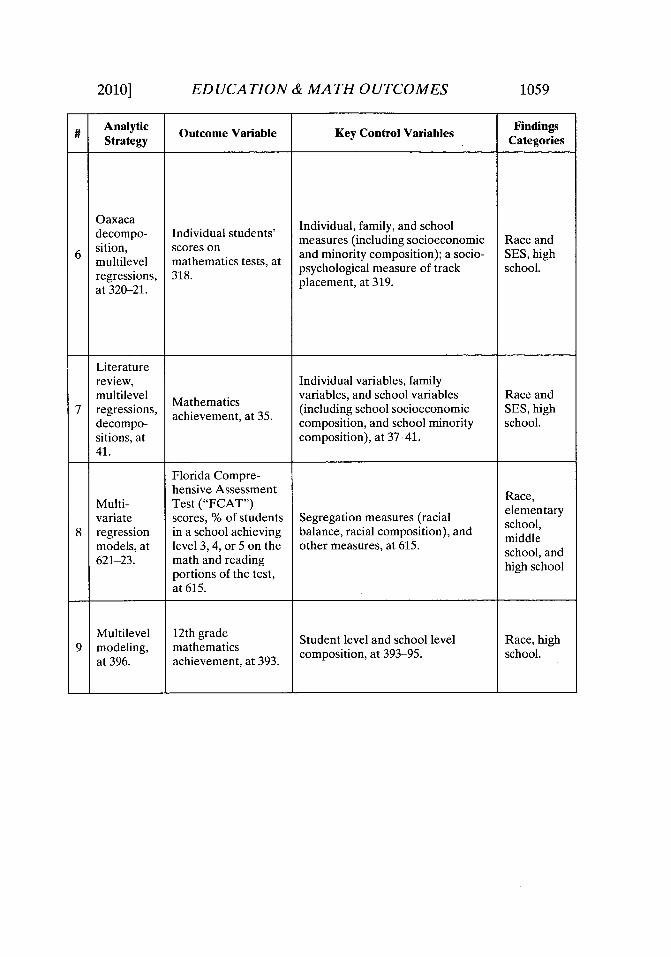
ED UCA TION & MATH 0 UTCOMES
Analytic Outcome Variable Key Control Variables FindingsStrategy Categories
Oaxaca
decompo- Individual students' Individual, family, and schoolmeasures (including socioeconomic Race and
6 sition, scores on and minority composition); a socio- SES, highmultilevel 318. psychological measure of track school.regressions, 318. placement, at 319.at 320-21.
Literaturereview, Individual variables, familymultilevel Mathematics variables, and school variables Race and
7 regressions, achievement, at 35. (including school socioeconomic SES, highdecompo- composition, and school minority school.sitions, at composition), at 37-41.41.
Florida Compre-hensive Assessment Race,
Multi- Test ("FCAT") elementaryvariate scores, % of students Segregation measures (racial school,
8 regression in a school achieving balance, racial composition), and middlemodels, at level 3, 4, or 5 on the other measures, at 615. school, and621-23. math and reading
portions of the test, high schoolat 615.
Multilevel 12th grade Student level and school level Race, high9 modeling, mathematics
at 396. achievement, at 393. composition, at 39395. school.
2010] 1059

NORTH CAROLINA LAW REVIEW
Data Sample Size & SampleAuthor & Title TData Source Demo-Type Type graphics
AddHealth andthe Adolescent 1,683 first- and
Rebecca Callahan et al., Health and second- Black,ESL Placement and Cross Academic generation White,
1 Schools: Effects on cos Achievement immigrant White,0 Immigrant Achievement, sectional, Study students in the 26 atin,
23 EDUC. POL'Y 355371. ("AHAA") for schools offering and Asian,(2009). the 1994-1995 ESL courses, at at 365.
school year, at 363-64.362.
Dennis J. Condron, Early ChildhoodSocial Class, School and LongitudinalNon-School Logitud National random-1Environments, and Longitu- Study-staiid ape Black and
1Black/White Inequalities dinal, at Kindergarten stratified sample White, atin Children's Learning, 689. Cohort ("ECLS- (n=3,442K") 1998 1st students), at 690. 690.74 AM. Soc. REV. 683 graders, at 689.(2009).
Elizabeth Covay,Composition Matters:The RelationshipBetween Race andSchool Composition in Education National random-Explaining the Black- Longitudinal stratified sample,EpWhitehp(ep Blac- Longitu- Study ("ELS") approximately Black and1 White Gap (Sept. 2008) dinal, at 2002 10th 11,330 students White, at
2 (unpublished manuscript, 14. graders and (2,190 Black and 32.on file with the North 2004 12th 9,140 White), atCarolina Law Review) graders, at 14. 32.(presented at theAmerican SociologicalAssociation AnnualMeeting, Boston, Mass.).
NationalRobert Crosnoe, The Longitudinal National random-Diverse Experiences Of Longitu- Study of stratified sample
1 Hispanic Students in the Adolescent of 2,602 Latino/a,3 American Educational dinal, at Health Latinos/as in 69 at 567.
System, 20 Soc. FORCES 567. ("AddHealth"), high schools, at561 (2005). mid 1990s 567.
sample, at 567.
1060 [Vol. 88

ED UCA TION & MATH 0 UTCOMES
Analytic Outcome Variable Key Control Variables FindingsStrategy Categories
Math and scienceenrollment, overall ESL course placement, AH-PVT
Propensity college preparatory (English Vocabulary Test),0 score course enrollment, proportion Filipino in school, and Race, high0 matching, junior-year GPA, school.
at 369. and cumulative proportion Cuban in school, among
course failures, at many others, at 368-69.
373.
HLM and Gains in skills in Student variables, various non- Race and
reeLS student's reading and school factors, and various school SES,1 models,sinat math skills (IRT factors (including level of elementary
691. scale scores), at 692. integration of school), at 693. school
Highest math courseas of his/her senioryear of high school Race, school composition (racialLogistic (trigmr pl composition, etc.), control variables
2 Logistic (trigonometry, pre- (math skills, grade level, student's Race, high2 regression, calculus, or calculus), effort), and student background school.
OLS, at 17. and math gains from efotadsuntbcgud shol2 , 10h ad 1th gas f variables (gender, family structure,(math IRT scores), and family SES), at 32.
at 32.
Membership in the Student level variables, schoolMultiple four student profiles characteristics (mean parentregression, (four category education, % Latino/a students, andcluster cluster solution) % Latino/a teachers), and academic Race and
3 analysis (k- based on their grades press (mean academic achievement, SES, highmeans in in math, science, mean educational aspirations, % school.STATA), English, and social students taking math and science,at 571. studies for the past and % students going on to
I year, at 573. college), at 578.
20101 1061
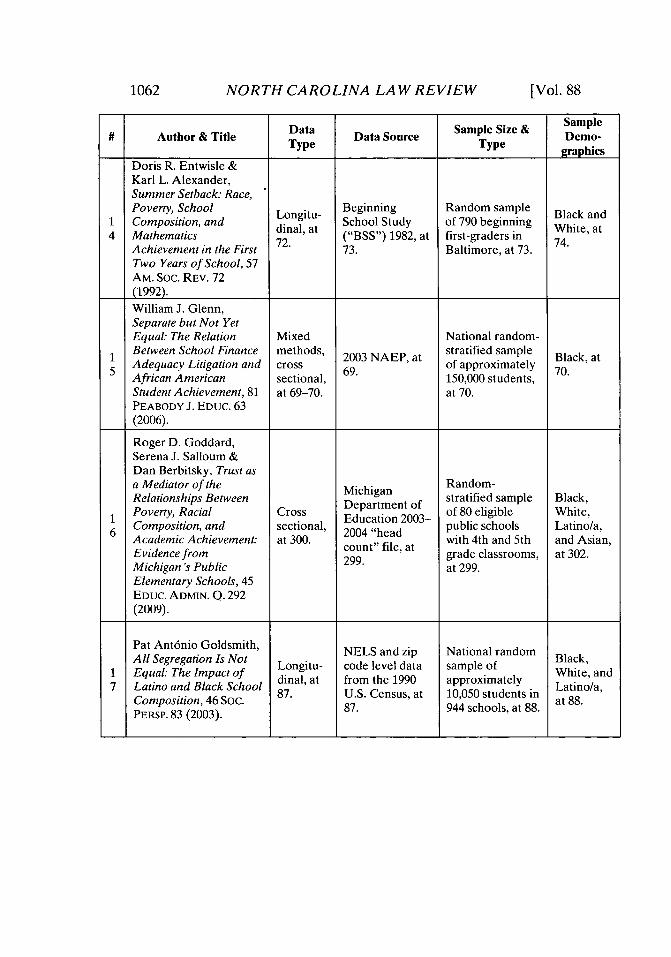
NORTH CAROLINA LAW REVIEW
DataSampe Sie & Sample# Author & Title Data Data Source Sample Size & Demo-
Type Type graphicsDoris R. Entwisle &Karl L. Alexander,Summer Setback: Race,Poverty, School Longitu- Beginning Random sample Black and
1 Composition, and dinal at School Study of 790 beginning White, at4 Mathematics 72. ("BSS") 1982, at first-graders in
Achievement in the First 73. Baltimore, at 73.Two Years of School, 57AM. Soc. REV. 72(1992).William J. Glenn,Separate but Not YetEqual: The Relation Mixed National random-Between School Finance methods, 2003 NAEP, a stratified sample Black, atAdequacy Litigation and cross 69 of approximately 70.
5 69. ly 70.African American sectional, 150,000 students,Student Achievement, 81 at 69-70. at 70.PEABODY J. EDUC. 63(2006).
Roger D. Goddard,Serena J. Salloum &Dan Berbitsky, Trust asa Mediator of the Michigan Random-Relationships Between Department of stratified sample Black,Poverty, Racial Cross Education 2003- of 80 eligible White,
6 Composition, and sectional, 2004 "head public schools Latino/a,Academic Achievement: at 300. with 4th and 5th and Asian,Evidence from 299. grade classrooms, at 302.Michigan's Public at 299.Elementary Schools, 45EDUC. ADMIN. Q. 292(2009).
Pat Ant6nio Goldsmith, NELS and zip National random Black,All Segregation Is Not Longitu- code level data sample of White, and
1 Equal: The Impact of dinal, at from the 1990 approximately7 Latino and Black School dinas, at from ttely i Latino/a,Copoiio, 6So. 87. U.S. Census, at 10,050 students in
Composition, 46 SOC. 87. 944 schools, at 88. at 88.PERSP. 83 (2003).
1062 [Vol. 88

2010] ED UCA TION & MATH 0 UTCOMES 1063
Analytic Outcome Variable Key Control Variables FindingsStrategy Categories
Descrip-tiveitic, Score on thestatistics, mathematics subtest Student/school type (racial/mix), Race andmulti- of the California economic standing, parent SES,
4 variate Achievement Test configuration, and family elementaryanalysis of ("CAT") for grades educational level, at 79. school.variance, 1, 2, and 3, at 79.
at 77.
HLM, Race and
cross 4th grade math and Student, family, teacher, school (% SES,1 sectional 8th grade math, at minority, % free reduced lunch, elementary5 analysis, at 69-70. etc.), and legal variables, at 69-70. school,
69. middleschool.
Proportion of Faculty trust (114-item scale),
Path students passing the school SES, school racial Race and5th grade composition, geographic location, SES,
6 293.analys mathematics and size, and school level achievement, elementary29. readings aogohrt30.school.
assessments, at 302. among others, at 302.
Test performance Nativity and language background;(IRT-estimated % Latino/a, Black, and other non- Race,
1 Multilevel number right White; race, ethnicity, gender; middlemodeling, covering four subject neighborhood variables; school- m idlat 88. areas: reading, math, level peer effects; school quality; school, high
science, history), at family background; prior88-89. achievement; and region, at 90-91.

1064 NORTH CAROLINA LAW REVIEW [Vol. 88
t SSample# Author & Title Data Data Source Sample Size & Demo-
Type Type graphics
Eric A. Hanushek &Margaret E. Raymond,Does School
Accountability Lead to Panel Random- Black and8 Improved Student data, at NAEP, at 10. stratified, at 10- White, at
Performance? (Nat'l 10. 11. 10.
Bureau of Econ.Research, WorkingPaper No. 10591, 2004).
Eric A. Hanushek &Steven G. Rivkin, Texas-wide Over 200,000Harming the Best: How student and Texas public Black,Schools Affect the Panel school elementary and White, and9 Black-White Pat scao middle school Latino/a,Achievement Gap (Nat'l data, at 7. indicators from students in over atino3aBureau of Econ. 1994, 1995, and at 2-3.BrearchWorkn 1996, at 6-7. 3,000 publicResearch, Working schools, at 6-7.Paper No. 14211, 2008).
Eric A. Hanushek & Early ChildhoodSteven G. Rivkin,EalChdodSchool Qualiand tLongitudinal Random-School Quality and the Longitu- Survey stratified sample Black and2 Black-White dnla
SAchievement Gap (Nat'l at ("ECLS") and of approximately White, atBureau of Econ. 3. the Texas 640,000 Texas 10.Research, Working Schools Project students, at 18.
Paper No. 12651, 2006). ("TSP"), at 3.
Eric A. Hanushek, JohnF. Kain & Steven G.Rivkin, New Evidenceabout Brown v. Board of Texas-wide Texas publicEducation: The student and elementary and
2 Complex Effects of Panel school middle school Black andSchool Racial students; 142,106 White, at
Composition on daa4t1. ni atr Blacks and 33-34.Achievement, 27 J. LAB. 1994, 1995, and 661,352 Whites,ECON. 349 (2009) (cited 1996, at 16. at 16.in Briefs of AERA, 553Social Scientists andArmor et al.).

ED UCA TION & MATH 0 UTCOMES
# Analytic Outcome Variable Key Control Variables Caegris
Race andPanel School racial and ethnic Se,
1 composition, racial and ethnic SES,withfxde Aheeetdalementary8 with fixed At 20. composition across the schools in eschool,
effects, at each state (state fixed effects), at middle
12-19. 21-23. school.
Fixed Race,1 effect Math achievement, Teacher experience, school % elementary9 models, at at 21. Black, class size, and % Latino/a school,
13. students, at 20. middleschool.
Fixed Student scores in Race,2 efec mah o Teas Student, family, teacher and peer elementary
2 effect math on Texas factors, and school factors
0 multiple Assessment of (including racial composition, % school,regress- Academic Skills eligible for a subsidized lunch), at 6. middleions, at 10. ("TAAS"), at 7. school.
Race,2 Panel TAAS Mathematics, Student, family, school and peer elementary
Pdae a t factors to explain achievement, at school,1 data, at 1. at 17. 2.mdl
28. middleschool.
2010] 1065
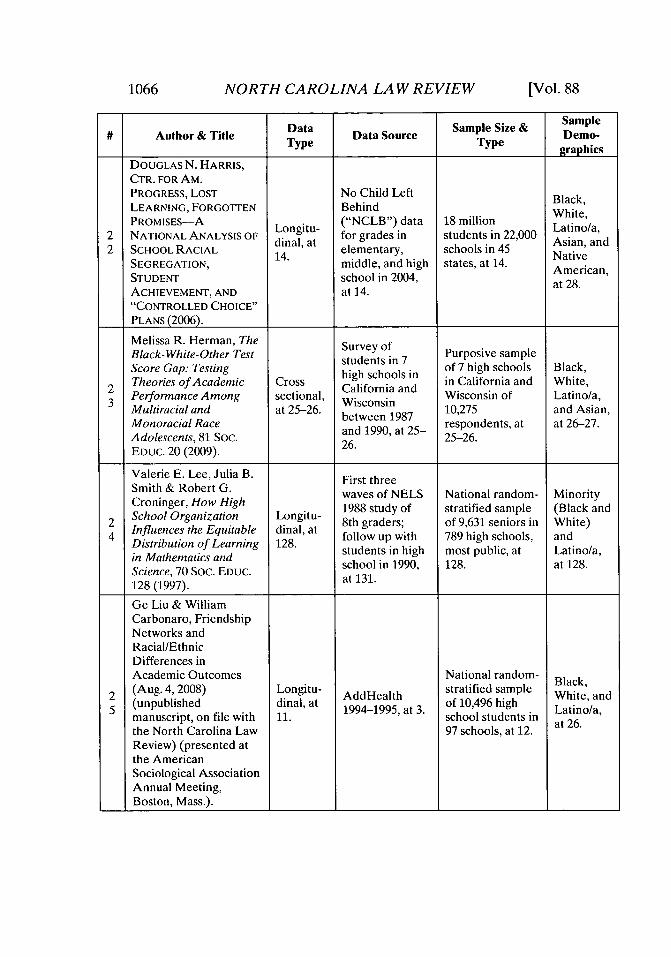
1066 NORTH CAROLINA LAW REVIEW [Vol. 88
DataSampe Sie & Sample# Author & Title Data Data Source Sample Size & Demo-
Type Type graphicsDOUGLAS N. HARRIS,CTR. FOR AM.PROGRESS, LOST No Child Left Black,LEARNING, FORGOTTEN BehindPROMISES-A Longitu- ("NCLB") data 18 million White,
2 NATIONAL ANALYSIS OF dingit for grades in students in 22,000 Latino/a,2 SCHOOL RACIAL 14. elementary, schools in 45 Native
SEGREGATION, middle, and high states, at 14. American,STUDENT school in 2004, at 28.ACHIEVEMENT, AND at 14."CONTROLLED CHOICE"
PLANS (2006).
Melissa R. Herman, The Survey ofBlack-White-Other Test students in 7 Purposive sampleScore Gap: Testing high schools in of 7 high schools Black,
2 Theories of Academic Cross California and in California and White,3 Performance Among sectional, WisconsinWisconsin of Latino/a,
Multiracial and at 25-26. between 1987 10,275 and Asian,Monoracial Race respondents, at at 26-27.Adolescents, 81 SOC. and 1990, at 25- 25-26.EDUC. 20 (2009).
Valerie E. Lee, Julia B. First threeSmith & Robert G. waves of NELS National random- MinorityCroninger, How High 1988 study of stratified sample (Black and
2 School Organization Longitu- 8th graders; of 9,631 seniors in White)4 Influences the Equitable dinal, at follow up with 789 high schools, and
Distribution of Learning 128. students in high most public, at Latino/a,in Mathematics and suet nhg otpbia aioaSincate tc d Sschool in 1990, 128. at 128.Science, 70 SOC. EDUC.at1 .128 (1997). at 131.
Ge Liu & WilliamCarbonaro, FriendshipNetworks andRacial/EthnicDifferences inAcademic Outcomes National random-st r a i fi d s a p l e B la c k ,(Aug. 4, 2008) Longitu- AddHealth stratified sample White, and
5 (unpublished dinal, at 1994-1995, at 3. of 10,496 high Latino/a,manuscript, on file with 11. school students in at 26.the North Carolina Law 97 schools, at 12.Review) (presented atthe AmericanSociological AssociationAnnual Meeting,Boston, Mass.).

ED UCA TION & MATH 0 UTCOMES
Analytic Outcome Variable Key Control Variables FindingsStrategy Categories
Simula-tions and Race andmulti- SES,
2 variate Math score gains Previous test scores, school % elementary2 regress- from 7th-12th grade, migrant, school status, and multiple school,
ions with at 22. student-level factors, at 29-30. middlefixed school, higheffects, at school.20.
AchievementAuto- (student-reported Peer group, school context (% White
2 regressive grades: average of 4 students), family context, and Race, highchange student-reported neighborhood context (racial and SES school.models, at grades in social studies, composition), at 31-36.31. English, math, and
science), at 27-29.
Two parameters ofgrowth in science Student controls, school controls
2 HLM at and math (including composition), structural Race and
4 131 32. performance: early practices, thirty practices, and social SES, high(8th-10th grade) and and academic organization, at 133- school.late (10th-12th 34.grade), at 132.
2002 PeabodyVocabulary Test Racial heterogeneity and averagescore percentile GPA of students' friendshiprank; cumulative network, variables of friendship
2 HLM, at GPA of math network attributes (size, age, race, Race, high5 13. courses; cumulative grades), 1994-1995 score percentile school.
GPA of science rank, individual educationalcourses; and college expectations, course-taking, andattendance in 2001- parental involvement, at 18-20.2002, at 25.
2010] 1067
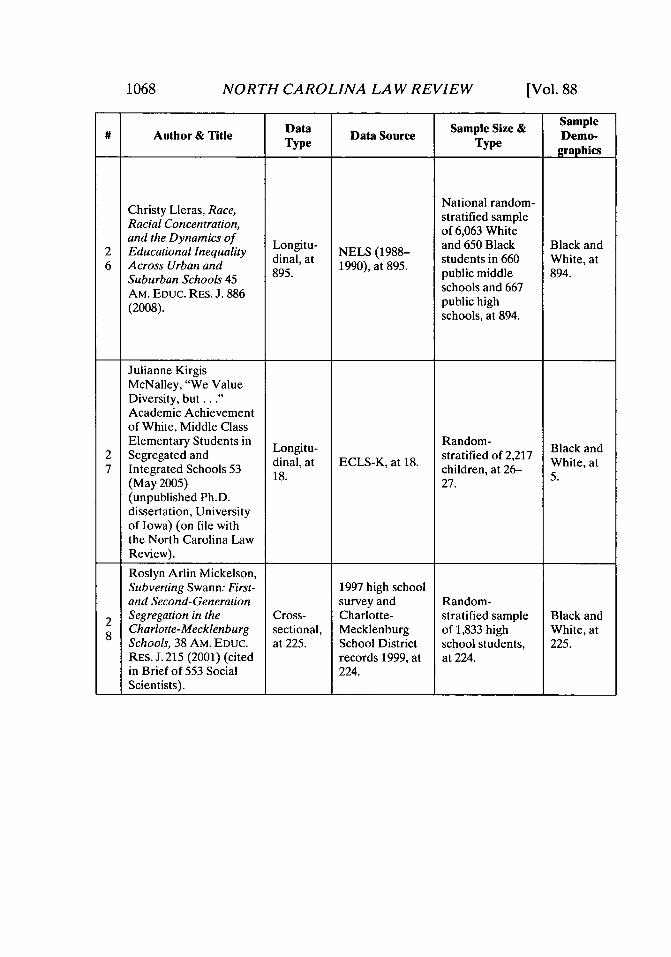
NORTH CAROLINA LAW REVIEW
DataSampe Sie & Sample# Author & Title TpeSample Size & ampDemo-
Type aType graphics
Christy Lleras, Race, National random-
Racial Concentration, stratified sample
and the Dynamics of of 6,063 White2 Educational Inequality Longitu- NELS (1988- and 650 Black Black and6 Across Urban and dinal, at 1990), at 895. students in 660 White, at
Suburban Schools 45 895. public middle 894.Am. EDuC. RES. J. 886 schools and 667(2008). public high
schools, at 894.
Julianne KirgisMcNalley, "We ValueDiversity, but..."Academic Achievementof White, Middle ClassElementary Students in Longitu- Random- Black and
2 Segregated and Longit stratified of 2,217 Black a7 Integrated Schools 53 18. children, at 26- 5.
(May 2005) 27.(unpublished Ph.D.dissertation, Universityof Iowa) (on file withthe North Carolina LawReview).
Roslyn Arlin Mickelson,Subverting Swann: First- 1997 high schooland Second-Generation survey and Random-
2 Segregation in the Cross- Charlotte- stratified sample Black and8 Charlotte-Mecklenburg sectional, Mecklenburg of 1,833 high White, at
Schools, 38 AM. EDUC. at 225. School District school students, 225.RES. J. 215 (2001) (cited records 1999, at at 224.in Brief of 553 Social 224.Scientists). I I _I _II
1068 [Vol. 88

ED UCA TION & MATH 0 UTCOMES
Analytic Outcome Variable Key Control Variables Findings# Strategy Categories
School level (including % receivingfree or reduced price lunch, % Race andAcademic B
2 HLM, at engagement, math Black), race, 8th grade math test SES,
6 898. test scores: 8th and score, and 10th grade student middle
10th grade, at 897. engagement and math course school, highsequence in the first two years of school.high school, at 905.
Two direct cognitive % minority students in the school,assessments in % free and/or reduced lunch Race and
2 OLS reading and in math eligible students; students fall SES,7 regression, (score obtained by kindergarten achievement scores elementaryadministering for math and reading (prior school.
atutinreading),(prior23. achievement), and gender, at 22-23.
Weighted GPA, end- Race, gender, cultural capital,of-course tests, sixth effort, college-bound peer group,
Multilevel grade CAT score track placement, prior achievement,2 (composite attitudes toward education, Race, high8 atd225., measures), concrete attitudes toward school.Scholastics education, exposure to segregated
Assessment Test, at elementary education, magnet, and225. % gifted in high school, at 226-27.
2010] 1069
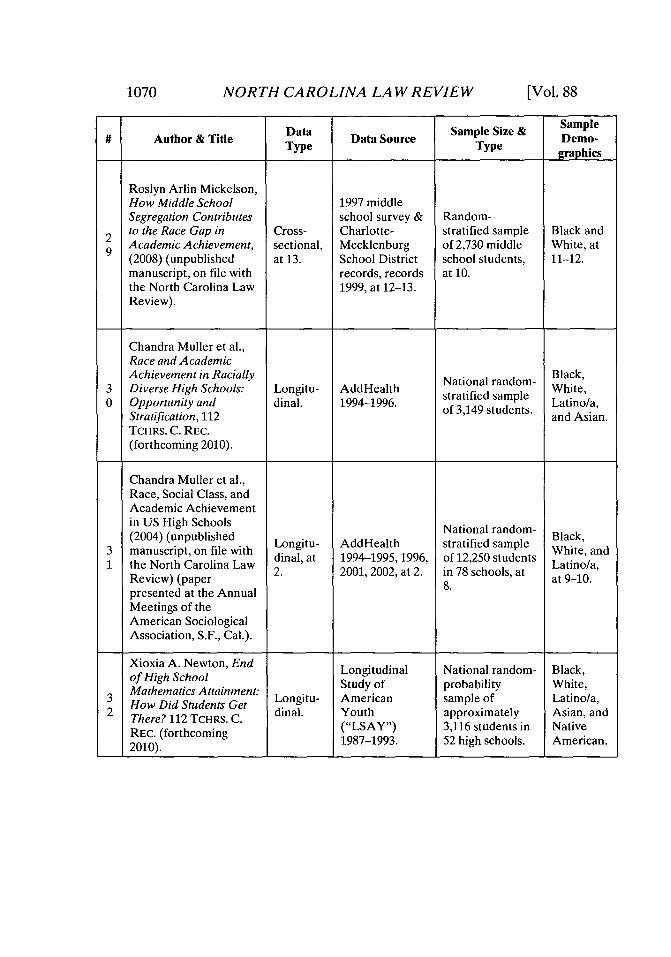
1070 NORTH CAROLINA LAW REVIEW [Vol. 88
DataSampe Sie & Sample# Author & Title Data Data Source Sample Size & Demo-
Type Type graphics
Roslyn Arlin Mickelson,How Middle School 1997 middleSegregation Contributes school survey & Random-to the Race Gap in Cross- Charlotte- stratified sample Black and
2 Academic Achievement, sectional, Mecklenburg of 2,730 middle White, at(2008) (unpublished at 13. School District school students, 11-12.manuscript, on file with records, records at 10.the North Carolina Law 1999, at 12-13.Review).
Chandra Muller et al.,Race and AcademicAchievement in Racially National random- Black,
3 Diverse High Schools: Longitu- AddHealth stratified sample White,0 Opportunity and dinal. 1994-1996. ofied sude Latino/a,
Stratification, 112 of 3,149 students. and Asian.TCHRS. C. REC.(forthcoming 2010).
Chandra Muller et al.,Race, Social Class, andAcademic Achievementin US High Schools National random-(2004) (unpublished Longitu- AddHealth stratified sample Black,3 mauscipt on ilewit Logitu Ad~eath tratfie saple White, and
Smanuscript, on file with dinal, at 1994-1995, 1996, of 12,250 students L and1 the North Carolina Law 2. 2001, 2002, at 2. in 78 schools, at Latino/a,
Review) (paper 8. at 9-10.presented at the AnnualMeetings of theAmerican SociologicalAssociation, S.F., Cal.).
Xioxia A. Newton, End Longitudinal National random- Black,Mathematics Attainment: Study of probability White,
3 How Did Students Get Longitu- American sample of Latino/a,2 There? 112 TCHRS C. dinal. Youth approximately Asian, and
There? 112 TC C.("LSAY") 3,116 students in NativeREC. (forthcoming 1987-1993. 52 high schools. American.2010). 1_____ 1____1___1

ED UCA TION & MATH 0 UTCOMES
Analytic Outcome Variable Key Control Variables FindingsStrategy Categories
Race, gender, cultural capital, effort,
Multilevel 8th grade end-of- track placement, prior achievement, Race and2 modeling, grade tests in math attitudes toward education, exposure SES, middle
modeling, ade resin, ath 3 to segregated elementary education, school.at 12. and reading, at 13. and middle school % minority school.
concentration, at 17.
School level (10th grade mathcourse, school location, minority
GPA (for all 12th under-representation in advanced3 HLM. grade classes) and math, % taking advanced math as Race, high0 attending a four year 10th graders, and region), and school.
college, individual level (gender, parentaleducation, AddHealth vocabularytest score, and 9th grade GPA).
School level variables (% minority,Threeme s o SES measures (% college educatedacademic
achievement (highest parents, and % free lunch), and % Race and3 minority in advanced classes) and SES, middle
HLM, at 9. math class, highest student level variables (race, gender, school, highand parental education, and 9th school.
diploma attainment), grade academic performance), at 9-at 9-10. 10.
Growth in math fromgrades 7-12, end of Race,
3 high school math Student level (including prior math, middle2 HLM. attainment, and mother's education) and school level school, high
number and levels of (including % minority), school.high school mathcourses completed.
2010] 1071

NORTH CAROLINA LAW REVIEW
DataSampe Sie & Sample# Author & Title Data Data Source Sample Size & Demo-
Type Type graphicsLindsay C. Page,Richard J. Murnane &JohnB. Wllet, TrndsNationalJohn B. Willett, Trends Assessment of Three-stage Black,in the Black-White Educational sampling of 13 White,Achievement Gap: Longitu- Progress Long year old students. Latino/a,
3 Clarifying the Meaning 25,545 in 1971; and3 of Within and Between dinal, at Term Trend 4,001 in 1988; Asian,
School Achievement 24-5 19 4,090 in 1999; andGaps (Nat'l Bureau of L004 1978- 4,720 in 2004, at merican,Econ. Research, 2004 (for math), 24-25. at 26.Working Paper No. at 3.14213, 2008).
Suet-ling Pong, The National random-Suet-l Copoong Thprobability Black,
3 Scof Sil a Cross sample of 654 White,Parenthood on 1th- sectional, schools and Latino/a,4 aethodeon 1at 32. 10,399 10th grade and Asian,Grade Achievement, 71 at3.suest27 at229Soc. EDUC. 23 (1998). students, at 27- at 28-29.
28.
Alejandro Portes & Purposive sampleLingxin Hao, The of 5,266 childrenSchooling of Children Children of of immigrants in Black,and Immigrants: Longitu- Immigrants the school system White,
3 Contextual Effects on the dingit Longitudinal of Miami and Ft. Latino/a,5 Educational Attainment dinal, at Study ("CILS") Lauderdale in atin,
of the Second 1992-1993, at Florida and SanGeneration, 101 PROC. 11,920. Diego, at 11,924.
NAT'L ACAD. SC. California, atU.S.A. 11,920 (2004). 11,923.
1072 (Vol. 88
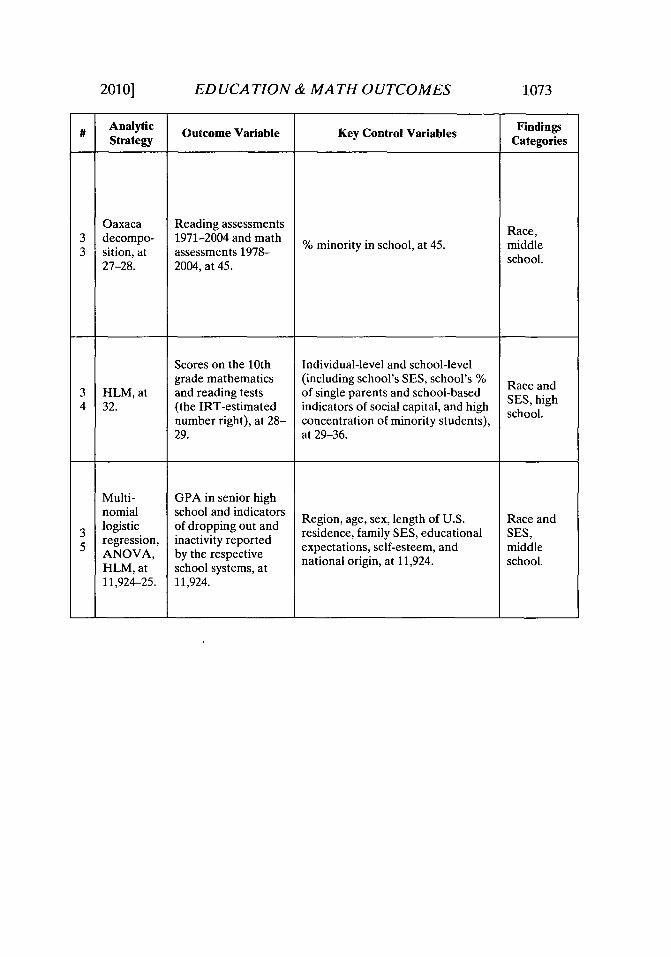
2010] ED UCA TION & MATH 0 UTCOMES 1073
# Analytic Outcome Varable Key Control Varables FindingsStrategy Categories
Oaxaca Reading assessments3 decompo- 1971-2004 and math Race,
3 sition, at assessments 1978- % minority in school, at 45. middle
27-28. 2004, at 45. school.
Scores on the 10th Individual-level and school-levelgrade mathematics (including school's SES, school's %
3 HLM, at and reading tests of single parents and school-based Se and
4 32. (the IRT-estimated indicators of social capital, and high SES, high
number right), at 28- concentration of minority students), school.
29. at 29-36.
Multi- GPA in senior highnomial school and indicators Rlogit scoof dropinto Region, age, sex, length of U.S. Race and
3 logistic of dropping out and residence, family SES, educational SES,A regression, inactivity reported expectations, self-esteem, and middleANOVA, by the respective national origin, at 11,924. school.HLM, at school systems, at11,924-25. 11,924.

1074 NORTH CAROLINA LAW REVIEW [Vol. 88
Data Sample Size & SampleAuthor& Title TData Source Demo-Type Type gahc
graphics
Douglas Ready &Megan Silander,Estimating the Influenceof School Racial andSocioeconomicComposition on StudentLearning:Methodological National random-Challenges and stratified sampleAlternative Solutions straif idre Black,3 (Ar ,20)Longitu- of 9,186 children, Wie n
S(Apr. 2,2009) dinal, at ECLS-K, at 9. nested within 659 White, and6 (unpublished 7. public and non- minority,
manuscript, on file with public schools, at at 25.the North Carolina Law 25.Review) (presented atLooking to the Future:Legal and PolicyOptions for RaciallyIntegrated Education inthe South and theNation, Chapel Hill,N.C.).
Vincent J. Roscigno, First follow-up
Race and the Cross of NELS (1990) National random-3 and district data stratified sample Black andSReproduction of sectional, in the Common of 11,058 students White, at
7 isEdatal, at 1.42- Core of Data in 971 schools, at 1037.Disadvantage, 76 Soc. 43.CD) t 07
FORCES 1033 (1998). ("CCD"), at 1037.1036.
Vincent J. Roscigno, NELS 1988,Donald Tomaskovic- 1990 and 1992BDevey & Martha Longitu- and the CCD National random Black and
8 Crowley, Education and dinal, at 1986-87through sample, at 2125. 21.atthe Inequalities of Place, 2125. 1991-92t , at2136.84 Soc. FORCES 2122 2125.(2006). 11 25.

2010] ED UCA TION & MATH 0 UTCOMES 1075
Analytic Outcome Variable Key Control Variables FindingsStrategy Categories
Child's characteristics (SES status, Race and
3 FILM, at Math assessment, at gender, age, and language) and SES,6 9M 2. Mschool characteristics (school elementary6 9. 25. eeetr
average SES, racial composition, school.location, class sizes, etc.), at 25.
Family income, parental education,a measure of cultural capital, familystructure and number of siblings, Race and
3 HLM, at Reading and math teacher expectations, track SES, high7 1043. test scores, at 1040. placement, student/teacher ratio, school.
per pupil spending, school racialcomposition and school SEScomposition, at 1040.
Multilevel Math, reading Family characteristics, investment,3 mdligievel, t and school characteristics (resources, % Race and
8 at 2129 dropout status, at receiving free lunch, % non-White, SES, high30. 2126. per pupil expenditure), and controls school.
by race and gender, at 2128.

NORTH CAROLINA LAW REVIEW
Data Sample Size & SampleAuthor & Title TData Source Demo-Type Type graphics
California BasicEducational
Russell W. Rumberger Data System& J. Douglas Willms, ("CBEDS")The Impact of Racial 1988-1989 and Sample of Black,3 and Ethnic Segregation Cross California grade students in White,
on the Achievement Gap sectional, Assessment the six largest Latino/a,in California High at 392. Program ts in argestSchools, 14 EDUC. ("CAP") California, at 380. at 380.EVALUATION & POL'Y AchievementANALYSIS 377 (1992). tests in grades 3,
6, 8, and 12, at380.
Igor Ryabov & JenniferVan Hook, School4 Segregation and Cross 1995 Sample of 4,066
4 Seregtio an Crss 995Latinos/as from Latino/a,Academic Achievement sectional, AddHealth, at 132 schools, at at 772.Among Hispanic at 772. 772. 772.Children, 36 Soc. Sci.RES. 767 (2007).
Jorden Schiff, WilliamFirestone & JohnYoung, OrganizationalContext for StudentAchievement: The Caseof Student RacialCompositions (April National random-
4 1999) (unpublished Cross stratified sample Black and1 manuscript, on file with sectional, NELS: 88, at 8. of 17,598 students White, at
the North Carolina Law at 8. within 1,000 9.Review) (presented at schools, at 9.the annual conferenceof the AmericanEducational ResearchAssociation inMontreal, Quebec,Canada).
1076 [Vol. 88

ED UCA TION & MATH 0 UTCOMES
Analytic Outcome Variable Key Control Variables FindingsStrategy Categories
Student achievement
Multilevel (standardized Student level variables and school3 modeling, measures of the CAP level variables (including Race, high9 at 382. scores on reading segregation measures (dissimilarity school.
and CAP scores on index and isolation index)), at 380.
mathematics), at 380.
Academic School composition (including % Race andachievement is Latino/a and Black students, ethnic Seameasured by GPA SES,4 HLM, at and AddHealth origin, immigration generation middle
0picture vocabulary status, individual level controls, school, hightest ("AHPVT") SES, and family structure) and school.score, at 772. family social capital, at 772-76.
Student achievementin math (40-itemtest) and in reading
4 ANOVA, (21-item test), self- Student SES and school racial Race,4 ANOVA, concept (composite StudenttSES an school middle
at 13. of the self-concept composition, at 11-13. school.
items that appearedon the studentsurvey), at 13.
2010] 1077

NORTH CAROLINA LAW REVIEW
Sample# Author & Title Data Data Source Sample Size & Demo-
Type Type graphics
Stephanie Southworth,The Effects ofInstitutionalCharacteristics of North Carolina Black,Schools on North statewide data Population of White,Carolina Elementary Panel provided by 56,176 Latino/a,
4 and Middle School data, at North Carolina elementary and Asian, and2 Student Achievement data, Educational middle school
(2008) (unpublished Research students in North American,Ph.D. dissertation, Center, 1999- Carolina, at 63. at 62-63.University of North 2005, at 62.Carolina at Charlotte)(on file with NorthCarolina Law Review).
Tenisha L. Tevis,African-AmericanStudents' CollegeTransition Trajectory:An Examination of the Black,Effect of High School National White,Composition and Longitu- Education National random- Latino/a,
4 Expectations on Degree dil at Longitudinal stratified sample Asian, and3 Attainment (Dec. 2007) 15. Study ("NELS of 18.209 Native
(unpublished Ph.D. 88/2000"), at 36. students, at 38. American,dissertation, at 49.Pennsylvania State at 49.University) (on file withPenn State ElectronicThesis and DissertationCollection).Adrian N. Welcher,Head of the Class:Black/White Inequality,Cultural and SocialCapital, and HighSchool Math EducationAchievement (Jan. 17, Longitudinal National random- and
4 2008) (unpublished dinalat Study ("ELS: stratified sample White, at4 manuscript, on file with 15. 2002-2004"), of 4,592 students, 14.
the North Carolina Law Restricted Data, at 15.Review) (presented at at 14.the Annual Meeting ofthe AmericanSociological AssociationAnnual Meeting,Boston, Mass., 2008).
1078 [Vol. 88

2010] ED UCA TION & MATH 0 UTCOMES 1079
Analytic Outcome Variable FindingsStrategy OKey Control Variables Categories
Students' yearly School race composition and SES Race andachievement in 4th, composition, student/teacher ratios, SES,
4 HLM, at 6th, and 8th grade, teacher characteristics, per pupil elementary2 64. (math and reading)measures by their expenditures, race/gender cohorts, school,ed-o-Grae scresand socioeconomic status, among middleEnd-of-Grade scores, others, at 55. school.at 55.
Regress-ion and Degree attainment of Race, gender, SES, school
4 structural students (math composition (race/ethnicity and free Re and3 equation grade), at 44. or reduced lunch), and student's ES, highmodeling, grade in previous test score, at 45.at 44.
Cultural capital, social capitalvariables, quality of parent-child
Math achievement in relationship, gender, family Race and4 OLS, at 12th grade (IRT compositional variables, and school SES, high
scores), at 23. level variables (including % enrolled school.
in free/reduced lunch, and %minority), at 25.

1080 NORTH CAROLINA LAW REVIEW [Vol. 88
Table 2. Articles with No Statistically Significant Race Effects
DaaSample Size DemomplAuthor & Title Data Data Source Type Demo-Auto eType Tgraphics
David J. Armor &Shanea J. Watkins,School Segregation andBlack Achievement: NewEvidence from the 2003 NationalNAEP, in THE Cross random- Black and
4 BENEFITS OF RACIAL Sectional, 2003 NAEP, at stratified sample White, atBEEISO5AIA etoa,30.AND ETHNIC DIVERSITY at 30. of 150,000 28.IN ELEMENTARY AND students, at 30.SECONDARY
EDUCATION 28 (U.S.Comm'n on CivilRights, ed. 2006).
Mary A. Burke & Tim School Randomly
R. Sass, Classroom Peer administrative selected samples
Effects and Student Panel records from ofln Black,4 Achievement (Fed. data, at Florida, 1999- elementary, 100 White, and
Reserve Bank of 15. 2000 through high schools in at 39.
Boston, Working Paper 2003-2004, at Florida, at 15-
No. 08-5, 2008). 15. 18.rida, at 15-I 1 118.
Table 3. Articles with No Statistically Significant Race Effects but withStatistically Significant SES Effets
DaaSample Size & Demo-l# Author & Title Data Data Source Type Demo-Auto eType Tgraphics
James Benson &Geoffrey Borman,Family, Neighborhood, Nationaland School Settings National Center random- Black,Across Seasons: When for Education stratified sample White,Do Socioeconomic of 4,178 students Latino/a,4 Cotx n ail Longitu- StatisticsLanoa
7 Contextin Raial dinal. ("NCES") attending one of Asian, andComposition Matter for 292 schools, and Aiveathe Reading ECLS-K, l of Native
teRaigCensus 2000. living in one of American.Achievement Growth of 699Young Children?, 112 neighborhoods.TCHRS. C. REC.(forthcoming 2010).
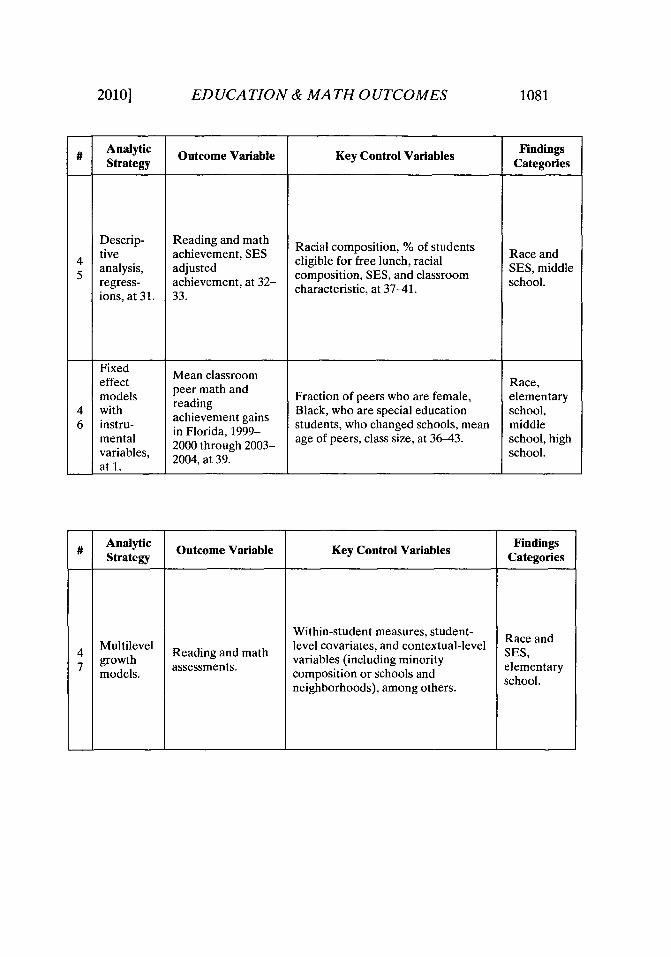
ED UCA TION & MATH 0 UTCOMES
Analytic Findings# Anatic Outcome Variable Key Control Variables Categories
Strategy Ctgre
Descrip- Reading and math Racial composition, % of studentstive achievement, SES Race and
5 analysis, adjusted eligible for free lunch, racial SES, middleregress- achievement, at 32- c position, SES, and classroom school.ions, at 31. 33. characteristic, at 37-41.
FixedFeec Mean classroomeffect peer math and Race,
models peaan d Fraction of peers who are female, elementary4 with achievement gains Black, who are special education school,6 instru- ievementd a n students, who changed schools, mean middlemental in Florida, 1999-
2000 through 2003- age of peers, class size, at 36-43. school, highvariables, 2004, at 39. school.at 1.
Analytic Outcome Variable Key Control Variables FindingsStrategy Categories
Within-student measures, student- Race andMultilevel Readilevel covariates, and contextual-level SES,
7 growth R e nth variables (including minority elementarymodels. assessments. composition or schools and school.
neighborhoods), among others.
2010] 1081

1082 NORTH CAROLINA LAW REVIEW [Vol. 88
DataSampe Sie & Sample# Author & Title Data Data Source Sample Size & Demo-
Type Typegraphics
JOHN E. CHUBB & 1983-1984 National
TERRY M. MOE, Cross Administrators random sample Black and4 TRYMMOCos and Teachers ofWita4 POLITICS, MARKETS & sectional, Surve of White, at8 AMERICA'S SCHOOLS at 24. Survey ("ATS") approximately 266.
(1990). and HS&B data, 9,000 students,at 22. at 72.
1990 HighValerie E. Lee, Julia B. SchoolSmith & Robert G. TranscriptsCroninger, Course- Study, NationalTaking, Equity, and conducted in random-
4 Mathematics Learning: Cross connection with stratified sample Black, at9 Testing the Constrained sectional, the 1990 of 3,056 high 115.
Curriculum Hypothesis at 103. National school graduatesin U.S. Secondary Assessment of in 123 schools,Schools, 19 EDUC. Educational at 103.EVALUATION & POL'Y ProgressANALYSIS 99 (1997). ("NAEP"), at
103.
Daniel AddisonMcCathern, Jr., TheRelationship BetweenPreK-5 and K-5 MetropolitanElementary School Size Achievement South Carolinaand Student Test ("MAT7") population ofAchievement of Grade Test ("mthe PreK-5 and K-5 Black and
5 5 Students on the MAT7 cos & public school White, at0 in South Carolina for sectional, S.C. students in 334 15.
the School Years 1996- aDepatment of schools in 199797 and 1997-98 (2004) Education,1996- and 348 schools(unpublished Ph.D. 1998, at 1-2. in 1998, at 1.dissertation, Universityof South Carolina) (onfile with the NorthCarolina Law Review).

ED UCA TION & MATH 0 UTCOMES
Analytic Outcome Variable Key Control Variables FindingsStrategy Categories
Student ability, family background,Linear Student achievement background of student body-peer
4 regression in reading, writing, group influence (average family Race, high8 models, at wriung, SES, % of students who are Black), school.
125. vocabulary, math school resources, and schooland science), at 115. organization, at 174, 266.
Student's score on Student demographics, academic
4 HLM, at the 1990 NAEP basic ability, and school factors (including Race and
9 99. mathematics school average SES, minority SES, high
assessment, at 111. concentration), among others, at school.
Mean scales scores School size, grade structure, pupil-of 5th grade students teacher ratio, % of students on theon the 1997 and 1998 free and reduced lunch program, Race and
Stepwise spring amount of teacher experience, level SES,0 OLS, at administrations of of teacher education, gender, racial elementary
86, 111. the MAT7 (student composition of the school (% of school.achievement in Blacks students among the numberreading, and math), of tested), school operating costs,at 97. and community setting, at 2.
2010] 1083

NORTH CAROLINA LAW REVIEW
Sample# Author & Title Data Data Source Sample Size & Demo-
Type TypegraphicsPhases I, II, andIII of the
Richard J. Murnane et Nationalal., Understanding Institute ofTrends in the Black- Child Health National Black,White Achievement Cross and Human random- White,
5 Gaps During the First sectional, Development conditional and1 Years of School, in at 115- Study of Early s
BROOKINGS-WHARTON 17. Child Care and fample of 1,364 Latino/a,PAPERS ON URBAN. Youth families, at 100. at 101.AFFAIRS 2006, at 97 Development(2006). ("NICHD
SEECYD"), at100.
Russell W. Rumberger National& Gregory J. Palardy, random-Does Segregation Still stratified sample Black
5 Matter? The Impact of Longitu- NELS 1988, at of 14,217 and2 Student Composition on dinal, at 2008. students who White, at
Academic Achievement 1999. attended 913 2008-09.in High School, 107 hg colaTCHRS. C. REC. 1999 high schools, at(2005). 1999.
Table 4. Articles Exclusively About SES and with Statistically
Significant SES Effects
DataSampe Sie & Sample# Author & Title Data Data Source Sample Size & Demo-
Type TypegraphicsStephen J. Caldas &Carl Bankston III, 42,041 LouisianaEffect of School Cross 10th grade Black
5 Population sectional. Louisiana GEE public high and3 Socioeconomic Status on ational,1989, at 271. pch White, at
Individual Academic at 272. so suet 272.Achievement, 90 J. in 1989, at 271.EDUC. RES. 269 (1997).
1084 [Vol. 88

ED UCA TION & MATH 0 UTCOMES
Analytic Outcome Variable Key Control Variables FindingsStrategy Categories
Fixed Race, ethnicity, and gender
effect Math and English indications, personal characteristics
models, ELA scores and family background, school Race andrandom (kindergarten/54 quality (including student body SES,
Seffects months, first grade, composition (25% or more students elementarythird grade), at 105- are Black, Latino/a), % students school.
115. 08. eligible for free lunch), and115. instructional time, at 105-08.
1) 1988, 1990, and1992 standardizedachievement test in Various aspects of individual,math, science, family, and school characteristics Race and
5 HLM, at reading, and social (including race composition, SES, highscience; structure, resources, and processes), school.
2) composite scores at 2009.for the four tests ineach year, at 2009.
Analytic Outcome Variable Key Control Variables FindingsStrategy Categories
Student achievementon the GEE Family poverty status, family social
OLS (principal status, school-level measures of SES5 regression, component of the (peer poverty and peer family social SES, high3 at 272. raw mathematics, status), and individual-level control school.
language arts, and variables (% student population
written composition Black), at 271.scores), at 271. 1 1
20101 1085

1086 NORTH CAROLINA LAW REVIEW [Vol. 88
# Author & Title Data Data Source Sample Size & Demo-Typegraphics
Thomas B. Hoffer,Middle School Ability NationalGrouping and Student Panel LSAY from fall random- Black,
5 Achievement in Science Pa 1987 to fall 1989, stratified sample Latino/a,4 and Mathematics, 14 211. NAEP 1989, at of 1,900
EDUC. EVALUATION & 211. 211. at 213.POL'Y ANALYSIS 205 students, at 211.
(1992).
KIRK A. JOHNSON, THE RandomHERITAGE CTR. FOR stratified BlackDATA ANALYSIS, Cross NAEP 1996 4th and 8th
5 COMPARING MATH sectional, math survey, at grade students Black, at5 SCORES OF BLACK at 4. 4. in Washington, 8-9.
STUDENTS IN D.C.'s DC public andPUBLIC AND CATHOLIC CatholicSCHOOLS (1999). schools, at 7.
Valerie E. Lee & JulieB. Smith, Effects of National Black,School Restructuring on Cross NELS 1988, at random sample White, andthe Achievement and sectional, of 8,845 students6 169.Latino/a,Engagement of Middle- at 169. in 377 schools, at 169-70.Grade Students, 66 SoC. at 164.EDUC. 164 (1993).
Gregory J. Palardy,Differential SchoolEffects Among Low, National Black,Middle, and High Social random- White,Class Composition Longitu NELS 1988, at stratified sample Latino/a,
7 Schools: A Multiple dinal, at N2L of 5,326 public Asian, andGroup, Multilevel Latent 22. school student NativeGrowth Curve Analysis, nested in 344 American,19 SCH. EFFECTIVENESS schools, at 25. at 33.& SCH. IMPROVEMENT21 (2008).
School DistrictKevin J. Payne & Bruce Data BookJ. Biddle, Poor School ("SDDB") Black,Funding, Child Poverty, Cross available from Sample of White,
8 and Mathematics sectional, the National school districts, Latino/a,Achievement, EDUC. at 6-7. Center for at 7. and Asian,RESEARCHER, Aug.- Education at 9-10.Sept. 1999, at 4. Statistics (1995),
at 6.

2010] ED UCA TION & MATH 0 UTCOMES 1087
Analytic Outcome Variable Key Control Variables FindingsStrategy Categories
Propensity Composite score or Ability grouping, number of abilityscores, performance in levels in each subject that the schoollagged different domains defined, background variables, and SES,
5 regression, tapped by the school-context measures (amount of middle4 ordered NAEP-derived scolcnetmaus(mutof idepr d LSAY tests (in both course work in subject, social school.probit comtet (nboh position, and size of school), atequations, science and math), at comat 212. 212-13.
Public or Catholic school, mother's SES,Multi- education, family status, number of eS,
5 variate reading materials in home, school elementary5 vrae Math score, at 12. school,5 models, at median income, and whether the middle
14-15. child changed schools in the last two school.years, at 14-15.
FLM Academic Students' demographic and5 achievement structural characteristics of schools SES,
5 descriptive (combining reading (average SES, minority middle6 analysis, at and math scores), at concentration, etc.), school school.
172. restructuring, at 172.
Students' Students' backgrounds, school and
Multilevel achievement growth classroom level variables (includingor learning rate on a compositional characteristics of the SES,
5 growth reading,core: student body, the structural middle7 curve, math, characteristics of the school, and the school.
27. science, and history, human and financial resourcesover a four-year available), at 35.period, at 35.
Multi- Mathematics School funding, child poverty in the SES,5 district, % non-White, level of middlevariate, achievement, at 9- curriculum in the classroom mdl8 regression, 10. (rmi t ceat22.mschool.at 10-11. (remedial to advanced), at 22.

1088
DaaSmleSz1 Sample# Author & Title Data Data Source Sample Size & Demo-
Aut e Type Te graphicsLinda Ruth WilliamsSorhaindo, TheRelationship BetweenDegrees of Poverty andStudent Achievement(May 2003)(unpublisheddissertation, Universityof Miami) (on file withthe North Carolina LawReview).
Crosssectional,at 17.
Miami-DadeCounty PublicSchools, 1997-1998, at 17.
4,500 4thgraders and4,500 8th gradestudents for the1997-1998school year inMiami-DadeCounty PublicSchools, at 17.
NORTH CAROLINA LAW REVIEW [Vol. 88
Black,White, andLatino/a,at 18-19.

Analytic Outcome Variable Key Control Variables FindingsStrategy I I Categories
Academicachievement(StanfordAchievement Testreadingcomprehension andmathematicsapplications), at 22.
Student level, measure of poverty,school level variable of schoolcomposition (three levels of levelsof poverty: high, medium, and low),at 26-27.
2010] ED UCA TION & MATH 0 UTCOMES 1089
HLM,MANO-VA,ANOVA,at 22.
SES,elementaryschool,middleschool.

1090 NORTH CAROLINA LAW REVIEW [Vol. 88