Embed Size (px)
Citation preview

Gen 2011 (v1.1) Release NoteIntegrated Design System for Building and General Structures

Enhancements
1. Addition of Header and Footer in Dynamic Report
2. Midas Link for Revit Structure 2011
3. Plate Member Data in the Model Data Text Output
and much more…
Pre/Post Processing
Analysis
New module
1. Pushover analysis enhancement
1) Lateral load pattern as per N2 method
2) Target displacements as per NTC 2008
3) Safety Verification as per NTC 2008
4) Enhanced Safety verification Table
2. Damping Ratios by Material Properties
3. Considering Consistent Mass in Time History Analysis
and much more…
1. General Section Designer
16
3
22
Design
1. Enhancement in Strong Column-Weak Beam Design as per TWN-USD92
41

1. General Section Designer
New Module

Gen 2011 New module (GSD)
4 /43
Gen 2011 (v1.1) Release Note
General Section Check or GSD is a new module added to midas Civil/Gen.
Scope of GSD: Definition of any irregular cross-section
Calculation of Section properties
Generation of P-M, P-My-Mz, M-M interaction curves
Calculation of Section Capacity (in flexure) and Safety Ratio based on member forces.
Generation of Moment-Curvature curve.
Plot of Stress contours for all the cross-sections.
All the above features are supported for: RC sections, Steel sections and Composite sections.
1. General Section Designer (GSD)
Stress ContourWork process
Moment- Curvature3D PM Interaction curve

Gen 2011 New module (GSD)
5 /43
Gen 2011 (v1.1) Release Note
User Interface
• GSD can be called from midas Gen by Tools > General Section Designer.
• In one model file, more than one section can be created and saved under different names.
• All the sections are listed in the Works Tree.
• Double click the section name in the Works Tree to show the section in the section view .
Toolbar
Coordinates
Main menu Works Tree
Message Window Unit ControlTable Window
Section View

Gen 2011 New module (GSD)
6 /43
Gen 2011 (v1.1) Release Note
Work Process
Step 1. Define material
• Materials : RC, Steel.
• Applied Codes: Eurocode, UNI, British Standard, ASTM, Indian Standard, etc.
• Nonlinear material properties can also be assigned to concrete, structural steel and rebar
materials.

Gen 2011 New module (GSD)
7 /43
Gen 2011 (v1.1) Release Note
Work Process
Step 1. Define material
• Nonlinear Material Properties
Kent & Park ModelParabolic Stress-strain Curve
• Concrete nonlinear properties
• Steel nonlinear properties
Menegotto-Pinto Model Asymmetrical Bi-linear Curve

Gen 2011 New module (GSD)
8 /43
Gen 2011 (v1.1) Release Note
Work Process
Step 2. Define cross-section
– Basic shape section by selecting a section from the DB of the standard sections for a
country
– Any irregular cross-section by specifying the shape in the Section View or entering
coordinates into a table
General type shape
Model > Shape > Basic Shape

Gen 2011 New module (GSD)
9 /43
Gen 2011 (v1.1) Release Note
Work Process
Step 2. Define cross-section
– Merging two shapes
– Creating hollow sections
Copy Shapes
Creating Hollow Section
Merged Shapes
Model > Shape > Merge Shape

Gen 2011 New module (GSD)
10 /43
Gen 2011 (v1.1) Release Note
Work Process
Step 3.1 Select Rebar Material
• The following stress-strain curves can be assigned to rebars.
– Elastic-Only
– Bilinear Model
– Menegotto-Pinto Model
– Park Strain Hardening
Menegotto-Pinto ModelPark Strain Hardening
Model > Rebar > Rebar Material
Bilinear Model

Gen 2011 New module (GSD)
11 /43
Gen 2011 (v1.1) Release Note
Work Process
Step 3.2 Add Rebars: Various patterns are available for assigning the rebars to a section.
– Point pattern : Add rebar at a single point.
– Line Pattern : Add rebars in a line.
– Arc Pattern : Add rebars in a circular arc patterns.
– Rectangular Pattern : Add rebars in a rectangular pattern.
– Perimeter pattern : Add rebars around the outer perimeter of the section by
specifying the concrete cover and number of rebars.
Model > Rebar > Rebar-Point Pattern…

Gen 2011 New module (GSD)
12 /43
Gen 2011 (v1.1) Release Note
Work Process
Step 4. Define Load Combinations and member forces
Sign Convention:
• Clockwise moment about the y and z axes are taken as positive. Anti-clockwise moments
are taken as negative. P is taken as positive towards ‘+z’ axis.
Step 5. Cross-section Properties:
• Apart from general section properties, Principal Properties, Section Modulus & Plastic
properties are also calculated.
Model > Define Load Combination
Model > Section Property

Gen 2011 New module (GSD)
13 /43
Gen 2011 (v1.1) Release Note
Work Process
Step 6.1 Check Results: Interaction Curves
Result > Interaction curve
P-M interaction curve for a specified angle
P-M interaction curve for a Load Combination

Gen 2011 New module (GSD)
14 /43
Gen 2011 (v1.1) Release Note
Work Process
Step 6.1 Check Results: Interaction Curves
Result > Interaction curve
M-M interaction curve for a Load combination
3 D interaction surface showing all the load combination

Gen 2011 New module (GSD)
15 /43
Gen 2011 (v1.1) Release Note
Work Process
Step 6.2 Check Results: Moment-curvature curve
Step 6.3 Check Result: Stress Contour
Result > Moment Curvature Curve
Moment-curvature curve
Stress contours
Move mouse pointer onthe curve to see thestrain diagram at aparticular point.
Result > Stress Contour

1. Addition of Header and Footer in Dynamic Report
2. Midas Link for Revit Structure 2011
3. Plate Member Data in the Model Data Text Output
4. Easy access to the Time History Result Tables
5. Warning Message for the Changes in the Story Data
List of Detailed Enhancements in Pre & Post Processing

Gen 2011 Pre & Post-processing Gen 2011 (v1.1) Release Note
17 /43
1. Fill out the Project Information in the File tab.
2. Open the Dynamic Report and double click Header and Footer in the Report Tree.
3. Select the items to add or remove in the header or footer field by clicking arrow buttons.
4. Use up and down arrows to arrange the order of header and footer items.
5. Click OK button to confirm.
1. Addition of Header and Footer in Dynamic Report
In the dynamic report, we can add the project Information in the header and footer of MS
Word. Project Information includes Project Name, Revision, User Name, E-mail, Address,
Telephone, Fax, Client, Title, File Name, Created, Directory, Modified, and File Size.
Procedure of Header and Footer Generation
Tools > Dynamic Report Generator

Gen 2011 Pre & Post-processing Gen 2011 (v1.1) Release Note
18 /43
1. Send the Revit Structure analytical model to midas Gen
2. Import the MGT file of the Revit model in midas Gen
3. Export the midas model file to the MGT file
4. Update the Revit Structure model from midas Gen
2. Midas Link for Revit Structure 2011
Midas Link for Revit Structure 2011 is now available to transfer a Revit model data to midas
Gen, and delivery back to Revit model files. It is provided as an Add-In module in Revit
Structure and midas Gen text file(*.mgt) is used for the roundtrip.
Midas Link for Revit Structure supports the following workflows
Tools > Dynamic Report Generator

Gen 2011 Pre & Post-processing Gen 2011 (v1.1) Release Note
19 /43
3. Plate Member Data in the Model Data Text Output
• Now ‘Plate Member Data’ can viewed in the Model Data Text Output.
File > Model Data Text Output > Plate Member Data

Gen 2011 Pre & Post-processing Gen 2011 (v1.1) Release Note
20 /43
5. Easy Access to the Time History Result Tables
• Time History Result Tables have been added to the Context Menu for improved
accessibility.
Context Menu > Time History Results > Inelastic Hinge Table / Time History Analysis Table
Disp./Vel./Accel. Table
Beam Force Table

Gen 2011 Pre & Post-processing Gen 2011 (v1.1) Release Note
21 /43
6. Warning Message for the Changes in the Story Data
• A warning message is displayed notifying that the number of stories being considered is
not in agreement with the generated data.
Model > Building > Story
• After Story Data generation
when a node is moved (the node where a story is assigned is edited)
when a story is added
when a story is divided
• The following message will be displayed when executing Perform Analysis

1. Pushover analysis enhancement
1) Lateral load pattern as per N2 method
2) Target displacements as per NTC 2008
3) Safety Verification as per NTC 2008
4) Enhanced Safety verification Table
2. Damping Ratios by Material Properties
3. Considering Consistent Mass in Time History Analysis
4. Improvement in Group Damping
5. Considering Static Load Case for the Initial Loading in
Time History Analysis
6. Considering the Construction Stage Load for Initial
Loading in Pushover Analysis
7. Option for cumulating reactions and displacements
due to initial loads in Pushover Analysis
8. Considering Boundary Change Assignment Function
in Pushover Analysis
9. Option for Considering the Shear Failure in Pushover
Analysis
10. Improvement in Pushover Hinge Properties with SRC
Sections
11. Addition of Ramberg-Osgood and Hardin-Drnevich
Models in Inelastic Hinge Property
List of Detailed Enhancements in Analysis

Gen 2011 Analysis
23 /43
Gen 2011 (v1.1) Release Note
• The N2 method implements a new load pattern Normalized Mode Shape * Mass for
Pushover analysis.
1. Pushover analysis enhancement
Design > Pushover Analysis > Pushover Load Case
1) Lateral load pattern as per N2 method

Gen 2011 Analysis
24 /43
Gen 2011 (v1.1) Release Note
• Eigenvalue analysis is performed to obtain the mode shape for pushover analysis on a
structure. In midas Gen, the mode shapes are normalized in such way that Φn=1, where n is
the user defined master node , generally at the roof level.
• Pushover analysis is complete when the displacement of the master node reaches the
specified maximum displacement. The lateral loads are applied at the centre of mass of each
storey and the lateral load pattern is obtained by the normalized Ф values of centre of mass.
• The mode shape values of a structure, at the center of mass, are specified in the table along
with the normalized values.
.87
.65
.54
.21
.74
.63
.24
1
Model Mode Shape Normalized Mode Shape
StoryMode Shape
ФNormalized Mode Shape Ф
Roof .87 1
3F .65 .74
2F .54 .63
1F .21 .24
Normalization of Mode Shape
User-Defined Master Node
Normalization of mode shape
1F
2F
3F
Roof

Gen 2011 Analysis
25 /43
Gen 2011 (v1.1) Release Note
Lateral Load Pattern
• In order to generate pushover curves, lateral load patterns are required. If floor
diaphragms are assigned, lateral loads are applied at the center of mass per story. If floor
diaphragms are not assigned, lateral loads are applied at the location of the masses in the
model automatically.
• The pushover load is applied up to the point when the displacement of master node
reaches the maximum displacement.
• The lateral load patterns are obtained by normalized mode shape and Story mass factor.
Model
m4 = 400
.74
.63
.24
1
Normalized Mode Shape
1
.55
.31
.06
Load Pattern
Story Story MassNormalized Mod
e Shape, ФCalculation Load Factor
Roof 400 1 (1X400)/(1X400) 1
3F 300 .74 (.74X300)/(1X400) .55
2F 200 .63 (.63X200)/(1X400) .31
1F 100 .24 (.24X100)/(1X400) .06
Lateral Load Pattern
m3 = 300
m2 = 200
m1 = 100 1F
2F
3F
Roof

Gen 2011 Analysis
26 /43
Gen 2011 (v1.1) Release Note
Gamma Calculation
• Transformation factor Gamma is calculated based on the following two methods:
o 2D Behavior (EC8-1:2004 Annex B)
o 3D Behavior
• 2D Behavior is based on EC8 -1 :2004 Annex B and determines the value of gamma by only
considering the direction in which pushover analysis is performed . Hence the value of
gamma is :
• 3D Behavior determines the gamma by considering lateral deflection in all the possible
directions :
Design > Pushover Analysis > Pushover Curve
Design > Pushover Analysis > Pushover Curve

Gen 2011 Analysis
27 /43
Gen 2011 (v1.1) Release Note
2) Target displacements as per NTC 2008
• Target displacements are defined as the seismic demand derived from the elastic response
spectrum in terms of the displacement of an equivalent SDOF system. Target displacements
for the limit states SLO, SLD, SLC and SLV are automatically calculated as per NTC2008.
Different spectrums can be assigned to different limit states for determining the demand.
Design > Pushover Analysis > Pushover Curve
Select spectrum for different limit states
Target displacements and corresponding pushover steps
Select spectrum for different limit states
Target displacements and corresponding pushover stepsMethod of Gamma Calculation
Select spectrum for different limit states
Target displacements and corresponding pushover steps
Select spectrum for different limit states
Target displacements and corresponding pushover stepsMethod of Gamma Calculation

Gen 2011 Analysis
28 /43
Gen 2011 (v1.1) Release Note
3) Safety Verification as per NTC 2008
• The interstory drift demands from pushover analysis should not exceed the corresponding
capacities. Global verification is performed for the limit states SLO and SLD.
• Interstory drift limit values are:
- SLD: 0.005h, SLO: 0.005h x 2/3, where h is the story height.
• The interstory drift demands are represented by target displacements for SLD and SLO. The
capacities for SLD and SLO are determined by the roof displacements when maximum
interstory drift is equal to its limit values, 0.005h and 0.005h x 2/3, respectively.
Design > Pushover Analysis > Pushover Curve
Global verification ( = Limitation of interstory drift)
Demand and capacity table

Gen 2011 Analysis
29 /43
Gen 2011 (v1.1) Release Note
The local ductility and deformation demands from pushover analysis should not exceed the
corresponding capacities which implies that brittle elements should remain in the elastic
region. Local verification is performed for the limit states SLD, SLV and SLC. The capacities are
determined as shown in the table below. The demand (rotation or shear force) for a member is
obtained from the pushover step which is nearest to the target displacement for the
corresponding limit states.
Demand and capacity table
Local verification
Design > Pushover Analysis > Pushover Hinge Result Table > Safety Verification Table

Gen 2011 Analysis
30 /43
Gen 2011 (v1.1) Release Note
4) Enhanced Safety verification Table
• Capacity values for different limit states can be viewed with user defined steps.
Design > Pushover Analysis > Pushover Hinge Result Table > Safety Verification Table
Capacity values

Gen 2011 Analysis
31 /43
Gen 2011 (v1.1) Release Note
2. Damping Ratios by Material Properties
• An option considering different damping ratios for different materials has been added in
the Material Data for time history analysis and response spectrum analysis.
• In order to apply the damping ratio specified in the Material Data, following damping
method needs to be selected in the Time History Load Cases.
Response Spectrum Analysis : Strain Energy Proportional
Time History Analysis: Element Mass & Stiffness Proportional or Strain Energy Damping
Model > Properties > Material > Add > Damping Ratio
Load > Time History Analysis Data > Time History Load Cases
Default value of damping ratio by material types
- Steel : 0.02 (2%)- Concrete / SRC : 0.05 (5%)- USER : 0.00 (0%)

Gen 2011 Analysis
32 /43
Gen 2011 (v1.1) Release Note
3. Considering Consistent Mass in Time History Analysis
• Now Consistent Mass and Off-diagonal Masses option of Lumped Mass can be
considered during the linear and nonlinear time history analysis. In the previous
versions, ‘Lumped Mass’ could be applied only when selecting the ‘Off-diagonal Masses’
option in the time history analysis.
• If the Consistent Mass or Off-diagonal Mass option is used, Lanczos method should be
used for Eigenvalue Analysis.
Model > Structure Type
Consistent Mass
Mass Offset (Off-diagonal Masses)

Gen 2011 Analysis
33 /43
Gen 2011 (v1.1) Release Note
4. Improvement in Group Damping
• Group Damping dialog box has been divided into ‘Element Mass & Stiffness
Proportional…’ and ‘Strain Energy Proportional…’.
• Now Mass Coefficient (alpha) can be considered. Coefficients for mass and stiffness
(alpha and beta) are automatically calculated.
Model > Properties > Group Damping : Element Mass & Stiffness Proportional
Model > Properties > Group Damping : Strain Energy Propotional
Element Mass & Stiffness Proportional
Strain Energy Proportional

Gen 2011 Analysis
34 /43
Gen 2011 (v1.1) Release Note
5. Considering Static Load Case for the Initial Loading in Time History Analysis
• Now Static Analysis Result ‘Import (ST)’ can be considered as an initial load.
• In the previous versions, the axial force due to ‘ST’ initial load was not reflected when
determining yielding of the hinge. In the new version, the axial force due to ‘ST’ initial load is
reflected when calculating the yield strength of moment component.
• When ‘Increment Method>Load Control’ is used, ‘Time History Load Cases>Scale Factor’ is now
reflected.
Load > Time History Analysis Data > Time History Load Cases

Gen 2011 Analysis
35 /43
Gen 2011 (v1.1) Release Note
6. Considering the Construction Stage Load for Initial Loading in Pushover Analysis
• Final stage member forces from construction stage analysis can be used as initial loads
for the pushover analysis.
Pushover Analysis > Pushover Analysis Control
Gen 2011 Analysis
36 /43
Gen 2011 (v1.1) Release Note
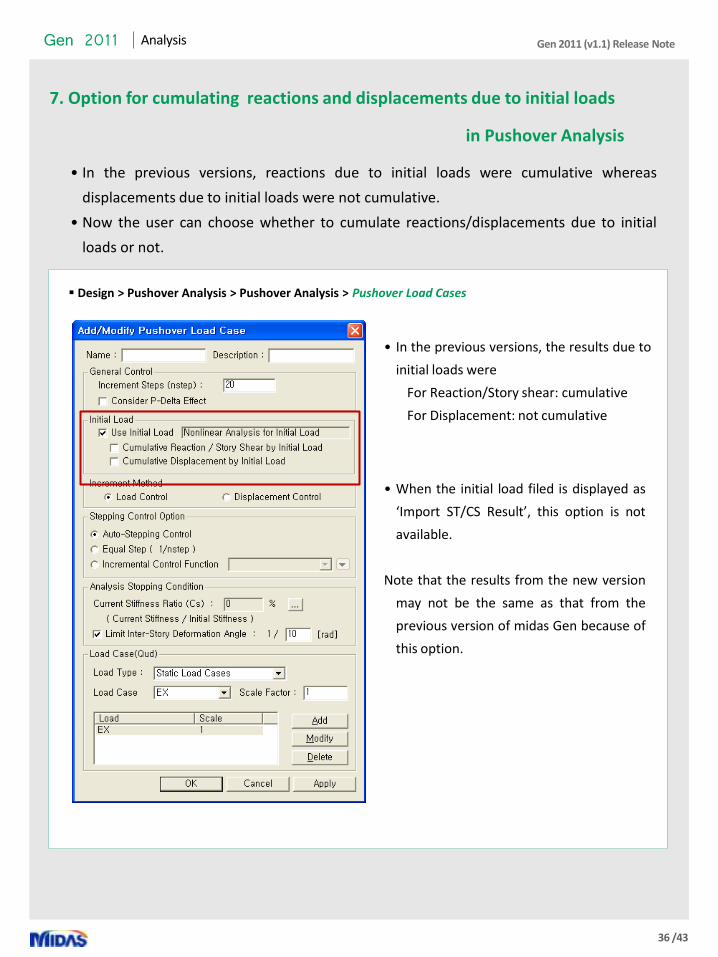
7. Option for cumulating reactions and displacements due to initial loads
in Pushover Analysis
• In the previous versions, reactions due to initial loads were cumulative whereas
displacements due to initial loads were not cumulative.
• Now the user can choose whether to cumulate reactions/displacements due to initial
loads or not.
Design > Pushover Analysis > Pushover Analysis > Pushover Load Cases
• When the initial load filed is displayed as
‘Import ST/CS Result’, this option is not
available.
Note that the results from the new version
may not be the same as that from the
previous version of midas Gen because of
this option.
• In the previous versions, the results due to
initial loads were
For Reaction/Story shear: cumulative
For Displacement: not cumulative

Gen 2011 Analysis
37 /43
Gen 2011 (v1.1) Release Note
8. Considering Boundary Change Assignment Function in Pushover Analysis
• This function can be applied to the following condition:
- When the boundary condition of the initial loading is different from that of the pushover loading
- When the section stiffness scale factor assigned for the initial loading is different from that of the
pushover loading
Analysis > Boundary Change Assignment to Load Cases/Analyses

Gen 2011 Analysis
38 /43
Gen 2011 (v1.1) Release Note
9. Option for Considering the Shear Failure in Pushover Analysis
• New option for considering the shear component failure has been newly added. When the
option is selected, the analysis will be automatically terminated if the shear hinge occurs in the
selected member type.
Design > Pushover Analysis > Pushover Global Control

Gen 2011 Analysis
39 /43
Gen 2011 (v1.1) Release Note
10. Improvement in Pushover Hinge Properties with SRC Sections
• Pushover hinge properties can be calculated automatically for the following SRC sections: Rect-
Cross I / Rect –Combined T / SRC-BOX-Stiffener / SRC-Pipe-Stiffener
Design > Pushover Analysis > Define Hinge Properties

Gen 2011 Analysis
40 /43
Gen 2011 (v1.1) Release Note
11. Addition of Ramberg-Osgood and Hardin-Drnevich Models in Inelastic Hinge Property
• Inelastic Hinge Properties can be defined with the Ramberg-Osgood and Hardin-
Drnevich models and applied for inelastic time history analysis for soil.
Model > Properties > Inelastic Hinge Properties
Ramberg-Osgood, Hardin-Drnevich Hysteresis Curve

1. Enhancement in Strong Column-Weak Beam Design as per TWN-USD92
List of Detailed Enhancements in Design

Gen 2011 Design
42 /43
Gen 2011 (v1.1) Release Note
1. Enhancement in Strong Column-Weak Beam Design as per TWN-USD92
• A new option for Strong Column-Weak Beam design has been added.
• In the previous version, beam design strength (ΦbMnb) calculated the design flexural
member force in column. In the new version, the design strength (ΦbMnb) or the
nominal strength (ΦbMnb) can be considered.
Design > RC Strong Column Weak Beam Design > Ductile Design
Design > RC Strong Column Weak Beam Design > Strong Column Weak Beam Ratio
Design > RC Strong Column Weak Beam Design > Strong Column Weak Beam Ratio Table

Gen 2011 Design
43 /43
Gen 2011 (v1.1) Release Note
Ductile Design
When Design Strength is selected When Nominal Strength is selected
Strong Column Weak Beam Ratio
Design > RC Strong Column Weak Beam Design > Ductile Design
Concrete Code Design > Beam Design, Column Design
Concrete Code Check > Beam Checking, Column Checking
Design > RC Strong Column Weak Beam Design > Strong Column Weak Beam Ratio
When Design Strength is selected When Nominal Strength is selected

![GSD COMPUTING...GSD-COMPUTING [MTCG1015] Term –1 AY: 2020-21 COMPUTING GSD COMPUTING WORKBOOK [PART 2] Military Technological College GSD-COMPUTING [MTCG1015]](https://img.dokumen.tips/doc/110x75/60afe3fea86c106f184a7c07/gsd-computing-gsd-computing-mtcg1015-term-a1-ay-2020-21-computing-gsd-computing.jpg)