Embed Size (px)
Citation preview

Intaver Institute Inc.
303, 6707, Elbow Drive S.W.,
Calgary AB Canada T2V 0E5
www.intaver.com
Quantitative Risk Analysis for Aerospace Industry

Common Issues with Space System Projects
• Multiple risks and uncertainties• Many uncertainties are event-driven• Historical data mining should include relevance analysis

Existing Methodologies
• PERT• Monte Carlo Simulation• Bayesian approach• Scenario analysis and Decision Trees
Project Example
Laser Interferometer Space Antenna (LISA) project
Calendar Year ==>
Project Phasing
NASA HQ Milestones
Mission Reviews
SE&I Contractor Acquisition
Technology
LISA Test Package (SM2)
ST7 DRS (SM2)
Interferometry MeasurementSystem
System Verification
Disturbance ReductionSystem
Payload
Spacecraft
Observatory I&T
Constellation Testing
Launch Campaign
Pre-Phase A Phase A Phase B Phase C/D
FAD ICR/CANAR ESA MOU (F)
PCA
FAD HQ
Briefing
MDR
SRR
SCR
TRR
PDR CDR
S/C1 PER
Obs 1 PER
MOR
ORR
PSR
MRR
FRR
LRR
Prep Phase Execution PhasePartnering Phase
RFI RFP D Sel RFP Sel
LISA DemoCDR Deliver to SM2 SM2 Launch
DRS Demo
PDR CDR Deliver to SM2 SM2 Launch
Trades Subs
Assy Test
TRL5 TRL6
Model Envr R1 Model Envr R2 Model Envr R3
Testbed DemosTrades
Tgt Std
Subs
Assy Test
GRS TRL5 GRS TRL6
Rqts/Architecture/Trades
Design Build / Test
PDR CDR EM 1 2 3
ESA Definition Phase
ITT Award ITT Award PDR CDR
ESA Implementation Phase
EM 1 2 3
Preps
Observatory I&T
EM 1 2 3
Preps1 2
Constellation Testing
3
Launch Preps
LRD
4 1 2 3 4 1 2 3 4 1 2 3 4 1 2 3 4 1 2 3 4 1 2 3 4 1 2 3 4 1 2 3 4 1 2 3 4 12002 2003 2004 2005 2006 2007 2008 2009 2010 2011 2012
The document is courtesy of NASA/Goddard Space Flight Center

Heuristics and Biases in Project Management
The Bank of Sweden Prize in Economic Sciences in Memory of Alfred Nobel 2002
Daniel Kahneman
Decision makers use “heuristics”, or general rules of thumb, to arrive at their judgments.
In certain instances, this will lead to systemic biases.

Examples of Heuristics in Project Management
• Representativeness – unwanted appeal to detailed scenarios
• Availability – access the probability of an event by the ease with which instances can be brought to mind
• Anchoring – human tendency is to remain close to the initial estimate

Event Chain Methodology
Event Chain Methodology is a method of modeling uncertainties for different time-related business and technological processes including project management for space systems.

Moment of Risk and State of Activity
An activity (task) in most real life processes is not a continuous uniform procedure. Tasks are affected by external events, which transform an activity from one state to another.
Event Chains
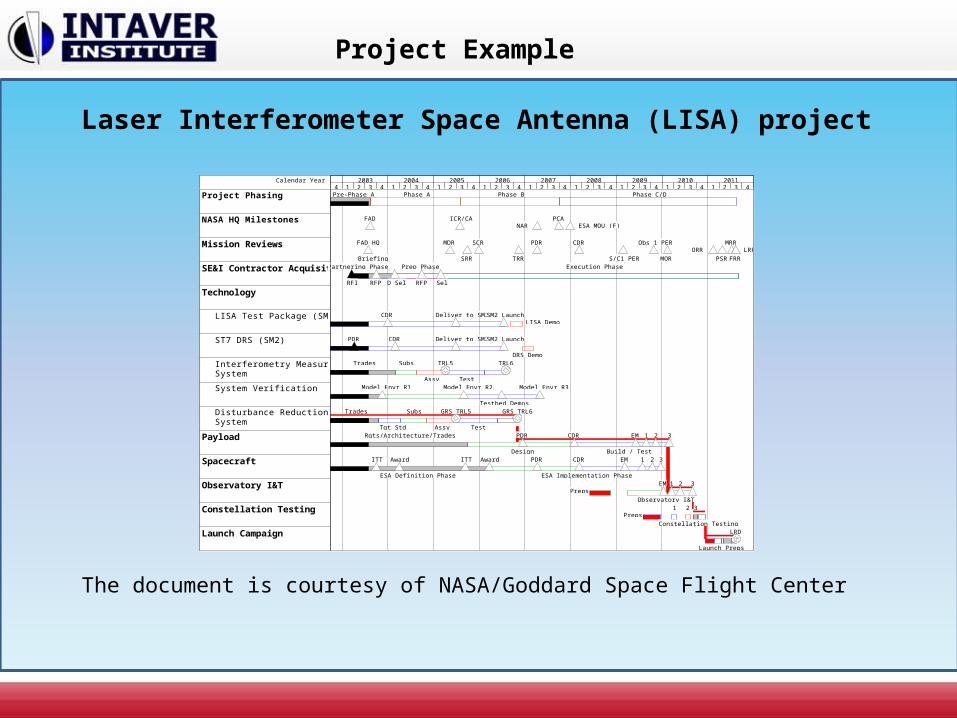
Events can cause other events, which will create event chains. These event chains can significantly affect the course of the project.
Monte Carlo Simulations
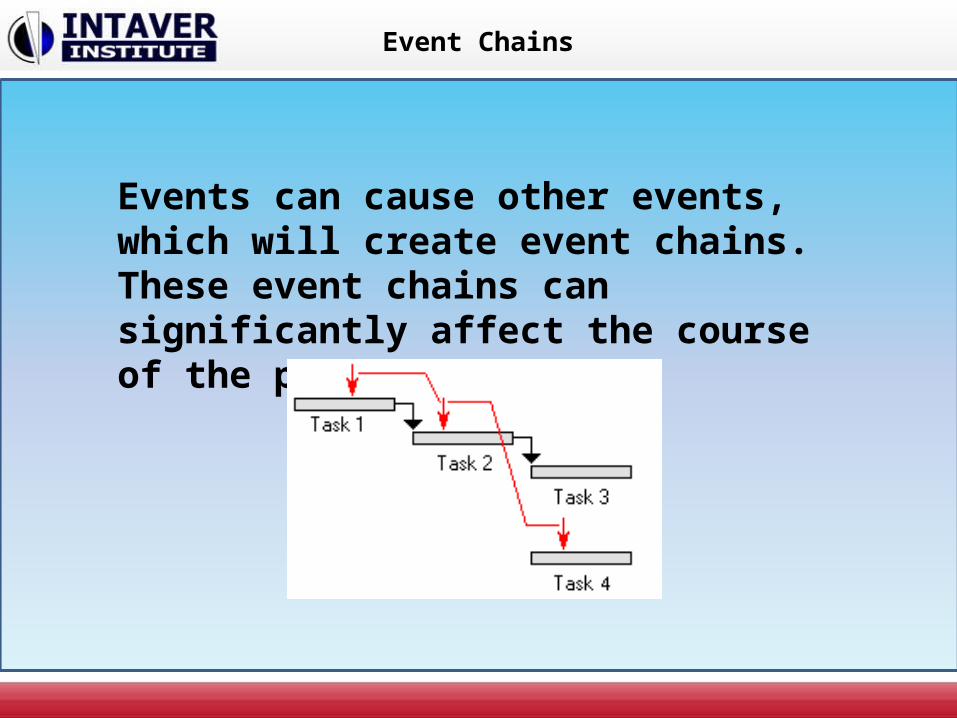
Once events and event chains are defined, quantitative analysis using Monte Carlo simulation can be performed to quantify the cumulative impact of the events.
Information regarding the uncertainties expressed as an event is supplemented with distributions related to duration, start time, cost, and other parameters

Critical Chains of Events
The single events or the event chains that have the most potential to affect the projects are the “critical events” or “critical chains of events.”

History Matching and Relevance Analysis
• Similar events or event chains are found based on historical data
• Analysis based on Bayesian approach is performed and relevance parameter is calculated
• Project manager defines relevance of each event or event chain for the current project
• Both calculated and user defined relevance parameters are used to determine probability and impact of the events for the current project

Performance Tracking with Event and Event Chains
During the course of the project, the probability and time of the events can be recalculated based on actual data.
Actual performance data and original estimate is used forecast duration of activity with risks
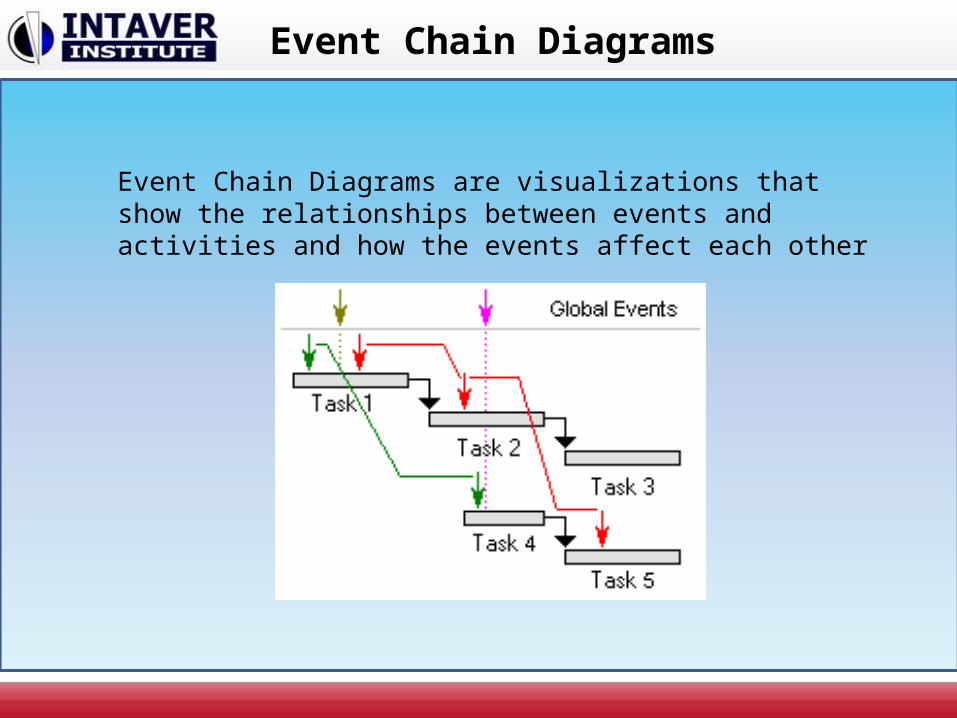
Event Chain Diagrams
Event Chain Diagrams are visualizations that show the relationships between events and activities and how the events affect each other

Repeated Activities
Common scenario for real life projects: sometimes a previous activity must be repeated based on the results of event in a succeeding activity

Event Chains and Risk Mitigation
Mitigation plan can be assigned to an event or event chain. These small schedules will be triggered when an event chain occurs.

Resource Allocation Based on Events
Event: the reassignment of a resource from one activity to another
Example: if an activity requires more resources to complete it within a fixed period, this will trigger an event to reallocate the resource from another activity.

Project Management Workflow using Event Chain Methodology
1. Define a detailed project schedule with resources and costs assigned to the activities
2. Define a detailed risk breakdown structure and assign risks to the activities. The probability of each event can be taken from historical data.
3. Define the activities associated with mitigation efforts and then assign costs and resources to them.

4. Perform a quantitative risk analysis using Monte Carlo simulations.
5. Analyze the results of the quantitative risk analysis: perform a sensitivity analysis and identify the crucial tasks and critical risks.
Project Management Workflow using Event Chain Methodology

6. Perform reality checks: compare the results of analysis with outside independent expert reviews and historical experience.
7. Monitor the course of the project on a regular basis, perform repeated quantitative risk analysis, reassess the event and event chain parameters
Project Management Workflow using Event Chain Methodology

Acknowledgements
Intaver Institute Inc. is thankful to Kevin N. Miller, Deputy Project Manager/Resources, Laser Interferometer Space Antenna (LISA) Project, NASA/Goddard Space Flight Center, for providing data necessary to illustrate the methodology discussed in the paper.