Embed Size (px)
Citation preview
Instruments and Observing Methods Report No. 130
WEA
THER
CLI
MAT
E W
ATER
Fourth WMO Regional Pyrheliometer Comparison of RA II, Jointly held with RA V (23 Jan - 3 Feb, Tsukuba, Japan)M. Omori (Japan), M. Milner (Australia), T. Aoyagi (Japan), O. Ijima (Japan) and Y. Tsutsumi (Japan)
This publication is available in pdf format, from the WMO Library website:
https://library.wmo.int/opac/
© World Meteorological Organization, 2018
The right of publication in print, electronic and any other form and in any language is
reserved by WMO. Short extracts from WMO publications may be reproduced without
authorization, provided that the complete source is clearly indicated. Editorial
correspondence and requests to publish, reproduce or translate this publication in part or in
whole should be addressed to:
Chairperson, Publications Board
World Meteorological Organization (WMO)
7 bis, avenue de la Paix Tel.: +41 (0) 22 730 8403
P.O. Box 2300 Fax: +41 (0) 22 730 8040
CH-1211 Geneva 2, Switzerland E-mail: [email protected]
NOTE
The designations employed in WMO publications and the presentation of material in this
publication do not imply the expression of any opinion whatsoever on the part of WMO
concerning the legal status of any country, territory, city or area, or of its authorities, or
concerning the delimitation of its frontiers or boundaries.
The mention of specific companies or products does not imply that they are endorsed or
recommended by WMO in preference to others of a similar nature which are not mentioned
or advertised.
The findings, interpretations and conclusions expressed in WMO publications with named
authors are those of the authors alone and do not necessarily reflect those of WMO or its
Members.
This publication has been issued without formal editing.

FOREWORD
Every five years, the secondary standard pyrheliometers from each WMO region assemble in
Davos, Switzerland, to be directly intercompared with the World Standard Group of
instruments during the International Pyrheliometer Comparison (IPC), to establish the
continuing traceability of these secondary instruments to the World Radiation Reference.
The onus is then on the keepers of the secondary standard(s) in each WMO region to ensure
that they, in turn, are made available to be intercompared with national standards from
each country in their region, to enable traceability to the world primary standard to be
extended down the hierarchy to these national standards. With the last IPC having been
held in Davos in 2015, the Japan Meteorological Agency organized a regional
intercomparison of pyrheliometers at its Regional Radiation Centre (RRC) in Tsukuba from
23 January to 3 February 2017 to accomplish this aim.
The difference between this, the fourth Regional Pyrheliometer Comparison (RPC-IV) of
WMO in Regional Association II (RA II, Asia), and previous RA II intercomparisons was that
it included the participation of the Regional Association V (RA V, South-West Pacific)
standard from the Bureau of Meteorology’s RRC in Melbourne, Australia, to enable cross-
comparison of the two standards approximately halfway through the IPC cycle and to
comprise also a regional intercomparison for RA V. Other participating instruments included
the national standards from China, Republic of Korea, Hong Kong (China) and New Zealand,
and a new absolute pyrheliometer under commercial development. Two additional experts
attended: one from the World Radiation Centre in Switzerland, and one from the Solomon
Islands.
The intercomparison was a resounding success. This report describes the intercomparison in
detail: the instruments, the participants, the experimental setup, method and procedure,
the data analysis technique used and the results. It is clear from the results that all of the
participating instruments have been well maintained and remained stable since the previous
intercomparison, which augers well for all radiation measurements within RA II and RA V. All
participants were able to return home with newly derived WRR reduction factors for their
instruments.
I wish to express my sincere gratitude, particularly to the Japan Meteorological Agency and
the staff of its Regional Radiation Centre in Tsukuba, but also to the participants from
Australia, WRC, China, Hong Kong (China), the Republic of Korea, New Zealand and the
Solomon Islands, for the success of this latest intercomparison. I also thank all of those in
RA II who have worked to make these regional intercomparisons a regular occurrence in
recent years and I wish them every success with their continuation in the years to come.
(Prof. B. Calpini)
President
Commission for Instruments
and Methods of Observation
i
TABLE OF CONTENTS
Part I FOURTH WMO REGIONAL PYRHELIOMETER COMPARISON OF RA II, JOINTLY HELD WITH RA V
1. INTRODUCTION 1
2. LOCATION OF COMPARISON SITE 1
3. PARTICIPANTS 2
4. INSTRUMENTS 3
5. OUTLINE OF COMPARISON 4
5.1. Equipment and Facilities 4
5.2. Data Acquisition Method 4
5.3. Measurement Procedures 5
5.4. Daily Comparison Schedule 7
6. IRRADIANCE CALCULATION 7
7. DATA EVALUATION PROCEDURES 8
8. COMPARISON RESULTS 10
9. CONCLUSIONS 12
REFERENCES 12
Appendix
A: List of Participants 13
B: Measurement Values for Each Instrument 15
C: Plot Figures of Measurement Values 24
D: Meteorological Data 28
E: Group Photo of Participants 31
F: Activities of the Regional Radiation Centre, Tokyo 32
Part II CALIBRATION OF REFERENCE PYRANOMETERS
1. INTRODUCTION 33
2. METHOD OF CALIBRATION AND DATA ACQUISITION 33
ii
3. PYRANOMETER CALIBRATION FACTOR DEFINITION 33
4. DATA EVALUATION PROCEDURE 33
5. CALIBRATION RESULTS 34
Appendix
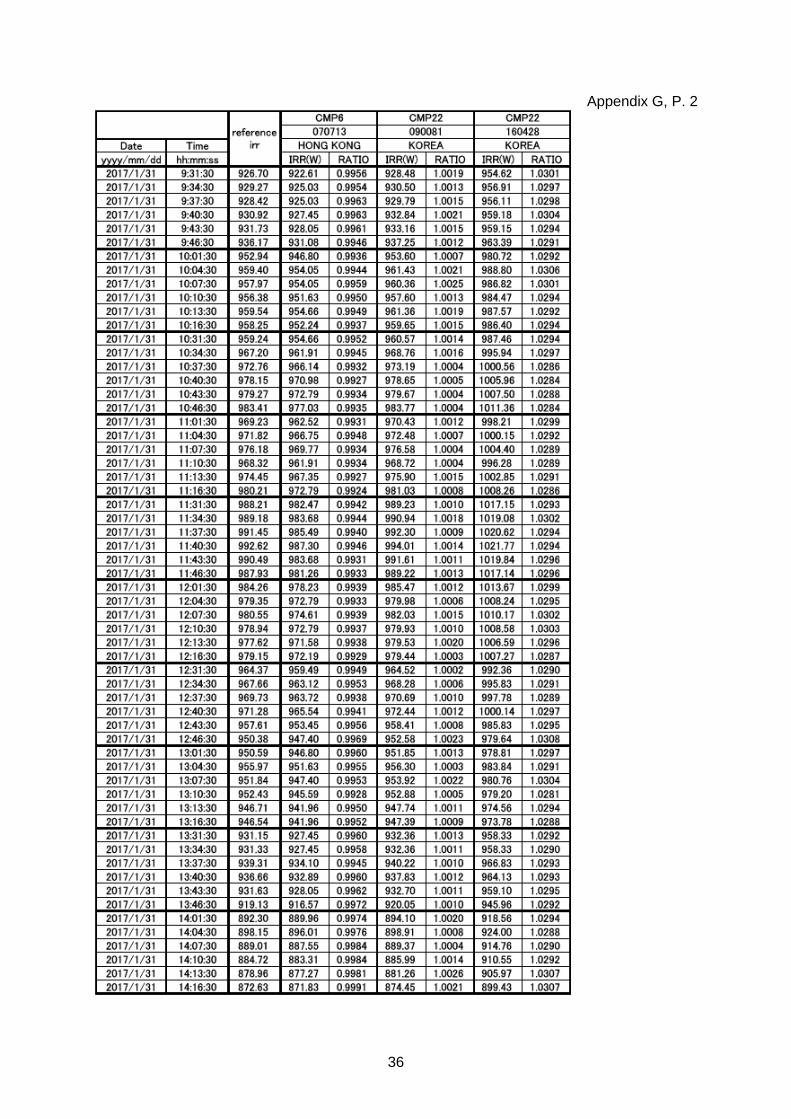
G: Measurement Values for Each Instrument 35
H: Plot of Measurement Values 37
1
Part I
FOURTH WMO REGIONAL PYRHELIOMETER COMPARISON OF RA II, JOINTLY HELD WITH RA V
(Tsukuba, Japan, 23 January – 3 February, 2017)
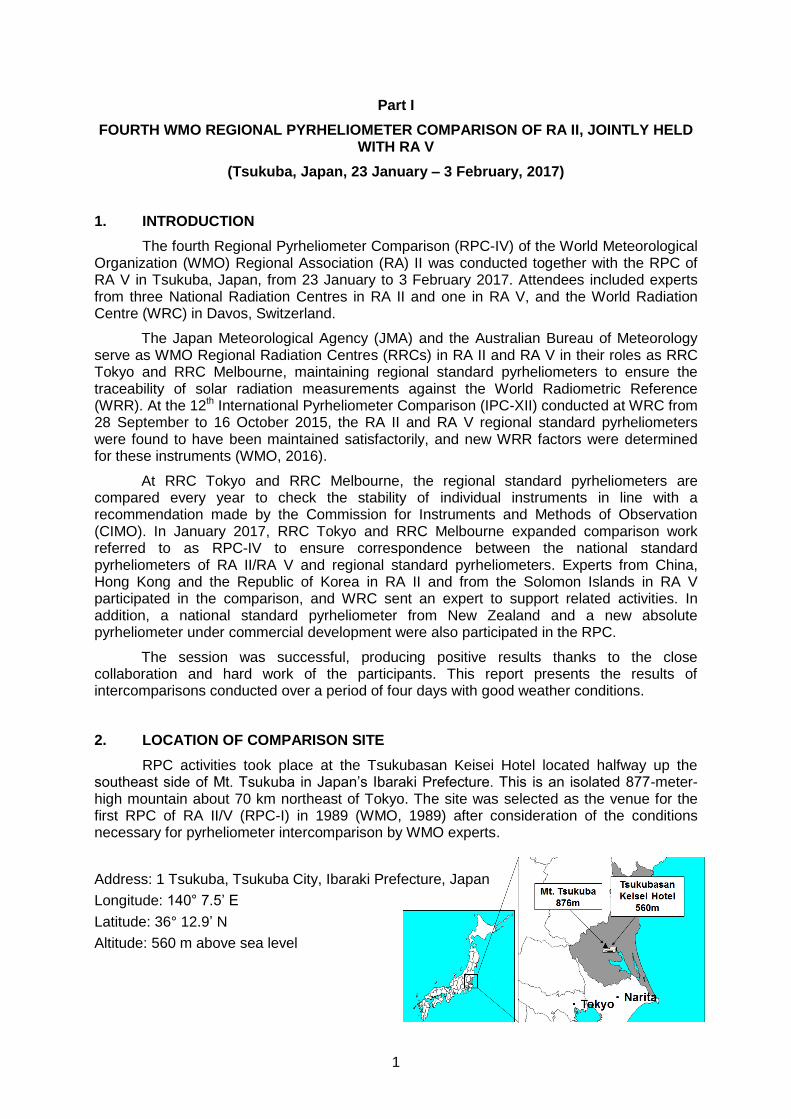
1. INTRODUCTION
The fourth Regional Pyrheliometer Comparison (RPC-IV) of the World Meteorological Organization (WMO) Regional Association (RA) II was conducted together with the RPC of RA V in Tsukuba, Japan, from 23 January to 3 February 2017. Attendees included experts from three National Radiation Centres in RA II and one in RA V, and the World Radiation Centre (WRC) in Davos, Switzerland.
The Japan Meteorological Agency (JMA) and the Australian Bureau of Meteorology serve as WMO Regional Radiation Centres (RRCs) in RA II and RA V in their roles as RRC Tokyo and RRC Melbourne, maintaining regional standard pyrheliometers to ensure the traceability of solar radiation measurements against the World Radiometric Reference (WRR). At the 12th International Pyrheliometer Comparison (IPC-XII) conducted at WRC from 28 September to 16 October 2015, the RA II and RA V regional standard pyrheliometers were found to have been maintained satisfactorily, and new WRR factors were determined for these instruments (WMO, 2016).
At RRC Tokyo and RRC Melbourne, the regional standard pyrheliometers are compared every year to check the stability of individual instruments in line with a recommendation made by the Commission for Instruments and Methods of Observation (CIMO). In January 2017, RRC Tokyo and RRC Melbourne expanded comparison work referred to as RPC-IV to ensure correspondence between the national standard pyrheliometers of RA II/RA V and regional standard pyrheliometers. Experts from China, Hong Kong and the Republic of Korea in RA II and from the Solomon Islands in RA V participated in the comparison, and WRC sent an expert to support related activities. In addition, a national standard pyrheliometer from New Zealand and a new absolute pyrheliometer under commercial development were also participated in the RPC.
The session was successful, producing positive results thanks to the close collaboration and hard work of the participants. This report presents the results of intercomparisons conducted over a period of four days with good weather conditions.
2. LOCATION OF COMPARISON SITE
RPC activities took place at the Tsukubasan Keisei Hotel located halfway up the southeast side of Mt. Tsukuba in Japan’s Ibaraki Prefecture. This is an isolated 877-meter-high mountain about 70 km northeast of Tokyo. The site was selected as the venue for the first RPC of RA II/V (RPC-I) in 1989 (WMO, 1989) after consideration of the conditions necessary for pyrheliometer intercomparison by WMO experts.
Address: 1 Tsukuba, Tsukuba City, Ibaraki Prefecture, Japan
Longitude: 140° 7.5’ E
Latitude: 36° 12.9’ N
Altitude: 560 m above sea level

2
3. PARTICIPANTS
Experts from three RA II members (China, Hong Kong and the Republic of Korea) and two RA V members (Australia and the Solomon Islands), an expert from WRC and JMA staff participated in the comparison.
Participants
Ms. Yang Yun (China)
Ms. Ding Lei (China)
Mr. Chong Wei (China)
Mr. Tony Hak Ming Chau (Hong Kong)
Mr. Soo-Ho Ryu (Republic of Korea)
Mr. Yong-june Park (Republic of Korea)
Mr. Bu-Yo Kim (Republic of Korea)
Mr. Hyun-Seok Jung (Republic of Korea)
Mr. Jin-Soo Park (Republic of Korea)
Mr. Michael Milner (Regional Radiation Center in RA V / Australia)
Mr. Barnabas Tahunipue (Solomon Islands)
Dr. Wolfgang Finsterle (World Radiation Center / Switzerland)
Dr. Yukitomo Tsutsumi (Director, Regional Radiation Center in RA II
/ JMA Headquarters / Japan)
Dr. Toshinori Aoyagi (JMA Headquarters / Japan)
Mr. Masao Omori (JMA Headquarters / Japan)
Mr. Nozomu Ohkawara (JMA Headquarters / Japan)
Mr. Hiroki Yuasa (JMA Headquarters / Japan)
Mr. Akinori Ogi (JMA Headquarters / Japan)
Mr. Osamu Ijima (Aerological Observatory / Japan)
Mr. Matsumi Takano (Aerological Observatory / Japan)
Mr. Yukihiro Nomura (Meteorological Instruments Center / Japan)
Mr. Satoru Hagiya (Meteorological Instruments Center / Japan)
Mr. Toshihiro Oka (Meteorological Instruments Center / Japan)
Mr. Koji Haijima (Meteorological Instruments Center / Japan)
A list of main participants and contact addresses is shown in Appendix A.

3
4. INSTRUMENTS
Following absolute pyrheliometers were compared.
Instrument
PMO6-CC No. 0401 (WRC)
PMO6-CC No. 0803 (WRC)
AHF No. 32455 (WRC)
PMO6-CC No. 0403 (Japan)
AHF No. 37815 (Japan)
HF No. 27160 (Australia)
TMI No. 69137 (Australia)
AHF No. 36012 (China)
PMO6-CC No. 0806 (China)
PMO6-CC No. 0102 (Hong Kong)
PMO6-CC No. 0809 (Hong Kong)
PMO6 No. 951202 (Republic of Korea)
AHF No. 36014 (Republic of Korea)
CHP1 No. 160360 (Republic of Korea)
CHP1 No. 110775 (New Zealand)
AHF No. 32446 (Japan)
PMO6-CC No. 1107 (Japan)
ACR No. 01 (Middleton Solar, Australia)
During the comparison, ancillary data (air temperature, relative humidity, atmospheric pressure and wind speed/direction) were obtained from an automatic weather station (AWS). A precision filter radiometer (PFR) was operated to determine aerosol optical depth (AOD) at four wavelengths (368 nm, 412 nm, 500 nm and 862 nm). These data were used for screening in data evaluation procedures. The auxiliary instruments are listed below.
Auxiliary instruments
MetPak II 1723-PK-100 Automatic weather station
PFR No. 47 Sunphotometer

4
5. OUTLINE OF COMPARISON
5.1. Equipment and Facilities
Flat benches, automatic active sun trackers, a data acquisition system, a voice-announcement and buzzer system (to indicate the start and end of measurements), an AWS (consisting of a thermometer, a hygrometer, a barometer and an ultrasonic anemometer) and some power supplies (100/220 V, 50 Hz) were set up on the rooftop of the venue. The pyrheliometer and sunphotometer sensors were mounted on seven sun trackers.
5.2. Data Acquisition Method
Digital data from the radiometer controllers were acquired by all members via a dedicated personal computer. Each member converted the data into the set format after daily observations and stored them on USB flash memory.
Analog signals from the controller of one PMO6 were acquired and stored immediately on a dedicated personal computer with a multi-channel analog data logger by JMA staff.

5
5.3. Measurement Procedures
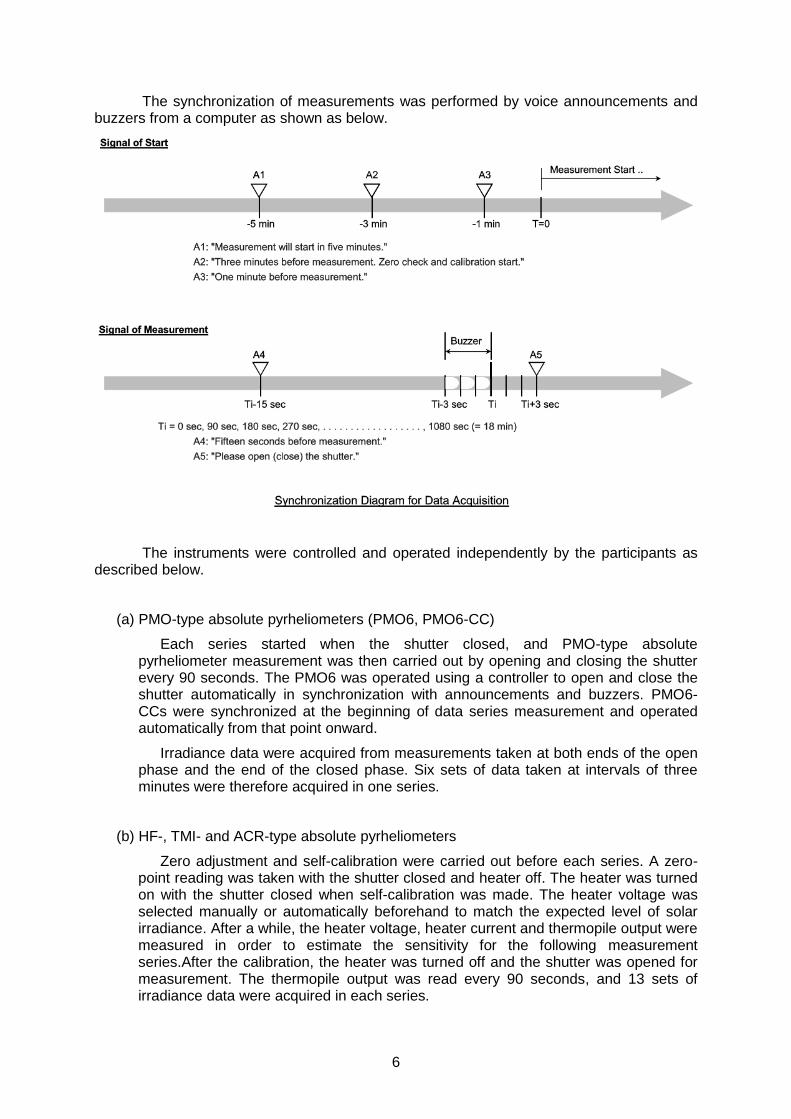
The sequence of measurements of a sample day is shown as below.
Each set of measurements, referred to as a series, was composed of 13 data readings taken at 90-second intervals. Accordingly, the collection of one series took 18 minutes. The data sampling cycle for each instrument is shown as below.
6
The synchronization of measurements was performed by voice announcements and buzzers from a computer as shown as below.
The instruments were controlled and operated independently by the participants as described below.
(a) PMO-type absolute pyrheliometers (PMO6, PMO6-CC)
Each series started when the shutter closed, and PMO-type absolute pyrheliometer measurement was then carried out by opening and closing the shutter every 90 seconds. The PMO6 was operated using a controller to open and close the shutter automatically in synchronization with announcements and buzzers. PMO6-CCs were synchronized at the beginning of data series measurement and operated automatically from that point onward.
Irradiance data were acquired from measurements taken at both ends of the open phase and the end of the closed phase. Six sets of data taken at intervals of three minutes were therefore acquired in one series.
(b) HF-, TMI- and ACR-type absolute pyrheliometers
Zero adjustment and self-calibration were carried out before each series. A zero-point reading was taken with the shutter closed and heater off. The heater was turned on with the shutter closed when self-calibration was made. The heater voltage was selected manually or automatically beforehand to match the expected level of solar irradiance. After a while, the heater voltage, heater current and thermopile output were measured in order to estimate the sensitivity for the following measurement series.After the calibration, the heater was turned off and the shutter was opened for measurement. The thermopile output was read every 90 seconds, and 13 sets of irradiance data were acquired in each series.
7
These operations were performed automatically via program control. However, failure of the prototype shutter system resulted in mostly manual operation as for ACR.
5.4. Daily Comparison Schedule
Generally, the daily schedule was as follows:
06:30 – 08:20 The instruments were taken from the storage room to the rooftop, set up and connected. After inspection of the automatic active sun trackers, pyrheliometer alignment and the connection of the observation instruments to the data logger and computers etc., the instruments were allowed to warm up for at least 30 minutes.
08:30 – 15:30 Depending on suitable weather conditions, measurements were taken (see Section 5.3.). Pyrheliometer alignment was checked on an ongoing basis and fine adjustments were made using screws or similar where necessary.
15:30 – Measurement was ended and the instruments were returned to the storage room. The participants submitted measurement data, and the RRC distributed the preliminary results of measurement to the participants. The results were monitored every day to check the status of the instruments and the measurement procedures.
On cloudy days, country reports, technical visits to JMA's Meteorological Instrument Center and Aerological Observatory and training in radiation measurement were scheduled.
6. IRRADIANCE CALCULATION
The procedure used to calculate the irradiance of each instrument type is described below. The notations are as follows:
Symbols
S direct solar irradiance [W m–2]
Vth output of thermopile [V]
UH or UI voltage across the heater (H) or across the shunt resistor (I) [V]
RN precision shunt resistor to measure electric current []
RC correction resistance for heater leads []
C1 calibration factor
P electrical power in the active cavities [W]
F tentative mean irradiance ratio
K sensitivity
Subscripts
irrad value during irradiance measurement phase
cal value during calibration phase
zero value during zero adjustment in calibration phase
open value during shutter-open phase
closed value during shutter-closed phase
8
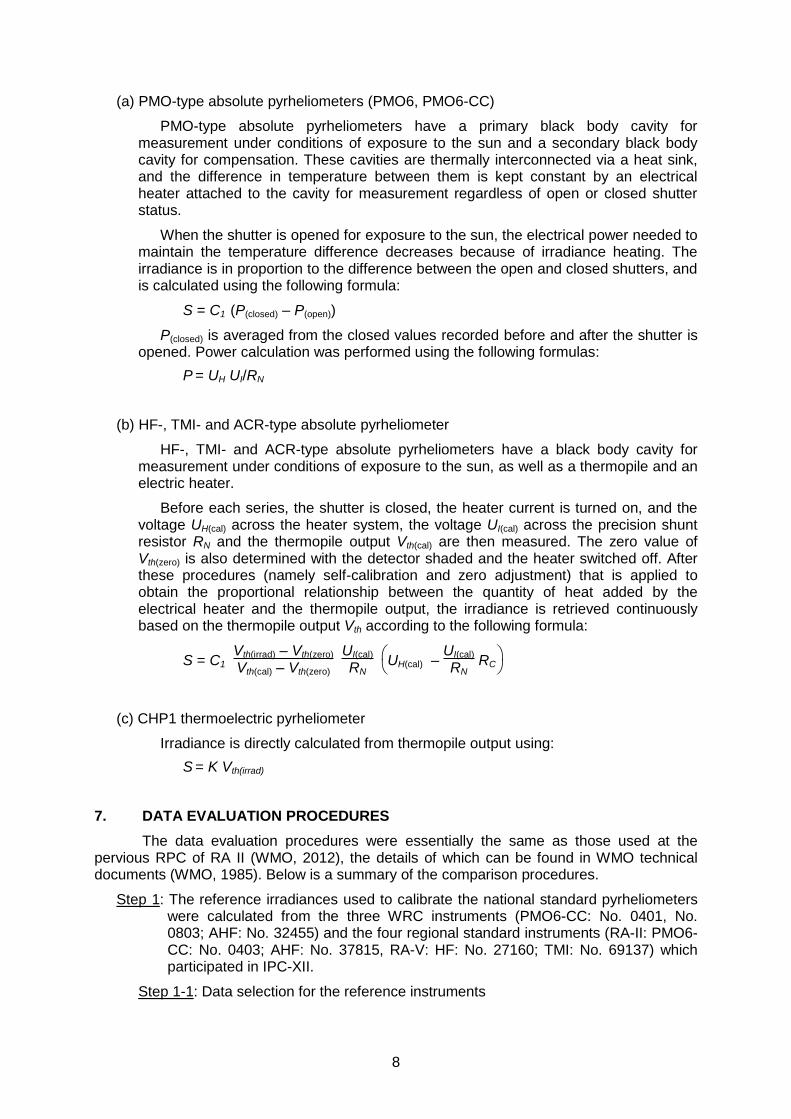
(a) PMO-type absolute pyrheliometers (PMO6, PMO6-CC)
PMO-type absolute pyrheliometers have a primary black body cavity for measurement under conditions of exposure to the sun and a secondary black body cavity for compensation. These cavities are thermally interconnected via a heat sink, and the difference in temperature between them is kept constant by an electrical heater attached to the cavity for measurement regardless of open or closed shutter status.
When the shutter is opened for exposure to the sun, the electrical power needed to maintain the temperature difference decreases because of irradiance heating. The irradiance is in proportion to the difference between the open and closed shutters, and is calculated using the following formula:
S = C1 (P(closed) – P(open))
P(closed) is averaged from the closed values recorded before and after the shutter is opened. Power calculation was performed using the following formulas:
P = UH UI/RN
(b) HF-, TMI- and ACR-type absolute pyrheliometer
HF-, TMI- and ACR-type absolute pyrheliometers have a black body cavity for measurement under conditions of exposure to the sun, as well as a thermopile and an electric heater.
Before each series, the shutter is closed, the heater current is turned on, and the voltage UH(cal) across the heater system, the voltage UI(cal) across the precision shunt resistor RN and the thermopile output Vth(cal) are then measured. The zero value of Vth(zero) is also determined with the detector shaded and the heater switched off. After these procedures (namely self-calibration and zero adjustment) that is applied to obtain the proportional relationship between the quantity of heat added by the electrical heater and the thermopile output, the irradiance is retrieved continuously based on the thermopile output Vth according to the following formula:
S = C1 Vth(irrad) – Vth(zero)
Vth(cal) – Vth(zero) UI(cal)
RN
UH(cal) –
UI(cal)
RN RC
(c) CHP1 thermoelectric pyrheliometer
Irradiance is directly calculated from thermopile output using:
S = K Vth(irrad)
7. DATA EVALUATION PROCEDURES
The data evaluation procedures were essentially the same as those used at the pervious RPC of RA II (WMO, 2012), the details of which can be found in WMO technical documents (WMO, 1985). Below is a summary of the comparison procedures.
Step 1: The reference irradiances used to calibrate the national standard pyrheliometers were calculated from the three WRC instruments (PMO6-CC: No. 0401, No. 0803; AHF: No. 32455) and the four regional standard instruments (RA-II: PMO6-CC: No. 0403; AHF: No. 37815, RA-V: HF: No. 27160; TMI: No. 69137) which participated in IPC-XII.
Step 1-1: Data selection for the reference instruments
9
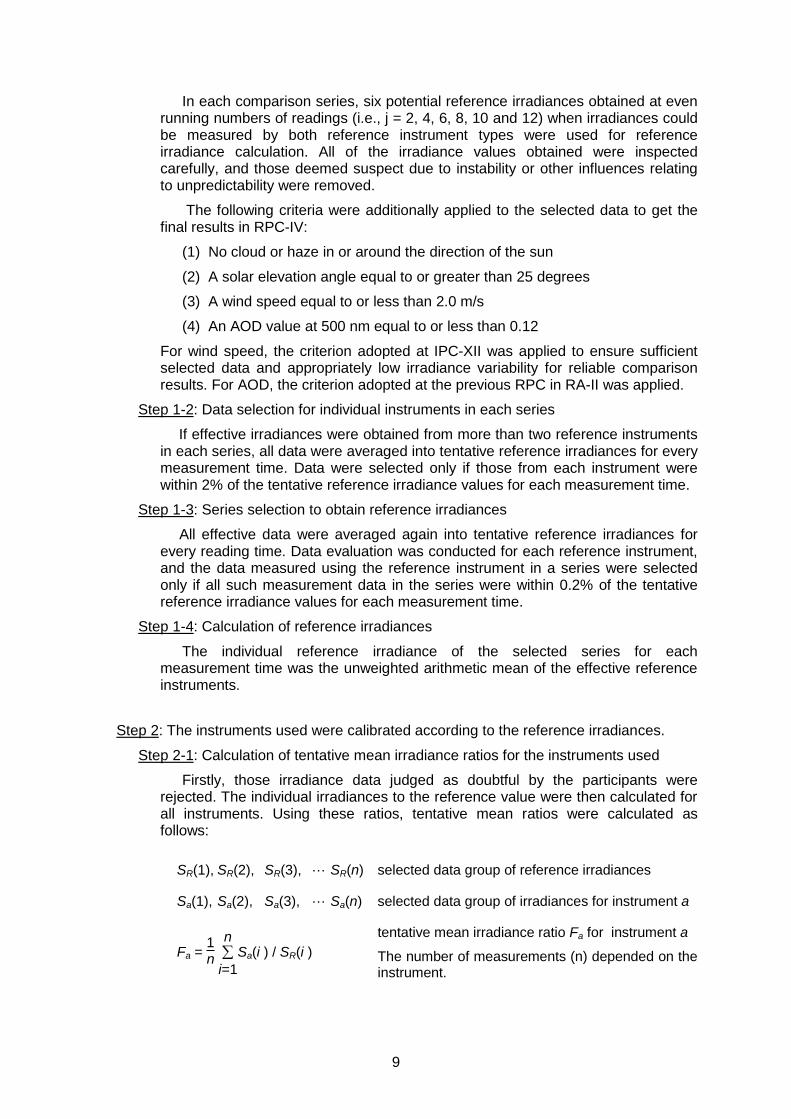
In each comparison series, six potential reference irradiances obtained at even running numbers of readings (i.e., j = 2, 4, 6, 8, 10 and 12) when irradiances could be measured by both reference instrument types were used for reference irradiance calculation. All of the irradiance values obtained were inspected carefully, and those deemed suspect due to instability or other influences relating to unpredictability were removed.
The following criteria were additionally applied to the selected data to get the final results in RPC-IV:
(1) No cloud or haze in or around the direction of the sun
(2) A solar elevation angle equal to or greater than 25 degrees
(3) A wind speed equal to or less than 2.0 m/s
(4) An AOD value at 500 nm equal to or less than 0.12
For wind speed, the criterion adopted at IPC-XII was applied to ensure sufficient selected data and appropriately low irradiance variability for reliable comparison results. For AOD, the criterion adopted at the previous RPC in RA-II was applied.
Step 1-2: Data selection for individual instruments in each series
If effective irradiances were obtained from more than two reference instruments in each series, all data were averaged into tentative reference irradiances for every measurement time. Data were selected only if those from each instrument were within 2% of the tentative reference irradiance values for each measurement time.
Step 1-3: Series selection to obtain reference irradiances
All effective data were averaged again into tentative reference irradiances for every reading time. Data evaluation was conducted for each reference instrument, and the data measured using the reference instrument in a series were selected only if all such measurement data in the series were within 0.2% of the tentative reference irradiance values for each measurement time.
Step 1-4: Calculation of reference irradiances
The individual reference irradiance of the selected series for each measurement time was the unweighted arithmetic mean of the effective reference instruments.
Step 2: The instruments used were calibrated according to the reference irradiances.
Step 2-1: Calculation of tentative mean irradiance ratios for the instruments used
Firstly, those irradiance data judged as doubtful by the participants were rejected. The individual irradiances to the reference value were then calculated for all instruments. Using these ratios, tentative mean ratios were calculated as follows:
SR(1), SR(2), SR(3), ··· SR(n) selected data group of reference irradiances
Sa(1), Sa(2), Sa(3), ··· Sa(n) selected data group of irradiances for instrument a
Fa = 1n i=1
n Sa(i ) / SR(i )
tentative mean irradiance ratio Fa for instrument a
The number of measurements (n) depended on the instrument.
10
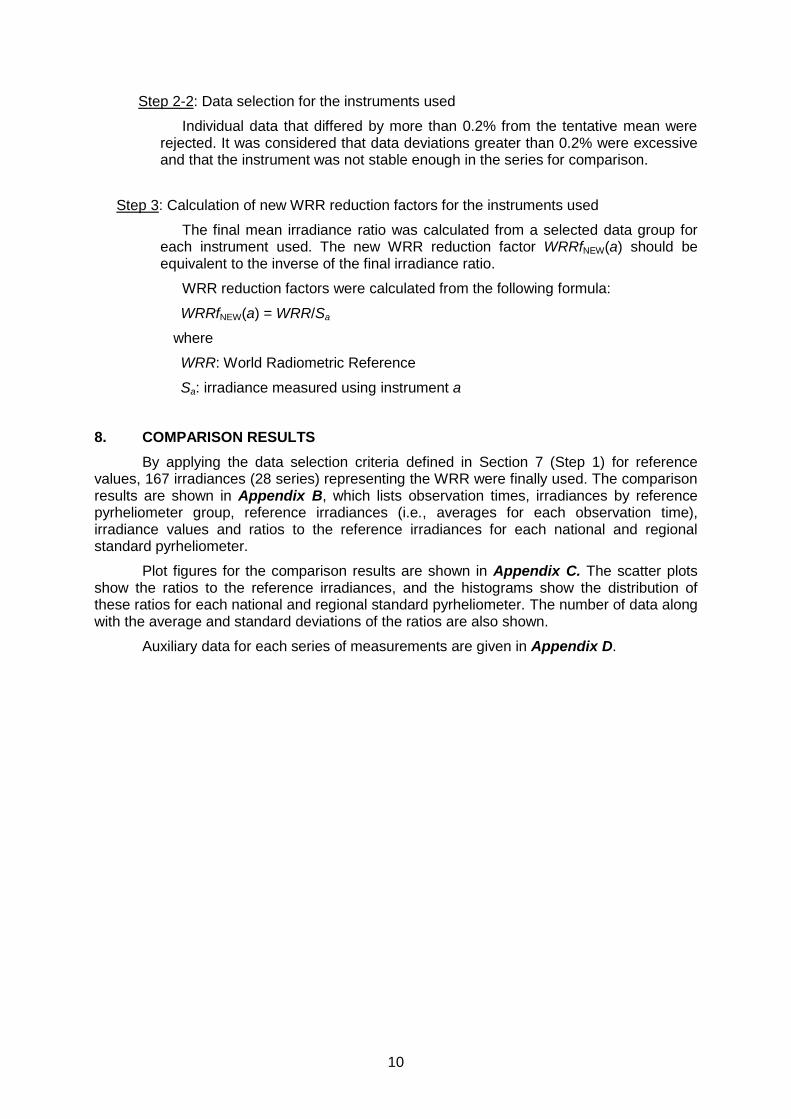
Step 2-2: Data selection for the instruments used
Individual data that differed by more than 0.2% from the tentative mean were rejected. It was considered that data deviations greater than 0.2% were excessive and that the instrument was not stable enough in the series for comparison.
Step 3: Calculation of new WRR reduction factors for the instruments used
The final mean irradiance ratio was calculated from a selected data group for each instrument used. The new WRR reduction factor WRRfNEW(a) should be equivalent to the inverse of the final irradiance ratio.
WRR reduction factors were calculated from the following formula:
WRRfNEW(a) = WRR/Sa
where
WRR: World Radiometric Reference
Sa: irradiance measured using instrument a
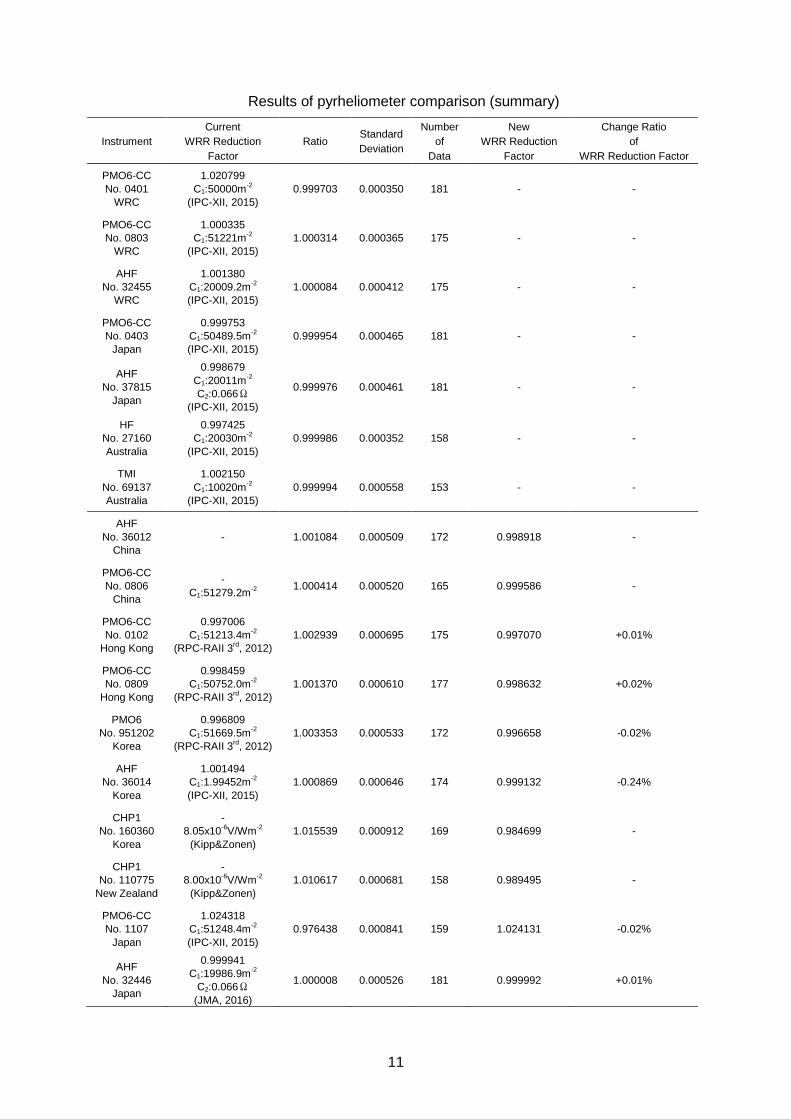
8. COMPARISON RESULTS
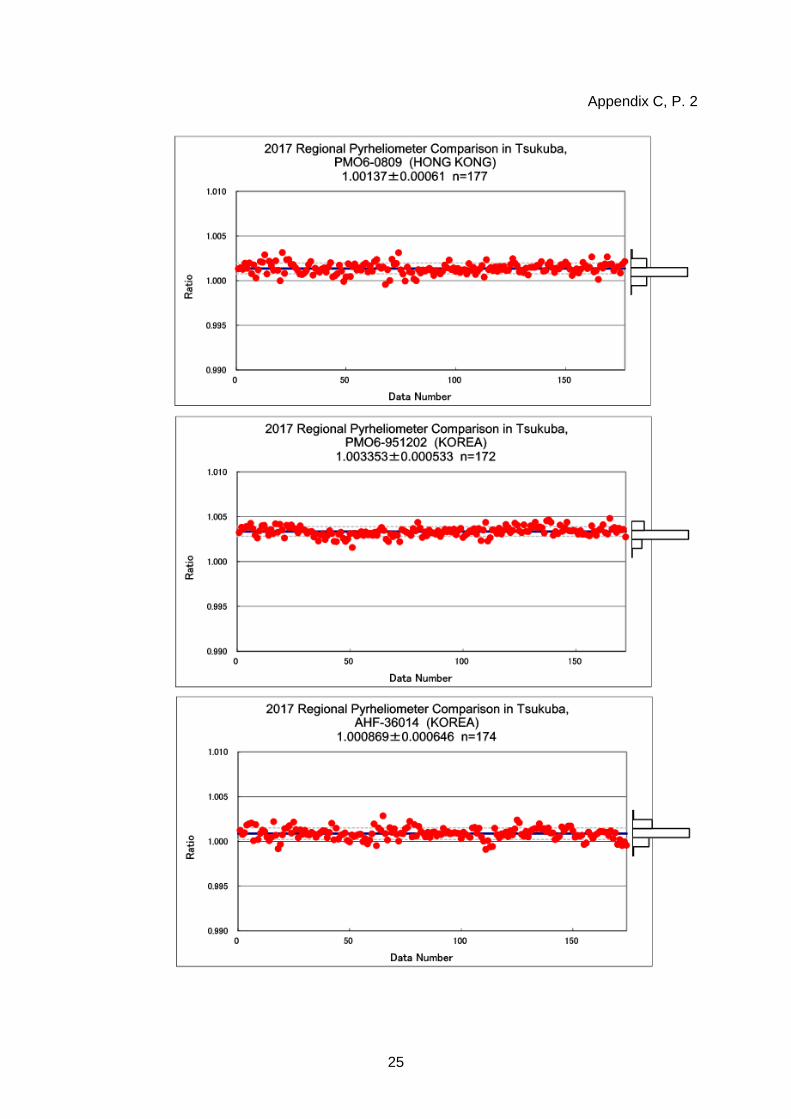
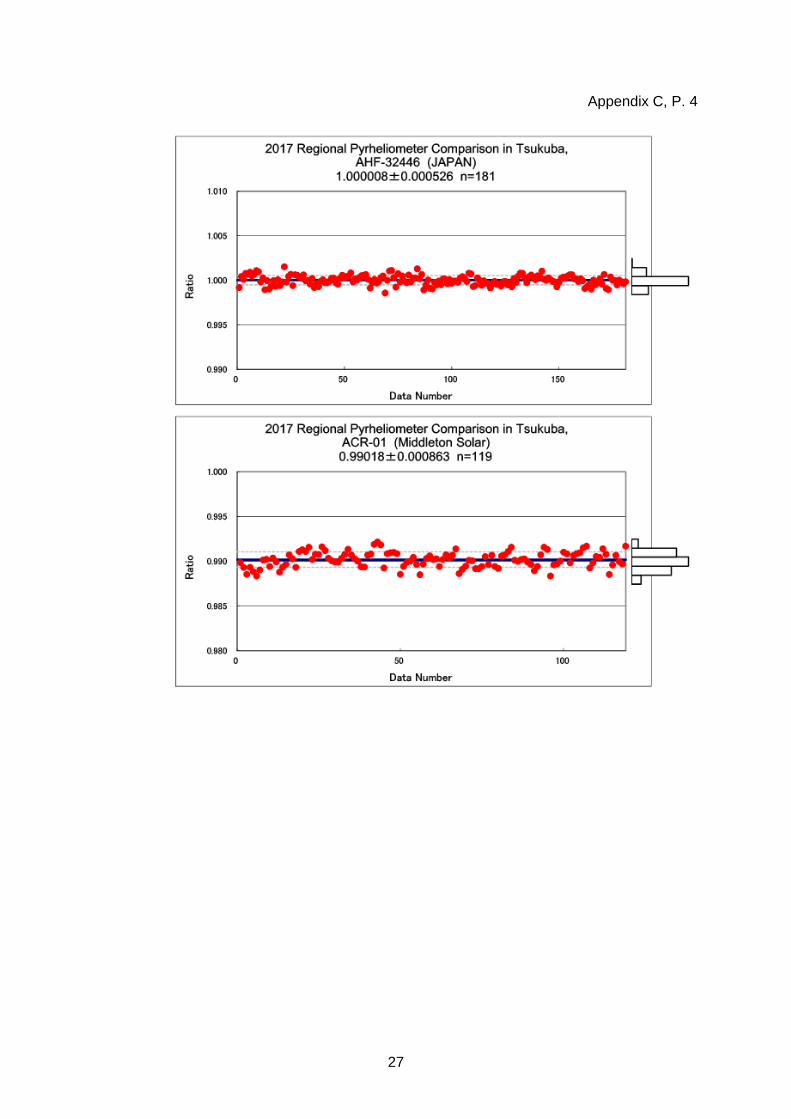
By applying the data selection criteria defined in Section 7 (Step 1) for reference values, 167 irradiances (28 series) representing the WRR were finally used. The comparison results are shown in Appendix B, which lists observation times, irradiances by reference pyrheliometer group, reference irradiances (i.e., averages for each observation time), irradiance values and ratios to the reference irradiances for each national and regional standard pyrheliometer.
Plot figures for the comparison results are shown in Appendix C. The scatter plots show the ratios to the reference irradiances, and the histograms show the distribution of these ratios for each national and regional standard pyrheliometer. The number of data along with the average and standard deviations of the ratios are also shown.
Auxiliary data for each series of measurements are given in Appendix D.
11
Results of pyrheliometer comparison (summary)
Instrument
Current
WRR Reduction
Factor
Ratio Standard
Deviation
Number
of
Data
New
WRR Reduction
Factor
Change Ratio
of
WRR Reduction Factor
PMO6-CC
No. 0401
WRC
1.020799
C1:50000m-2
(IPC-XII, 2015)
0.999703 0.000350 181 - -
PMO6-CC
No. 0803
WRC
1.000335
C1:51221m-2
(IPC-XII, 2015)
1.000314 0.000365 175 - -
AHF
No. 32455
WRC
1.001380
C1:20009.2m-2
(IPC-XII, 2015)
1.000084 0.000412 175 - -
PMO6-CC
No. 0403
Japan
0.999753
C1:50489.5m-2
(IPC-XII, 2015)
0.999954 0.000465 181 - -
AHF
No. 37815
Japan
0.998679
C1:20011m-2
C2:0.066Ω
(IPC-XII, 2015)
0.999976 0.000461 181 - -
HF
No. 27160
Australia
0.997425
C1:20030m-2
(IPC-XII, 2015)
0.999986 0.000352 158 - -
TMI
No. 69137
Australia
1.002150
C1:10020m-2
(IPC-XII, 2015)
0.999994 0.000558 153 - -
AHF
No. 36012
China
- 1.001084 0.000509 172 0.998918 -
PMO6-CC
No. 0806
China
-
C1:51279.2m-2 1.000414 0.000520 165 0.999586 -
PMO6-CC
No. 0102
Hong Kong
0.997006
C1:51213.4m-2
(RPC-RAII 3rd, 2012)
1.002939 0.000695 175 0.997070 +0.01%
PMO6-CC
No. 0809
Hong Kong
0.998459
C1:50752.0m-2
(RPC-RAII 3rd, 2012)
1.001370 0.000610 177 0.998632 +0.02%
PMO6
No. 951202
Korea
0.996809
C1:51669.5m-2
(RPC-RAII 3rd, 2012)
1.003353 0.000533 172 0.996658 -0.02%
AHF
No. 36014
Korea
1.001494
C1:1.99452m-2
(IPC-XII, 2015)
1.000869 0.000646 174 0.999132 -0.24%
CHP1
No. 160360
Korea
-
8.05x10⁻⁶V/Wm
-2
(Kipp&Zonen)
1.015539 0.000912 169 0.984699 -
CHP1
No. 110775
New Zealand
-
8.00x10⁻⁶V/Wm
-2
(Kipp&Zonen)
1.010617 0.000681 158 0.989495 -
PMO6-CC
No. 1107
Japan
1.024318
C1:51248.4m-2
(IPC-XII, 2015)
0.976438 0.000841 159 1.024131 -0.02%
AHF
No. 32446
Japan
0.999941
C1:19986.9m-2
C2:0.066Ω
(JMA, 2016)
1.000008 0.000526 181 0.999992 +0.01%

12
Instrument
Current
WRR Reduction
Factor
Ratio Standard
Deviation
Number
of
Data
New
WRR Reduction
Factor
Change Ratio
of
WRR Reduction Factor
ACR
No. 01
MSolar
- 0.990180 0.000863 119 1.009918 -
9. CONCLUSIONS
The results of the regional pyrheliometer comparison can be summarized as follows:
(1) Within a given period, four days worth of measurement data were acquired in favorable weather conditions, which led to the successful determination of reduction factors.
(2) It was confirmed that the pyrheliometers involved in the comparison were appropriately maintained and showed high accuracy.
(3) New WRR reduction factors for national standard instruments were determined as necessary to ensure the traceability of solar radiation measurements in each member country/region.
(4) During the comparison, participants exchanged and shared scientific and technological information on radiation measurement through country reports, technical visits and training courses.
REFERENCES
WMO (2016); International Pyrheliometer Comparison IPC-XII Final Report, IOM report No. 124, WMO.
WMO (2012); Third WMO Regional Pyrheliometer Comparison of RA II, Instruments and Observing Methods report No. 113, WMO.
WMO (1985); Keynote Papers presented at the Third WMO Technical Conference on Instruments and Methods of Observation (TECIMO-III), Instruments and Observing Methods report No. 23, WMO TD-No. 51, 65 – 84.

Appendix A, P. 1
13
List of Participants Ms. Yang Yun
Meteorological Observation Center China Meteorological Administration 46, Zhongguancun Nandajie, Haidian district, Beijing, China Phone: +8610-68406936 Fax: +8610-68409323 E-mail: [email protected]
Ms. Ding Lei
Meteorological Observation Center China Meteorological Administration 46, Zhongguancun Nandajie, Haidian district, Beijing, China Phone: +8610-68406936 Fax: +8610-68409323 E-mail: [email protected]
Mr. Chong Wei
Meteorological Observation Center China Meteorological Administration 46, Zhongguancun Nandajie, Haidian district, Beijing, China Phone: +8610-68406936 Fax: +8610-68409323 E-mail: [email protected]
Mr. Tony Hak Ming Chau
Hong Kong Observatory 134A Nathan Road, Tsim Sha Tsui, Kowloon, Hong Kong Phone: +852-2926-8115 Fax: +852-2311-9448 E-mail: [email protected]
Mr. Soo-Ho Ryu
Korea Meteorological Administration 45 Gisnagchoing-gil, Dongiak-gu, Seoul, Republic of Korea Phone: +82-2-2181-0713 Fax: +82-2-841-7045 E-mail: [email protected]
Mr. Yong-june Park
Korea Meteorological Administration 45 Gisnagchoing-gil, Dongiak-gu, Seoul, Republic of Korea Phone: +82-2-2181-0719 Fax: +82-2-841-7045 E-mail: [email protected]
Mr. Jinsoo Park
Korea Meteorological Industry Promotion Agency
5 Yeouidaebang-ro, 9ga-gil, Yeongdeungpo-gu Seoul, Republic of Korea Phone: +82-10-9548-0365 Fax: +82-2-836-0360 E-mail: [email protected]
Mr. Bu-Yo Kim
Gangneung-Wonju National University Jukheon-gil, Gangneung-si, Ganwon-do, Republic of Korea Phone: +82-10-7633-1024 Fax: +82-33-640-2324 E-mail: [email protected]
Mr. Hyun-Seok Jung
Gangneung-Wonju National University Jukheon-gil, Gangneung-si, Ganwon-do, Republic of Korea Phone: +82-10-6602-6526 Fax: +82-33-640-2324 E-mail: [email protected]
Mr. Michael Milner
Bureau of Meteorology 700 Collin St, Docklands, Victoria, 3008 Australia Phone: +61-3-9669-4122 Fax: +61-3-9669-4736 E-mail: [email protected]
Mr. Barnabas Tahunipue
Solomon Islands Meteorological Service PO Box 21, Honiara, Solomon Islands Phone: Fax: E-mail: [email protected]
Dr. Wolfgang Finsterle
Physikalisch-Meteorologisches Observatorium Davos
World Radiation Center Dorfstrasse 33, CH-7260 Davos Dorf, Switzerland Phone: +41-81-417-5153 Fax: +41-81-417-5100 E-mail: [email protected]
Appendix A, P. 2
14
Dr. Yukitomo Tsutsumi
Director, Atmospheric Environment Division Global Environment and Marine Department Japan Meteorological Agency 1-3-4 Otemachi, Chiyoda-ku, Tokyo, 100-8122 Japan Phone: +81-3-3287-3439 Fax: +81-3-3211-4640 E-mail: [email protected]
Dr. Toshinori Aoyagi
Atmospheric Environment Division Global Environment and Marine Department Japan Meteorological Agency 1-3-4 Otemachi, Chiyoda-ku, Tokyo, 100-8122 Japan Phone: +81-3-3287-3439 Fax: +81-3-3211-4640 E-mail:[email protected]
Mr. Masao Omori
Atmospheric Environment Division Global Environment and Marine Department Japan Meteorological Agency 1-3-4 Otemachi, Chiyoda-ku, Tokyo, 100-8122 Japan Phone: +81-3-3287-3439 Fax: +81-3-3211-4640 E-mail: [email protected]
Mr. Osamu Ijima
Ozone and Radiation Division Aerological Observatory Japan Meteorological Agency 1-2 Nagamine, Tsukuba-shi, Ibaraki, 305-0052, Japan Phone: +81-298-51-4127 Fax: +81-298-51-5765 E-mail: [email protected]

15
Appendix B, P. 1
16
Appendix B, P. 2
17
Appendix B, P. 3

18
Appendix B, P. 4

19
Appendix B, P. 5

20
Appendix B, P. 6

21
Appendix B, P. 7

22
Appendix B, P. 8
23
Appendix B, P. 9

24
Appendix C, P. 1
25
Appendix C, P. 2

26
Appendix C, P. 3
27
Appendix C, P. 4
28
Appendix D, P. 1
Meteorological Data
The table in this appendix shows meteorological data obtained during irradiance measurements.
1. Temperature (T), Relative Humidity (RH), Station Pressure (SP), Wind Direction (WD) and Wind Speed (WS)
Temperature, relative humidity, station pressure and wind direction/speed (instantaneous values) measured initially via an automatic weather station (AWS)
2. Irradiance (S) and Standard Deviation (σ)
Mean values calculated from seven reference irradiances for each measurement series and the related standard deviation
3. Elevation Angle (θ), Optical Air Mass (m)
Mean values for each measurement series
4. Aerosol Optical Depth (AOD)
Mean values calculated from the aerosol optical depth at 500 nm in each measurement series based on data from a precision filter radiometer (PFR)

29
Appendix D, P. 2
Date T RH SP WS WD θ m AOD(start) (end) (℃) (%) (hPa) (m/s) (degree) (degree)
24 Jan 2017 9:00 - 9:18 -2.1 44.9 954.4 3.3 202.9 934.1 ± 8.6 22.6 2.44 0.039:30 - 9:48 -1.5 42.8 954.5 4.1 209.5 967.2 ± 7.3 26.3 2.11 0.0310:00 - 10:18 -1.0 40.2 954.7 3.8 204.4 991.5 ± 5.9 29.5 1.91 0.0410:30 - 10:48 -0.5 36.7 954.7 3.5 211.2 1002.7 ± 2.8 32.0 1.77 0.0411:00 - 11:18 0.0 31.1 954.7 3.6 217.9 995.6 ± 17.0 33.7 1.69 0.0611:30 - 11:48 0.3 27.7 954.4 3.2 216.9 981.5 ± 21.3 34.5 1.66 0.0712:00 - 12:18 0.5 27.0 953.9 3.9 218.3 915.2 ± 108.8 34.5 1.66 0.0912:30 - 12:48 0.6 31.5 953.6 3.2 212.2 856.0 ± 147.9 33.5 1.70 0.2013:00 - 13:18 0.2 30.8 953.4 3.0 221.6 667.4 ± 106.0 31.7 1.79 0.9413:30 - 13:48 1.1 28.9 953.3 3.3 218.2 921.8 ± 15.3 29.1 1.93 0.1914:00 - 14:18 0.8 28.5 953.4 3.9 224.7 942.7 ± 5.9 25.8 2.15 0.0514:30 - 14:48 1.0 29.9 953.8 3.4 209.4 899.9 ± 7.9 21.9 2.50 0.05
25 Jan 2017 9:00 - 9:18 -0.6 45.6 961.5 3.2 244.3 932.2 ± 7.6 22.7 2.44 0.039:30 - 9:48 0.0 43.4 961.6 3.3 231.4 967.7 ± 5.1 26.5 2.12 0.0310:00 - 10:18 0.5 42.3 961.7 2.5 230.2 982.2 ± 0.6 29.7 1.91 0.0410:30 - 10:48 0.4 43.6 961.8 3.3 243.5 990.6 ± 1.8 32.2 1.77 0.0511:00 - 11:18 1.6 40.5 961.5 3.1 233.0 1001.6 ± 2.8 33.9 1.70 0.0411:30 - 11:48 2.4 39.2 961.2 2.1 217.1 997.6 ± 4.6 34.8 1.66 0.0512:00 - 12:18 2.8 38.8 961.0 1.8 205.1 988.3 ± 4.4 34.7 1.66 0.0612:30 - 12:48 3.3 36.5 960.7 1.6 199.0 966.2 ± 14.0 33.7 1.70 0.0913:00 - 13:18 3.4 34.1 960.6 1.5 194.6 961.5 ± 8.0 31.9 1.79 0.2513:30 - 13:48 2.3 38.3 960.6 1.8 225.6 - ± - 29.3 1.93 1.7014:00 - 14:18 3.0 33.4 960.6 2.1 205.9 902.3 ± 2.2 26.0 2.15 0.4114:30 - 14:48 3.9 31.0 960.7 2.6 203.5 869.8 ± 10.6 22.2 2.49 0.06
26 Jan 2017 9:00 - 9:18 - - - - - 930.7 ± 7.8 22.9 - 0.049:30 - 9:48 - - - - - 961.1 ± 5.8 26.7 - 0.0410:00 - 10:18 - - - - - 975.8 ± 3.7 29.9 - 0.0510:30 - 10:48 4.0 42.8 964.1 1.2 146.2 991.3 ± 2.7 32.4 1.77 0.0511:00 - 11:18 3.8 40.8 963.7 2.0 125.8 999.5 ± 4.5 34.2 1.69 0.0511:30 - 11:48 4.1 38.7 963.2 1.7 134.0 1006.6 ± 7.5 35.0 1.65 0.0512:00 - 12:18 4.1 41.6 962.9 1.8 138.5 999.1 ± 7.2 35.0 1.65 0.0612:30 - 12:48 4.5 39.9 962.7 1.5 150.1 999.7 ± 5.8 34.0 1.69 0.0513:00 - 13:18 4.7 36.3 962.6 1.1 140.6 972.1 ± 4.2 32.2 1.78 0.0613:30 - 13:48 5.0 34.3 962.5 1.0 144.4 946.6 ± 6.3 29.6 1.92 0.0714:00 - 14:18 5.2 34.6 962.5 1.0 152.5 924.1 ± 6.3 26.3 2.14 0.0714:30 - 14:48 4.8 33.6 962.6 1.1 124.0 881.0 ± 9.8 22.4 2.48 0.07
S±σ
(W/m2)
Time

30
Appendix D, P. 3
Date T RH SP WS WD θ m AOD
(start) (end) (℃) (%) (hPa) (m/s) (degree) (degree)
28 Jan 2017 9:00 - 9:18 4.4 44.3 961.4 0.8 157.1 924.6 ± 6.2 23.3 2.39 0.04
9:30 - 9:48 4.9 45.9 961.5 0.9 190.0 949.1 ± 8.5 27.1 2.07 0.04
10:00 - 10:18 5.7 43.9 961.4 1.0 182.3 970.1 ± 6.2 30.4 1.87 0.05
10:30 - 10:48 6.1 43.1 961.4 1.0 192.1 990.9 ± 4.6 32.9 1.74 0.04
11:00 - 11:18 6.6 40.2 961.0 1.1 172.4 1002.6 ± 6.9 34.6 1.66 0.05
11:30 - 11:48 7.5 37.2 960.8 1.0 187.9 997.6 ± 3.7 35.5 1.63 0.05
12:00 - 12:18 8.0 35.5 960.4 1.2 186.3 998.9 ± 5.0 35.5 1.63 0.05
12:30 - 12:48 8.5 32.5 960.2 1.4 214.2 981.2 ± 4.9 34.5 1.67 0.06
13:00 - 13:18 8.7 30.6 960.1 1.3 192.7 967.6 ± 4.5 32.7 1.75 0.06
13:30 - 13:48 8.9 30.4 960.4 1.0 177.1 938.4 ± 6.8 30.1 1.88 0.07
14:00 - 14:18 9.0 34.0 960.2 1.6 206.4 913.5 ± 5.9 26.8 2.09 0.07
14:30 - 14:48 8.7 34.1 960.4 1.2 176.4 873.5 ± 12.2 22.9 2.42 0.07
31 Jan 2017 9:00 - 9:18 1.5 38.7 955.9 0.8 177.2 916.0 ± 4.4 23.9 2.32 0.05
9:30 - 9:48 1.7 40.1 956.3 1.2 160.2 930.5 ± 3.3 27.8 2.02 0.06
10:00 - 10:18 2.3 38.6 956.6 1.4 176.4 957.4 ± 2.5 31.1 1.82 0.06
10:30 - 10:48 2.8 35.7 956.8 1.3 182.1 973.3 ± 8.9 33.6 1.70 0.06
11:00 - 11:18 3.6 34.5 956.6 1.3 184.8 973.4 ± 4.5 35.4 1.62 0.07
11:30 - 11:48 3.5 33.1 956.6 1.5 167.1 990.0 ± 1.9 36.3 1.59 0.06
12:00 - 12:18 3.8 31.0 956.7 1.2 172.7 980.0 ± 2.3 36.3 1.59 0.07
12:30 - 12:48 4.0 31.2 956.3 1.4 200.5 963.5 ± 8.1 35.3 1.63 0.07
13:00 - 13:18 4.3 29.4 956.1 1.2 175.6 950.7 ± 3.6 33.5 1.70 0.07
13:30 - 13:48 5.1 28.2 956.0 1.2 171.2 931.5 ± 6.9 30.9 1.83 0.07
14:00 - 14:18 4.9 27.8 956.3 1.2 176.4 886.0 ± 9.2 27.5 2.03 0.08
14:30 - 14:48 4.9 27.8 956.5 1.0 159.3 843.9 ± 13.6 23.6 2.34 0.08
(W/m2)
Time S±σ
31
Appendix E
Attendee group Photo
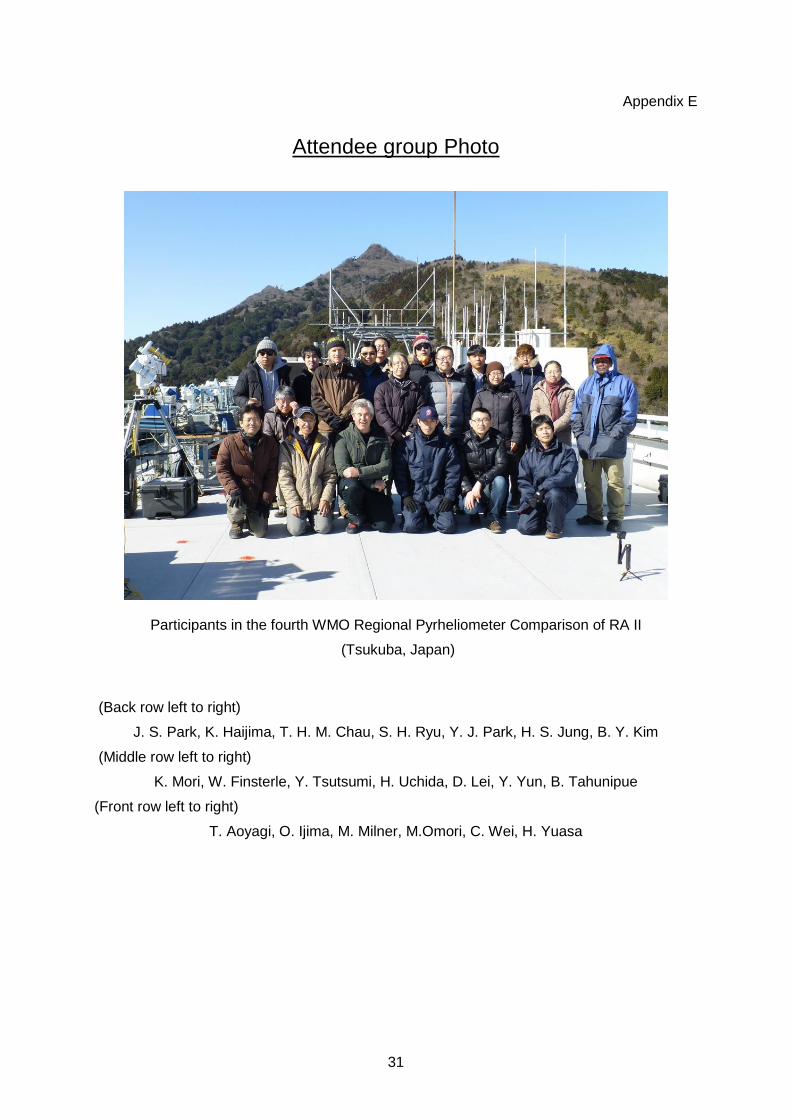
Participants in the fourth WMO Regional Pyrheliometer Comparison of RA II
(Tsukuba, Japan)
(Back row left to right)
J. S. Park, K. Haijima, T. H. M. Chau, S. H. Ryu, Y. J. Park, H. S. Jung, B. Y. Kim
(Middle row left to right)
K. Mori, W. Finsterle, Y. Tsutsumi, H. Uchida, D. Lei, Y. Yun, B. Tahunipue
(Front row left to right)
T. Aoyagi, O. Ijima, M. Milner, M.Omori, C. Wei, H. Yuasa

32
Appendix F
Activities of the Regional Radiation Centre, Tokyo
1964 Pyrheliometer Intercomparison : India - Japan (Pune, India)
1965 Regional Radiation Centre Established (RA II Res.20, CIMO IV Rec.1,3,9)
1968 Pyrheliometer Intercomparison : Thailand - Japan (Tsukuba, Japan)
1970 Attendance at IPC-III (WRC/Davos, Switzerland)
1975 Attendance at IPC-IV (WRC/Davos, Switzerland)
Pyrheliometer Intercomparison : China - Japan (Tsukuba, Japan)
1980 Attendance at IPC-V (WRC/Davos, Switzerland)
1983 Pyrheliometer Intercomparison : Hong Kong - Japan (Tsukuba, Japan)
1985 Attendance at IPC-VI (WRC/Davos, Switzerland)
1989 RPC-I : Regional Pyrheliometer Comparison: RA II & RA V (Tsukuba, Japan)
1990 Join in IPC-VII (WRC/Davos, Switzerland)
1994 Reference Pyranometer Calibration : Thailand (Tsukuba, Japan)
1995 Pyrheliometer Intercomparison : China - Japan (Tsukuba, Japan)
Reference Pyranometer Calibration : Korea (Tsukuba, Japan)
Attendance at IPC-VIII (WRC/Davos, Switzerland)
1996 Pyrheliometer calibration training : Korea (Tsukuba, Japan)
1997 Pyrheliometer Intercomparison : Hong Kong & Korea - Japan (Tsukuba, Japan)
Reference Pyranometer Calibration training : Philippines (Tsukuba, Japan)
2000 Attendance at IPC-IX (WRC/Davos, Switzerland)
2002 Pyrheliometer Intercomparison : Hong Kong, China & Korea - Japan (Tsukuba,
Japan)
2005 Attendance at IPC-X (WRC/Davos, Switzerland)
2007 RPC-II : Regional Pyrheliometer Comparison: RA II (Tsukuba, Japan)
2010 Attendance at IPC-XI (WRC/Davos, Switzerland)
2012 RPC-III : Regional Pyrheliometer Comparison: RA II (Tsukuba, Japan)
2015 Attendance at IPC-XII (WRC/Davos, Switzerland)
2017 RPC-IV : Regional Pyrheliometer Comparison: RA II and RA V (Tsukuba, Japan)
33
Part I I
CALIBRATION OF REFERENCE PYRANOMETERS
1. INTRODUCTION
Calibration of Hong Kong’s pyranometer (CMP6, No. 070713) and Korea’s pyranometers (CMP22, No. 090081 and CMP22, No. 160428) was jointly carried out during the period of the Regional Pyrheliometer Comparison of RA II and RA V (27 January – 2 February, 2017).
2. METHOD OF CALIBRATION AND DATA ACQUISITION
Calibration was performed using the collimation tube method, in which the target pyranometer is attached to the bottom end of a collimation tube (i.e., a long tube with diaphragms) mounted on an automatic sun tracker (see Photo 1). As the optical geometry of the combined system involving the pyranometer and the collimation tube are adjusted to match that of an absolute cavity radiometer (a half opening angle of 2.5 degrees), both instruments can be compared directly using a common radiation source. Voltages from the pyranometer were measured every second. Values measured with the same timing as the reference irradiance were taken as output data for sensitivity calculation. In each series, six sets of output data were acquired with these time intervals.
3. PYRANOMETER CALIBRATION FACTOR DEFINITION
In this study, the pyranometer calibration factor was defined as the irradiance sensitivity based on the following formula:
S = Vth/K
where:
S irradiance [W m-2]
Vth output of pyranometer [mV]
4. DATA EVALUATION PROCEDURE
The WRR reduction factor for the pyranometer was determined by applying the same evaluation procedures for pyrheliometers described in Section 7, Part I.

34
5. CALIBRATION RESULTS
Instrument
Current
WRR Reduction
Factor
Ratio Standard
Deviation
Number
of
Data
New
Sensitivity
Change
Ratio
of Sensitivity
CMP6
No. 070713
Hong Kong
0.9822
K:0.01654mVW-1m
2
(Lijiang,China, 2009)
0.994177 0.001092 84 0.001644 mVW-1m
2 -0.61%
CMP22
No. 090081
Korea
0.981253
K:0.00981mVW-1m
2
(RPC-RAII 3rd, 2012)
1.000343 0.001018 112 0.00981 mVW-1m
2 ±0.00%
CMP22
No. 160428
Korea
-
K:0.00868mVW-1m
2
(Kipp&Zonen, 2016)
1.029341 0.000547 113 0.00893 mVW-1m
2 +2.80%
The measurement values for each instrument are listed in Appendix G. A plot of the calibration results is shown in Appendix H. The scatter plots show the sensitivities to the reference irradiances, and the histograms show the distribution of these sensitivities for each pyranometer. The number of data along with the average and standard deviations of the sensitivities are also shown.
Photo 1 The collimation tube/pyranometer combination. A pyranometer was attached to the bottom end of the tube.

35
Appendix G, P. 1
36
Appendix G, P. 2

37
Appendix H

For more information, please contact:
World Meteorological Organization7 bis, avenue de la Paix – P.O. Box 2300 – CH 1211 Geneva 2 – Switzerland
Communication and Public Affairs Office
Tel.: +41 (0) 22 730 83 14/15 – Fax: +41 (0) 22 730 81 71
E-mail: [email protected]
public.wmo.int