Embed Size (px)
Citation preview
1
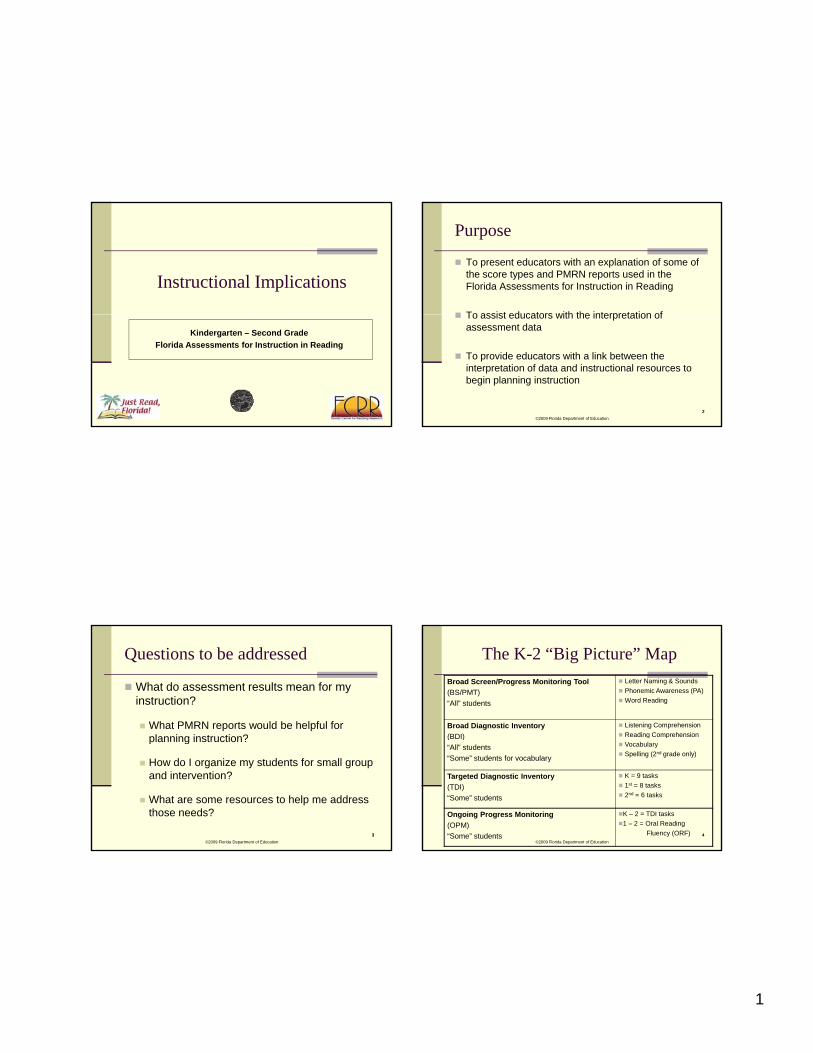
Instructional Implications
©2009 Florida Department of Education
11
Kindergarten – Second Grade
Florida Assessments for Instruction in Reading
Purpose
To present educators with an explanation of some of the score types and PMRN reports used in the Florida Assessments for Instruction in Reading
To assist educators with the interpretation of
©2009 Florida Department of Education
2
To assist educators with the interpretation of assessment data
To provide educators with a link between the interpretation of data and instructional resources to begin planning instruction
2
Questions to be addressed
What do assessment results mean for my instruction?
What PMRN reports would be helpful for planning instruction?
©2009 Florida Department of Education
3
planning instruction?
How do I organize my students for small group and intervention?
What are some resources to help me address those needs?
3
The K-2 “Big Picture” Map
Broad Screen/Progress Monitoring Tool
(BS/PMT)
“All” students
Letter Naming & Sounds
Phonemic Awareness (PA)
Word Reading
Broad Diagnostic Inventory
(BDI)
Listening Comprehension
Reading Comprehension
©2009 Florida Department of Education
4
(BDI)
“All” students
“Some” students for vocabulary
g p
Vocabulary
Spelling (2nd grade only)
Targeted Diagnostic Inventory
(TDI)
“Some” students
K = 9 tasks
1st = 8 tasks
2nd = 6 tasks
Ongoing Progress Monitoring
(OPM)
“Some” students
K – 2 = TDI tasks
1 – 2 = Oral Reading
Fluency (ORF) 4
2
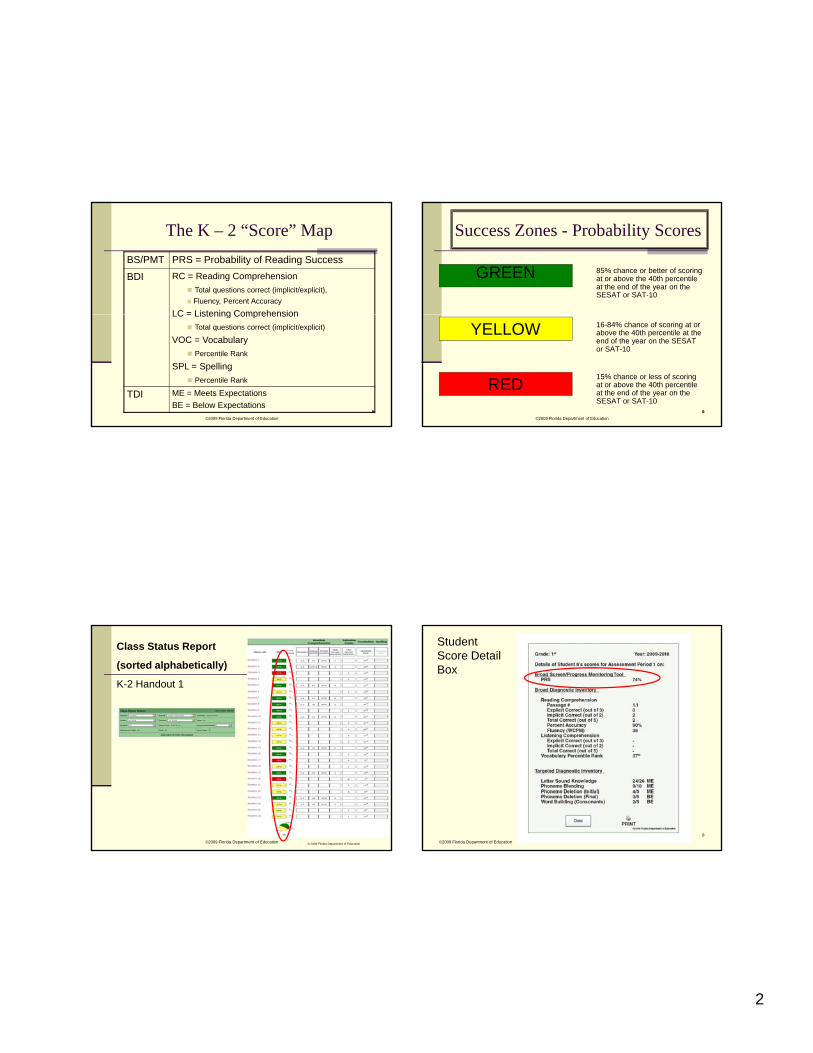
The K – 2 “Score” Map
BS/PMT PRS = Probability of Reading Success
BDI RC = Reading Comprehension
Total questions correct (implicit/explicit),
Fluency, Percent Accuracy
LC = Listening Comprehension
©2009 Florida Department of Education
5
LC = Listening Comprehension
Total questions correct (implicit/explicit)
VOC = Vocabulary
Percentile Rank
SPL = Spelling
Percentile Rank
TDI ME = Meets Expectations
BE = Below Expectations5
Success Zones - Probability Scores
GREEN 85% chance or better of scoring at or above the 40th percentile at the end of the year on the SESAT or SAT-10
©2009 Florida Department of Education
6
16-84% chance of scoring at or above the 40th percentile at the end of the year on the SESAT or SAT-10
15% chance or less of scoring at or above the 40th percentile at the end of the year on the SESAT or SAT-10
6
YELLOW
RED
Class Status Report
(sorted alphabetically)
K-2 Handout 1
©2009 Florida Department of Education
7
© 2009 Florida Department of Education
Student Score Detail Box
8
©2009 Florida Department of Education
3
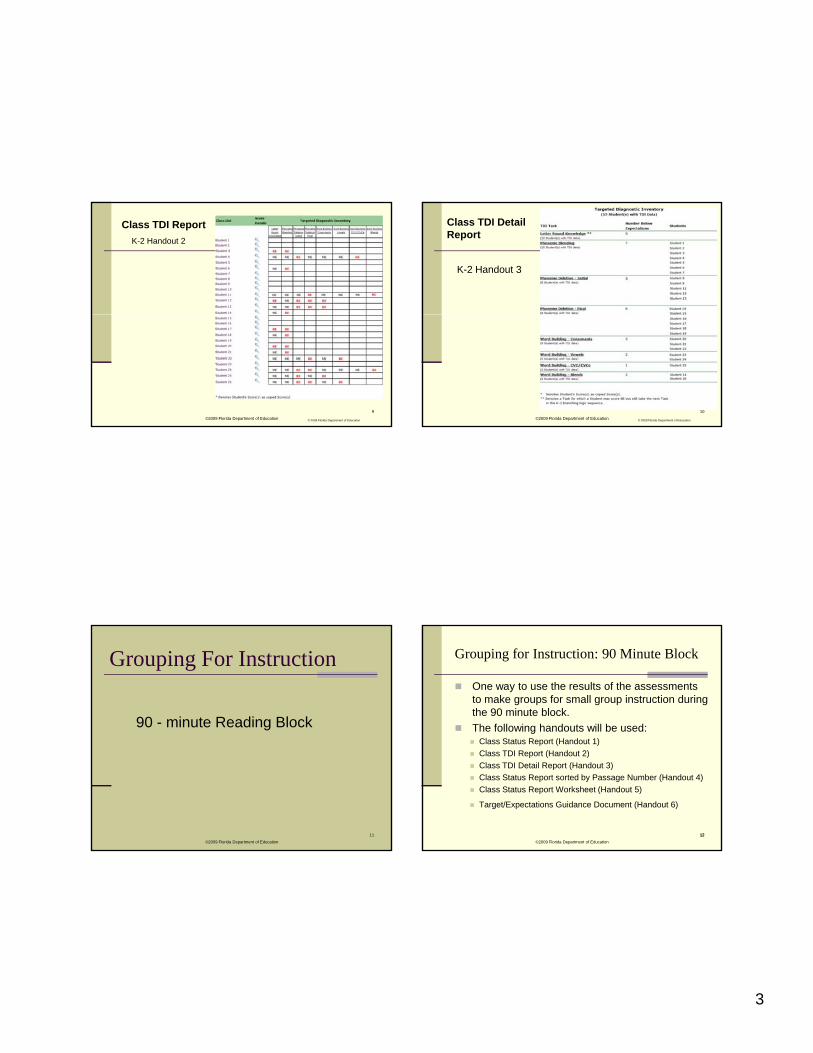
Class TDI Report
K-2 Handout 2
©2009 Florida Department of Education
9
© 2009 Florida Department of Education
Class TDI Detail Report
K-2 Handout 3
©2009 Florida Department of Education
10
© 2009 Florida Department of Education
Grouping For Instruction
90 - minute Reading Block
©2009 Florida Department of Education
11
Grouping for Instruction: 90 Minute Block
One way to use the results of the assessments to make groups for small group instruction during the 90 minute block.
The following handouts will be used:
©2009 Florida Department of Education
12
Class Status Report (Handout 1)
Class TDI Report (Handout 2)
Class TDI Detail Report (Handout 3)
Class Status Report sorted by Passage Number (Handout 4)
Class Status Report Worksheet (Handout 5)
Target/Expectations Guidance Document (Handout 6)
12
4
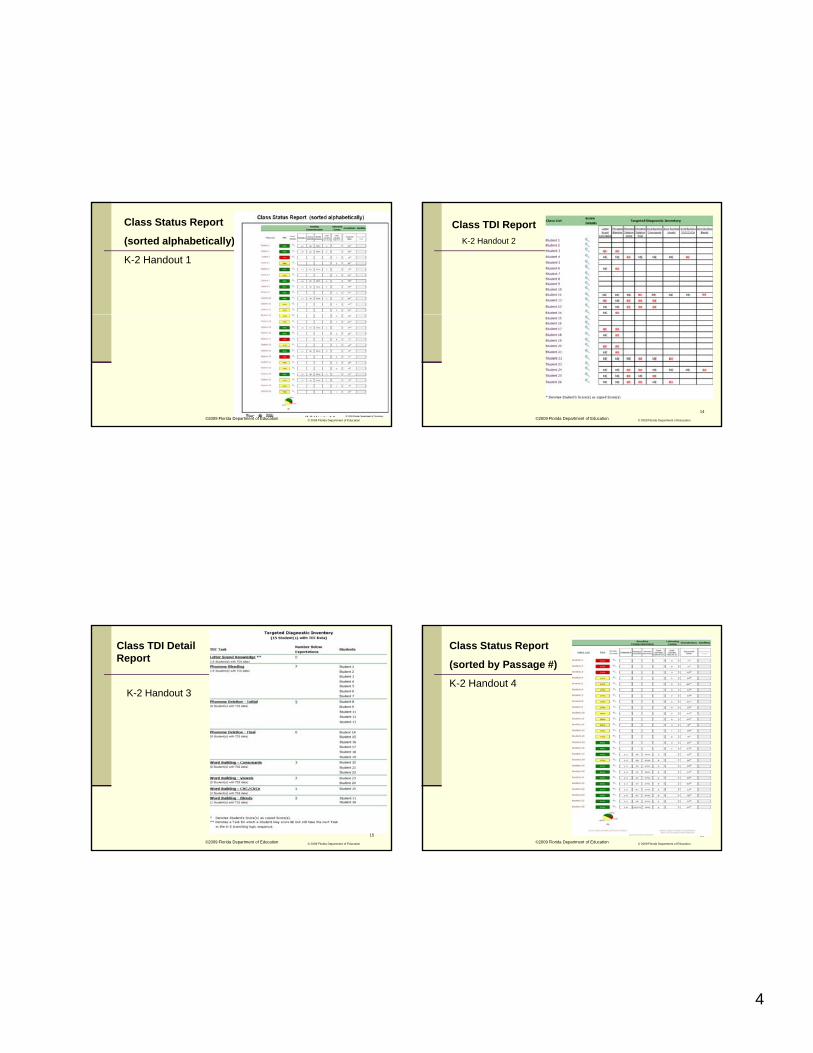
Class Status Report
(sorted alphabetically)
K-2 Handout 1
©2009 Florida Department of Education
13
© 2009 Florida Department of Education
Class TDI Report
K-2 Handout 2
©2009 Florida Department of Education
14
© 2009 Florida Department of Education
Class TDI Detail Report
K-2 Handout 3
©2009 Florida Department of Education
15
© 2009 Florida Department of Education
Class Status Report
(sorted by Passage #)
K-2 Handout 4
©2009 Florida Department of Education
16
© 2009 Florida Department of Education
5
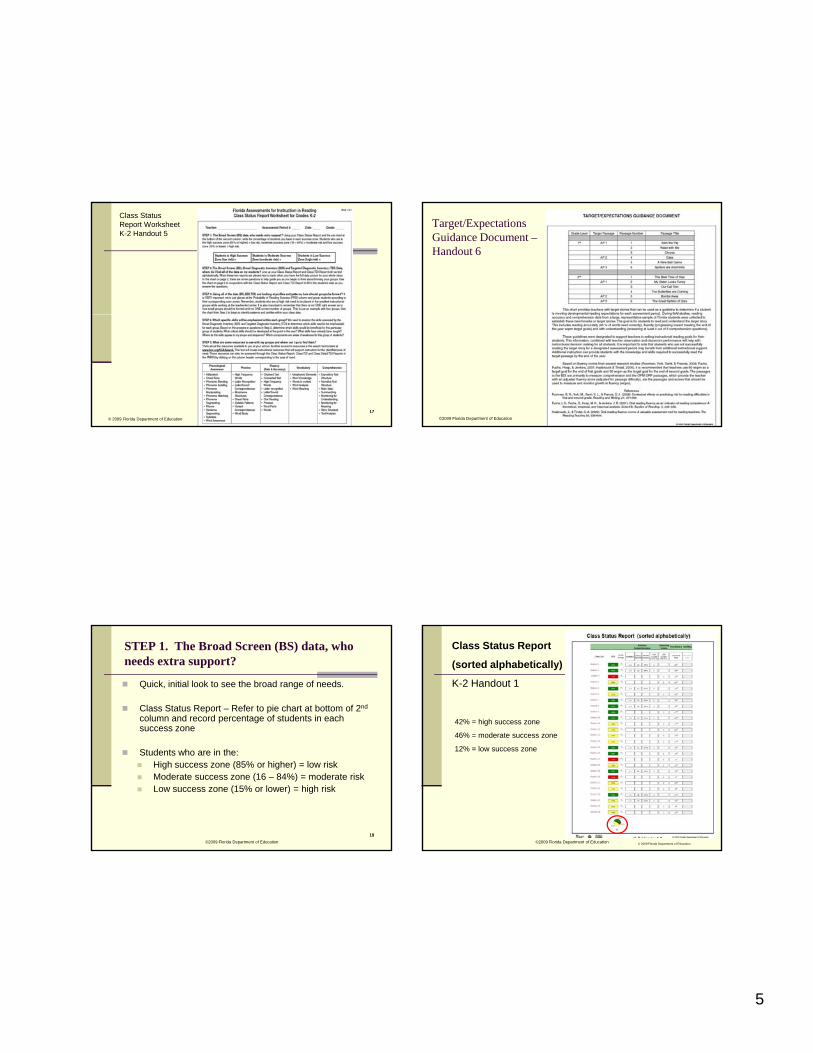
Class Status Report Worksheet K-2 Handout 5
©2009 Florida Department of Education
1717
© 2009 Florida Department of Education
Target/Expectations Guidance Document –Handout 6
©2009 Florida Department of Education
STEP 1. The Broad Screen (BS) data, who needs extra support?
Quick, initial look to see the broad range of needs.
Class Status Report – Refer to pie chart at bottom of 2nd
column and record percentage of students in each success zone
©2009 Florida Department of Education
19
Students who are in the: High success zone (85% or higher) = low risk Moderate success zone (16 – 84%) = moderate risk Low success zone (15% or lower) = high risk
19
Class Status Report
(sorted alphabetically)
K-2 Handout 1
42% = high success zone
46% = moderate success zone
©2009 Florida Department of Education
20
© 2009 Florida Department of Education
%
12% = low success zone
6
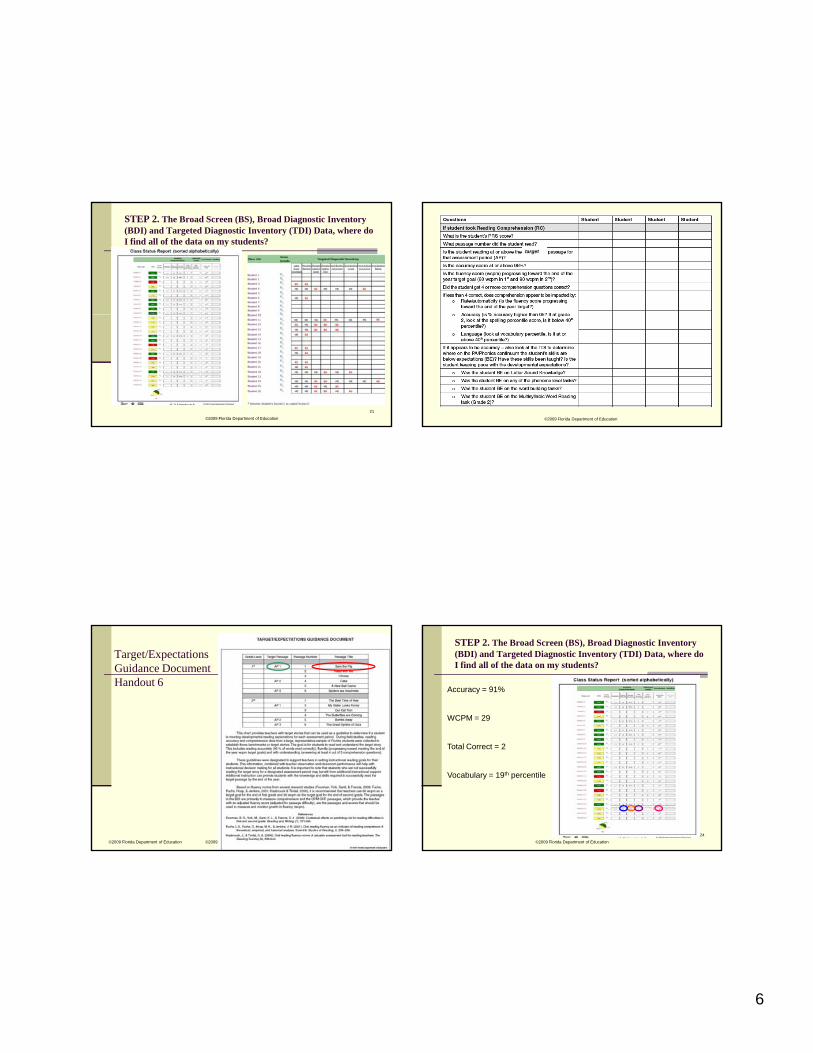
STEP 2. The Broad Screen (BS), Broad Diagnostic Inventory (BDI) and Targeted Diagnostic Inventory (TDI) Data, where do I find all of the data on my students?
©2009 Florida Department of Education
21
target
©2009 Florida Department of Education
Target/Expectations Guidance Document Handout 6
©2009 Florida Department of Education
23
©2009 Florida Department of Education
STEP 2. The Broad Screen (BS), Broad Diagnostic Inventory (BDI) and Targeted Diagnostic Inventory (TDI) Data, where do I find all of the data on my students?
Accuracy = 91%
WCPM = 29
©2009 Florida Department of Education
24
Total Correct = 2
Vocabulary = 19th percentile
7
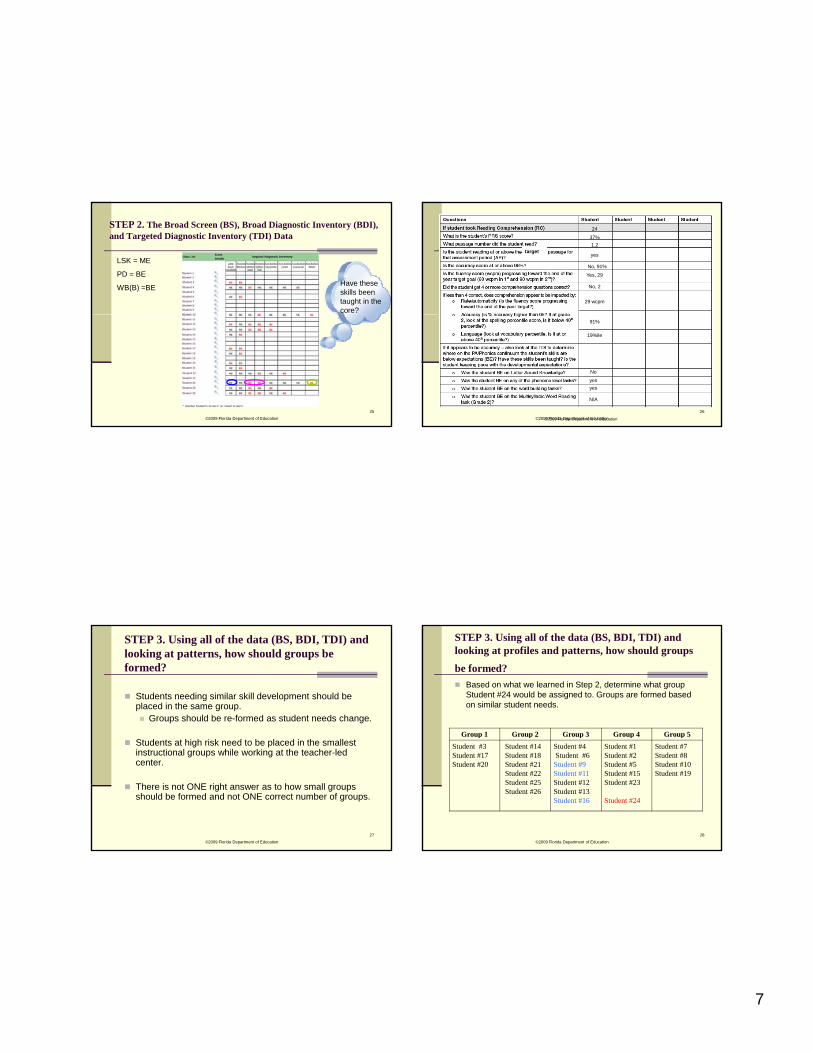
STEP 2. The Broad Screen (BS), Broad Diagnostic Inventory (BDI), and Targeted Diagnostic Inventory (TDI) Data
LSK = ME
PD = BE
WB(B) =BEHave these skills been taught in the core?
©2009 Florida Department of Education
25
target
24
37%
1.2
yes
No, 91%
Yes, 29
No, 2
29 wcpm
©2009 Florida Department of Education
26
©2009 Florida Department of Education
91%
19%ile
N/A
yes
yes
No
STEP 3. Using all of the data (BS, BDI, TDI) and looking at patterns, how should groups be formed?
Students needing similar skill development should be placed in the same group. Groups should be re-formed as student needs change.
©2009 Florida Department of Education
27
Students at high risk need to be placed in the smallest instructional groups while working at the teacher-led center.
There is not ONE right answer as to how small groups should be formed and not ONE correct number of groups.
STEP 3. Using all of the data (BS, BDI, TDI) and looking at profiles and patterns, how should groups
be formed?
Based on what we learned in Step 2, determine what group Student #24 would be assigned to. Groups are formed based on similar student needs.
Group 1 Group 2 Group 3 Group 4 Group 5
©2009 Florida Department of Education
28
p p p p p
Student #3Student #17Student #20
Student #14Student #18Student #21Student #22Student #25Student #26
Student #4Student #6Student #9 Student #11Student #12Student #13Student #16
Student #1Student #2Student #5Student #15 Student #23
Student #24
Student #7Student #8Student #10Student #19
8
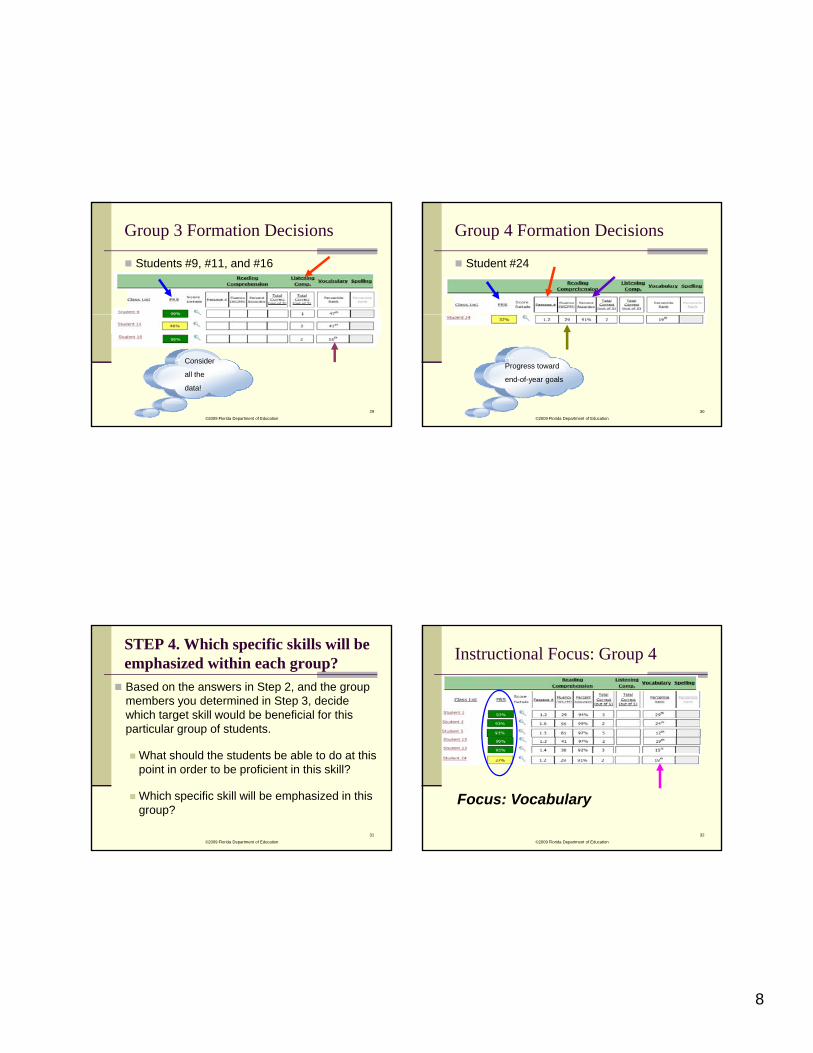
Group 3 Formation Decisions
Students #9, #11, and #16
©2009 Florida Department of Education
29
Consider
all the
data!
Group 4 Formation Decisions
Student #24
©2009 Florida Department of Education
30
Progress toward
end-of-year goals
STEP 4. Which specific skills will be emphasized within each group?
Based on the answers in Step 2, and the group members you determined in Step 3, decide which target skill would be beneficial for this particular group of students.
©2009 Florida Department of Education
31
What should the students be able to do at this point in order to be proficient in this skill?
Which specific skill will be emphasized in this group?
Instructional Focus: Group 4
©2009 Florida Department of Education
32
Focus: Vocabulary
9
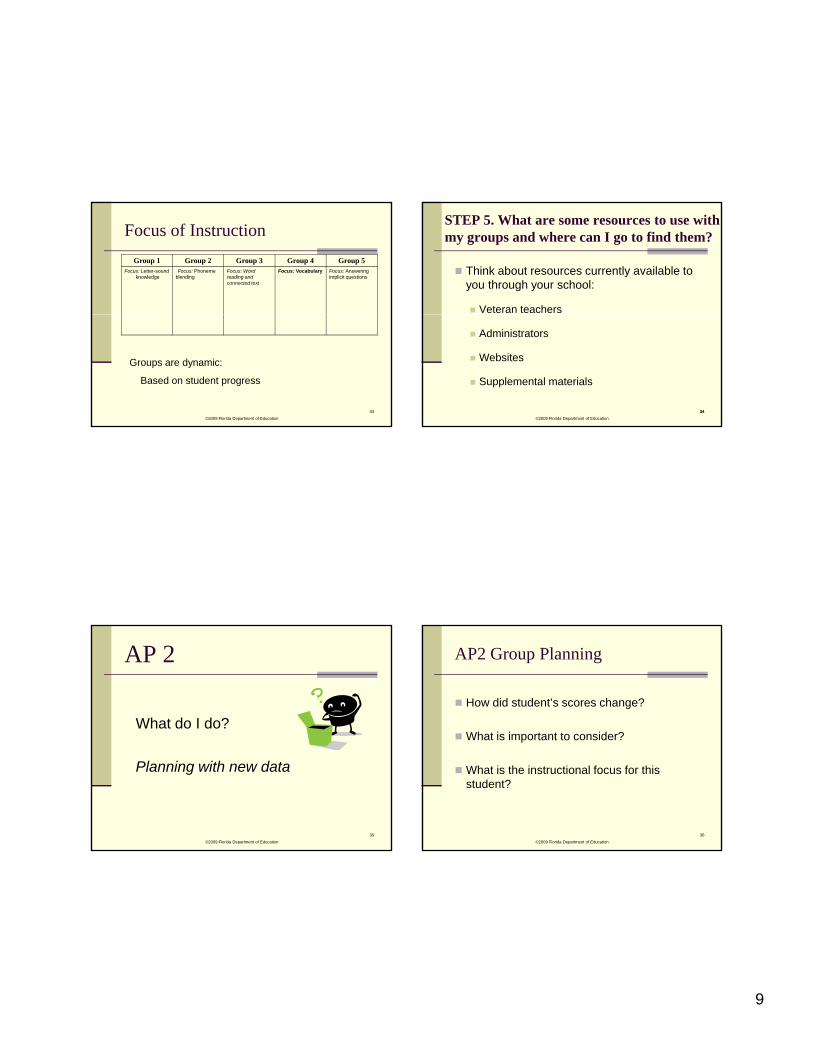
Focus of Instruction
Group 1 Group 2 Group 3 Group 4 Group 5Focus: Letter-sound
knowledgeFocus: Phoneme
blendingFocus: Word reading and connected text
Focus: Vocabulary Focus: Answering implicit questions
©2009 Florida Department of Education
33
Groups are dynamic:
Based on student progress
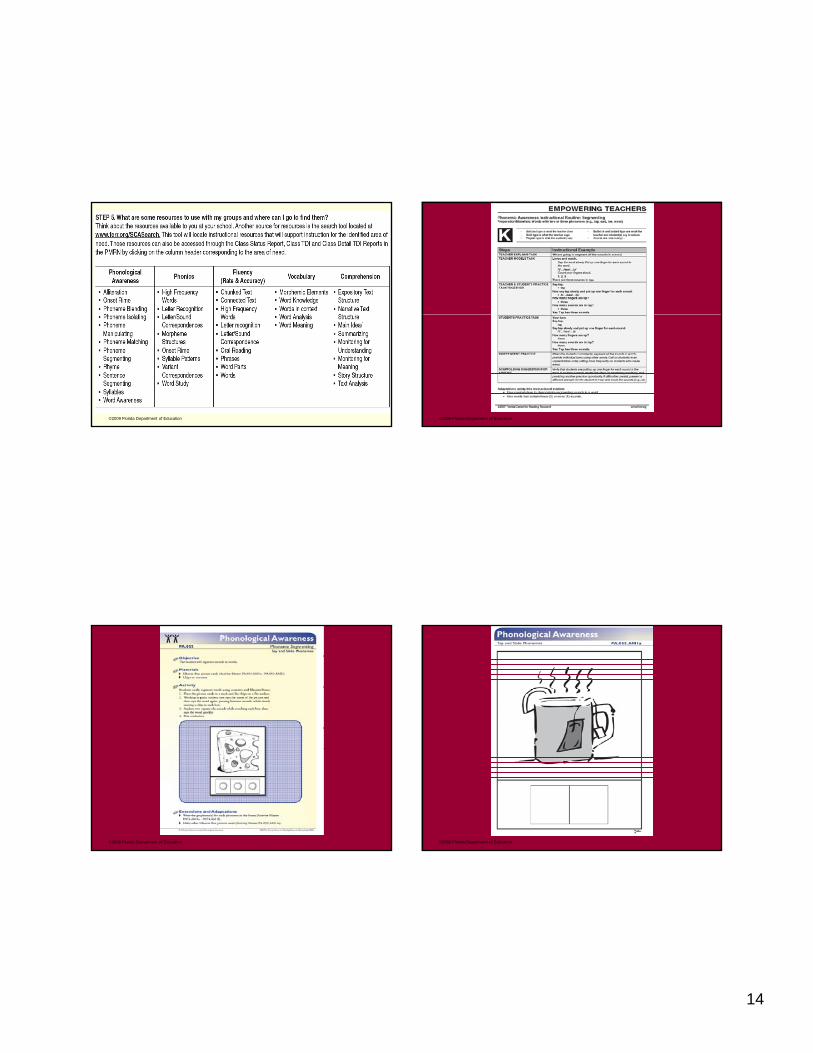
STEP 5. What are some resources to use with my groups and where can I go to find them?
Think about resources currently available to you through your school:
Veteran teachers
©2009 Florida Department of Education
34
Administrators
Websites
Supplemental materials
34
AP 2
What do I do?
©2009 Florida Department of Education
35
Planning with new data
AP2 Group Planning
How did student’s scores change?
What is important to consider?
©2009 Florida Department of Education
36
What is important to consider?
What is the instructional focus for this student?
10
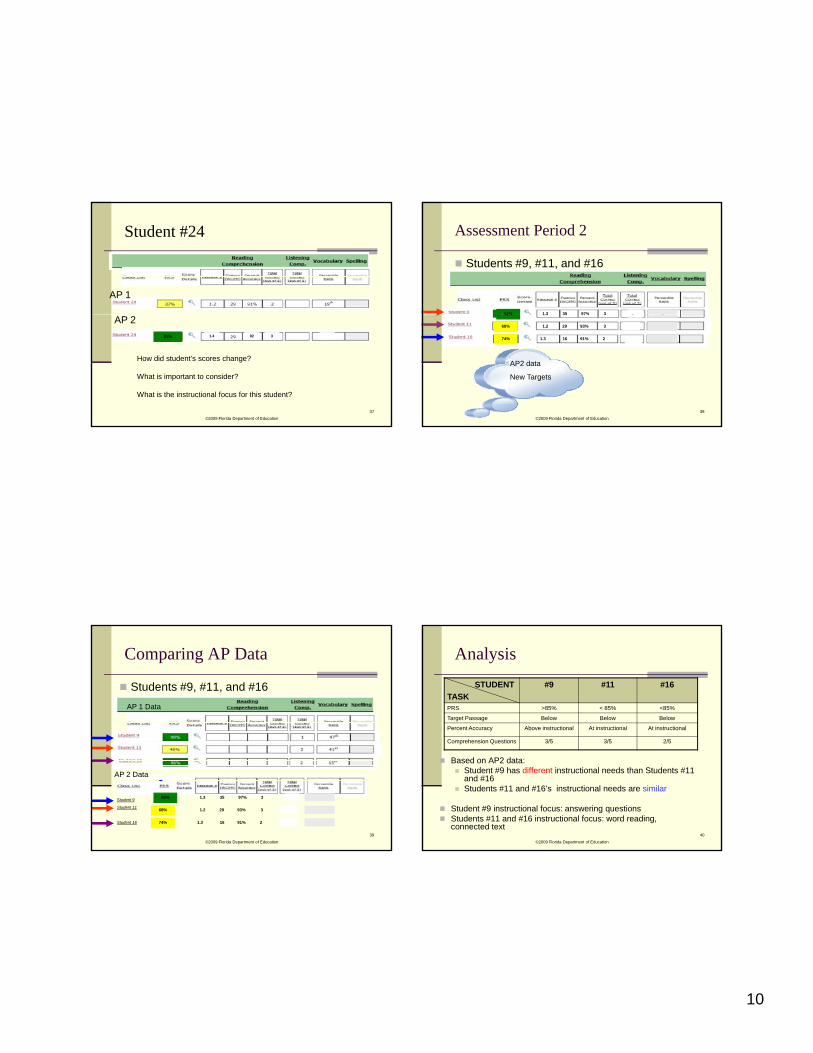
Student #24
AP 1
©2009 Florida Department of Education
37
85% 1.4 92 3
AP 2
How did student’s scores change?
What is important to consider?
What is the instructional focus for this student?
Assessment Period 2
Students #9, #11, and #16
92% 1 3 35 97% 3
©2009 Florida Department of Education
38
AP2 data
New Targets
74% 1.3 16 91% 2
68%
92%
1.2 93%29 3
1.3 35 97% 3
Comparing AP Data
Students #9, #11, and #16
AP 1 Data
©2009 Florida Department of Education
39
74% 1.3 16 91% 2
68%
92%
1.2 93%29 3
1.3 35 97% 3Student 9
Student 11
Student 16
AP 2 Data
Analysis
STUDENT
TASK
#9 #11 #16
PRS >85% < 85% <85%
Target Passage Below Below Below
Percent Accuracy Above instructional At instructional At instructional
©2009 Florida Department of Education
40
Based on AP2 data: Student #9 has different instructional needs than Students #11
and #16 Students #11 and #16’s instructional needs are similar
Student #9 instructional focus: answering questions Students #11 and #16 instructional focus: word reading,
connected text
Comprehension Questions 3/5 3/5 2/5
11
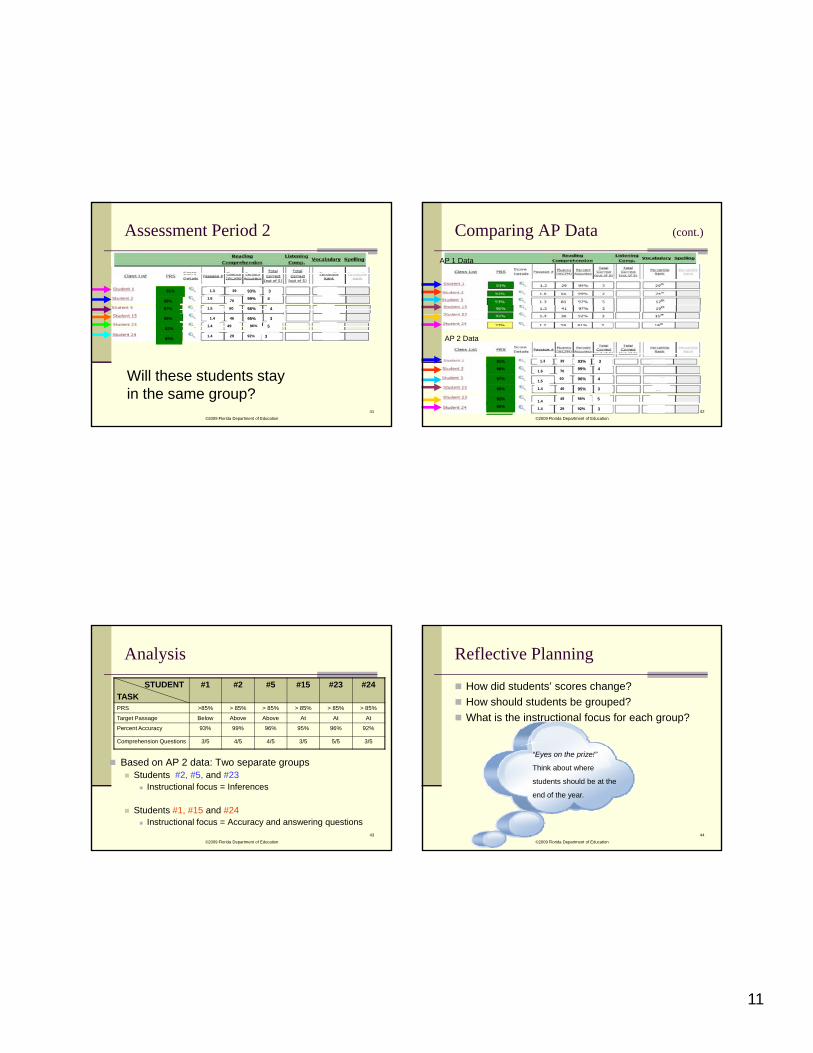
Assessment Period 2
4
3
4
93%
99%
96%
1.670
60
83%
97%
98%
1.3 39
1.5
91%
©2009 Florida Department of Education
41
Will these students stay in the same group?
3
5
3
95%
96%
92%
46
49
2985%
92%
95% 1.4
1.4
1.4
Comparing AP Data (cont.)
AP 1 Data
©2009 Florida Department of Education
42
393%83%
85%
1.3 39
4
4
3
5
3
99%
96%
95%
96%
92%
1.6 70
60
46
49
29
92%
95%
97%
98%
1.5
1.4
1.4
1.4
91%
AP 2 Data
85%
Analysis
STUDENT
TASK
#1 #2 #5 #15 #23 #24
PRS >85% > 85% > 85% > 85% > 85% > 85%
Target Passage Below Above Above At At At
Percent Accuracy 93% 99% 96% 95% 96% 92%
©2009 Florida Department of Education
43
Based on AP 2 data: Two separate groups Students #2, #5, and #23
Instructional focus = Inferences
Students #1, #15 and #24 Instructional focus = Accuracy and answering questions
Comprehension Questions 3/5 4/5 4/5 3/5 5/5 3/5
Reflective Planning
How did students’ scores change?
How should students be grouped?
What is the instructional focus for each group?
©2009 Florida Department of Education
44
“Eyes on the prize!”
Think about where
students should be at the
end of the year.
12
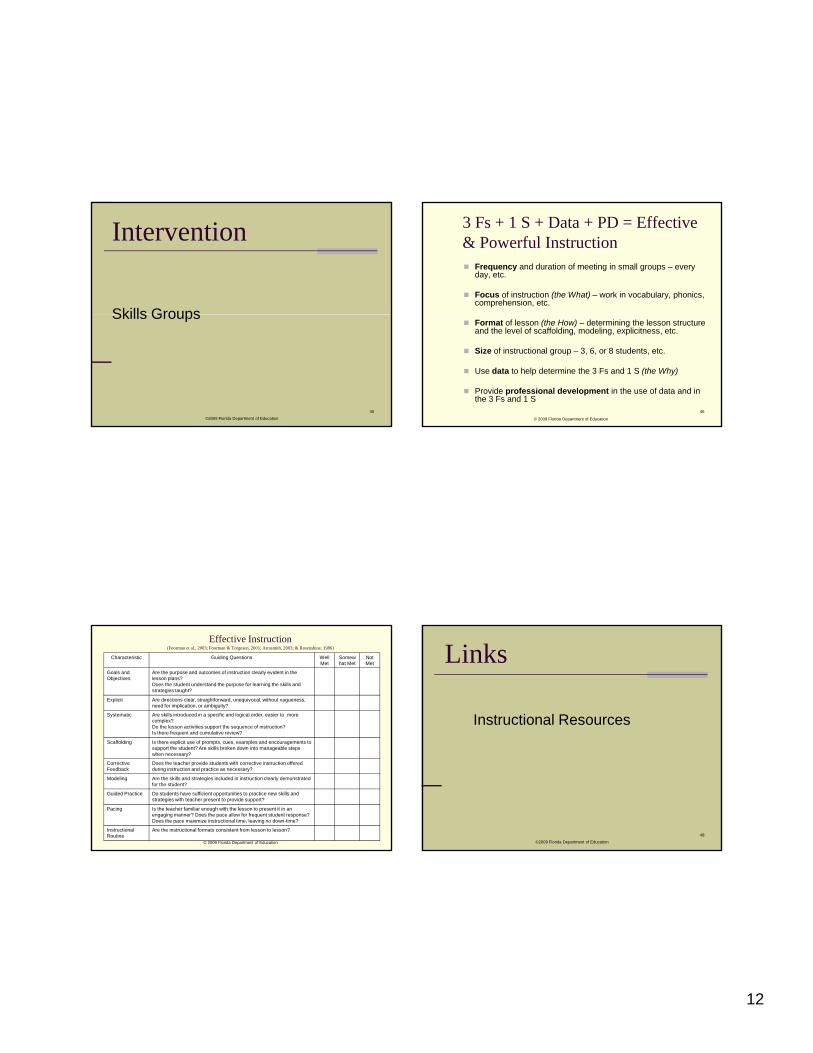
Intervention
Skills Groups
©2009 Florida Department of Education
45
Skills Groups
3 Fs + 1 S + Data + PD = Effective & Powerful Instruction Frequency and duration of meeting in small groups – every
day, etc.
Focus of instruction (the What) – work in vocabulary, phonics, comprehension, etc.
Format of lesson (the How) – determining the lesson structure and the level of scaffolding, modeling, explicitness, etc.
Size of instructional group – 3, 6, or 8 students, etc.
Use data to help determine the 3 Fs and 1 S (the Why)
Provide professional development in the use of data and in the 3 Fs and 1 S
46
© 2009 Florida Department of Education
Effective Instruction(Foorman et al., 2003; Foorman & Torgesen, 2001; Arrasmith, 2003; & Rosenshine, 1986)
Characteristic Guiding Questions Well Met
Somewhat Met
Not Met
Goals and Objectives
Are the purpose and outcomes of instruction clearly evident in the lesson plans? Does the student understand the purpose for learning the skills and strategies taught?
Explicit Are directions clear, straightforward, unequivocal, without vagueness, need for implication, or ambiguity?
Systematic Are skills introduced in a specific and logical order, easier to more complex? Do the lesson activities support the sequence of instruction? Is there frequent and cumulative review?
Scaffolding Is there explicit use of prompts, cues, examples and encouragements to support the student? Are skills broken down into manageable steps when necessary?
Corrective Feedback
Does the teacher provide students with corrective instruction offered during instruction and practice as necessary?
Modeling Are the skills and strategies included in instruction clearly demonstrated for the student?
Guided Practice Do students have sufficient opportunities to practice new skills and strategies with teacher present to provide support?
Pacing Is the teacher familiar enough with the lesson to present it in an engaging manner? Does the pace allow for frequent student response?Does the pace maximize instructional time, leaving no down-time?
Instructional Routine
Are the instructional formats consistent from lesson to lesson?
© 2009 Florida Department of Education
Links
Instructional Resources
©2009 Florida Department of Education
48
13
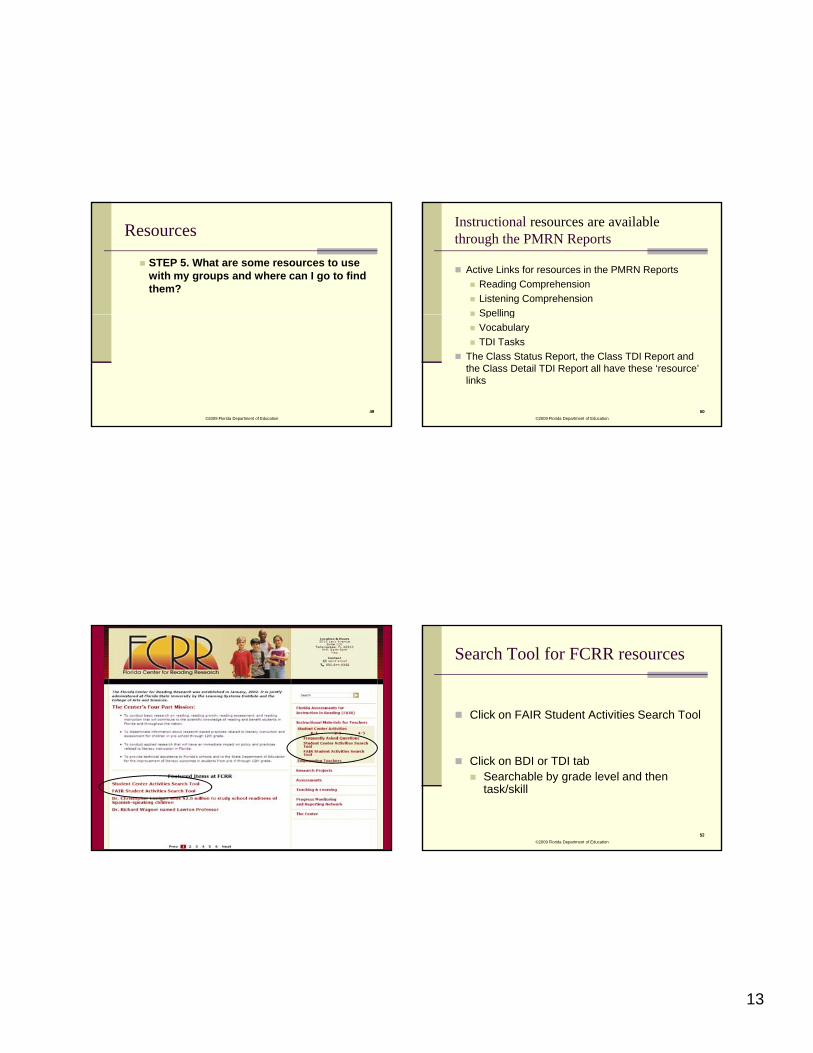
Resources
STEP 5. What are some resources to use with my groups and where can I go to find them?
©2009 Florida Department of Education
4949
Instructional resources are available through the PMRN Reports
Active Links for resources in the PMRN Reports
Reading Comprehension
Listening Comprehension
Spelling
©2009 Florida Department of Education
50
Spelling
Vocabulary
TDI Tasks
The Class Status Report, the Class TDI Report and the Class Detail TDI Report all have these ‘resource’ links
50
Search Tool for FCRR resources
Click on FAIR Student Activities Search Tool
©2009 Florida Department of Education
52
Click on BDI or TDI tab Searchable by grade level and then
task/skill
52
14
©2009 Florida Department of Education ©2009 Florida Department of Education
©2009 Florida Department of Education ©2009 Florida Department of Education
15
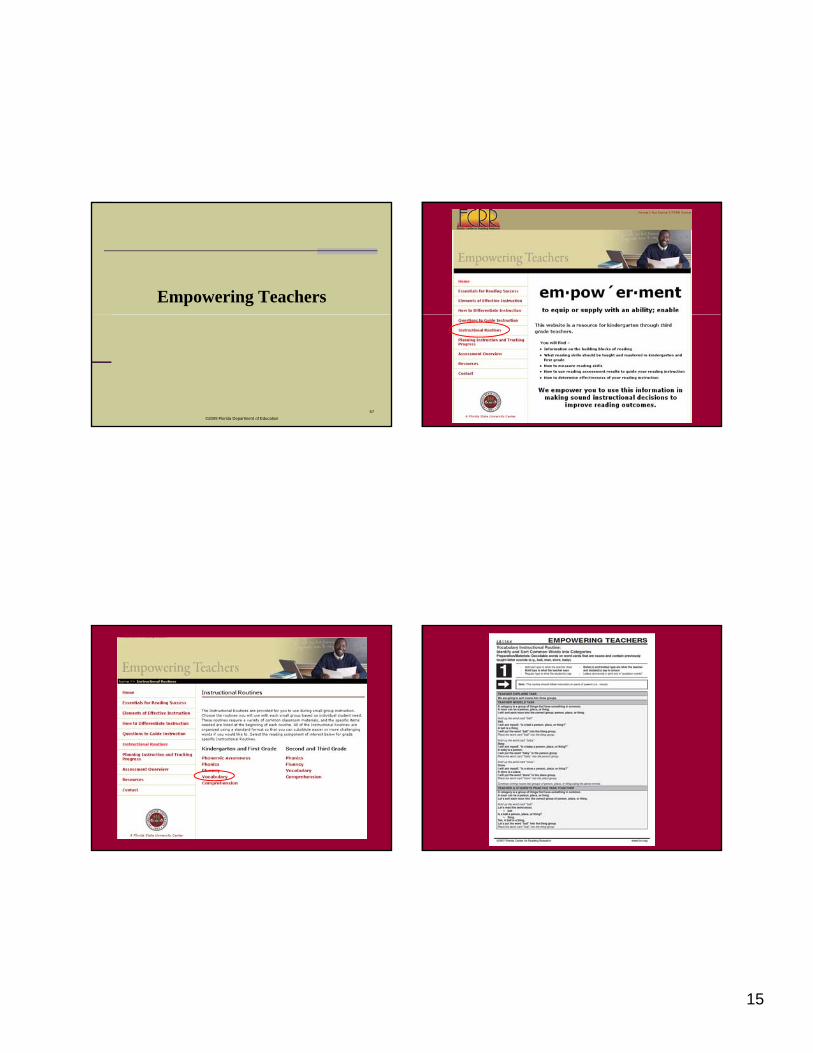
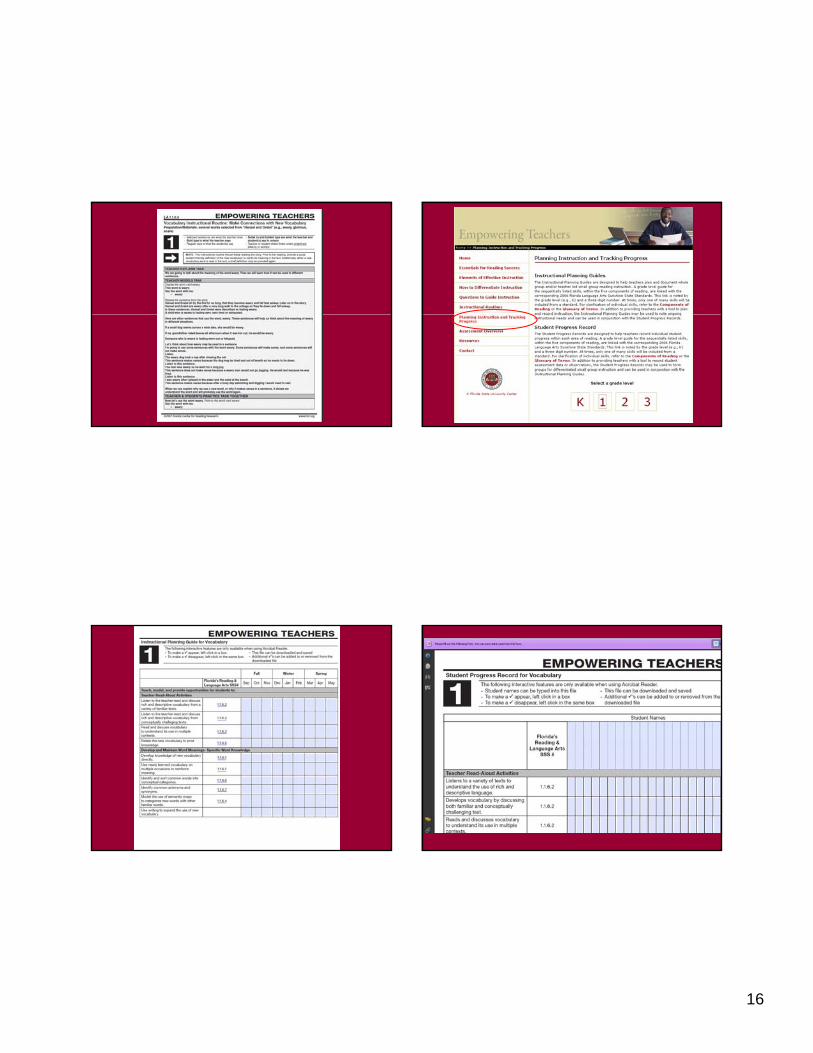
Empowering Teachers
©2009 Florida Department of Education
57
16
17
Student Center Activities (SCAs)
©2009 Florida Department of Education
65
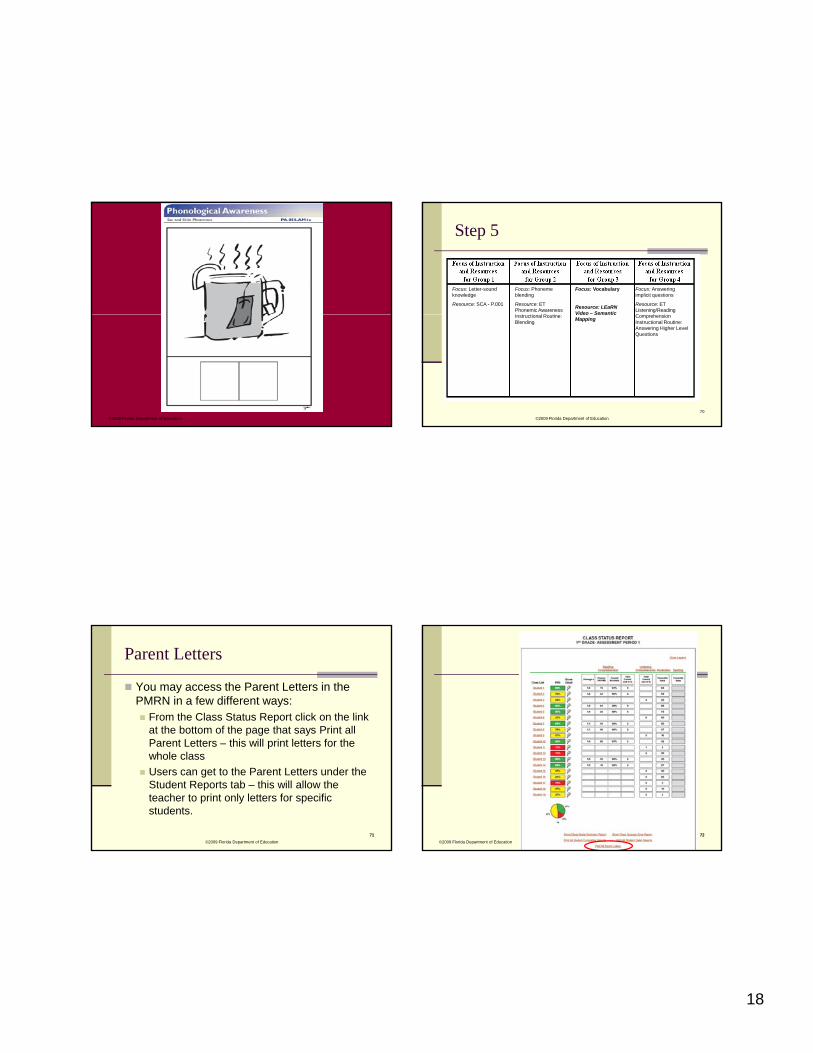
Teacher Resource Guide and Professional Development DVD
Explains how to prepare and implement student centers
©2009 Florida Department of Education
66
student centers
Provides specific details about the activities
©2009 Florida Department of Education ©2009 Florida Department of Education
18
©2009 Florida Department of Education
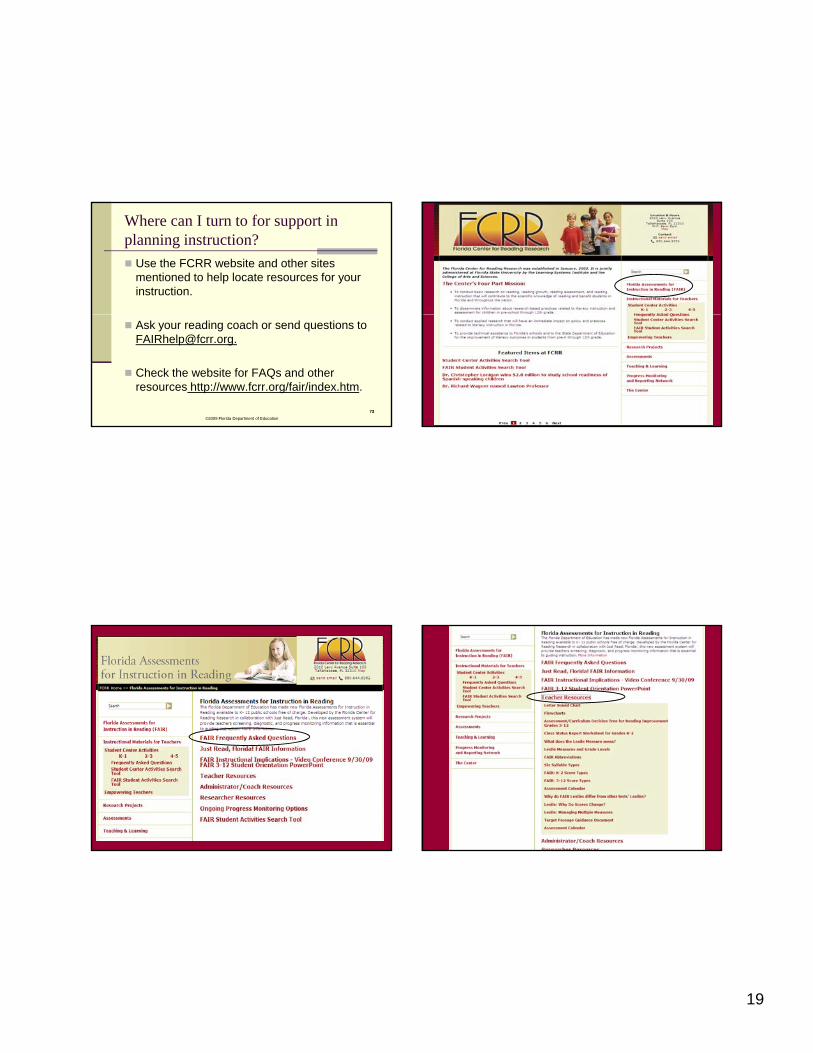
Step 5
Focus: Vocabulary
Resource: LEaRN Video – Semantic
Focus: Phoneme blending
Resource: ET Phonemic Awareness I t ti l R ti
Focus: Letter-sound knowledge
Resource: SCA - P.001
Focus: Answering implicit questions
Resource: ET Listening/Reading C h i
©2009 Florida Department of Education
70
Video Semantic Mapping
Instructional Routine: Blending
Comprehension Instructional Routine: Answering Higher Level Questions
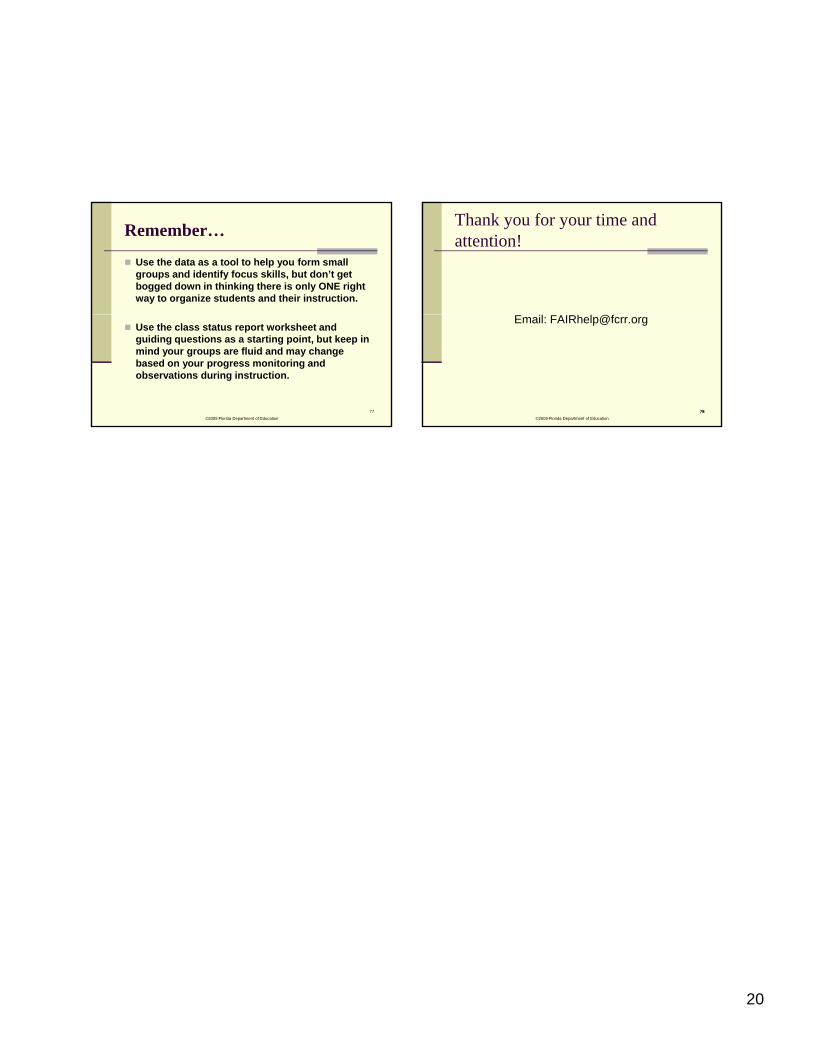
Parent Letters
You may access the Parent Letters in the PMRN in a few different ways: From the Class Status Report click on the link
at the bottom of the page that says Print all
©2009 Florida Department of Education
71
Parent Letters – this will print letters for the whole class
Users can get to the Parent Letters under the Student Reports tab – this will allow the teacher to print only letters for specific students.
71
©2009 Florida Department of Education
7272
©2009 Florida Department of Education
19
Where can I turn to for support in planning instruction?
Use the FCRR website and other sites mentioned to help locate resources for your instruction.
©2009 Florida Department of Education
73
Ask your reading coach or send questions to [email protected].
Check the website for FAQs and other resources http://www.fcrr.org/fair/index.htm.
73
20
Remember…
Use the data as a tool to help you form small groups and identify focus skills, but don’t get bogged down in thinking there is only ONE right way to organize students and their instruction.
©2009 Florida Department of Education
77
Use the class status report worksheet and guiding questions as a starting point, but keep in mind your groups are fluid and may change based on your progress monitoring and observations during instruction.
Thank you for your time and attention!
©2009 Florida Department of Education
78
Email: [email protected]
78