Embed Size (px)
Citation preview

1
FAIR-FS
© 2014 Florida State University. All Rights Reserved.
Florida Assessments for Instruction in Reading,
Aligned to the Language Arts Florida Standards
FAIR – FS
Kindergarten to Grade 2
Technical Manual
Barbara R. Foorman, Ph.D.
Yaacov Petscher, Ph.D.
Chris Schatschneider, Ph.D.
Florida Center for Reading Research
Florida State University

2
FAIR-FS | Acknowledgements
© 2014 Florida State University. All Rights Reserved.
Acknowledgements
The items, dynamic flow, computer-adaptive algorithms, creation of the development application, and
psychometric work for this component skills battery (called the Florida Center for Reading Research
Reading Assessment; FRA) were funded by grants from the Institute of Education Sciences (IES) to
Florida State University:
Institute of Education Sciences, USDOE ($4,447,990), entitled “Assessing Reading for Understanding: A
Theory-Based, Developmental Approach,” subcontract to the Educational Testing Service for five
years (R305F100005), 7/1/10-6/30/15 (Foorman, PI on subcontract).
Institute of Education Sciences, USDOE (R305A100301; $1,499,741), entitled “Measuring Reading
Progress in Struggling Adolescents,” awarded for four years, 3/1/10-2/28/14. (Foorman, PI;
Petscher and Schatschneider, Co-Is).
The Florida State University licensed the FRA to the Florida Department of Education at no cost in
perpetuity in 2012. We would like to acknowledge the following individuals for their leadership in to
executing the work funded by the above two IES grants: Dr. Adrea Truckenmiller, Karl Hook, and Nathan
Day. We also would like to thank the numerous school districts, administrators, and teachers who
participated in the research funded by these two grants.
For the purpose of this technical manual, we refer to the portions of the FRA licensed to the Florida
Department of Education as the Florida Assessments for Instruction in Reading, Aligned to the Language
Arts Florida Standards (FAIR-FS). With the exception of the fixed-order, diagnostic tasks, all components
are owned by Florida State University.

3
FAIR-FS | Table of Contents
© 2014 Florida State University. All Rights Reserved.
Table of Contents
Acknowledgements .............................................................................................................................. 2
Introduction ............................................................................................................................................ 4
Mastering the Alphabetic Principle ........................................................................................................... 4
Comprehending Written Language (better known as Reading Comprehension) ..................................... 5
Summary of FAIR-FS Constructs and Tasks ............................................................................................... 6
Description of the Tasks in the FAIR-FS ..................................................................................................... 7
Screening Tasks ......................................................................................................................................... 7
Comprehension Tasks ............................................................................................................................... 8
Diagnostic Tasks ........................................................................................................................................ 8
Description of Method ......................................................................................................................... 9
Description of Calibration Sample ............................................................................................................. 9
Item Response Theory ............................................................................................................................... 9
Guidelines for Retaining Items ................................................................................................................ 11
Linking Design & Item Response Analytic Framework ............................................................................ 12
Norming Studies ...................................................................................................................................... 13
Score Definitions ..................................................................................................................................... 13
Reliability ............................................................................................................................................... 15
Marginal Reliability ................................................................................................................................. 15
Standard Error of Measurement ............................................................................................................. 16
Test-Retest Reliability.............................................................................................................................. 17
Validity .................................................................................................................................................... 19
Predictive Validity ................................................................................................................................... 19
Differential Accuracy of Prediction ......................................................................................................... 21
Construct Validity .................................................................................................................................... 24
References ............................................................................................................................................. 27
4
FAIR-FS | Introduction
© 2014 Florida State University. All Rights Reserved.
Introduction
The first question to ask when designing an assessment of reading and language skills is, “What predicts
success in comprehending written language, that is, success in word reading and in reading
comprehension?” We are fortunate to have several consensus documents that review decades of
literature about what predicts reading success (NRC, 1998; NICHD, 2000; NIFL, 2008; Rand, 2002;
Rayner, Foorman, Perfetti, Pesetsky, & Seidenberg, 2001).
Mastering the Alphabetic Principle
What matters the most to success in reading words in an alphabetic orthography such as English is
mastering the alphabetic principle, the insight that speech can be segmented into discrete units (i.e.,
phonemes) that map onto orthographic (i.e., graphemic) units (Ehri, Nunes, Willows, et al., 2001; Rayner
et al., 2001). Oral language is acquired largely in a natural manner within a hearing/speaking
community; however, written language is not acquired naturally because the graphemes and their
relation to phonological units in speech are invented and must be taught by literate members of the
community. The various writing systems (i.e., orthographies) of the world vary in the transparency of
the sound-symbol relation. Among alphabetic orthographies, the Finnish orthography is highly
transparent: phonemes in speech relate to graphemes in print (i.e., spelling) in a highly consistent one-
to-one manner. Similarly graphemes in print relate to phonemes in speech (i.e., decoding) in a highly
consistent one-to-one manner. Thus, learning to spell and read Finnish is relatively easy. English,
however, is a more opaque orthography. Phonemes often relate to graphemes in an inconsistent
manner and graphemes relate to phonemes in yet a different inconsistent manner. For example, if we
hear the “long sound of a” we can think of words with many different vowel spellings, such as crate,
brain, hay, they, maybe, eight, great, vein. If we see the orthographic unit –ough, we may struggle with
the various pronunciations of cough, tough, though, bough. The good news is that 69% of monosyllabic
English words—those Anglo-Saxon words most used in beginning reading instruction—are consistent in
their letter to pronunciation mapping (Ziegler, Stone, & Jacobs, 1997). Most of the rest can be learned
with grapheme-phoneme correspondence rules (i.e., phonics), with only a small percentage of words
being so irregular in their letter-sound relations that they should be taught as sight words (Ehri, Nunes,
Stahl, & Willows, 2001; Foorman & Connor, 2011).
In the FAIR-FS, the alphabetic principle is assessed in grades K-2 with individually-administered tasks
that measure letter-sound knowledge, phonological awareness, ability to link sounds to letters, word
reading, word building, and spelling tasks. All Screening tasks are computer-adaptive, with 5 items
presented at grade level before the system adapts to easier or more difficult items based on student
ability, and with the teacher scoring the responses as correct or incorrect. In kindergarten, the Screening
tasks consist of asking students: 1) to name the sound of letters presented on the computer monitor; 2)
to blend sounds pronounced by the computer into words; and, 3) at the end of the year, to read simple
words presented on the computer monitor. In grades 1 and 2 the Screening task consists of a computer-
adaptive word list where students pronounce a word presented on the computer monitor. Also, in grade

5
FAIR-FS | Introduction
© 2014 Florida State University. All Rights Reserved.
2, students use the keyboard to spell the word pronounced by the computer and used in a sentence.
Score reports include students’ misspellings. The administration manual includes a guide for analyzing
errors . If K-2 students’ performance on the Screening tasks is predicted to be below the 40th percentile
on the Stanford Achievement Tests (SESAT Word Reading in kindergarten and reading comprehension in
grades 1-2), they go on to take Diagnostic tasks, which are computer-administered but scored on a
mastery criteria. The skills that are assessed progress from print awareness, to 26 letter names and 29
letter-sounds (including three digraphs), to deleting initial and final sounds and matching them to the
correct letters, to phonological blending and deletion, to building words in CVC, CVCe, CVCC, and CCVC
patterns, to reading multisyllabic words.
Comprehending Written Language (better known as Reading Comprehension)
Knowledge of word meanings. Mastering the alphabetic principle is a necessary, but not
sufficient, condition for understanding written text. We may be able to pronounce printed words, but if
we don’t know their meaning our comprehension of the text is likely to be impeded. Hence, our
knowledge of word meanings is crucial to comprehending what we read. Grasping the meaning of a
word is more than knowing its definition in a particular passage. Knowing the meaning of a word means
knowing its full lexical entry in a dictionary: pronunciation, spelling, multiple meanings in a variety of
contexts, synonyms, antonyms, idiomatic use, related words, etymology, and morphological structure.
For example, a dictionary entry for the word exacerbate says that it is a verb meaning: 1) to increase the
severity, bitterness, or violence of (disease, ill feeling, etc.); aggravate or 2) to embitter the feelings of (a
person); irritate; exasperate (e.g., foolish words that only exacerbated the quarrel). It comes from the
Latin word exacerbātus (the past participle of exacerbāre: to exasperate, provoke), equivalent to ex +
acerbatus (acerbate). Synonyms are: intensify, inflame, worsen, embitter. Antonyms are: relieve, sooth,
alleviate, assuage. Idiomatic equivalents are: add fuel to the flame, fan the flames, feed the fire, or pour
oil on the fire. The more a reader knows about the meaning of a word like exacerbate, the greater the
lexical quality the reader has and the more likely the reader will be able to recognize the word quickly in
text, with full comprehension of its meaning (Perfetti & Stafura, 2014). In the FAIR-FS, knowledge of
word meanings is measured in grades kindergarten through grade 2 by a word matching task called
Vocabulary Pairs. The child’s task is to click on the two out of three words (or pictures) named by the
computer that go together (e.g., blue, triangle, yellow).
Syntactic awareness. In addition to understanding word meanings, another important aspect
of academic language is syntactic awareness. Syntax or grammar refers to the rules that govern how
words are ordered to make meaningful sentences. Children typically acquire these rules in their native
language prior to formal schooling. However, learning to apply these rules to reading and writing is a
goal of formal schooling and takes years of instruction and practice. In the FAIR-FS, there are two tasks
in kindergarten through grade 2 that address syntax. One is called Following Directions and requires that
the student click on the objects pictured on the computer monitor and drag them to new locations on
the monitor (e.g., click on the cat and then click on the heart; click on the book after clicking on the
airplane; before clicking on the book, click on the smallest cat). The other task is called Sentence

6
FAIR-FS | Introduction
© 2014 Florida State University. All Rights Reserved.
Comprehension and requires that the student listen to a sentence and point to one of four pictures
which best represents the sentence (e.g., point to the picture of the bird flying away from the nest).
Reading comprehension. If a student can read and understand the meanings of printed words
and sentences, then comprehending text should not be difficult, given the emphasis above on achieving
the alphabetic principle, lexical quality, and syntactic awareness. Individual differences in readers’
background knowledge, motivation, and memory and attention will create variability in word
recognition skills, vocabulary knowledge, and syntactic awareness and this variability, in turn, will create
variability in reading comprehension. Furthermore, genre differences—informational or literary text—
may interact with reader skills to affect reading comprehension. For example, some students may have
better inferential language skills so critical to comprehending informational text; other students may
have better narrative language skills of discerning story structure and character motivation and,
therefore, be good comprehenders of literary text. Because reading comprehension is affected by the
interactions of variables related to reader and text characteristics (RAND, 2002), tests of reading
comprehension typically consist of informational and literary passages and provide as much relevant
background information within the passage as possible.
In grades K-2, students are placed into listening or reading comprehension passages based on their
performance on the Screening tasks. Because texts are necessarily short in length for primary-grade
children, the number of questions the teacher can ask is limited to five. Given the limited number of
questions asked and the dominance of other component reading skills predicting success in early
reading, the listening and reading comprehension questions are administered for qualitative/descriptive
and formative purposes only. Teachers may also note students’ miscues and capture their oral reading
fluency on the computer while students read the reading comprehension passage. Narrative and
informational texts are written with attention to the features of text complexity in primary-grade text,
such as word structure, word meanings, and syntactic features within and across sentences (Foorman,
Francis, Davidson, Harm, & Griffin, 2004; Foorman, 2009; Fitzgerald et al., 2014). The final sequencing of
the text is based on empirical data based on field-testing the passages with students in grades K-2.
Summary of FAIR-FS Constructs and Tasks
The grades K-2 FAIR-FS consists of computer-adaptive alphabetic and oral language screening tasks that
provide a Probability of Literacy Success (PLS) linked to grade-level performance (i.e., the 40th percentile)
on the word reading (in kindergarten) or reading comprehension (in grades 1-2) subtests of the Stanford
Achievement Test (SESAT; SAT-10) in 2014-2015. When data from the Florida Standards Assessments
become available, the PLS will be linked to this also.. The PLS score also places students in a reading
comprehension passage in grades K-12 or a listening comprehension passage for nonreaders. Thus, the
FAIR-FS provides universal screening and Diagnostic tasks in a precise and efficient computer-adaptive
framework with psychometrics and norms derived from large samples of Florida K-12 students
representative of Florida demographics. Significantly, by including vocabulary pairs and syntax tasks, the
FAIR-FS has excellent construct coverage of oral language, which has been shown to account equally
7
FAIR-FS | Introduction
© 2014 Florida State University. All Rights Reserved.
(i.e., 66.5% in grade 1 and 62% in grade 2) with decoding in explaining variability in reading
comprehension in grades 1-2 (Foorman, Herrera, Petscher, Mitchell, & Truckenmiller, 2014)
Description of the Tasks in the FAIR-FS
In grades K through 2, the FAIR-FS consists of six computer-adaptive tasks which provide unique
information regarding a student’s literacy skills. Each of the Screening tasks below has four stop rules
that determine when administration of each task is complete.
1. A reliable estimate of the student’s abilities is reached (i.e., standard error is less than 0.316).
2. The student has responded to 30 items (29 items in Letter Sounds).
3. The student responds correctly to all of the first 8 items.
4. The student responds incorrectly to all of the first 8 items.
At subsequent administrations of the tasks within the same school year, the student’s prior score on
that task will be used to determine the initial set of items administered to the student at that
administration period.
Screening Tasks
The Phonological Awareness task is a computer adaptive task administered to students in Kindergarten
at Assessment Period 1 (AP1) and Assessment Period 2 (AP2). This task requires students to listen to a
word that has been broken into parts and then blend them together to reproduce the full word. The
items in this task include compound words, words that require blending of the onset and rime, and
words requiring the blending of three or more phonemes.
The Letter Sounds task is a computer adaptive task administered to students in Kindergarten at AP1 and
AP2. A letter (both upper- and lowercase) appears on the computer monitor. The student is asked to
provide the sound that the letter represents (i.e. consonant sounds, short vowel sounds, or sounds of
common consonant diagraphs).
Word Reading is a computer-adaptive task administered to all students in grades 1 and 2 at each
assessment period and to Kindergarten students at the spring assessment period. A word appears on
the computer monitor. The student then attempts to read it aloud. These words represent a wide range
of difficulty from single syllable sight words to multi-syllable words.
The Spelling is a computer-adaptive task administered to all grade 2 students. The computer provides each word and uses it in a sentence. Students respond by using the computer keyboard to spell the word.

8
FAIR-FS | Introduction
© 2014 Florida State University. All Rights Reserved.
The Vocabulary Pairs is a computer adaptive task administered at all three assessment periods in each grade level. Three words appear on the monitor and are pronounced by the computer. The student then selects the two words that go together best (e.g., dark, night, swim).
Following Directions is a computer-adaptive task that requires students to listen and attend as they hear single and multi-step directions. This task is administered at all three assessment periods in each grade level. Items consist of an array of objects on the monitor and a set of audio instructions. Students respond to the directions by clicking on or moving the specified objects on the computer monitor (e.g., put the square in front of the chair and then put the circle behind the chair).
Comprehension Tasks
Listening and Reading Comprehension. All Kindergarten students at AP1 and AP2 are placed
into and take one Listening Comprehension passage. Listening Comprehension is also available for
students who are not able to decode the lowest level of Reading Comprehension passages in the FAIR-FS
bank. Students are placed into a reading comprehension passage based on their performance on the
Word Reading task. Because these passages are necessarily short, there are only five questions
associated with each passage. Rather than asking students to read or listen to at least three passages to
obtain a reliable estimate of comprehension, we encourage teachers to regard the number of questions
answered correctly out of five, the number of words read correctly, and the words read correctly per
minute as qualitative information to be used in conjunction with the student’s classroom performance
to descriptively inform classroom instruction.
Sentence Comprehension Task. The Sentence Comprehension Task is a receptive syntactic
measure in which the student selects the one picture out of the four presented on the computer
monitor that depicts the sentence given by the computer (e.g., click on the picture of the bird flying
towards the nest). This task is computer adaptive and results in an ability score and percentile rank.
Diagnostic Tasks
Students, whose PLS score predicts that they are at-risk of meeting grade level expectations at the end
of the year, go on to take Diagnostic tasks. These computer-administered tasks are criterion-referenced
to developmental expectations for beginning readers and are scored for mastery (i.e., 80% correct). Like
the listening and reading comprehension tasks, these Diagnostic tasks provide descriptive information
that a teacher can use combined with observations of student classroom performance to inform
instruction.

9
FAIR-FS | Description of Method
© 2014 Florida State University. All Rights Reserved.
Description of Method
Description of Calibration Sample
Data collection for the Florida Assessments for Instruction in Reading, Aligned to the Language Art
Florida Standards (FAIR-FS) began by testing item pools for the Screen tasks (i.e., Letter Sounds,
Phonological Awareness, Word Reading, Vocabulary Pairs, and Following Directions). A statewide
representative sample of students that roughly reflected the state’s demographic diversity and
academic ability (N ~ 28,000) was collected on students in Kindergarten through Grade 2.
Item Response Theory
The K-2 data for the FAIR-FS were analyzed using Item Response Theory (IRT). Traditional testing and
analysis of items involves estimating the difficulty of the item (based on the percentage of respondents
correctly answering the item) as well as discrimination (how well individual items relate to overall test
performance). This falls into the realm of measurement known as classical test theory (CTT). While such
practices are commonplace in assessment development, IRT holds several advantages over CTT. When
using CTT, the difficulty of an item depends on the group of individuals on which the data were
collected. This means that if a sample has more students that perform at an above-average level, the
easier the items will appear; but if the sample has more below-average performers, the items will
appear to be more difficult. Similarly, the more that students differ in their ability, the more likely the
discrimination of the items will be high; the more that the students are similar in their ability, the lower
the discrimination will be. One could correctly infer that scores from a CTT approach are entirely
dependent on the makeup of the sample.
The benefits of IRT are such that 1) the difficulty and discrimination are not dependent on the group(s)
from which they were initially estimated, 2) scores describing students’ ability are not related to the
difficulty of the test, 3) shorter tests can be created that are more reliable than a longer test, and 4) item
statistics and the ability of students are reported on the same scale.
Item difficulty. The difficulty of an item has traditionally been described for many tests as a “p-
value”, which corresponds to the percent of respondents correctly answering an item. Values from this
perspective range from 0% to 100% with high values indicating easier items and low values indicating
hard items. Item difficulty in an IRT model does not represent proportion correct, but is rather
represented as estimates along a continuum of -3.0 to +3.0.
Figure 1 demonstrates a sample item characteristic curve which describes item properties from IRT.
Along the x-axis is the ability of the individual. As previously mentioned, the ability of students and item
statistics are reported on the same scale. Thus, the x-axis is a simultaneous representation of student
ability and item difficulty. Negative values along the x-axis will indicate that items are easier, while
positive values describe harder items. Pertaining to students, negative values describe individuals who

10
FAIR-FS | Description of Method
© 2014 Florida State University. All Rights Reserved.
perform below average, while positive values identify students who perform above average. A value of
zero for both students and items reflects average level of either ability or difficulty.
Along the y-axis is the probability of a correct response, which varies across the level of difficulty. Item
difficulty is defined as the value on the x-axis at which the probability of correctly endorsing the item is
0.50. As demonstrated for the sample item in Figure 1, the difficulty of this item would be 0.0. Item
characteristic curves are graphical representations generated for each item that allow the user to see
how the probability of getting the item correct changes for different levels of the x-axis. Students with
an ability of -3.0 would have an approximate 0.01 chance of getting the item correct, while students
with an ability of 3.0 would have a nearly 99% chance of getting an item correct.
Figure 1: Sample Item Characteristic Curve
Item Discrimination. Item Discrimination is related to the relationship between how a student
responds to an item and their subsequent performance on the rest of a test. In IRT it describes the
extent to which an item can differentiate the probability of correctly endorsing an item across the range
of ability (i.e., -3.0 to +3.0). Figure 2 provides an example of how discrimination operates in the IRT
framework. For all three items presented in Figure 2, the difficulty has been held constant at 0.0, while
the discriminations are variable. The dashed line (Item 1) shows an item with strong discrimination, the
solid line (Item 2) represents an item with acceptable discrimination, and the dotted line (Item 3) is
indicative of an item that does not discriminate. It is observed that for Item 3, regardless of the level of
ability for a student, the probability of getting the item right is the same. Both high ability students and
low ability students have the same chance of doing well on this item. Item 1 demonstrates that as the x-
axis increases, the probability of getting the item correct changes as well. Notice that small changes
between -1.0 and +1.0 on the x-axis result in large changes on the y-axis. This indicates that the item
discriminates well among students, and that individuals with higher ability have a greater probability of

11
FAIR-FS | Description of Method
© 2014 Florida State University. All Rights Reserved.
getting the item correct. Item 2 shows that while an increase in ability produces an increase in the
probability of a correct response, the increase is not as large as is observed for Item 1, and is thus a
poorer discriminating item.
Figure 2: Sample Item Characteristic Curves with Varied Discriminations
Guidelines for Retaining Items
Several criteria were used to evaluate item validity. The first process was to identify items which
demonstrated strong floor or ceiling effects in response rates >= 95%. Such items are not useful in
creating an item bank as there is little variability in whether students are successful on the item. In
addition to evaluating the descriptive response rate, we estimated item-total correlations. Items with
negative values are indicative of poor functioning such that it suggests individuals who correctly answer
the question tend to have lower total scores. Similarly, items with low item-total correlations indicate
the lack of a relation between item and total test performance. Items with correlations <.15 were
flagged for removal.
Following the descriptive analysis of item performance, difficulty and discrimination values from the IRT
analyses were used to further identify items which were poorly functioning. Items were flagged for item
revision if the item discrimination was negative or the item difficulty was greater than +4.0 or less than -
4.0. Secondary criteria were used in evaluating the retained items, which was comprised of a differential
item function (DIF) analysis. DIF refers to instances where individuals from different groups with the
same level of underlying ability significantly differ in their probability to correctly endorse an item.
Unchecked, items included in a test which demonstrate DIF will produce biased test results. For the
12
FAIR-FS | Description of Method
© 2014 Florida State University. All Rights Reserved.
FAIR-FS assessments, DIF testing was conducted comparing: Black-White students, Latino-White
students, Black-Latino students, students eligible for Free or Reduced Priced Lunch (FRL) with students
not receiving FRL, and English Language Learner to non-English Language Learner students.
DIF testing was conducted with a multiple indicator multiple cause (MIMIC) analysis in Mplus (Muthén &
Muthén, 2008); moreover, a series of four standardized and expected score effect size measures were
generated using VisualDF software (Meade, 2010) to quantify various technical aspects of score
differentiation between the gender groups. First, the signed item difference in the sample (SIDS) index
was created, which describes the average unstandardized difference in expected scores between the
groups. The second effect size calculated was the unsigned item difference in the sample (UIDS). This
index can be utilized as supplementary to the SIDS. When the absolute value of the SIDS and UIDS values
are equivalent, the differential functioning between groups is equivalent; however, when the absolute
value of the UIDS is larger than SIDS, it provides evidence that the item characteristic curves for
expected score differences cross, indicating that differences in the expected scores between groups
change across the level of the latent ability score. The D-max index is reported as the maximum SIDS
value in the sample, and may be interpreted as the greatest difference for any individual in the sample
in the expected response. Lastly, an expected score standardized difference (ESSD) was generated, and
was computed similar to a Cohen’s (1988) d statistic. As such, it is interpreted as a measure of standard
deviation difference between the groups for the expected score response with values of .2 regarded as
small, .5 as medium, and .8 as large. Items demonstrating DIF were flagged for further study in order to
ascertain why groups with the same latent ability performed differently on the items.
Linking Design & Item Response Analytic Framework
A common-item, non-equivalent groups design was used for collecting data in our pilot, calibration, and
validation studies. A strength of this approach is that it allows for linking multiple test forms via common
items. For each task, a minimum of twenty-percent of the total items within a form were identified as
vertical linking items to create a vertical scale. These items served a dual purpose of not only linking
forms across grades to each other, but also linking forms within grades to each other.
Because the tasks in the FAIR-FS were each designed for vertical equating and scaling, we considered
two primary frameworks for estimating the item parameters: 1) a multiple-group IRT of all test forms or
2) test characteristic curve equating. We chose the latter approach using Stocking and Lord (1983) to
place the items on a common scale. All item analyses were conducted using Mplus software (Muthen &
Muthen, 2008) with a 2pl independent items model. Because the samples used for data collection did
not strictly adhere to the state distribution of demographics (i.e., percent limited English proficiency,
Black, White, Latino, and eligible for free/reduced lunch), sample weights according to student
demographics were used to inform the item and student parameter scores.

13
FAIR-FS | Description of Method
© 2014 Florida State University. All Rights Reserved.
Norming Studies
A total of 27,862 students in grades K-2 across multiple districts in Florida participated in the calibration
and validation studies. These studies involved students being administered subsets of items from each
task depending on their grade level. Table 1 provides a breakdown of the sample sizes used by grade
level for each of the FAIR-FS adaptive tasks.
Table 1. Sample Size by Grade Level for FAIR-FS Computer Adaptive Tasks
Grade
Phonological
Awareness Letter
Sounds Sentence
Comp
Vocabulary
Pairs Following Directions
Word Reading Spelling
K 2,100 2,377 2,275 2,015 2,304 1,969
1
2,115 2,247 2,372
2 1,980 2,027 2,089 1,992
Total 2,100 2,377 2,275 6,110 6,578 6,430 1,992
Score Definitions
Several different kinds of scores are provided in order to facilitate a diverse set of educational decisions.
In this section, we describe the types of scores provided for each measure, define each score, and
indicate its primary utility within the decision making framework of the FAIR-FS. An ability score and a
percentile rank are provided for each computer adaptive task (Letter Sounds, Phonological Awareness,
Word Reading, Vocabulary Pairs, Following Directions, Spelling, and Sentence Comprehension) at each
time point. One probability of literacy success score is provided at each assessment period.
Probability of Literacy Success (PLS). The Probability of Literacy Success score indicates the
likelihood that a student will reach end of year expectations in literacy. For the purposes of the FAIR-FS,
reaching expectations is defined as performing at or above the 40th percentile on the Stanford
Achievement Test, Tenth Edition (SAT-10). The PLS is used to determine which students are at-risk for
meeting grade level expectations by the end of the school year. In addition to providing a precise
probability of reaching grade level outcomes, the PLS is color-coded:
red = the student is at high risk and needs supplemental and/or intensive instruction targeted to the student’s skill weaknesses
yellow = the student may be at-risk and educators may consider differentiating instruction for the student and/or providing supplemental instruction
green = the student is likely not at-risk and will continue to benefit from strong universal instruction
14
FAIR-FS | Description of Method
© 2014 Florida State University. All Rights Reserved.
In the grades K-2 FAIR-FS, the components that are included in the PLS are an aggregate of the
individual student’s scores. In grade K, the PLS consists of Phonological Awareness, Letter Sounds,
Vocabulary Pairs, and Following Directions. At AP3 in Kindergarten, Letter Sounds is replaced by Word
Reading for the calculation of PLS. In grade 1, the PLS consists of Word Reading, Vocabulary Pairs, and
Following Directions. In grade 2, the PLS consists of Word Reading, Vocabulary Pairs, Following
Directions, and Spelling.
Percentile Ranks. Percentile ranks can vary from 1 to 99, and the distribution of scores is created
from a large standardization sample (in this case a representative sample of students from Florida) and
divided into 100 groups that contain approximately the same number of observations in each group.
Thus, a sixth grade student who scored at the 60th percentile would have obtained a score better than
about 60% of the students in the standardization sample. The median percentile rank on all the tests of
the K-2 grades FAIR-FS is 50, which means that half the students in the standardization sample obtained
a score above that point, and half scored below it. The percentile rank is an ordinal variable meaning
that it cannot be added, subtracted, used to create a mean score, or in any other way mathematically
manipulated. The median is always used to describe the midpoint of a distribution of percentile ranks.
Since this score compares a student’s performance to other students within a grade level, it is
meaningful in determining the skill strengths and skill weaknesses for a student as compared to other
students’ performance.
Ability Scores. Each computer-adaptive task has an associated ability score. The ability score
provides an estimate of a student’s development in a particular skill. This score is sensitive to changes in
a student’s ability as skill levels increase or decrease. Ability scores in the grades K-2 FAIR-FS span the
development of important alphabetic and oral language skills: Phonological Awareness, Letter Sounds,
Word Reading, Vocabulary Pairs, Following Directions, Spelling, and Sentence Comprehension. The
range of the developmental scale for each task is approximately 200 to 1000, with a mean of 500 and
standard deviation of 100. This score has an equal interval scale that can be added, subtracted, and used
to create a mean score. Therefore, this is the score that should be used to determine the degree of
growth in a skill for individual students.
15
FAIR-FS | Reliability
© 2014 Florida State University. All Rights Reserved.
Reliability
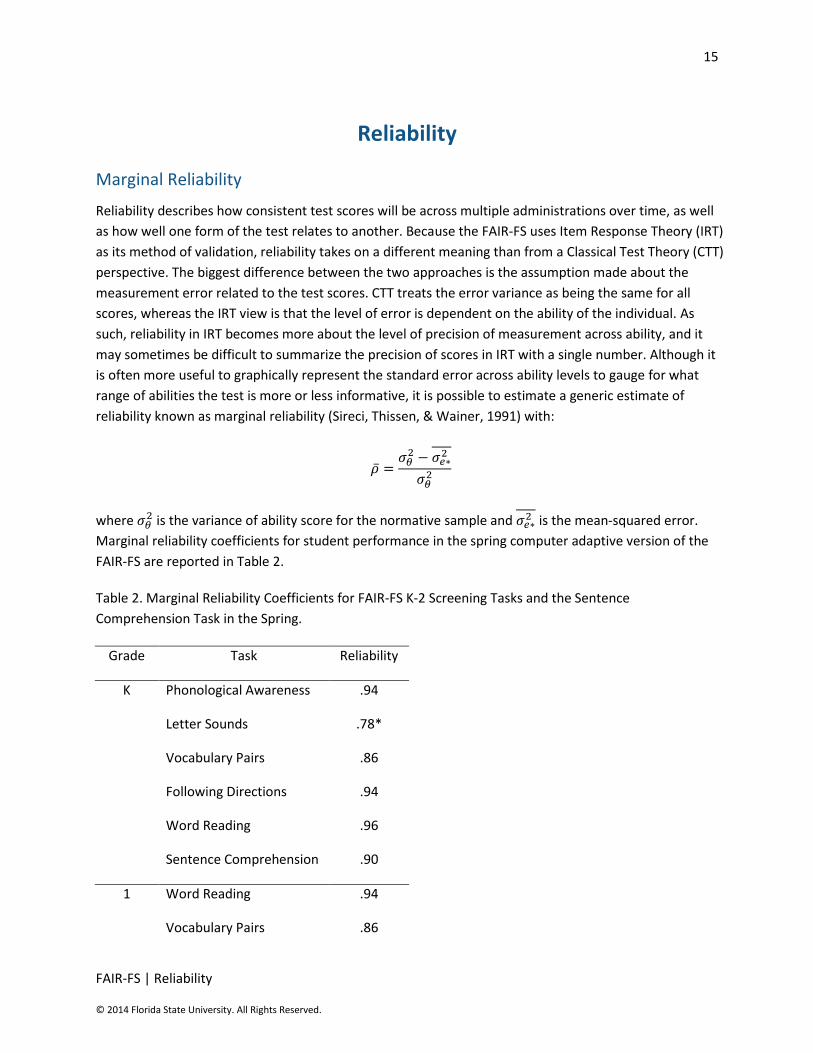
Marginal Reliability
Reliability describes how consistent test scores will be across multiple administrations over time, as well
as how well one form of the test relates to another. Because the FAIR-FS uses Item Response Theory (IRT)
as its method of validation, reliability takes on a different meaning than from a Classical Test Theory (CTT)
perspective. The biggest difference between the two approaches is the assumption made about the
measurement error related to the test scores. CTT treats the error variance as being the same for all
scores, whereas the IRT view is that the level of error is dependent on the ability of the individual. As
such, reliability in IRT becomes more about the level of precision of measurement across ability, and it
may sometimes be difficult to summarize the precision of scores in IRT with a single number. Although it
is often more useful to graphically represent the standard error across ability levels to gauge for what
range of abilities the test is more or less informative, it is possible to estimate a generic estimate of
reliability known as marginal reliability (Sireci, Thissen, & Wainer, 1991) with:
where is the variance of ability score for the normative sample and
is the mean-squared error.
Marginal reliability coefficients for student performance in the spring computer adaptive version of the
FAIR-FS are reported in Table 2.
Table 2. Marginal Reliability Coefficients for FAIR-FS K-2 Screening Tasks and the Sentence
Comprehension Task in the Spring.
Grade Task Reliability
K Phonological Awareness .94
Letter Sounds .78*
Vocabulary Pairs .86
Following Directions .94
Word Reading .96
Sentence Comprehension .90
1 Word Reading .94
Vocabulary Pairs .86
16
FAIR-FS | Reliability
© 2014 Florida State University. All Rights Reserved.
Following Directions .93
Sentence Comprehension .86
2 Word Reading .88
Spelling .91
Vocabulary Pairs .85
Following Directions .93
*Letter Sounds is not administered at the Spring assessment. Marginal reliability is provided as a function of performance on
fixed items administered at the Fall and Winter assessments.
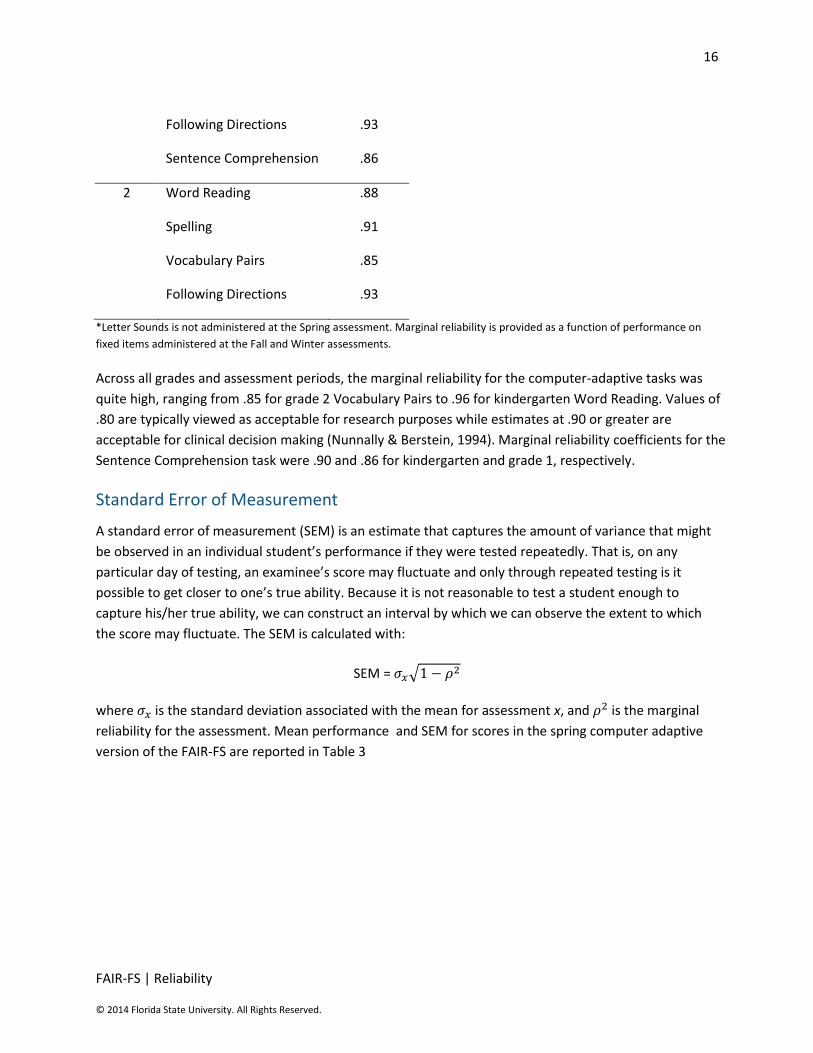
Across all grades and assessment periods, the marginal reliability for the computer-adaptive tasks was
quite high, ranging from .85 for grade 2 Vocabulary Pairs to .96 for kindergarten Word Reading. Values of
.80 are typically viewed as acceptable for research purposes while estimates at .90 or greater are
acceptable for clinical decision making (Nunnally & Berstein, 1994). Marginal reliability coefficients for the
Sentence Comprehension task were .90 and .86 for kindergarten and grade 1, respectively.
Standard Error of Measurement
A standard error of measurement (SEM) is an estimate that captures the amount of variance that might
be observed in an individual student’s performance if they were tested repeatedly. That is, on any
particular day of testing, an examinee’s score may fluctuate and only through repeated testing is it
possible to get closer to one’s true ability. Because it is not reasonable to test a student enough to
capture his/her true ability, we can construct an interval by which we can observe the extent to which
the score may fluctuate. The SEM is calculated with:
SEM = √
where is the standard deviation associated with the mean for assessment x, and is the marginal
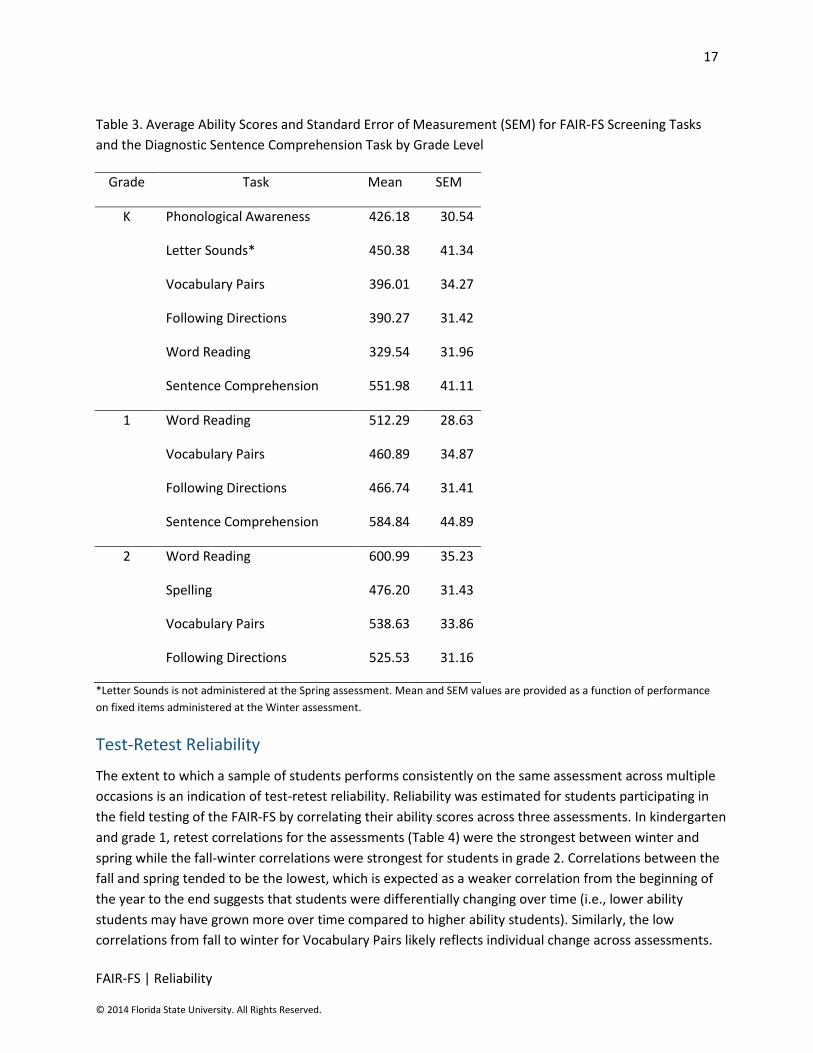
reliability for the assessment. Mean performance and SEM for scores in the spring computer adaptive
version of the FAIR-FS are reported in Table 3
17
FAIR-FS | Reliability
© 2014 Florida State University. All Rights Reserved.
Table 3. Average Ability Scores and Standard Error of Measurement (SEM) for FAIR-FS Screening Tasks
and the Diagnostic Sentence Comprehension Task by Grade Level
Grade Task Mean SEM
K Phonological Awareness 426.18 30.54
Letter Sounds* 450.38 41.34
Vocabulary Pairs 396.01 34.27
Following Directions 390.27 31.42
Word Reading 329.54 31.96
Sentence Comprehension 551.98 41.11
1 Word Reading 512.29 28.63
Vocabulary Pairs 460.89 34.87
Following Directions 466.74 31.41
Sentence Comprehension 584.84 44.89
2 Word Reading 600.99 35.23
Spelling 476.20 31.43
Vocabulary Pairs 538.63 33.86
Following Directions 525.53 31.16
*Letter Sounds is not administered at the Spring assessment. Mean and SEM values are provided as a function of performance
on fixed items administered at the Winter assessment.
Test-Retest Reliability
The extent to which a sample of students performs consistently on the same assessment across multiple
occasions is an indication of test-retest reliability. Reliability was estimated for students participating in
the field testing of the FAIR-FS by correlating their ability scores across three assessments. In kindergarten
and grade 1, retest correlations for the assessments (Table 4) were the strongest between winter and
spring while the fall-winter correlations were strongest for students in grade 2. Correlations between the
fall and spring tended to be the lowest, which is expected as a weaker correlation from the beginning of
the year to the end suggests that students were differentially changing over time (i.e., lower ability
students may have grown more over time compared to higher ability students). Similarly, the low
correlations from fall to winter for Vocabulary Pairs likely reflects individual change across assessments.

18
FAIR-FS | Reliability
© 2014 Florida State University. All Rights Reserved.
Table 4. Test-retest correlations among Fall, Winter, and Spring for FAIR-FS Screening Tasks by Grade
Level.
Grade Task Fall-Winter Winter-Spring Fall-Spring
K Phonological Awareness 0.61 0.67 0.51
Letter Sounds 0.54 - -
Vocabulary Pairs 0.42 0.44 0.23
Following Directions 0.59 0.65 0.57
Word Reading - - -
1 Word Reading 0.70 0.72 0.58
Vocabulary Pairs 0.53 0.58 0.47
Following Directions 0.64 0.62 0.59
2 Word Reading 0.80 0.66 0.63
Spelling 0.80 0.70 0.65
Vocabulary Pairs 0.43 0.50 0.51
Following Directions 0.70 0.62 0.55
Note. Letter Sounds is not administered in the Spring of kindergarten. Word Reading is only administered in the Spring of
kindergarten.

19
FAIR-FS | Validity
© 2014 Florida State University. All Rights Reserved.
Validity
Predictive Validity
The predictive validity of the Screening tasks to the SAT-10 Word Reading (SESAT in K) and Reading
Comprehension (SAT-10 in grades 1-2) subtests for grades K-2 was addressed through a series of linear
and logistic regressions. The linear regressions were run two ways. First, a correlation analysis was used
to evaluate the strength of relations between each of the Screening task ability scores with the SAT-10.
Second, a multiple regression was run to estimate the total amount of variance that the linear
combination of the predictors explained in SAT-10 reading comprehension performance. Results from
the linear regression analyses are reported in Table 5.
Table 5. Pearson Bivariate Correlations between FAIR-FS Screening Tasks and SESAT (in K) and SAT-10.
Percent Variance Explained in SESAT and SAT-10 by FAIR-FS Screening Tasks.
Grade Phonological Awareness
Letter Sounds
Vocabulary
Pairs Following Directions
Word Reading Spelling Total R²
K .59 .51 .38 .46 .48* - .46
1 - - .59 .51 .62 - .43
2 - - .55 .49 .58 .61 .51
*Correlation is a function of Word Reading performance in the Spring.
Note. Correlations and multiple regression are a function of FAIR-FS at the Winter assessment and SESAT and SAT-10 in the
spring. Kindergarten predictors for the multiple regression analysis include all predictors except word reading. Word Reading
was not included as a Grade 2 predictor for the multiple regression as multicolinearity was observed between word reading and
spelling resulting in a suppressor effect.
For the logistic regressions, students’ performance on the SESAT Word Reading and SAT-10 Reading
Comprehension test was coded as ‘1’ for performance at or above the 40th percentile, and ‘0’ for scores
below this target. This dichotomous variable was then regressed on a combination of vocabulary
knowledge, word reading, and reading comprehension scores at each grade level. Further, we evaluated
the classification accuracy of scores from the FAIR-FS as it pertains to risk status on the SESAT and SAT-
10. By dichotomizing scores on the Screen as ‘1’ for not at-risk for reading difficulties and ‘0’ for at-risk
for reading difficulties, students could be classified based on their dichotomized performances on both
the FAIR-FS screening tasks and the SESAT or SAT-10. As such, students could be identified as not at-risk
on the combination of screening tasks and demonstrating grade level performance on the SAT-10 (i.e.,
specificity or true-negatives), at-risk on the combination of screening task scores and below grade level
performance on the SAT-10 (i.e., sensitivity or true-positives), not at-risk based on the combination of
screening task scores but not at grade level on the SAT-10 (i.e., false negative error), or at-risk on the
20
FAIR-FS | Validity
© 2014 Florida State University. All Rights Reserved.
combination of screening task scores but at grade level on the SAT-10 (i.e., false positive error).
Classification of students in these categories allows for the evaluation of cut-points on the combination
of screening tasks (i.e., PLS) to determine which PLS cut-point maximizes predictive power The concept
of risk can be viewed in many ways, including the concept as a “percent chance” which is a number
between 0 and 100, with 0 meaning there is no chance that a student will develop a problem, and 100
being there is no chance the student will not develop a problem. When attempting to identify children
who are “at-risk” for poor performance on some type of future measure of reading achievement, this is
typically a yes/no decision based upon some kind of “cut-point” along a continuum of risk. Oftentimes
this future measure of achievement is a state’s high-stakes assessment, which typically provides some
kind of standard score that describes the performance of each student. Grade-level cut-points are
chosen that determine whether a student has passed or failed the state-wide assessment.
Decisions concerning appropriate cut-points are made based on the level of correct classification that is
desired from the screening assessments. While a variety of statistics may be used to guide such choices
(e.g., sensitivity, specificity, positive and negative predictive power; see Schatschneider, Petscher &
Williams, 2008), negative predictive power was utilized to develop the FAIR-FS cut-points. Negative
predictive power is the percentage of students who are identified as “not at-risk” on a screening
assessment that end up not passing based on the cut-point of the outcome test. Predictive power is not
considered to be a property of the screening assessment since it is known to fluctuate given the
proportion of individuals who are at-risk on the selected outcome (Streiner, 2003).
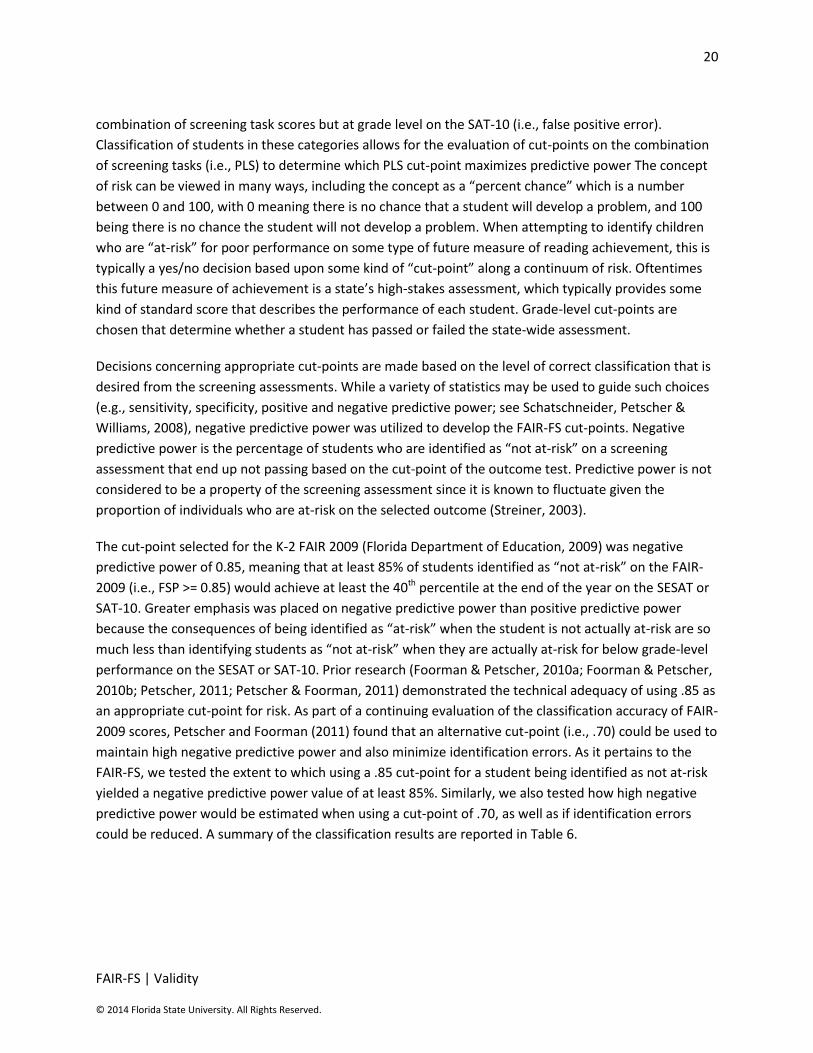
The cut-point selected for the K-2 FAIR 2009 (Florida Department of Education, 2009) was negative
predictive power of 0.85, meaning that at least 85% of students identified as “not at-risk” on the FAIR-
2009 (i.e., FSP >= 0.85) would achieve at least the 40th percentile at the end of the year on the SESAT or
SAT-10. Greater emphasis was placed on negative predictive power than positive predictive power
because the consequences of being identified as “at-risk” when the student is not actually at-risk are so
much less than identifying students as “not at-risk” when they are actually at-risk for below grade-level
performance on the SESAT or SAT-10. Prior research (Foorman & Petscher, 2010a; Foorman & Petscher,
2010b; Petscher, 2011; Petscher & Foorman, 2011) demonstrated the technical adequacy of using .85 as
an appropriate cut-point for risk. As part of a continuing evaluation of the classification accuracy of FAIR-
2009 scores, Petscher and Foorman (2011) found that an alternative cut-point (i.e., .70) could be used to
maintain high negative predictive power and also minimize identification errors. As it pertains to the
FAIR-FS, we tested the extent to which using a .85 cut-point for a student being identified as not at-risk
yielded a negative predictive power value of at least 85%. Similarly, we also tested how high negative
predictive power would be estimated when using a cut-point of .70, as well as if identification errors
could be reduced. A summary of the classification results are reported in Table 6.

21
FAIR-FS | Validity
© 2014 Florida State University. All Rights Reserved.
Table 6. Classification Accuracy of the Probability of Literacy Success (PLS) in Grades K-2 using .85 and
.70 Cut-Points.
Cut-Point Grade SE SP PPP NPP OCC Base Rate
0.85 K .98 .25 .76 .87 .77 .71
1 .92 .57 .52 .93 .69 .34
2 .96 .44 .57 .94 .66 .43
0.70 K .96 .47 .82 .83 .82 .71
1 .82 .69 .82 .88 .73 .34
2 .85 .64 .65 .85 .73 .43
Note. SE= Sensitivity, SP = Specificity, PPP = Positive Predictive Power, NPP = Negative Predictive Power, OCC = Overall Correct
Classification.
Note that when using either the .85 or .70 cut-points the negative predictive power approximates or
meets .85, yet when the .85 cut-point is used the specificity and positive predictive power are relatively
low. The consequence of a low specificity value is that many students are required to take one or more
additional tasks; in the present sample this would result in between 43% and 75% of students identified
as false positives and required to move on to additional testing. Conversely, if a .70 cut-point is used this
error rate range reduces from 43%-75% down to 31%-53%. From a more applied perspective, when
using a .85 cut-point 75% of all students who were at or above the 40th percentile of the SESAT in
kindergarten will be identified as at-risk on the FAIR-FS. Thus, out of 100 students in a school who are at
or above the 40th percentile, 75 of them would be identified as at-risk on the FAIR-FS. These students
would then be required to spend approximately 15 minutes in the diagnostic tasks which are not
actually necessary. Because the cut-point for not at-risk is very high, it means more errors may be made.
By using the .70 cut-point, 53 students spend extra time in the assessment. Having 22 fewer students in
a school being assessed less affords a significant time savings as it pertains to instruction. Using the .70
cut-point not only reduces false positives, it also increases positive predictive power and the overall
correct classification. Although there is some loss of precision in the sensitivity, the negative predictive
power maintains a high value to ensure that students who are identified as not at-risk have a high
likelihood of being successful on the SESAT or SAT-10 at the 40th percentile or greater.
Differential Accuracy of Prediction
An additional component of checking the validity of cut-points and scores on the assessments involved
testing differential accuracy of the regression equations across different demographic groups. This
procedure involved a series of logistic regressions predicting success on the SESAT or SAT-10 subtests
(i.e., at or above the 40th percentile). The independent variables included a variable that represented

22
FAIR-FS | Validity
© 2014 Florida State University. All Rights Reserved.
whether students were identified as not at-risk (PLS ≥ .70; coded as ‘1’) or at-risk (PLS < .70; coded as ‘0’)
on a combination score of the screening tasks, a variable that represented a selected demographic
group, as well as an interaction term between the two variables. A statistically significant interaction
term would suggest that differential accuracy in predicting end-of-year risk status existed for different
groups of individuals based on the risk status identified by the PLS. Differential accuracy was separately
tested for Black and Latino students as well as for students identified as English Language Learners (ELL)
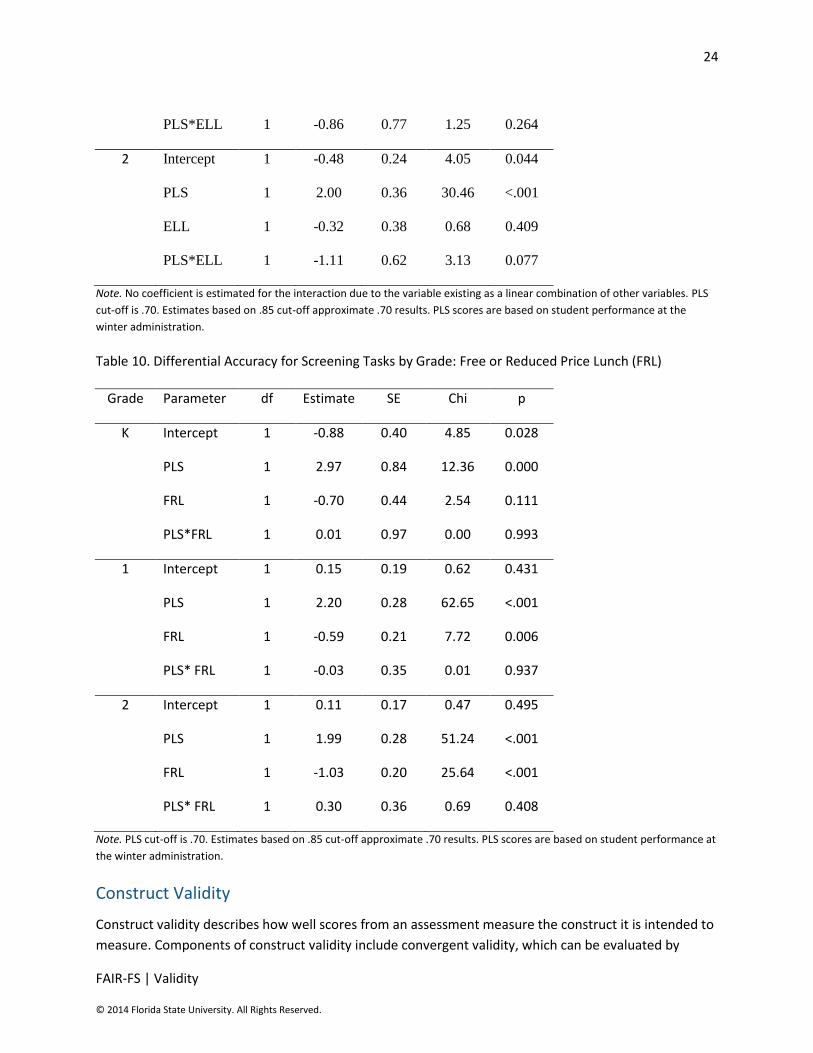
and students who were eligible for Free/Reduced Price Lunch (FRL). Tables 7-10 report findings for the
analyses by grade. No significant differential accuracy was found for any demographic sub-group.
Table 7. Differential Accuracy for Screening Tasks by Grade: Black-White (BW)
Grade Parameter df Estimate SE χ² p-value
K Intercept 1 -1.47 0.19 58.18 <.001
PLS 1 3.31 0.48 47.62 <.001
BW 1 -0.32 0.43 0.56 0.455
PLS*BW 1 -0.15 1.55 0.01 0.923
1 Intercept 1 -0.26 0.21 1.60 0.207
PLS 1 2.63 0.31 71.78 <.001
BW 1 0.04 0.29 0.02 0.899
PLS*BW 1 -0.64 0.51 1.61 0.204
2 Intercept 1 0.01 0.18 0.00 0.948
PLS 1 2.13 0.32 44.64 <.001
BW 1 -0.90 0.27 10.84 0.001
PLS*BW 1 -0.41 0.47 0.79 0.376
Note. PLS cut-off is .70. Estimates based on .85 cut-off approximate .70 results. PLS scores are based on student performance at
the winter administration.

23
FAIR-FS | Validity
© 2014 Florida State University. All Rights Reserved.
Table 8. Differential Accuracy for Screening Tasks by Grade: Hispanic-White (HW)
Grade Parameter df Estimate SE χ² p-value
K Intercept 1 -1.25 0.22 32.80 <.001
PLS 1 2.70 0.48 31.27 <.001
HW 1 -0.69 0.44 2.49 0.115
PLS*HW 1 1.23 1.10 1.25 0.263
1 Intercept 1 -0.26 0.21 1.60 0.207
PLS 1 2.63 0.31 71.78 <.001
HW 1 -0.14 0.24 0.33 0.568
PLS*HW 1 -0.49 0.39 1.56 0.211
2 Intercept 1 0.01 0.18 0.00 0.948
PLS 1 2.13 0.32 44.64 <.001
HW 1 -0.79 0.23 12.46 0.000
PLS*HW 1 0.40 0.43 0.86 0.353
Note. PLS cut-off is .70. Estimates based on .85 cut-off approximate .70 results. PLS scores are based on student performance at
the winter administration.
Table 9. Differential Accuracy for Screening Tasks by Grade: English Language Learners (ELL)
Grade Parameter df Estimate SE Chi p
K Intercept 1 -1.30 0.18 53.42 <.001
PLS 1 2.88 0.42 47.98 <.001
ELL 1 -1.18 0.52 5.19 0.023
PLS*ELL 0 0.00 . . .
1 Intercept 1 -0.88 0.27 10.52 0.001
PLS 1 3.57 0.47 57.09 <.001
ELL 1 -0.58 0.43 1.88 0.171
24
FAIR-FS | Validity
© 2014 Florida State University. All Rights Reserved.
PLS*ELL 1 -0.86 0.77 1.25 0.264
2 Intercept 1 -0.48 0.24 4.05 0.044
PLS 1 2.00 0.36 30.46 <.001
ELL 1 -0.32 0.38 0.68 0.409
PLS*ELL 1 -1.11 0.62 3.13 0.077
Note. No coefficient is estimated for the interaction due to the variable existing as a linear combination of other variables. PLS
cut-off is .70. Estimates based on .85 cut-off approximate .70 results. PLS scores are based on student performance at the
winter administration.
Table 10. Differential Accuracy for Screening Tasks by Grade: Free or Reduced Price Lunch (FRL)
Grade Parameter df Estimate SE Chi p
K Intercept 1 -0.88 0.40 4.85 0.028
PLS 1 2.97 0.84 12.36 0.000
FRL 1 -0.70 0.44 2.54 0.111
PLS*FRL 1 0.01 0.97 0.00 0.993
1 Intercept 1 0.15 0.19 0.62 0.431
PLS 1 2.20 0.28 62.65 <.001
FRL 1 -0.59 0.21 7.72 0.006
PLS* FRL 1 -0.03 0.35 0.01 0.937
2 Intercept 1 0.11 0.17 0.47 0.495
PLS 1 1.99 0.28 51.24 <.001
FRL 1 -1.03 0.20 25.64 <.001
PLS* FRL 1 0.30 0.36 0.69 0.408
Note. PLS cut-off is .70. Estimates based on .85 cut-off approximate .70 results. PLS scores are based on student performance at
the winter administration.
Construct Validity
Construct validity describes how well scores from an assessment measure the construct it is intended to
measure. Components of construct validity include convergent validity, which can be evaluated by

25
FAIR-FS | Validity
© 2014 Florida State University. All Rights Reserved.
testing relations between a developed assessment and another related assessment, and discriminant
validity, which can be evaluated by correlating scores from a developed assessment with an unrelated
assessment. The goal of the former is to yield a high association which indicates that the developed
measure converges, or is empirically linked to, the intended construct. The goal of the latter is to yield a
lower association which indicates that the developed measure is unrelated to a particular construct of
interest. Reading and language skills tend to have moderate associations between them; thus, the
expectation of the FAIR-FS scores in K-2 is that moderate correlations would be observed. Correlation
results are reported in Tables 11-13. Vocabulary Pairs, Following Directions, and Sentence
Comprehension are receptive tasks and are therefore more highly related oral language measures.
Additionally, the high correlation was observed in a recent meta-analysis in the early grades. (Weiser &
Mathes, 2011)
Table 11. Bivariate Associations among FAIR-FS Computer-Adaptive Tasks in Kindergarten
Assessment Phonological Awareness
Following Directions
Vocabulary Pairs
Word Reading
Phonological Awareness 1.00
Following Directions 0.44 1.00
Vocabulary Pairs 0.31 0.49 1.00
Word Reading 0.45 0.35 0.29 1.00
Sentence Comp 0.34 0.61 0.44 0.27
Note. Correlations are estimated as a function of Spring testing.

26
FAIR-FS | Validity
© 2014 Florida State University. All Rights Reserved.
Table 12. Bivariate Associations among FAIR-FS Computer-Adaptive Tasks in Grade 1
Assessment Word
Reading Following Directions
Vocabulary Pairs
Word Reading 1.00
Following Directions 0.34 1.00
Vocabulary Pairs 0.39 0.49 1.00
Sentence Comp 0.20 0.59 0.60
Note. Correlations are estimated as a function of Spring testing.
Table 13. Bivariate Associations among FAIR-FS Computer-Adaptive Tasks in Grade 2
Assessment Word
Reading Spelling Following Directions
Word Reading 1.00
Spelling 0.78 1.00
Following Directions 0.35 0.33 1.00
Vocabulary Pairs 0.47 0.45 0.44
Note. Correlations are estimated as a function of Spring testing.

27
FAIR-FS | References
© 2014 Florida State University. All Rights Reserved.
References
Cohen, J. (1988). Statistical power analysis for the behavioral sciences (Second ed.). Hillsdale: Lawrence
Erlbaum Associates.
Ehri, L.C., Nunes, S., Stahl, S., & Willows, D. (2001). Systematic phonics instruction helps students learn
to read: Evidence from the National Reading Panel's meta-analysis. Review of Educational
Research, 71, 393-447.
Ehri, L.C., Nunes, S., Willows, D., Schuster, B., Yaghoub-Zadeh, Z., & Shanahan, T. (2001). Phonemic
awareness instruction helps children learn to read: Evidence from the national Reading Panel's
meta-analysis. Reading Research Quarterly, 36, 250-287.
Fitzgerald, J., Elmore, J., Koons, H., Hiebert, E.H., Bowen, K., Sanford-Moore, E., & Stenner, A.J. (2014).
Important text characteristics for early-grades text complexity. Journal of Educational Psychology.
DOI: 10.1037/a0037289.
Florida Department of Education (2009-2011). Florida Assessments for Instruction in Reading (FAIR).
Tallahassee, FL: Author.
Foorman, B. R. (2009). Text difficulty in reading assessment. In E.H. Hiebert (Ed.), Reading more, reading
better (pp. 231-247.) New York, NY: Guilford.
Foorman, B. R., & Connor, C. (2011). Primary reading. In M. Kamil, P. D. Pearson, & E. Moje (Eds.),
Handbook on reading research (Vol. 4, pp. 136–156). New York, NY: Taylor and Francis.
Foorman, B., Herrera, S., Petscher, Y., Mitchell, A., & Truckenmiller, A., (2014). Relations among syntax,
vocabulary, listening comprehension, phonological awareness, decoding fluency, and reading
comprehension in grades K-2. Manuscript revised for publication.
Foorman, B.R., & Petscher, Y. (2010a). Summary of the predictive relationship between the FAIR and the
FCAT in grades 3-10. Tallahassee, FL: Florida Center for Reading Research.
Foorman, B.R., & Petscher, Y. (2010b). The unique role of the FAIR Broad Screen in predicting FCAT
Reading Comprehension. Tallahassee, FL: Florida Center for Reading Research.
Foorman, B.R., Francis, D.J., Davidson, K., Harm, M., & Griffin, J. (2004). Variability in text features in six
grade 1 basal reading programs. Scientific Studies in Reading, 8(2), 167 -197.
Meade, A.W. (2010). A taxonomy of effect sizes for the differential functioning of items and scales.
Journal of Applied Psychology, 95, 728-743.
Muthén, B., & Muthén, L. (2008). Mplus User’s Guide. Los Angeles, CA: Muthén and Muthén.

28
FAIR-FS | References
© 2014 Florida State University. All Rights Reserved.
National Early Literacy Panel. (2008). Developing early literacy: Report of the National Early Literacy
Panel. Washington, DC: National Institute for Literacy. Retrieved from:
http://lincs.ed.gov/publications/pdf/NELPReport09.pdf
National Institute of Child Health and Human Development. (2000). Report of the National Reading
Panel. Teaching children to read: Reports of the subgroups (NIH Publication No. 00-4754).
Washington, DC: U.S. Department of Health and Human Services.
National Research Council (1998). Preventing reading difficulties in young children. Committee on the
Prevention of Reading Difficulties in Young Children, Committee on Behavioral and Social Science
and Education, C.E. Snow, M.S. Burns, & P. Griffin, eds. Washington, D.C.: National Academy Press.
Nunnally, J.C., & Bernstein, I.H. (1994). Psychometric theory (3rd Ed.). New York: McGraw-Hill.
Perfetti, C., & Stafura, J. (2014). Word knowledge in a theory of reading comprehension. Scientific
Studies of Reading, 18, 22-37. DOI: 10.1080/10888438.2013.827687
Petscher, Y., & Foorman, B.R. (2011). Summary of the predictive relationship between the FAIR and the
FCAT in grades 3-10. Tallahassee, Fl: Florida Center for Reading Research.
RAND Reading Study Group (2002). Reading for understanding. Santa Monica, CA: RAND Corporation.
Rayner, K., Foorman, B. R., Perfetti, C. A., Pesetsky, D., & Seidenberg, M. S. (2001). How psychological
science informs the teaching of reading. Psychological Science in the Public Interest, 2(2), 31-74.
Schatschneider, C., Petscher, Y., & Williams, K.M. (2008). How to evaluate a screening process: The
vocabulary of screening and what educators need to know (pg. 304-317). In L. Justice & C. Vukelic
(Eds.). Every moment counts: Achieving excellence in preschool language and literacy instruction.
New York: Guilford Press.
Sireci, S.G., Thissen, D., & Wainer, H. (1991). On the reliability of testlet-based tests. Journal of
Educational Measurement, 28, 237-247.
Stocking, M.L., & Lord, F.M. (1983). Developing a common metric in item response theory. Applied
Psychological Measurement, 7, 201-210.
Streiner, D. L. (2003). Diagnosing tests: Using and misusing diagnostic and screening tests. Journal of
Personality Assessment, 81, 209-219.
Weiser, B. L., & Mathes, P. G. (2011). Using encoding instruction to improve the reading and spelling
performances of elementary students at-risk for literacy difficulties: A best-evidence
synthesis. Review of Educational Research, 81, 170-200.
29
FAIR-FS | References
© 2014 Florida State University. All Rights Reserved.
Ziegler, J. C., Stone, G. O., & Jacobs, A. M. (1997). What's the pronunciation for _OUGH and the spelling
for /u/? A database for computing feedforward and feedback inconsistency in English. Behavior
Research Methods, Instruments, & Computers, 29, 600-618.