Embed Size (px)
Citation preview

INSTITUTIONAL STATISTICS
BOOK2001/02

QUICK FACTSSTUDENT DATA FACULTY DATA
Enrolment - 2001/02 (as at Nov 1) Full-time Faculty - 2001/02
Full-time Undergraduate 4,662 Professors 80Part-time Undergraduate 1,192 Associate Professors 85Full-time Graduate 200 Assistant Professors 72Part-time Graduate 86 Lecturers 5
Headcount - Fall/Winter 6,140 Total 242
Full-time Equivalent (2001/02) 5,741(estimate) FINANCIAL DATA - 2000/01
Operating Revenue ($ millions)Degrees Awarded (Calendar Year 2001)
Source of Operating Revenue-Government Grants 30.715
Undergraduate Total -Fees 24.287-Other 1.933
Bachelors 1,763Certificate 72 Total Operating Revenue 56.935Diploma 77
Masters 100 Operating Expenses ($ millions)-Salaries & Benefits 44.130
Doctorates 1 -Non-Salary Items 13.995
Total 2,013 Total Operating Expenses 58.125
LAKEHEAD UNIVERSITY
INSTITUTIONAL STATISTICS BOOK
2001/02

TABLE OF CONTENTS
PAGE
QUICK FACTS . . . . . . . . . . . . . . . . . . . . . front inside cover
SECTION 1 GENERAL
Mission Statement . . . . . . . . . . . . . . . . . . . . . . . . . . . . 1Honorary Degrees . . . . . . . . . . . . . . . . . . . . . . . . . . . . 2Fellows, Distinguished Alumni, Researchers & Instructors . . . . . . 3Organization - Board, Senate and Committees . . . . . . . . . . . . . 4Academic Faculties, Departments & Schools . . . . . . . . . . . . . . 6Library Collections, Circulation and Reference Statistics . . . . . . 7B.I.U. Comparison - Actual and Moving Average . . . . . . . . . . . . 8B.I.U. Weight per FTE . . . . . . . . . . . . . . . . . . . . . . . . . 9Glossary of Acronyms . . . . . . . . . . . . . . . . . . . . . . . . . . 10
SECTION 2 STUDENT DATA
FTE/BIU History . . . . . . . . . . . . . . . . . . . . . . . . . . . . 11Degrees Awarded by Program . . . . . . . . . . . . . . . . . . . . . . 12Full-Time Enrolment by Majors (Fall/Winter) . . . . . . . . . . . . . 19Part-Time Enrolment by Majors (Fall/Winter) . . . . . . . . . . . . . 20Enrolment by Gender, Registration Status & Level . . . . . . . . . . 21Enrolment by Gender . . . . . . . . . . . . . . . . . . . . . . . . . . . 22Enrolment by Level & Registration Status . . . . . . . . . . . . . . . 23Age Distribution of Registered Students . . . . . . . . . . . . . . . 24Geographic Distribution of Full-time Registrants . . . . . . . . . . . 25Applicant/Registrant Data . . . . . . . . . . . . . . . . . . . . . . . 26Applications - All Ontario . . . . . . . . . . . . . . . . . . . . . . . 27Registrations - All Ontario . . . . . . . . . . . . . . . . . . . . . . 28Applications - N.W.O. . . . . . . . . . . . . . . . . . . . . . . . . . 29Registrations - N.W.O. . . . . . . . . . . . . . . . . . . . . . . . . . 30Undergraduate Class Sizes . . . . . . . . . . . . . . . . . . . . . . . 31
PAGE
SECTION 3 FACULTY
Full-Time Faculty Appointments by Department . . . . . . . . . . . . 32Full-Time Faculty - Distribution by Rank & Appointment . . . . . . . 33Full-Time Faculty - Distribution by Gender & Appointment . . . . . . 34Full-time Faculty Distribution by Age . . . . . . . . . . . . . . . . . 35Full-Time Equivalent Course Enrolments . . . . . . . . . . . . . . . . 36Student/Faculty Ratios . . . . . . . . . . . . . . . . . . . . . . . . . 38
SECTION 4 FINANCIAL
Revenue by Source and Type of Fund . . . . . . . . . . . . . . . . . . 39Expenses by Object and Type of Fund . . . . . . . . . . . . . . . . . 40Operating Income and Expenditures . . . . . . . . . . . . . . . . . . 41Revenue from Research Grants and Contracts . . . . . . . . . . . . . 42Lakehead University Internal Scholarships, Bursaries and Awards . 43Donations and Bequests . . . . . . . . . . . . . . . . . . . . . . . . . 44
SECTION 5 SPACE
University Land (in Hectares) . . . . . . . . . . . . . . . . . . . . . . 45Distribution of Physical Space . . . . . . . . . . . . . . . . . . . . . 46Residence Accommodation . . . . . . . . . . . . . . . . . . . . . . . . 47Lakehead University Campus Map . . . . . . . . . . . . . . . . . . . . 48
HIGHLIGHTS OF LAKEHEAD UNIVERSITY'S
ECONOMIC IMPACT ON THE CITY OF THUNDER BAY
. . . . . . . . . . . . . . . . . . . . . . . . . . . . . . . . . . . . . . . . . . . . back inside cover

SECTION 1 - GENERAL
Lakehead University Mission Statement
Honorary Degrees, Fellows, Distinguished Alumni, Distinguished Researchers, Distinguished Instructors
Lakehead University Organization - 2001/02 - Board of Governors, Senate and Committees
Academic Faculties, Departments and Schools
Library Collections, Circulation and Reference Statistics
BIU Comparison
BIU Weight/FTE
Glossary of Acronyms

Lakehead University is committed to excellence and innovation in undergraduate and graduate teaching, service, research
and other scholarly activity. As part of this commitment, Lakehead University is dedicated to a student-centred learning
environment. Lakehead University values its people and the diversity of their ideas, contributions and achievements.
Lakehead University is dedicated to working with Aboriginal peoples in furthering their educational aspirations. Building
on its past accomplishments and recognizing its role in Northwestern Ontario, Lakehead University reaches out regionally,
nationally and internationally.
Lakehead University is committed to educating students who are recognized for leadership and independent critical
thinking and who are aware of social and environmental responsibilities.
LAKEHEAD UNIVERSITYMISSION STATEMENT

HONORARY DEGREES
1973 Senator Norman M. Paterson1974 Patrick D. McTaggart-Cowan
Reva Gerstein1975 Miriam Waddington
J. Murray Fleming1976 Dorothea M. Crittenden
Robert R. Steele1977 Harold S. Braun1978 Hon. Robert K. Andras
Robert J. Prettie1979 Alastair R.C. Duncan
Claude E. Garton1980 Benjamin Cowan1981 Edward J. Monahan
William G. Tamblyn1982 Rt. Hon. Bora Laskin
S.Delbert ClarkTerence M. Penelhum
1983 Harry K. FisherHon. Leo BernierBruce I. Howe
1984 Edward F. SheffieldRev. Agnew H. JohnstonHon. John B. AirdJ. Tuzo Wilson
1985 Rt. Hon. Edward R. SchreyerLynn JohnstonNorval MorrisseauM. Josephine Flaherty
1986 Robert M. Bateman
Kenneth M. DyeFarley M. MowatDavid T. Suzuki
1987 Douglas M. FisherE. Margaret FultonCliff M. McIntoshMaxwell W. Ward
1988 Hon. Jean ChrétienMaureen ForresterStephen LewisPaul ShafferJohn E. Stokes
1989 Adrienne ClarksonGeraldine Kenny-WallacePeter MansbridgeWilliam West
1990 Jeanne L. AgnewJohn K. BellAmbassador Derek BurneyArthur C. EricksonWilliam S. Fyfe
1991 Arthur BlackRoberta L. BondarKenneth A. ArmsonRichard C. Lyons
1992 Hon. Mme. Justice Karen WeilerNeil Young
1993 Judith Maxwell1994 Hon. Nellie Cournoyea
Ian Tamblyn
James MacNeillUrsula Franklin
1995 Timothy FindleySaul LaskinMonique FrizeHelen Donis-Keller
1996 Louis DudekLorne EverettRobert PatersonMelvin PervaisRonald RistimakiLenore (Leni) Untinen
1997 Mario BernardiOlive DickasonRichard GwynArthur MauroLofti Zadeh
1998 Margaret AtwoodT. Sher SinghRoberta JamiesonJames MacGregor
1999 Rev. John J. Pungente2000 Douglas J. Cardinal
Buffy Sainte MarieJane Urquhart
2001 Carol ShieldsDr. Jack Thomas
2002 Pierre BertonHon. Mme. Justice Louise Arbour

FELLOWS
DISTINGUISHED ALUMNI
DISTINGUISHEDRESEARCHERS
DISTINGUISHED
1976 R. Jack FlattE. Lorne Goodall
1979 John N. Paterson1980 John Andrews
Hubert Badanai, Sr.1981 Melville W. Bartley1984 William G. Tamblyn
Roderick Philpot1985 Russell A. Peden1987 Charles J. Carter
Saul Laskin1988 Thomas S. Jones
A.L. (Pete) Musselman1989 Wallace Bryan1990 H. Fraser Dougall
G. Sydney Halter1991 Arnold E. Westlake1993 Mary Anne Misner1994 Elizabeth Chalmers1995 Annette Augustine1996 Mae Katt1997 Margaret Page
Robbert P. Welter1998 Florence Johnston
Hon. Mr. Just. John McCartney
1999 Vic Prokopchuk2000 Preston R. Cook
2001 Dr. Jim ColquhounTony Seuret
2002 Larry Hebert
1988 Ronald J. Duhamel1989 Lorne Everett1990 E.J. (Dusty) Miller1991 Anthony J. Petrina1992 Richard P. Lang1993 Lyn McLeod1994 Dennis McPherson1995 Robert Gregor1996 Joseph Logozzo1997 Betty Coates (posthumously)1998 John Valley1999 Diane Schoemperlen2000 Margaret Page2001 Joseph Baratta (posthumous)
1988 Roger H. MitchellInderjit Nirdosh
1989 Alan N. Hughes1990 Alan Day1991 Said M. Easa1992 Neil Weir
1993 Vireshwar V. Paranjape1994 David Holah1995 S. Ali Mirza1996 Murray Lankester
Rao Puttagunta1997 Doug Morris
Ken Rotenberg1998 Graham Borradaile1999 Azim Mallik2000 TBA2001 Laurie Garred
1988 S. Penny Petrone1989 Manfred M. Kehlenbeck1990 Peggy H. Knowles1991 S. Ali Mirza1992 W.G. (Bill) Heath1993 Victor C. Smith1994 Darlene Steven1995 Inderjit Nirdosh1996 Jane Taylor1997 Jeanette Lynes1998 Kim Fedderson1999 Ken Brown2000 Frederick M. Holmes

BOARD OF GOVERNORS
Ms Pamela Anderson Mrs. Cheryl Balacko Mr. Bill Bartley Ms Ruth Baxter Mr. Don Campbell Mr. Harvey Cardwell Mr. Don Caron Mr. Shawn Cooper Mr. George Davies Mrs. Jackie Dojack Dr. Tom Dunk Mr. Ron Dysievick Ms Corinne Fox Dr. Laurie GarredDr. Fred Gilbert Mr. Paul Gordon Mr. Stephen S. Hessian Mr. Tom Jones Mr. Jim. Kalyta Mr. Bruce LaBelle Dr. Norm LaVoie Dr. Neil McLeod Mr. Seppo Paivalainen Mr. Douglas Robson Mrs. Mary Roy Mrs. Lynn Ruxton Mr. Greg Seiveright Mr. Dennis Wallace Mr. Russell York
OFFICERS OF THEBOARD OF GOVERNORS
Chair: Mr. Paul GordonPast-Chair: Mr. Stephen S. HessianVice-Chair: Mr. Seppo PaivalainenPresident: Dr. Fred GilbertSecretary: Ms Patti Merriman
Lieutenant Governor's AppointmentsMs Ruth BaxterMr. Harvey CardwellMr. Bill Bartley
Executive CommitteeMr. Bill Bartley
Mr. Harvey CardwellMr. Don CaronMrs. Jackie DojackMs Corinne FoxDr. Fred GilbertMr. Paul Gordon, ChairMr. Stephen S. HessianMr. Tom JonesDr. Norm LaVoieMr. Seppo PaivalainenMr. Greg Seiveright
BOARD OF GOVERNORS’ COMMITTEES
Audit CommitteeMs Ruth Baxter Mr. Don Campbell Mr. Bruce LaBelle, ChairMrs. Mary Roy Mr. Russell York Dr. Fred Gilbert (ex officio)
Finance and Investment CommitteeMr. Don Campbell Mr. Harvey Cardwell, ChairDr. Tom Dunk Mr. Ron Dysievick Ms Corinne Fox Mr. Seppo Paivalainen Mr. Greg SeiverightDr. Fred Gilbert (ex officio)
Governance Committee
Mrs. Jackie Dojack, ChairMr. Stephen S. Hessian Mr. Seppo Paivalainen Dr. Fred Gilbert (ex officio)
Nominating Committee
Ms Ruth Baxter Mr. Don Campbell Mr. Don Caron Mr. Stephen S. Hessian, ChairMr. Eric McGoeyMrs. Pat MeredithMrs. Lana Rizzuto
Operations Committee
Mr. Bill Bartley, ChairMr. Harvey Cardwell
Mr. Shawn CooperMrs. Jackie Dojack Mr. Ron Dysievick Mr. Paul Gordon Mrs. Lynn RuxtonDr. Fred Gilbert (ex officio)
Senate Liaison Committee
Mrs. Cheryl Balacko Dr. Tom DunkMr. Jim KalytaDr. Norm LaVoie, ChairDr. Neil McLeodMr. Dennis Wallace Dr. Fred Gilbert (ex officio)
Student Liaison Committee
Ms Pam Anderson Ms Ruth Baxter Mrs. Lynn Ruxton Mr. Greg Seiveright, ChairMr. Shawn Cooper Dr. Fred Gilbert (ex officio)
University Advancement Committee
Mr. Bill BartleyMr. Don Caron, ChairMr. George DaviesMr. Tom Jones Dr. Neil McLeod Mr. Douglas Robson Mr. Russell YorkDr. Fred Gilbert (ex officio)
SENATE
President & Chair: Dr. Frederick F. GilbertVice-President (Academic) & Provost & Vice-Chair: Dr. Mary Louise HillVice-Provost (Student Affairs): Dr. K. BarrettUniversity Librarian: Mrs. A. DeightonRegistrar: Mr. P.A. PaularinneDean of Research:Acting Dean of Grad Studies: Dr. W.Montelpare
DEANS OF FACULTIES
Dr. Bahram Dadgostar (Business Administration)Dr. Julia O’Sullivan (Education)Dr. Henri T. Saliba (Engineering)Dr. Reino E. Pulkki (Forestry and the Forest Env.)Dr. Ian J. Newhouse (Professional Schools)Dr. James H. Gellert (Arts & Science)
HEADS OF TEACHING DEPARTMENTSDr. R. T. Warkentin (Anthropology)Dr. A. D. Macdonald (Biology)G. D. Martin (Chemistry)Professor N. C. Bonsor (Economics)Dr. K. Fedderson (English)Dr. B. J. Lorch (Geography)Dr. S.A. Kissin (Geology)Dr. P. Jasen (History)Dr. R. S. Robson (Indigenous Learning)Dr. I. Newhouse (Kinesiology)Dr. A. Nabarra (Languages)Prof. M. MacLean (Library & Info. Studies)Dr. M. W. Benson (Computer Science)Dr. P. Mah (Mathematical Sciences)Dr. A. Carastathis (Music)Dr. L. McDougall (Nursing)Dr. M. Johnston (Outdoor Rec, Parks & Tourism)Dr. R. Maundrell (Philosophy)Dr. W. Keeler (Physics)Dr. D. A. West (Political Science)Dr. G. Haymen (Psychology)Prof. R. Delaney (Social Work)Dr. T. Dunk (Sociology)Prof. A. Clarke (Visual Arts)Prof. G. Phillips (Business Administration,Curriculum, Years 1 & 2)Prof. R. Isotalo (Business Administration,Curriculum, Years 3 & 4)Dr. J. O-Meara (Grad. Studies and ProfessionalDevelopment in Education Program)Dr. J. Epp (Pre-Service Teacher Education)Dr. A. Gilbert (Chemical Engineering)Dr. A. Gillies (Civil Engineering)Dr. S. Mansour (Electrical Engineering)Dr. S. Tsang (Mechanical Engineering)
LAKEHEAD UNIVERSITY ORGANIZATION - 2001/02

ELECTED FACULTY MEMBERS
Prof. G. KnutsonDr. N. LaVoieDr. M. LankesterDr. G. MunroDr. P. SatinderDr. W. SearsDr. R. DilleyDr. L. Di MatteoDr. K.C. YangProf. T. Stevens (Senate Rep. to the Board ofGovernors)
CHAIRS OF SENATE COMMITTEES
Dr. J. Michael Richardson (Academic)Dr. William M. Sears (Academic Appeal)Dr. William H. Parker (Budget Committee)Dr. Sultan A.Q. Siddiqui (Computing)Dr. Frederick F. Gilbert (Executive)Dr. Ron B. Davis (Graduate Scholarships andBursaries)Dr. William J. Montelpare (Graduate Studies)Dr. Jane E. Crossman (Honorary Degrees)Dr. Elizabeth A. Hollis Berry (Library)Dr. Fentey Scott (Nominations)Dr. Kim Fedderson (Organization)Professor Sharon Cole (Part-time Studies)Dr. Alan D. Bowd (Research)Dr. Richard Maundrell (Research Ethics)Dr. Anthony Bauer (Teaching and Learning)Dr. Walter T. Momot (UndergraduateScholarships and Bursaries)
Professor David Parsons (UndergraduateStudies)
ELECTED REPRESENTATIVES FROM THEBOARD OF GOVERNORS
Ms Cheryl BalackoMr. Ruth BaxterMr. Jim Kalyta
LUAMC REPRESENTATIVE
Mr. Mike Poulin
STUDENT REPRESENTATIVES
Mr. Lorne D. BookerMs Becky HardieMs Jennifer KeystoneMr. Eli McGowanMs Anukul PanuMr. Ryan White
Academic Colleague to COUDr. L. GarredAlternate - Dr. B. Singh
MEETINGS 2002/03
Board of GovernorsSeptember 20, 4:00 p.m.November 14, 4:00 p.m.January 9, 4:00 p.m.March 6, 4:00 p.m.April 24, 4:00 p.m.June 19, 4:00 p.m.September 19, 4:00 p.m.
SenateSeptember 27, 4:30 p.m.October 25, 4:30 p.m.November 29, 4:30 p.m.January 31, 4:30 p.m.March 28, 4:30 p.m.

ACADEMIC FACULTIES, DEPARTMENTS & SCHOOLS2001/02
FACULTY OF SCIENCE AND ENVIRONMENTAL STUDIES
DEPARTMENTS: AnthropologyBiologyChemistryComputer ScienceGeneral ScienceGeographyGeologyMathematical SciencesPhysics
FACULTY OF SOCIAL SCIENCES AND HUMANITIES
DEPARTMENTS: EconomicsEnglishGeneral ArtsGerontologyHistoryIndigenous LearningLanguagesMusicNorthern StudiesPhilosophyPolitical SciencePsychologySociologyVisual ArtsWomen’s Studies
FACULTY OF BUSINESS ADMINISTRATION
DEPARTMENTS: Honours Bachelor of CommerceBachelor of Administration
FACULTY OF EDUCATION
DEPARTMENTS: Continuing Teacher EducationPre-Service Teacher Education
FACULTY OF ENGINEERING
DEPARTMENTS: Chemical EngineeringCivil EngineeringElectrical EngineeringMechanical EngineeringSoftware Engineering
FACULTY OF FORESTRY & THE FOREST ENVIRONMENT
DEPARTMENTS: Forest ManagementEnvironmental Studies & Forest Conservation
FACULTY OF PROFESSIONAL SCHOOLS
DEPARTMENTS: KinesiologyNursingOutdoor Recreation, Parks and TourismSocial Work

COLLECTIONS, CIRCULATION AND REFERENCE STATISTICS:
THE CHANCELLOR PATERSON LIBRARY AND EDUCATION LIBRARY
1991/92 1992/93 1993/94 1994/95 1995/96 1996/97 1997/98 1998/99 1999/00 2000/01
COLLECTION STATISTICS
Books 542,635 570,320 586,419 671,226 692,672 699,612 704,637 715,253 719,253 725,396 Periodical Subscriptions (Paid) 4,900 4,600 2,983 2,993 2,793 2,626 2,460 2,200 2,100 2,219 Microforms 275,563 284,601 305,837 311,326 314,684 361,920 369,508 373,926 386,246 640,400 CD-ROMs 18 20 23 36 40 51 80 101 119 133
CIRCULATION STATISTICS
Circulated Items 208,322 221,840 231,677 216,959 200,076 181,483 184,227 159,331 154,229 158,837
REFERENCE STATISTICS
Reference Queries 26,725 27,563 28,603 30,066 30,062 26,459 27,617 22,975 21,800 21,977 Interlibrary Loans - Items Borrowed 6,679 7,915 8,959 9,135 7,066 7,562 8,449 7,901 10,124 9,446 - Items Loaned 2,464 2,597 2,868 2,801 2,720 3,708 4,519 4,737 4,138 3,976
OFF-CAMPUS/DISTANCE EDUCATION
Books Sent 959 820 629 508 478 351 266 144 165 180 Journal Articles Sent 898 1,273 1,112 870 931 596 744 873 1,257 1,395
Institutional AnalysisNovember 2001
LIBRARY.WK4

LAKEHEAD UNIVERSITY 08/23/2002
6000
7000
8000
9000
10000
11000
Year
BIU
s
90/91 91/92 92/93 93/94 94/95 95/96 96/97 97/98 98/99 99/00 00/01 01/02
Ceiling Base Floor Actual BIU's Moving Average
BIU ComparisonActual and Moving Average
Institutional Analysis FTEBIU%.WK4

B.I.U. WEIGHT/FTE
UNDERGRADUATE PROGRAMS:
DEGREE PROGRAMS
Arts, General and 1st Year Honours 1.00Arts, Upper Year Honours 1.50Bachelor of Engineering 2.00Commerce and Business Administration 1.50Education - Consecutive Degree 2.00Education - 4 Year Concurrent Arts and Science 1.25Education - 5 Year Concurrent Arts 1.50Education - 5 Year Concurrent Science 1.80Engineering (Applied Science) 2.00Forestry 2.00Honours Bachelor of Outdoor Recreation 1.50Kinesiology 1.50Music (HB Music) 2.00Nursing 2.00Science, Environmental Studies, Upper Year Honours 2.00Science, Environmental Studies, General 1st Year Honours 1.00Social Work, 1st Year 1.00Social Work, Upper Years 1.50Visual Arts and HBA (Music) 1.50
DIPLOMA PROGRAMS
Technology Courses 1.00Engineering Technology 1.20Forestry Technology 1.20
GRADUATE PROGRAMS:
MASTERS
Education 1.0/term, maximum 6
Engineering 1.3/term, maximum 8
Forestry 1.3/term, maximum 8
Humanities and Social Sciences 1.0/term, maximum 6
Kinesiology 1.0/term, maximum 6
Mathematics 1.0/term, maximum 6
Physical and Biological Sciences 1.3/term, maximum 8
Psychology 1.3/term, maximum 8
Social Work 1.3/term, maximum 8
PhD:
Psychology 2.0/term, maximum 27 lessEducation (Joint) Master's weights used

GLOSSARY OF ACRONYMSACAATO Association of Colleges of Applied Arts and
Technology of OntarioATAC Advanced Technology and Academic CentreATOP Access to Opportunities ProgramATRC Aquatic Toxicity Research CentreAUCC Association of Universities and Colleges of
CanadaBIU Basic Income UnitCAAT College of Applied Arts and TechnologyCARIS Centre for the Application of Resources
Information SystemsCAUBO Canadian Association of University Business
OfficersCAUT Canadian Association of University TeachersCCOU Council of Chairs - Universities of OntarioCFI Canada Foundation for InnovationCFS Canadian Federation of StudentsCFS-O Canadian Federation of Students - OntarioCHST Canadian Health and Social TransferCIDA Canadian International Development AgencyCIHR Canadian Institutes of Health ResearchCMSF Canadian Millennium Scholarship FundCNFER Centre for Northern Forest Ecosystem ResearchCOE Centres of ExcellenceCOFO-UO Council of Financial Officers - Universities of
OntarioCOP Council of PresidentsCOU Council of Ontario UniversitiesCRaNHR Centre for Rural and Northern Health Research
CSAO Council of Senior Administrative OfficersCSAO-UO Council of Senior Administrative Officers -
Universities of OntarioCSLP Canada Student Loan ProgramCUCC College-University Consortium CouncilCUPA Committee on University Planning and AnalysisCUPE Canadian Union of Public EmployeesCURIE Canadian Universities Reciprocal Insurance
ExchangeEPF Established Programs FinancingFCE Full Course EquivalentFRP Facilities Renewal ProgramFT Full-timeFTE Full-Time EquivalentICRP Income Contingent Repayment PlanIDRC International Development Research CentreIRAP Industrial Research Assistance ProgramIUOE International Union of Operating EngineersLTRC Lakehead Technology and Research CentreLUAMC Lakehead University Aboriginal Management
CouncilLUCAS Lakehead University Centre for Analytical
ServicesLUEL Lakehead University Environmental LaboratoryLUFA Lakehead University Faculty AssociationLUPRAC Lakehead University Program Review Audit
CommitteeLUSU Lakehead University Student Union

MEDTT Ministry of Economic Development, Trade andTourism
MEST Ministry of Energy, Science and TechnologyMRC Medical Research Council of CanadaMTCU Ministry of Training, Colleges & UniversitiesNCE Networks of Centres of ExcellenceNECAH Northern Educational Centre for Aging & HealthNOMP Northwestern Ontario Medical ProgramNOTC Northwestern Ontario Technology CentreNRC National Research CouncilNSERC Natural Sciences & Engineering Research Council
of CanadaOAC Ontario Academic CreditOCAV Ontario Council of Academic Vice-PresidentsOCGS Ontario Council on Graduate StudiesOCSA Ontario Committee on Student AffairsOCUFA Ontario Council of University Faculty AssociationsOIT Ontario Innovation TrustOPAS Office for Partnerships for Advanced SkillsOPEIU Office & Professional Employees International
UnionORDCF Ontario Research & Development Challenge FundOSAP Ontario Student Assistance ProgramOUAC Ontario Universities’ Application CentreOUCA Ontario Universities’ Council on AdmissionsOURA Ontario Universities Registrars’ AssociationPREA Premier’s Research Excellence AwardsPT Part-timeROIE Research Overhead Infrastructure EnvelopeRPF Research Performance FundSEIU Service Employees International Union
SSHRC Social Sciences & Humanities Research Council ofCanada
UCASS University and College Academic Staff System(Stats Canada)
USWA United Steelworkers of America

SECTION 2 - STUDENT DATA
FTE/BIU History
Degrees Awarded by Program
Full-time and Part-time Enrolment by Majors
Enrolment by Gender, Registration Status and Level, Fall 2001
Enrolment by Gender, 1991 to 2001
Enrolment by Level and Registration Status, 1990 to 2001
Age Distribution of Registered Applicants, 1990 to 2000
Geographic Distribution of Full-time Registrants
Applicant/Registrant Data
Analyses of Total and First Choice Applications & Registrations
Undergraduate Class Sizes

FTE/BIU HISTORYYEAR 1990/91 1991/92 1992/93 1993/94 1994/95 1995/96 1996/97 1997/98 1998/99 1999/00 2000/01 2001/02
UNDERGRADFTEs - Eligible (for funding) 5,004 5,452 6,047 6,416 6,578 6,271 5,834 5,904 5,635 5,443 5,295 5,282FTEs - Ineligible 23 16 34 31 37 41 159 176 180 134 145 171
BIUs - Eligible 6,973 7,682 8,431 8,885 9,070 8,742 8,202 8,403 8,038 7,865 7,732 7,746BIUs - Ineligible 24 17 38 24 42 48 253 289 268 208 228 272
GRADUATE
FTEs - Eligible 491 512 515 576 584 561 465 458 499 497 429 459FTEs - Ineligible 38 81 96 126 129 176 192 213 187 186 178 165
BIUs - Eligible 567 595 596 660 672 651 533 535 605 609 547 594BIUs - Ineligible 44 97 113 150 151 207 235 255 218 212 201 193
TOTALFTEs - Eligible 5,494 5,964 6,562 6,992 7,161 6,831 6,299 6,362 6,135 5,940 5,724 5,741FTEs - Ineligible 61 97 130 157 167 216 350 389 367 320 323 336BIUs - Eligible 7,540 8,277 9,027 9,545 9,742 9,393 8,735 8,939 8,644 8,474 8,280 8,340BIUs - Ineligible 67 114 151 175 193 254 489 544 486 421 429 464
Total FTEs 5,556 6,061 6,692 7,149 7,328 7,047 6,649 6,751 6,501 6,260 6,047 6,077
Total BIUs 7,608 8,391 9,178 9,720 9,935 9,647 9,223 9,483 9,129 8,894 8,709 8,804
BIU/FTE Ratio 1.37 1.39 1.38 1.37 1.36 1.37 1.39 1.41 1.41 1.43 1.45 1.45
ACTUAL INSTITUTION TOTALS(eligible only)Min/Max Adjustments (included in total) 4.44 0.48 0.44 4.93 11.19 3.99 9.17 4.81 5.70 8.06 -0.38 8.74BIUs 7,540 8,277 9,027 9,545 9742 9,393 8,735 8,939 8,644 8,474 8,280 8,340
Source: MTCU Summary Report of USIS-UAR
5 YEAR MOVING AVERAGE BIUs CORRIDOR
1990/91 6,7871991/92 7,164 Floor 7,020 1992/93 7,535 Base 7,237 1993/94 7,908 Ceiling 7,454 1994/95 8,2351995/96 8,8261996/97 9,1971997/98 9,2881998/99 9,2711999/00 9,0912000/01 8,8372001/02 8,614
Institutional Analysis FTEBIU01.WK4
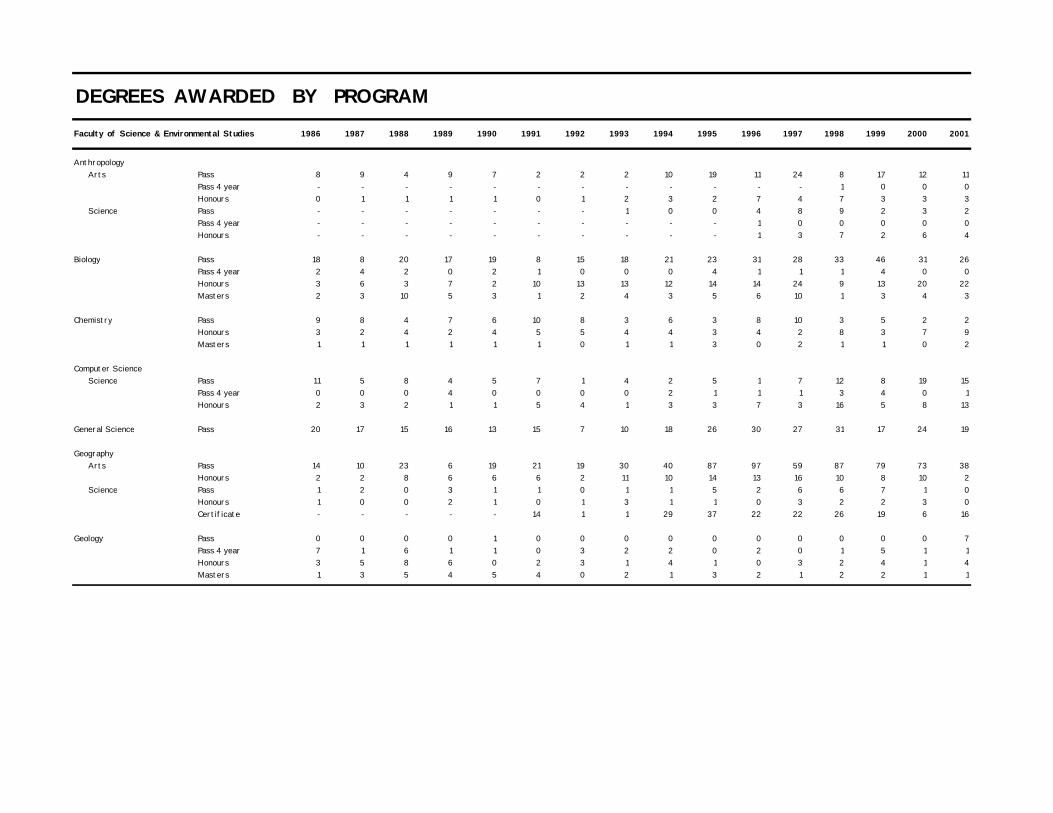
DEGREES AWARDED BY PROGRAM
Faculty of Science & Environmental Studies 1986 1987 1988 1989 1990 1991 1992 1993 1994 1995 1996 1997 1998 1999 2000 2001
Anthropology Arts Pass 8 9 4 9 7 2 2 2 10 19 11 24 8 17 12 11
Pass 4 year - - - - - - - - - - - - 1 0 0 0Honours 0 1 1 1 1 0 1 2 3 2 7 4 7 3 3 3
Science Pass - - - - - - - 1 0 0 4 8 9 2 3 2Pass 4 year - - - - - - - - - - 1 0 0 0 0 0Honours - - - - - - - - - - 1 3 7 2 6 4
Biology Pass 18 8 20 17 19 8 15 18 21 23 31 28 33 46 31 26Pass 4 year 2 4 2 0 2 1 0 0 0 4 1 1 1 4 0 0Honours 3 6 3 7 2 10 13 13 12 14 14 24 9 13 20 22Masters 2 3 10 5 3 1 2 4 3 5 6 10 1 3 4 3
Chemistry Pass 9 8 4 7 6 10 8 3 6 3 8 10 3 5 2 2Honours 3 2 4 2 4 5 5 4 4 3 4 2 8 3 7 9Masters 1 1 1 1 1 1 0 1 1 3 0 2 1 1 0 2
Computer Science Science Pass 11 5 8 4 5 7 1 4 2 5 1 7 12 8 19 15
Pass 4 year 0 0 0 4 0 0 0 0 2 1 1 1 3 4 0 1Honours 2 3 2 1 1 5 4 1 3 3 7 3 16 5 8 13
General Science Pass 20 17 15 16 13 15 7 10 18 26 30 27 31 17 24 19
Geography Arts Pass 14 10 23 6 19 21 19 30 40 87 97 59 87 79 73 38
Honours 2 2 8 6 6 6 2 11 10 14 13 16 10 8 10 2 Science Pass 1 2 0 3 1 1 0 1 1 5 2 6 6 7 1 0
Honours 1 0 0 2 1 0 1 3 1 1 0 3 2 2 3 0Certificate - - - - - 14 1 1 29 37 22 22 26 19 6 16
Geology Pass 0 0 0 0 1 0 0 0 0 0 0 0 0 0 0 7Pass 4 year 7 1 6 1 1 0 3 2 2 0 2 0 1 5 1 1Honours 3 5 8 6 0 2 3 1 4 1 0 3 2 4 1 4Masters 1 3 5 4 5 4 0 2 1 3 2 1 2 2 1 1

DEGREES AWARDED BY PROGRAM
Faculty of Science & Environmental Studies 1986 1987 1988 1989 1990 1991 1992 1993 1994 1995 1996 1997 1998 1999 2000 2001
Mathematical Sciences Arts Pass 3 0 1 2 0 1 1 5 7 10 8 3 7 7 5 4
Pass 4 year - - - - - - - - - - 1 1 0 0 0 0Honours 0 0 0 0 0 0 0 0 1 1 0 3 1 1 1 2Masters 0 0 0 0 0 0 1 0 0 0 0 1 0 1 0 0
Science Pass 6 6 7 0 4 2 1 3 5 2 6 4 4 3 3 7Pass 4 year 0 0 0 0 1 0 0 0 2 1 0 0 0 0 0 0Honours 2 2 2 0 2 0 2 1 2 1 0 1 3 0 1 1Masters 1 1 1 0 1 2 2 4 1 2 3 5 3 6 5 6
Natural Science Pass 10 15 18 18 12 5 4 10 28 55 31 47 50 34 41 24
Physics Pass 4 5 11 8 5 5 4 10 8 4 4 4 3 7 3 2Pass 4 year 0 0 0 0 1 0 1 2 1 1 0 0 0 0 0 0Honours 5 5 2 7 5 5 5 6 2 3 4 2 2 2 1 1Masters 0 1 3 1 0 2 1 1 1 2 1 0 1 1 0 2
Total Faculty of Science and Environmental Studies
Certificate - - - - - 14 1 1 29 37 22 22 26 19 6 16Pass 104 85 111 90 92 77 62 97 146 239 233 227 253 232 217 157Pass 4-year 9 5 8 5 5 1 4 4 7 7 6 3 6 13 1 2Honours 21 26 30 32 22 33 36 42 42 43 50 64 67 43 61 61Masters 5 9 20 11 10 10 6 12 7 15 12 19 8 14 10 14
Total Faculty of Science and Environmental Studies 125 169 138 129 135 109 156 231 341 323 335 360 321 295 250

DEGREES AWARDED BY PROGRAM
Faculty of Social Sciences & Humanities 1986 1987 1988 1989 1990 1991 1992 1993 1994 1995 1996 1997 1998 1999 2000 2001
Economics Pass 21 15 10 6 6 17 25 13 9 10 12 4 3 4 5 0Honours 2 2 0 1 2 2 11 4 3 5 2 0 2 2 1 2Masters 7 4 3 3 3 5 5 5 6 5 3 2 2 2 4 8
English Pass 26 26 19 16 15 23 29 43 71 67 55 53 61 47 73 46Honours 6 6 4 11 8 9 11 18 10 27 28 20 10 16 13 11Masters 1 1 5 1 0 2 4 6 3 6 6 9 7 7 4 7
General Arts Pass 62 72 94 68 86 66 53 68 82 66 85 74 78 59 61 54
History Pass 8 10 13 12 9 19 20 30 39 47 52 48 36 40 48 43Honours 1 1 0 5 0 6 3 8 7 6 10 17 7 9 5 6Masters 0 0 0 0 1 0 0 3 5 1 2 0 1 3 1 1
Indigenous Learning Pass - - - - - - - - - 4 1 9 6 6 11 10Honours - - - - - - - - - - 1 1 3 0 1 0Certificate - - - - - - - - - 2 2 1 0 2 1 1
Languages French Pass 9 9 11 3 13 15 9 26 28 33 31 25 25 17 12 18
Honours 3 3 3 3 8 3 5 2 5 5 3 8 4 2 3 2Certificate - - - - - - - - - - - - - 1 0 0
French/Spanish Pass 1 0 0 0 0 0 0 0 0 0 0 0 0 0 0 0Honours 0 0 0 1 0 0 0 0 0 0 0 0 0 0 0 0
Lib & Inf Studies Arts 0 0 0 0 0 8 2 2 0 1 0 0 0 0 0 0
Diploma 0 0 12 13 10 8 7 12 13 23 13 9 15 12 5 12Library Technology 20 5 0 0 0 0 0 0 0 0 0 0 0 0 0 0
Med. Lab. Sci. Honours 4 3 5 6 8 2 3 1 8 5 11 10 7 3 0 0Certificate 4
Music Honours 0 3 2 1 5 6 0 5 5 6 10 7 13 10 7 6
Northern Studies

DEGREES AWARDED BY PROGRAM
Faculty of Social Sciences and Humanities 1986 1987 1988 1989 1990 1991 1992 1993 1994 1995 1996 1997 1998 1999 2000 2001
Philosophy Pass 5 1 4 2 2 5 3 2 1 7 5 3 5 6 6 4Honours 2 1 1 1 0 0 3 6 2 1 2 1 1 0 2 2Masters 2 0 1 1 2
Political Science Pass 7 6 18 11 11 14 21 16 26 27 28 14 18 12 24 9Honours 2 0 4 5 6 7 2 12 9 6 8 11 5 9 5 10
Psychology Arts Pass 42 69 59 48 50 74 65 75 81 86 111 120 84 91 84 75
Honours 14 12 14 4 17 17 21 26 31 34 46 28 45 37 39 15Masters 10 15 15 20 14 14 15 21 12 24 18 17 7 9 12 13PhD - - - - - - - - - - - - 1 0 0 1
Science Pass 1 0 2 0 0 2 3 1 2 4 3 3 2 9 8 1Honours 0 0 4 0 0 1 0 0 3 1 5 6 5 5 4 5
Sociology Pass 23 35 35 40 31 35 31 51 78 73 81 67 44 44 58 37Honours 5 6 5 0 6 7 7 7 14 17 22 13 17 12 8 6Masters 1 2 3 3 2 2 1 4 5 3 4 4 5 5 8 2
Visual Arts Pass 0 0 0 0 0 0 0 1 2 2 8 11 8 8 4 3Honours 3 3 3 3 6 1 1 8 2 9 10 5 5 3 5 5
Total Social Sciences and Humanities
Certificate 0 0 0 0 0 0 0 0 0 2 2 1 4 3 1 1Diploma 20 5 12 13 10 8 7 12 13 23 13 9 15 12 5 12Pass 205 243 265 206 223 278 261 328 419 427 472 431 370 343 394 300Honours 42 40 45 41 66 61 67 97 99 122 158 127 124 108 93 70Masters 19 22 26 27 20 23 25 39 31 39 33 34 22 27 30 33PhD - 0 0 0 0 0 0 0 0 0 0 0 1 0 0 1
Total Social Sciences & Humanities 266 305 348 287 319 376 359 475 591 649 700 624 562 512 523 417

DEGREES AWARDED BY PROGRAM
Faculty of Professional Schools 1986 1987 1988 1989 1990 1991 1992 1993 1994 1995 1996 1997 1998 1999 2000 2001
Kinesiology Honours Bachelor PE 31 17 26 30 27 25 28 45 49 4 0 0 0 0 0 0 Honours Bachelor Kinesiology - - - - - - - - - 38 70 56 80 71 92 70 MA/MSc. Coaching 5 3 2 1 5 3 4 3 4 3 7 7 5 4 6 9
Nursing Bachelor of Science - - - - - - - - - 6 48 53 35 43 35 35 Honours Bachelor Science 62 62 61 63 51 47 67 94 57 65 3 0 0 0 0 0
Certificate - - - - - - - - - - - - 10 20 23 23
Outdoor Recreation HBOR 28 26 24 22 33 57 52 35 32 82 64 60 73 86 85 97Certificate - - - - - - - - 15 31 27 21 8 33 34 32
Social Work Honours 36 40 56 44 59 53 47 39 48 44 41 47 48 47 37 48Masters 0 0 0 0 0 0 0 2 3 6 15 13 11 13 14 9
Total Professional Schools
Certificate - - - - - - - - 15 31 27 21 18 53 57 55Bachelor - - - - - - - - - 6 48 53 35 43 35 35Honours 157 145 167 159 170 182 194 213 186 233 178 163 201 204 214 215Masters 5 3 2 1 5 3 4 5 7 9 22 20 16 17 20 18
Total Professional Schools 162 148 169 160 175 185 198 218 208 279 275 257 270 317 326 323
Faculty of Business Administration
Honours Bachelor Commerce 27 23 26 33 26 26 43 26 48 41 40 53 37 50 55 56 Bachelor Administration 70 86 95 96 163 92 110 129 103 121 89 77 75 80 52 69 Grad. Diploma Business Admin. 5 8 4 4 3 2 3 0 0 0 0 0 0 0 0 0 Business Administration Diploma 3 0 0 0 0 0 0 0 0 0 0 0 0 0 0 0
Total Business
Diploma 8 8 4 4 3 2 3 0 0 0 0 0 0 0 0 0 Bachelor 70 86 95 96 163 92 110 129 103 121 89 77 75 80 52 69 Honours 27 23 26 33 26 26 43 26 48 41 40 53 37 50 55 56
Total Business 105 117 125 133 192 120 156 155 151 162 129 130 112 130 107 125

DEGREES AWARDED BY PROGRAM
Faculty of Education 1986 1987 1988 1989 1990 1991 1992 1993 1994 1995 1996 1997 1998 1999 2000 2001
Bachelor of Education 157 160 293 316 288 378 339 360 376 394 391 379 412 428 521 592 Masters - Curriculum Development 9 6 11 6 7 8 6 15 12 12 13 8 6 9 7 11 Masters - Educational Admin. 14 14 7 13 13 12 11 3 6 13 9 9 3 3 4 12 Native Teacher Education Diploma 7 8 7 1 0 1 1 0 0 0 0 0 0 0 0 0 Native Language Instructor's Diploma 4 4 0 4 3 1 36 21 18 22 21 20 17 5 11 11
Total Faculty of Education
Diploma 11 12 7 5 3 2 37 21 18 22 21 20 17 5 11 11 Bachelor 157 160 293 316 288 378 339 360 376 394 391 379 412 428 521 592 Masters 23 20 18 19 20 20 17 18 18 25 22 17 9 12 11 23
Total Faculty of Education 191 192 318 340 311 400 393 399 412 441 434 416 438 445 543 626
Faculty of Engineering
Bachelor Chemical 16 11 9 12 10 8 6 13 8 17 6 12 12 10 12 9Civil 37 25 30 18 19 19 19 35 28 36 46 33 34 33 28 35Electrical 40 28 35 57 51 39 64 31 67 44 41 33 41 45 43 61Mechanical 51 31 33 28 36 24 28 34 31 25 22 28 18 21 26 25
Masters - - - - - - - - - - - 1 2 2 2 2 Technology Chemical 10 13 6 20 6 4 11 11 9 13 12 7 7 7 9 8
Civil 16 13 8 4 10 16 18 14 14 20 17 20 8 12 5 9Electrical 31 38 29 22 20 18 27 18 29 21 19 15 20 10 21 21Mechanical 21 28 21 19 15 26 12 18 19 21 22 22 18 21 17 10Software - - - - - - - - - - - - - - - 6
Total Engineering
Diploma 78 92 64 65 51 64 68 61 71 75 70 64 53 50 52 54 Bachelor 144 95 107 115 116 90 117 113 134 122 115 106 105 109 109 130 Masters - - - - - - - - - - - 1 2 2 2 2
Total Engineering 222 187 171 180 167 154 185 174 205 197 185 171 160 161 163 186

DEGREES AWARDED BY PROGRAM
Faculty of Forestry & the Forest Environment 1986 1987 1988 1989 1990 1991 1992 1993 1994 1995 1996 1997 1998 1999 2000 2001
Honours Bachelor Science 48 36 55 44 25 20 29 22 19 28 31 39 33 37 47 55 BES - - - - - - - - - - - - - 2 11 16 HBES - - - - - - - - - - - - - 2 3 5 Masters Science 9 5 7 4 9 10 4 7 12 8 9 11 6 5 19 10 Integrated Forest Resources Man. Diploma 41 34 21 9 10 16 16 10 12 9 16 23 13 9 15 0
Total Forestry & the Forest Environment
Diploma 41 34 21 9 10 16 16 10 12 9 16 23 13 9 15 0 Bachelor - - - - - - - - - - - - - 2 11 16 Honours 48 36 55 44 25 20 29 22 19 28 31 39 33 39 50 60 Masters 9 5 7 4 9 10 4 7 12 8 9 11 6 5 19 10
Total Forestry & the Forest Environment 98 75 83 57 44 46 49 39 43 45 56 73 52 55 95 86
TOTAL UNIVERSITY
Certificate 0 0 0 0 0 0 1 1 44 70 51 44 48 75 64 72Diploma 158 151 108 96 77 92 131 104 114 129 120 116 98 76 83 77Bachelors 680 669 871 823 882 915 889 1027 1178 1309 1348 1273 1250 1237 1339 1299Pass 4-year 9 5 8 5 5 1 4 4 7 7 6 3 6 13 1 2Honours 295 270 323 309 309 322 369 400 394 467 457 446 462 444 473 462Masters 61 59 73 62 64 66 56 81 75 96 98 102 63 77 92 100PhD - 0 0 0 0 0 0 0 0 0 0 0 1 0 0 1
TOTAL UNIVERSITY 1,203 1,154 1,383 1,295 1,337 1,396 1,450 1,617 1,812 2,078 2,080 1,984 1,928 1,922 2,052 2,013
NOTES: 1. Reported by calendar year.2. Native Teacher Education Diploma has been discontinued. The program is now a BA/BEd degree and is included in the Bachelor of Education data.3. Prior to 1996, Political Science was Political Studies.4. Prior to 1996, Kinesiology was Physical Education.5. Concurrent degrees are counted twice, for example, HBOR/BSc is counted as an HBOR degree and a Natural Science BSc. BA/BEd and BSc/BEd are included in Arts & Science and in the BEd program.
Institutional AnalysisNovember 2001

11/07/2002
FULL-TIME ENROLMENT BY MAJORS - FALL/WINTER
UNDERGRADUATE GRADUATE TOTAL
DEPARTMENT 93/94 94/95 95/96 96/97 97/98 98/99 99/00 00/01 01/02 93/94 94/95 95/96 96/97 97/98 98/99 99/00 00/01 01/02 93/94 94/95 95/96 96/97 97/98 98/99 99/00 00/01 01/02
Anthropology 58 80 96 104 93 70 56 45 32 0 0 0 0 0 0 0 0 0 58 80 96 104 93 70 56 45 32Biology 180 215 205 212 200 188 164 147 141 16 18 18 13 8 13 9 15 19 196 233 223 225 208 201 173 162 160 Natural Science 84 104 74 52 44 46 29 22 22 0 0 0 0 0 0 0 0 0 84 104 74 52 44 46 29 22 22Business Administration 435 422 425 435 436 449 385 373 338 0 0 0 0 0 0 0 0 0 435 422 425 435 436 449 385 373 338Chemistry 39 45 52 47 31 31 22 32 15 8 5 2 4 3 3 2 2 3 47 50 54 51 34 34 24 34 18Economics 45 38 28 12 17 17 19 20 15 13 9 6 7 5 7 14 10 11 58 47 34 19 22 24 33 30 26Education 868 887 865 934 1,009 1,056 1,183 1,248 1,374 26 22 23 18 23 24 21 12 18 894 909 888 952 1,032 1,080 1,204 1,260 1,392Engineering 599 571 499 489 457 458 504 495 479 0 0 4 6 5 4 7 6 10 599 571 503 495 462 462 511 501 489English 192 180 163 134 84 80 73 69 81 26 21 23 17 15 11 12 10 13 218 201 186 151 99 91 85 79 94Environmental Studies - - - - - 10 29 46 52 - - - - - - - - - - - - - - 10 29 46 52Forestry/Forest Conservation 210 220 231 239 267 313 266 231 183 31 24 26 24 33 31 18 18 21 241 244 257 263 300 344 284 249 204General/Undecided/Special 460 464 484 411 395 377 384 356 268 0 0 0 0 0 0 0 0 0 460 464 484 411 395 377 384 356 268Geography 203 234 202 158 122 81 64 64 64 0 0 0 0 0 0 0 0 0 203 234 202 158 122 81 64 64 64Geology 13 8 10 10 16 28 28 25 24 9 5 4 2 2 4 3 3 6 22 13 14 12 18 32 31 28 30History 136 152 126 95 66 56 49 60 88 12 8 6 5 8 9 9 8 7 148 160 132 100 74 65 58 68 95Indigenous Learning 0 20 32 29 31 24 20 21 22 0 0 0 0 0 0 0 0 0 0 20 32 29 31 24 20 21 22Kinesiology 307 314 317 356 373 321 313 286 230 15 22 25 19 16 18 18 12 10 322 336 342 375 389 339 331 298 240Languages 70 52 35 29 13 15 8 14 16 0 0 0 0 0 0 0 0 0 70 52 35 29 13 15 8 14 16Lib & Info Studies 34 31 19 19 26 14 3 4 1 0 0 0 0 0 0 0 0 0 34 31 19 19 26 14 3 4 1 Library Tech 0 0 0 0 0 0 0 0 0 0 0 0 0 0 0 0 0 0 0 0 0 0 0 0 0 0 0Mathematics 83 112 32 27 21 17 18 17 15 5 8 10 9 16 18 12 8 9 88 120 42 36 37 35 30 25 24 Computer Science 0 0 87 97 114 125 98 113 87 0 0 0 0 0 0 0 0 0 0 0 87 97 114 125 98 113 87Medical Lab Science 31 42 30 11 9 2 0 0 0 0 0 0 0 0 0 0 0 0 31 42 30 11 9 2 0 0 0Music 46 52 49 57 47 33 31 26 28 0 0 0 0 0 0 0 0 0 46 52 49 57 47 33 31 26 28Nursing 213 205 182 166 141 124 118 127 197 0 0 0 0 0 0 0 0 0 213 205 182 166 141 124 118 127 197Outdoor Recreation 366 370 356 381 457 466 407 387 330 0 0 0 0 0 0 0 0 0 366 370 356 381 457 466 407 387 330Philosophy 18 23 24 17 13 19 20 20 20 0 0 3 4 6 4 3 2 1 18 23 27 21 19 23 23 22 21Physics 36 25 25 31 26 20 15 23 23 7 5 5 2 3 2 3 4 2 43 30 30 33 29 22 18 27 25Political Science 126 124 89 85 76 72 76 66 62 0 0 0 0 0 0 0 0 0 126 124 89 85 76 72 76 66 62Psychology 372 387 400 393 335 273 213 195 198 33 37 38 34 34 33 43 39 39 405 424 438 427 369 306 256 234 237Social Work 164 166 159 159 168 150 117 123 145 0 0 18 14 21 24 18 17 14 164 166 177 173 189 174 135 140 159Sociology 162 151 130 127 125 89 86 68 74 18 12 19 19 21 20 20 16 17 180 163 149 146 146 109 106 84 91Visual Arts 52 155 71 59 56 59 49 47 38 0 0 0 0 0 0 0 0 0 52 155 71 59 56 59 49 47 38
TOTAL UNIVERSITY 5,602 5,849 5,497 5,375 5,268 5,083 4,847 4,770 4,662 219 196 230 197 219 225 212 182 200 5,821 6,045 5,727 5,572 5,487 5,308 5,059 4,952 4,862
A more detailed breakdown of full-time enrolment is available in Enrolment History and Projections.
NOTES : 1. Enrolment counts are based on November headcounts. 2. Students pursuing more than one degree are counted only once. 3. All dual degree students in HBOR and Education are counted in the Professional program. 4. Nursing Transition students are enrolled as Special Students in General/Undecided/Special.
ENROLMNT.WK4

11/07/2002
PART-TIME ENROLMENT BY MAJORS - FALL/WINTER
UNDERGRADUATE GRADUATE TOTAL
DEPARTMENT 93/94 94/95 95/96 96/97 97/98 98/99 99/00 00/01 01/02 93/94 94/95 95/96 96/97 97/98 98/99 99/00 00/01 01/02 93/94 94/95 95/96 96/97 97/98 98/99 99/00 00/01 01/02
Anthropology 18 17 16 11 16 10 21 10 16 0 0 0 0 0 0 0 0 0 18 17 16 11 16 10 21 10 16Biology 19 21 22 24 26 17 14 15 20 2 2 3 4 2 3 2 1 3 21 23 25 28 28 20 16 16 23 Natural Science 19 10 9 11 13 7 10 6 10 0 0 0 0 0 0 0 0 0 19 10 9 11 13 7 10 6 10Business Administration 91 92 72 84 74 73 87 81 56 0 0 0 0 0 0 0 0 0 91 92 72 84 74 73 87 81 56Chemistry 5 2 8 6 4 4 3 3 1 1 2 2 1 1 0 0 0 0 6 4 10 7 5 4 3 3 1Economics 14 8 4 0 1 2 3 2 3 2 0 0 0 0 0 1 0 1 16 8 4 0 1 2 4 2 4Education 85 118 220 100 163 235 165 150 212 62 85 69 60 54 29 42 48 42 147 203 289 160 217 264 207 198 254Engineering 38 33 34 25 21 25 23 24 34 0 0 6 3 5 2 4 1 1 38 33 40 28 26 27 27 25 35English 50 38 39 25 25 21 17 15 17 5 5 4 7 6 8 5 4 3 55 43 43 32 31 29 22 19 20Environmental Studies - - - - 0 3 2 5 - - - - - 0 0 0 0 - - - - - 0 3 2 5Forestry/Forest Conservation 6 9 10 12 16 8 35 20 23 11 9 5 13 7 5 20 12 8 17 18 15 25 23 13 55 32 31General/Undecided/Special 845 783 682 458 433 387 517 374 388 0 0 0 0 0 0 0 0 0 845 783 682 458 433 387 517 374 388Geography 33 26 24 13 13 8 10 12 10 0 0 0 0 0 0 0 0 0 33 26 24 13 13 8 10 12 10Geology 4 4 3 1 2 1 0 1 2 1 2 1 0 1 0 1 0 0 5 6 4 1 3 1 1 1 2History 18 22 21 16 16 6 8 13 7 5 2 4 5 3 1 0 0 1 23 24 25 21 19 7 8 13 8Indigenous Learning 0 16 2 5 6 6 10 3 9 0 0 0 0 0 0 0 0 0 0 16 2 5 6 6 10 3 9Kinesiology 5 15 15 9 12 12 8 6 6 2 0 0 0 3 0 1 9 2 7 15 15 9 15 12 9 15 8Languages 25 17 13 9 6 7 6 7 6 0 0 0 0 0 0 0 0 0 25 17 13 9 6 7 6 7 6Library & Info Studies 28 22 30 24 18 16 19 11 1 0 0 0 0 0 0 0 0 0 28 22 30 24 18 16 19 11 1 Library Tech 0 0 0 0 0 0 0 0 0 0 0 0 0 0 0 0 0 0 0 0 0 0 0 0 0 0 0Mathematics 24 22 8 2 2 0 3 2 10 2 0 3 3 4 1 3 0 0 26 22 11 5 6 1 6 2 10 Computer Science 0 0 9 13 25 10 44 19 22 0 0 0 0 0 0 0 0 0 0 0 9 13 25 10 44 19 22Medical Lab Science 20 12 15 14 3 1 1 0 0 0 0 0 0 0 0 0 0 0 20 12 15 14 3 1 1 0 0Music 30 22 24 13 23 18 13 16 13 0 0 0 0 0 0 0 0 0 30 22 24 13 23 18 13 16 13Nursing 41 31 35 70 90 132 181 182 137 0 0 0 0 0 0 0 0 0 41 31 35 70 90 132 181 182 137Outdoor Recreation 16 23 16 12 14 23 21 34 28 0 0 0 0 0 0 0 0 0 16 23 16 12 14 23 21 34 28Philosophy 7 5 6 6 5 4 7 3 2 0 0 0 0 0 1 0 1 0 7 5 6 6 5 5 7 4 2Physics 7 4 0 4 3 1 2 2 2 0 0 0 0 0 1 1 0 2 7 4 0 4 3 2 3 2 4Political Science 34 26 20 13 15 15 10 11 18 0 0 0 0 0 0 0 0 0 34 26 20 13 15 15 10 11 18Psychology 136 127 123 80 92 80 77 63 57 16 13 7 5 2 9 6 3 2 152 140 130 85 94 89 83 66 59Social Work 42 41 44 26 17 21 28 25 42 24 35 30 13 15 32 16 18 19 66 76 74 39 32 53 44 43 61Sociology 55 61 42 33 29 23 32 21 17 6 3 7 2 2 1 3 0 2 61 64 49 35 31 24 35 21 19Visual Arts 26 21 21 18 12 11 14 13 18 0 0 0 0 0 0 0 0 0 26 21 21 18 12 11 14 13 18
TOTAL UNIVERSITY 1,741 1,648 1,587 1,137 1,195 1,184 1,392 1,146 1,192 139 158 141 116 105 93 105 97 86 1,880 1,806 1,728 1,253 1,300 1,277 1,497 1,243 1,278
TOTAL P/T FCE ENROLMENT 1,507 1,406 1,375 987 1,117 1,013 1,952 N/A N/A 86 115 89 73 67 51 103 N/A N/A 1,593 1,521 1,464 1,060 1,183 1,064 2,055 N/A N/A
NOTES : 1. Enrolment counts are based on November headcounts. 2. Students pursuing more than one degree are counted only once. 3. All dual degree students in HBOR and Education are counted in the Professional program. 4. Nursing Transition students are enrolled as Special Students in General/Undecided/Special.
ENROLMNT.WK4

08/23/2002
ENROLMENT BY GENDER, REGISTRATION STATUS AND LEVELFALL 2001
TOTALMALE % OF TOTAL FEMALE % OF TOTAL ENROLMENT
FULL-TIME
Undergraduate 2,061 33.6% 2,601 42.4% 4,662
Master's 84 1.4% 96 1.6% 180
Doctoral 2 0.0% 18 0.3% 20
PART-TIME
Undergraduate 430 7.0% 762 12.4% 1,192
Master's 35 0.6% 48 0.8% 83
Doctoral 0 0.0% 3 0.0% 3
TOTAL 2,612 43% 3,528 57% 6,140
Institutional Analysis GENDER2.WK4

02/08/2002
ENROLMENT BY GENDER - 1991 TO 2001
1991/92 1992/93 1993/94 1994/95 1995/96 1996/97 1997/98 1998/99 1999/00 2000/01 2001/02
Male - F/T Undergraduate 2,306 2,595 2,847 2,973 2,769 2,702 2,603 2,460 2,331 2,173 2,061Male - F/T Graduate 97 101 119 103 111 95 108 113 96 74 86Total - F/T Males 2,403 2,696 2,966 3,076 2,880 2,797 2,711 2,573 2,427 2,247 2,147
Male - P/T Undergraduate 614 665 640 586 553 398 444 405 401 402 430Male - P/T Graduate 60 63 49 51 58 49 47 35 41 43 35Total - P/T Males 674 728 689 637 611 447 491 440 442 445 465
Total - Males 3,077 3,424 3,655 3,713 3,491 3,244 3,202 3,013 2,869 2,692 2,612
Female - F/T Undergraduate 2,212 2,524 2,756 2,875 2,727 2,673 2,665 2,622 2,516 2,597 2,601Female - F/T Graduate 90 82 100 94 119 102 111 112 109 108 114Total - F/T Females 2,302 2,606 2,856 2,969 2,846 2,775 2,776 2,734 2,625 2,705 2,715
Female - P/T Undergraduate 1,420 1,385 1,100 1,061 1,035 739 751 780 784 744 762Female - P/T Graduate 71 86 90 108 86 69 58 58 58 54 51Total - P/T Females 1,491 1,471 1,190 1,169 1,121 808 809 838 842 798 813
Total - Females 3,793 4,077 4,046 4,138 3,967 3,583 3,585 3,572 3,467 3,503 3,528
Total Enrolment 6,870 7,501 7,701 7,851 7,458 6,827 6,787 6,585 6,336 6,195 6,140
Institutional Analysis GENDER.WK4
02/15/2002
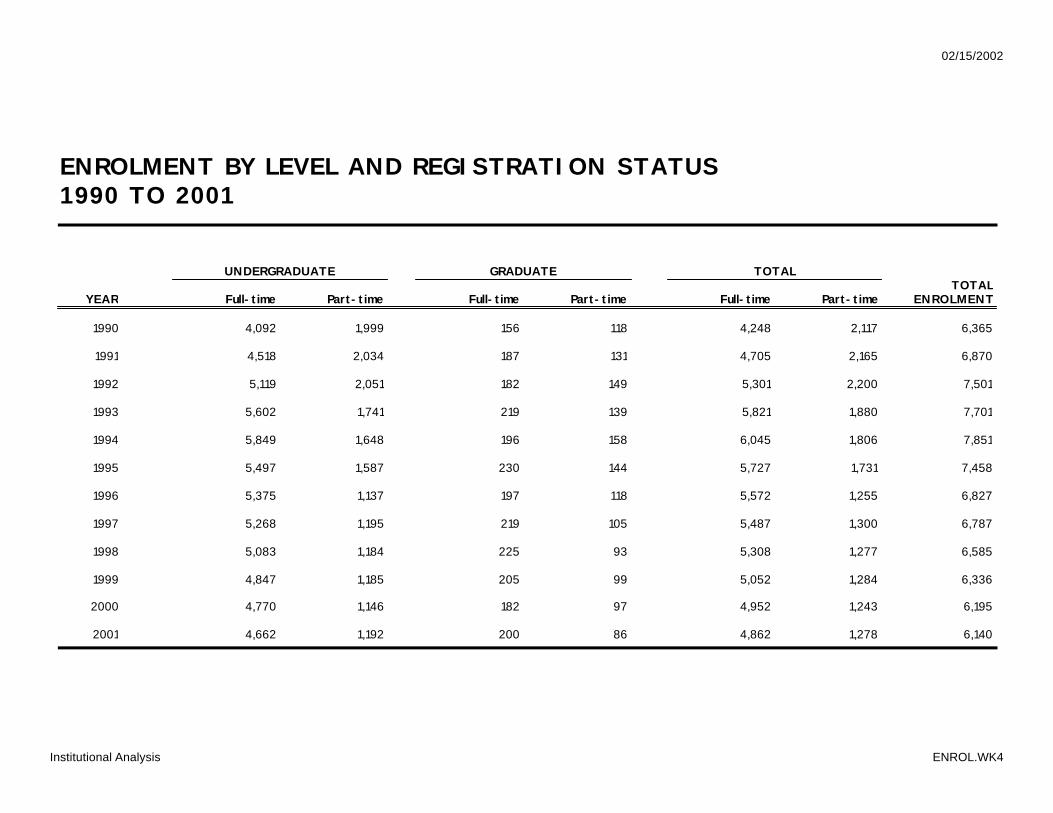
ENROLMENT BY LEVEL AND REGISTRATION STATUS1990 TO 2001
UNDERGRADUATE GRADUATE TOTALTOTAL
YEAR Full-time Part-time Full-time Part-time Full-time Part-time ENROLMENT
1990 4,092 1,999 156 118 4,248 2,117 6,365
1991 4,518 2,034 187 131 4,705 2,165 6,870
1992 5,119 2,051 182 149 5,301 2,200 7,501
1993 5,602 1,741 219 139 5,821 1,880 7,701
1994 5,849 1,648 196 158 6,045 1,806 7,851
1995 5,497 1,587 230 144 5,727 1,731 7,458
1996 5,375 1,137 197 118 5,572 1,255 6,827
1997 5,268 1,195 219 105 5,487 1,300 6,787
1998 5,083 1,184 225 93 5,308 1,277 6,585
1999 4,847 1,185 205 99 5,052 1,284 6,336
2000 4,770 1,146 182 97 4,952 1,243 6,195
2001 4,662 1,192 200 86 4,862 1,278 6,140
Institutional Analysis ENROL.WK4

08/23/2002
AGE DISTRIBUTION OF REGISTERED STUDENTS1990 to 2000Age Year
1990 1991 1992 1993 1994 1995 1996 1997 1998 1999 2000
19 & underF/T Undergrad 757 745 872 984 937 791 892 812 736 726 731F/T Grad 0 0 0 0 0 0 0 0 0 0 0P/T Undergrad 18 15 18 12 10 14 11 10 7 15 5P/T Grad 0 0 0 0 0 0 0 0 0 0 0
20 to 24F/T Undergrad 2353 2721 3158 3487 3767 3640 3437 3442 3358 3128 3032F/T Grad 46 43 53 54 46 45 36 55 53 51 48P/T Undergrad 295 357 387 450 430 415 353 334 281 355 293P/T Grad 0 2 3 3 2 1 0 1 7 3 2
25 to 29F/T Undergrad 563 604 620 662 611 599 561 582 577 582 581F/T Grad 55 68 53 73 80 85 75 78 82 76 75P/T Undergrad 396 410 379 316 307 288 242 213 229 204 211P/T Grad 28 27 38 32 27 27 15 17 14 26 20
30 - 39F/T Undergrad 313 347 369 372 406 328 338 304 286 287 293F/T Grad 45 62 54 64 48 73 59 57 64 50 36P/T Undergrad 648 624 630 515 433 435 274 298 319 302 327P/T Grad 47 56 52 49 53 44 36 39 37 40 40
40 & overF/T Undergrad 92 88 94 98 123 137 138 121 115 110 117F/T Grad 10 14 23 27 22 27 29 29 27 28 24P/T Undergrad 620 619 629 443 465 435 310 335 344 297 288P/T Grad 43 46 56 55 77 73 59 48 35 29 34
TotalF/T Undergrad 4078 4505 5113 5603 5844 5495 5366 5261 5072 4833 4754F/T Grad 156 187 183 218 196 230 199 219 226 205 183P/T Undergrad 1977 2025 2043 1736 1645 1587 1190 1190 1180 1173 1124P/T Grad 118 131 149 139 159 145 110 105 93 98 96
Not Recorded 36 22 13 4 7 1 13 12 14 27 38
Total 6365 6870 7501 7700 7851 7458 6878 6787 6585 6336 6195
Source: Statistics Canada
Institutional Analysis AGE.WK4

11/07/2002
GEOGRAPHIC DISTRIBUTION OF FULL-TIME REGISTRANTSNumber of Students
1990 1991 1992 1993 1994 1995 1996 1997 1998 1999 2000 2001
Northwestern Ontario 2,286 2,483 2,616 2,867 2,966 2,814 2,608 2,538 2,405 2,266 2,372 2,387Other Ontario 1,545 1,862 2,220 2,515 2,718 2,616 2,610 2,482 2,473 2,354 2,102 2,009Other Prov & Int. 417 424 391 456 414 375 358 334 394 432 478 466
TOTAL 4,248 4,769 5,227 5,838 6,098 5,805 5,576 5,354 5,272 5,052 4,952 4,862
Percentage of Students
1990 1991 1992 1993 1994 1995 1996 1997 1998 1999 2000 2001
Northwestern Ontario 53.8% 52.1% 50.0% 49.1% 48.6% 48.5% 46.8% 47.4% 45.6% 44.9% 47.9% 49.1%Other Ontario 36.4% 39.0% 42.5% 43.1% 44.6% 45.1% 46.8% 46.4% 46.9% 46.6% 42.4% 41.3%Other Prov & Int. 9.8% 8.9% 7.5% 7.8% 6.8% 6.5% 6.4% 6.2% 7.5% 8.6% 9.7% 9.6%
TOTAL 100.00% 100.00% 100.00% 100.00% 100.00% 100.00% 100.00% 100.00% 100.00% 100.00% 100.00% 100.00%
Note: Data may not match enrolment report which is at November 1. Northwestern Ontario includes Districts of Thunder Bay, Rainy River and Kenora with approximately 15% of registrants historically coming from the City of Thunder Bay.
Institutional Analysis GEO_DIS.WK4

08/08/2002
APPLICANT/REGISTRANT DATAFirst Year Total Applications & Registered Applicants by Enrolment Status in Previous YearFall 1987 to Fall 2001
TOTAL APPLICATIONS REGISTERED APPLICANTS
Non- Non- TotalYear Secondary Secondary Total Secondary Secondary First Year
1987 1,844 999 2,843 454 211 665
1988 2,293 1,209 3,502 651 284 935
1989 2,216 1,255 3,471 567 265 832
1990 2,524 1,439 3,963 689 294 983
1991 2,770 1,615 4,385 715 382 1,097
1992 3,192 1,895 5,087 853 446 1,299
1993 3,842 1,756 5,598 981 385 1,366
1994 3,919 1,710 5,629 980 357 1,337
1995 3,379 1,447 4,826 834 322 1,156
1996 3,397 1,278 4,675 931 288 1,219
1997 2,763 1,177 3,940 814 334 1,148
1998 2,645 (211) 1,021 (59) 3,666 (270) 714 284 998
1999 3,242 (613) 1,080 (111) 4,322 (724) 703 265 968
2000 3,172 (698) 1,128 (150) 4,300 (848) 681 274 955
2001* 2,968 (737) 1,442 (191) 4,410 (928) 621 346 N/A
Source: Ontario Universities Application Centre, Admission Data System Reports
Note: Commencing in 1998, application choices have changed to include choices greater than 3. Prior years include 1st, 2nd and 3rd choices only. Totals for choices greater than 3 are shown in parentheses.
* Preliminary data. Data on registered applicants for 2001 are for confirmations only.
Institutional Analysis APPLICAN.WK4

ANALYSES OF TOTAL AND FIRST-CHOICE APPLICATIONS
1983 TO 2000 -- ALL ONTARIO
All Universities Lakehead Lakehead/ALL Universities
Year Total 1st Choice Total 1st Choice Total 1st Choice
1983 143,067 56,372 2,658 1,084 1.86% 1.92%1984 150,916 56,972 3,149 1,228 2.09% 2.16%1985 163,740 60,098 2,935 1,144 1.79% 1.90%1986 160,865 60,112 2,538 1,051 1.58% 1.75%1987 169,413 61,843 2,482 953 1.47% 1.54%1988 217,953 79,988 3,502 1,382 1.61% 1.73%1989 233,243 86,778 3,471 1,384 1.49% 1.59%1990 239,511 88,326 3,963 1,533 1.65% 1.74%1991 239,468 88,848 4,385 1,621 1.83% 1.82%1992 246,186 91,114 5,087 2,020 2.07% 2.22%1993 244,660 87,913 5,598 2,114 2.29% 2.40%1994 244,694 87,724 5,629 2,160 2.30% 2.46%1995 232,839 83,783 4,826 1,877 2.07% 2.24%1996 229,032 82,454 4,675 1,794 2.04% 2.18%1997 222,150 80,286 3,940 1,574 1.77% 1.96%1998 240,127 78,274 3,666 1,379 1.53% 1.76%1999 262,692 82,033 4,322 1,398 1.65% 1.70%2000 301,700 85,012 4,300 1,384 1.43% 1.63%
Source: Ontario Universities Application Centre, Admission Data System Reports
Notes: Data pertain to applications to first-year programs processed through the Ontario Universities Application Centre only. When Advanced Standing and direct applications are included, Lakehead received and processed larger numbers each year.
Institutional AnalysisNovember 2001
APPS®.WK4

ANALYSES OF TOTAL & FIRST-CHOICE REGISTRATIONS
1983 TO 2000 -- ALL ONTARIO
All Universities Lakehead Lakehead/ALL Universities
Year Total 1st Choice Total 1st Choice Total 1st Choice
1983 34,804 23,484 662 407 1.9% 1.7%1984 34,232 22,030 790 538 2.3% 2.4%1985 35,563 23,194 662 473 1.9% 2.0%1986 36,477 23,958 635 477 1.7% 2.0%1987 38,663 24,888 627 442 1.6% 1.8%1988 50,771 28,466 1,226 626 2.4% 2.2%1989 54,594 30,169 1,268 592 2.3% 2.0%1990 56,072 30,530 1,343 665 2.4% 2.2%1991 57,427 30,987 1,373 739 2.4% 2.4%1992 57,785 27,979 1,797 875 3.1% 3.1%1993 55,879 27,058 1,366 924 2.4% 3.4%1994 58,312 27,123 2,040 901 3.5% 3.3%1995 55,159 28,528 1,686 804 3.1% 2.8%1996 54,934 28,492 1,665 824 3.0% 2.9%1997 54,617 28,796 1,446 791 2.6% 2.7%1998 54,292 29,444 1,437 714 2.6% 2.4%1999 59,547 28,495 1,640 665 2.8% 2.3%2000 50,657 28,242 1,083 629 2.1% 2.2%
Source: Ontario Universities Application Centre, Admission Data System Reports, Tables 1.0, 2.0, 2.1
Notes: Data pertain to applications to first-year programs processed through the Ontario Universities Application Centre only. When advanced standing and direct applications are included, Lakehead received and processed larger numbers each year.
Institutional AnalysisNovember 2001
APPS®.WK4

ANALYSES OF TOTAL & FIRST-CHOICE APPLICATIONSFOR STUDENTS FROM NWO ATTENDING ONTARIO UNIVERSITIES1983 TO 2000
All Universities Lakehead Lakehead/ALL Universities
Year Total* 1st Choice Total* 1st Choice Total 1st Choice
1983 2,523 1,092 874 540 34.6% 49.5% 1984 2,810 1,202 980 576 34.9% 47.9% 1985 2,920 1,247 1,009 582 34.6% 46.7% 1986 2,731 1,178 975 598 35.7% 50.8% 1987 2,895 1,174 968 556 33.4% 47.4% 1988 3,413 1,397 1,239 700 36.3% 50.1%1989 3,289 1,341 1,178 683 35.8% 50.9%1990 3,305 1,338 1,359 762 41.1% 57.0%1991 3,013 1,251 1,260 723 41.8% 57.8%1992 3,329 1,374 1,509 845 45.3% 61.5%1993 3,412 1,374 1,618 894 47.4% 65.1%1994 3,560 1,414 1,615 829 45.4% 58.6%1995 3,206 1,253 1,403 709 43.8% 56.6%1996 3,184 1,226 1,441 724 45.3% 59.1%1997 3,031 1,211 1,286 673 42.4% 55.6%1998 3,065 1,166 1,244 649 40.6% 55.7%1999 3,415 1,183 1,293 610 37.9% 51.6%2000 3,408 1,158 1,313 628 38.5% 47.8%
Source: Ontario Universities Application Centre, Admission Data System Reports, tables 5.0, 5.1, 5.3, and 5.4
Notes: Data prior to 1976 do not include numbers for Lakehead University's diploma programs. Data pertain to applications to first-year programs processed through the Ontario Universities Application Centre only. When Advanced Standing and direct applications are included, Lakehead received and processed larger numbers each year.
Institutional AnalysisNovember 2001
APPS®.WK4

ANALYSES OF TOTAL & FIRST CHOICE REGISTRATIONSFOR STUDENTS FROM NWO ATTENDING ONTARIO UNIVERSITIES1983 TO 2000
All Universities Lakehead Lakehead/ALL Universities
Year Total 1st Choice Total 1st Choice Total 1st Choice
1983 590 407 356 251 60.3% 61.7%1984 695 517 432 330 62.2% 63.8%1985 649 471 387 305 59.6% 64.8%1986 694 533 428 357 61.7% 67.0%1987 664 481 405 320 61.0% 66.5%1988 800 603 517 408 64.6% 67.7%1989 742 563 471 384 63.5% 68.2%1990 753 583 529 429 70.3% 73.6%1991 717 557 494 415 68.9% 74.5%1992 816 637 596 499 73.0% 78.3%1993 823 656 625 539 75.9% 82.2%1994 816 606 577 469 70.7% 77.4%1995 725 540 483 400 66.6% 74.1%1996 721 550 509 427 70.6% 77.6%1997 735 542 501 413 68.2% 76.2%1998 739 550 484 408 65.5% 74.2%1999 813 550 479 363 58.9% 66.0%2000 783 531 497 372 63.5% 70.1%
Source: Ontario Universities Application Centre, Admission Data System Reports
Notes: Data pertain to applications to first-year programs processed through the Ontario Universities Application Centre only. When advanced standing and direct applications are included, Lakehead received and processed larger numbers each year.
Institutional AnalysisNovember 2001
APPS®.WK4

Undergraduate Class Sizes
Note: 1. The data are taken from the class size reports run from the student history database. It includes all zero to 4th year level
undergraduate classes and 5th year level undergraduate classes (Engineering, Geology and Mathematics).
2. The data do not include the following: Music Performance, Co-operative Education, Continuing and Distance Education,
Exchange, Thesis, Reading, Field school, Practicum, Project or Labs.
0.0%
20.0%
40.0%
60.0%
80.0%
100.0%
120.0%
1 - 25
26 - 50
51 - 100
101 - 150
151 +
93/94 94/95 95/96 96/97 97/98 98/99 99/00 00/01 01/02
44.7% 46.1% 47.5% 47.5% 50.3% 49.2% 50.1% 49.8% 47.0%
34.8% 35.3% 32.7% 33.4% 30.0% 32.1% 32.3% 32.8% 35.8%
13.6% 13.0% 14.1% 13.6% 13.3% 13.7% 13.0% 12.7% 12.8%
4.1% 3.4% 3.3% 3.5% 3.7% 3.1% 3.3% 3.6% 3.1%
2.8% 2.2% 2.4% 1.9% 2.6% 1.8% 1.3% 1.0% 1.3%
Fall and Winter Term

SECTION 3 - FACULTY DATA
Full-time Faculty Appointments by Department
Full-time Faculty Appointments - Distribution by Rank
Full-time Faculty Appointments - Distribution by Type of Appointment
Full-time Faculty Appointments - Distribution by Gender & Rank
Full-time Faculty Appointments - Distribution by Gender & Type of Appointment
Full-time Faculty Appointments - Distribution by Age
FTE Course Enrolments & FTE Course Enrolments per FTE Faculty
Student/Faculty Ratios

08/23/2002
FULL-TIME FACULTY APPOINTMENTS BY DEPARTMENTFACULTY DEPARTMENT 1999/00 2000/01 2001/02
Arts Anthropology 5 6 6Economics 7 * 7 * 7English 11 11 10Geography 4 6 6History 7 * 6 6Indigenous Learning 3 3 3Languages 4 4 4Library & Info Studies 1 1 1Music 2 2 2Philosophy 4 4 4Political Science 4 4 4Psychology 14 * 11 13Social Work 10 9 9Sociology 9 9 9Visual Arts 4 4 4Women's Studies 1 1 1Total Arts 90 88 89
ScienceBiology 12 11 11Computer Science - 6 5Chemistry 7 6 7Geology 6 6 6Mathematics 14 9 * 9 *Physics 5 4 5Total Science 44 42 43
Professional SchoolsKinesiology 11 11 9Nursing 11 10 11Outdoor Rec 9 9 11Total Professional Schools 31 30 31
Total Arts & Science & Prof Schools 165 160 163
FacultiesBusiness 16 17 * 15Education 23 * 24 24Engineering 22 24 26Forestry 14 14 14Total 75 79 79
TOTAL FACULTY 240 239 242
Note: Full-time Faculty includes academic appointments as at Statistics Canada reporting date of Oct. 1.Includes leaves of absence without pay and/or LTD as indicated with an *.Does not include deans or associate deans.For 2001/02, the 3 Deans as per the new fac structure are excluded.
Institutional Analysis FACAPPT.WK4

FULL-TIME FACULTY APPOINTMENTS
DISTRIBUTION BY RANK
RANK 1994/95 1995/96 1996/97 1997/98 1998/99 1999/00 2000/01 2001/02
Professor 86 80 72 76 81 81 76 80
Associate Professor 106 110 107 102 101 94 87 85
Assistant Professor 73 72 59 58 56 60 64 72
Lecturer 2 2 1 1 2 5 9 5
TOTAL 267 264 239 237 240 240 236 242
DISTRIBUTION BY TYPE OF APPOINTMENT
TYPE OF APPOINTMENT 1994/95 1995/96 1996/97 1997/98 1998/99 1999/00 2000/01 2001/02
Tenured 209 210 196 194 195 188 175 174
Probationary 43 40 34 34 35 38 45 54
Term 15 14 9 9 10 14 16 14
TOTAL 267 264 239 237 240 240 236 242
Source: Human Resources Faculty Data Base
FAC-RANK.WK4

08/08/2002
FULL-TIME FACULTY APPOINTMENTSDISTRIBUTION BY GENDER & RANK
1994/95 1995/96 1996/97 1997/98 1998/99 1999/00 2000/01 2001/02RANK Male Female Male Female Male Female Male Female Male Female Male Female Male Female Male Female
Professor 80 6 74 6 67 5 70 6 76 5 75 6 69 7 69 11
Associate 87 19 88 22 84 23 79 23 72 29 67 27 62 25 57 28
Assistant 43 30 46 26 33 26 34 24 35 21 39 21 42 22 53 19
Lecturer 1 1 0 2 0 1 1 0 2 0 3 2 4 5 2 3
Sub-Total 211 56 208 56 184 55 184 53 185 55 184 56 177 59 181 61
TOTAL 267 264 239 237 240 240 236 242
DISTRIBUTION BY GENDER & TYPE OF APPOINTMENT
1994/95 1995/96 1996/97 1997/98 1998/99 1999/00 2000/01 2000/01TYPE OF APPOINTMENT Male Female Male Female Male Female Male Female Male Female Male Female Male Female Male Female
Tenured 177 32 175 35 160 36 156 38 153 42 148 40 136 39 132 42
Probationary 26 17 24 16 20 14 22 12 23 12 25 13 31 14 40 14
Term 8 7 9 5 4 5 6 3 9 1 11 3 10 6 9 5
Sub-Total 211 56 208 56 184 55 184 53 185 55 184 56 177 59 181 61
TOTAL 267 264 239 237 240 240 236 242
Source: Human Resources Faculty Database
FAC-APPT.WK4

02/15/2002
0
10
20
30
40
50
Age Groups
Pe
rce
nta
ge
Dis
trib
utio
n
<30 30-39 40-49 50-59 60+
1987/88 1988/89 1989/90 1990/91 1991/92 1992/93 1993/94
1994/95 1995/96 1996/97 1997/98 1998/99 1999/00 2000/01
Full-Time Faculty Distribution by Age
Source: Statistics Canada Tables
Institutional Analysis, November 2001
AGE-DIST.WK4

01/04/2002
NUMBER OF FULL-TIME EQUIVALENT COURSE ENROLMENTSand
FULL COURSE ENROLMENTS PER F.T.E. FACULTYFaculty of Arts and Science (Fall/Winter Terms)
1995/96 1996/97 1997/98 1998/99 1999/00 2000/01
# FCE FCE # FCE FCE # FCE FCE # FCE FCE # FCE FCE # FCE FCEEnrol Enrol/ Enrol Enrol/ Enrol Enrol/ Enrol Enrol/ Enrol Enrol/ Enrol Enrol/
DEPARTMENT F.T.E. F.T.E. F.T.E. F.T.E. F.T.E. F.T.E.Faculty Faculty Faculty Faculty Faculty Faculty
Anthropology 1168.00 209.95 1006.50 193.03 969.50 186.05 660.50 126.86 688.00 115.81 500.00 77.26Biology 1545.50 108.94 1456.00 124.59 1446.50 117.31 1472.50 115.55 1223.00 97.15 1254.00 97.77Chemistry 698.30 76.95 723.50 85.88 664.50 78.19 593.00 77.13 574.00 75.78 551.00 85.22Economics 446.30 60.76 435.50 61.07 469.00 61.25 452.50 57.37 574.00 65.75 508.00 73.29English 2273.50 127.30 2226.00 124.01 2132.00 117.67 2071.00 134.79 1756.50 121.99 1914.50 137.06Geography 1204.40 183.81 1051.00 158.93 1086.00 170.25 922.50 145.20 997.00 186.35 1010.50 162.11Geology 389.00 59.31 348.00 56.70 453.00 70.76 411.50 62.76 323.50 49.69 357.00 60.13History 1289.00 167.04 1095.00 141.29 986.00 134.46 969.50 125.65 1097.50 154.17 1126.50 159.37Indigenous Learning 322.50 87.48 313.00 104.33 367.50 112.16 304.00 96.98 222.00 70.85 281.50 91.82Languages 487.50 75.85 495.50 100.03 387.00 75.03 351.50 70.15 464.50 92.23 443.50 89.24Lib & Info Studies 124.50 76.21 114.50 64.26 141.50 89.77 83.00 54.86 55.00 33.70 41.00 33.67Math Sciences 1752.50 108.66 1883.50 117.64 2054.50 126.76 1806.50 125.44 1915.00 112.12- Computer Science 533.50 80.09- Math 1245.50 137.98Med. Lab. Sc. 94.50 111.86 42.00 57.47 0.00 0.00 0.00 0.00 0.00 0.00 0.00 0.00Music 383.50 65.15 410.00 90.62 365.50 79.77 283.50 67.83 284.50 64.03 289.00 70.39Philosophy 859.00 184.76 897.50 153.73 677.00 135.77 651.00 122.24 607.00 132.87 670.50 147.52Physics 348.50 53.25 390.50 60.78 356.50 61.75 261.50 46.40 490.00 82.40 447.00 87.45Pol. Science 489.00 104.82 530.50 110.70 504.50 107.32 427.50 94.41 505.00 107.41 416.00 93.35Psychology 2698.00 140.02 2842.50 150.96 2592.50 134.41 2143.00 112.01 2088.00 108.15 2108.50 132.45Social Work 983.00 103.06 911.00 95.31 905.50 71.98 1034.00 92.15 826.50 72.64 894.50 76.12Sociology 1611.00 134.72 1521.50 125.05 1403.50 120.74 1117.00 96.22 1132.50 107.32 974.50 97.95Visual Arts 417.00 73.29 416.50 70.97 376.00 67.99 415.00 81.64 424.00 76.47 361.00 68.53Women's Studies - - - - - - - - - - 172.50 124.11
TOTAL COREARTS & SCIENCE 19,584.50 114.01 19,110.00 115.55 18,338.00 109.24 16,430.50 102.51 16,247.50 99.31 16,070.00 104.80
Institutional Analysis FTE-ENRL.WK4

01/04/2002
NUMBER OF FULL-TIME EQUIVALENT COURSE ENROLMENTSand
F.T.E. COURSE ENROLMENTS PER F.T.E. FACULTY ESTABLISHMENTProfessional Schools/Faculties (Fall/Winter Terms)
1995/96 1996/97 1997/98 1998/99 1999/00 2000/01
# FCE FCE # FCE FCE # FCE FCE # FCE FCE # FCE FCE # FCE FCEEnrol Enrol/ Enrol Enrol/ Enrol Enrol/ Enrol Enrol/ Enrol Enrol/ Enrol Enrol/
DEPARTMENT F.T.E. F.T.E. F.T.E. F.T.E. F.T.E. F.T.E.Faculty Faculty Faculty Faculty Faculty Faculty
PROF. SCHOOLS
Kinesiology 1,294.00 86.28 1,409.00 112.53 1,411.50 119.91 1,389.00 114.21 1,409.00 104.71 1,183.00 93.99Nursing 818.50 51.11 792.50 59.03 738.50 48.40 781.00 58.93 565.50 42.98 622.00 51.02Outdoor Rec 1,016.50 119.83 1,090.00 143.06 1,317.50 133.31 1,397.50 146.19 1,178.50 122.50 1,115.00 119.13
PROF. FACULTIESBusiness 1,859.50 92.46 1,875.00 116.34 1,909.50 108.46 1,909.00 108.79 1,887.50 99.77 1,798.50 99.72Education 3,964.00 104.92 3,483.50 114.19 3,915.00 109.26 3,956.50 134.73 4,359.00 114.67 4,515.00 132.15Engineering 2,085.00 67.77 1,970.00 70.81 1,861.00 63.28 1,825.50 67.89 2,056.50 77.58 2,007.00 75.02Forestry 1,375.50 61.41 1,450.50 81.03 1,630.50 84.58 1,783.50 97.11 1,474.50 84.90 1,191.50 70.89
TOTALPROFESSIONAL 12,413.00 86.18 12,070.50 95.87 12,783.50 91.94 13,042.00 98.78 12,930.50 94.35 12,432.00 95.71
TOTALUNIVERSITY 31,997.50 101.32 31,180.50 107.04 31,121.50 101.40 29,472.50 100.82 29,178.00 97.30 28,532.00 100.74
FCE = Full Course EquivalentFTE = Full Time EquivalentNote: FCE Enrolment is calculated with a graduate enrolment weighting of 3.
Institutional Analysis FTE-ENRL.WK4

08/23/2002
STUDENT/FACULTY RATIOS
TOTAL AVERAGE F. T. E. INSTRUCTIONAL FACULTY F. T. E. STUDENT/ ONTARIOCOSTS ('000'S) SALARY FACULTY FACULTY RATIO UNIVERSITIES
YEAR (LAKEHEAD) (LAKEHEAD) (LAKEHEAD) (LAKEHEAD) RATIO
1987/88 $14,410 $52,628 273.8 15.4 16.81988/89 $16,648 $55,305 301.0 15.3 17.21989/90 $18,511 $60,657 305.2 15.4 17.41990/91 $20,110 $65,256 308.2 16.9 18.01991/92 $21,862 $70,826 308.7 18.3 19.11992/93 $23,474 $76,050 314.8 18.2 19.61993/94 $23,957 $74,279 322.5 20.6 19.71994/95 $23,400 $72,950 320.8 21.2 20.11995/96 $23,148 $70,020 330.6 19.6 20.11996/97 $21,564 $69,788 309.5 20.4 21.21997/98 $21,525 $71,866 299.5 21.2 21.51998/99 $21,323 $73,758 289.1 21.0 21.41999/00 $22,021 $76,514 287.8 20.2 22.12000/01 $22,999 $75,197 305.9 18.5 N/A
Sources: Instructional Costs per COFO-UO Annual Report. Average Salary per Statistics Canada Reports on salaries for full-time teaching staff.
FTE faculty = total academic salaries (per COFO-UO)/average salary (per Statistics Canada). Ontario Universities Ratio per Council of Ontario Universities, Facts & Figures.
Note:Commencing 1998/99, total instructional costs no longer include laboratory technicians per CICA Handbook changes.
Institutional AnalysisNovember 2001
Institutional Analysis RATIOS.WK4

SECTION 4 - FINANCIAL DATA
Revenue by Source and Type of Fund
Expenses by Object and Type of Fund
Operating Income and Expenditures
Revenue from Research Grants and Contracts
Internal Scholarships, Bursaries and Awards
Donations and Bequests

02/15/2002
LAKEHEAD UNIVERSITY REVENUE BY SOURCE AND TYPE OF FUNDFOR THE FISCAL YEAR ENDING APRIL 30th(IN THOUSANDS OF DOLLARS)
SOURCE 1992/93 1993/94 1994/95 1995/96 1996/97 1997/98 1998/99 1999/00 2000/01
1. GOVERNMENT GRANTS AND CONTRACTS (A) ONTARIO MET (I) FORMULA 27,786 25,563 24,853 24,278 21,999 21,878 21,873 22,325 22,657 (II) EXTRA FORMULA 7,169 6,785 6,627 6,559 3,760 4,046 4,046 8,647 8,492 (III) OTHER MET GRANTS 4,301 4,423 3,301 2,621 2,274 3,821 5,020 15,167 1,613
(B) OTHER ONTARIO GRANTS 2,734 2,762 3,774 2,492 1,467 1,028 1,324 1,459 2,145
TOTAL ONTARIO GRANTS $41,990 $39,533 $38,555 $35,950 $29,500 $30,773 $32,263 $47,598 $34,907
(C) FEDERAL 2,106 2,599 2,786 2,205 1,641 2,222 2,419 3,356 3,655
(D) MUNICIPAL 7 13 12 0 0 0 50 0 2
(E) OTHER 15 2 0 0 0 732 0 334 40
2. FEES (A) TUITION CREDIT 12,228 13,981 15,868 16,773 18,805 20,336 21,279 22,349 22,617 (B) TUITION NON-CREDIT 514 541 511 476 447 256 231 204 191 (C) MISCELLANEOUS 4,547 4,694 5,155 5,012 4,747 4,690 6,042 5,265 1,479
3. BORROWINGS 0 0 0 0 0 0 0 0 0
4. DONATIONS, NON-GOVT GRANTS & CONTRACTS 2,574 2,769 2,912 3,015 3,646 1,236 1,136 1,475 2,433
5. SALES OF SERVICE AND PRODUCTS 5,456 5,828 6,062 6,136 6,752 7,503 6,118 10,682 13,440
6. INVESTMENT INCOME 1,290 975 1,083 1,311 1,090 1,325 583 1,552 930
7. MISCELLANEOUS 520 369 739 320 671 524 893 849 1,034
TOTAL $71,247 $71,304 $73,400 $71,198 $67,299 $69,597 $71,014 $93,664 $80,728
* Includes a deficit of ($4253) in Capital Funds due to recent building projects.
Source: Table 2, Council of Ontario Universities COFO-UO Reports
Institutional AnalysisNovember 2001
COUFOUREV.WK4

02/15/2002
LAKEHEAD UNIVERSITY EXPENSES BY OBJECT AND TYPE OF FUND FOR THE FISCAL YEAR ENDING APRIL 30th(IN THOUSANDS OF DOLLARS)
OBJECT OF EXPENSE 1991/92 1992/93 1993/94 1994/95 1995/96 1996/97 1997/98 1998/99 1999/00 2000/01
1. SALARIES AND WAGES (A) ACADEMIC RANKS 18,513 19,676 20,198 19,417 18,964 18,279 18,273 17,595 20,976 20,302 (B) OTHER INSTRUCTION AND RESEARCH 6,538 7,334 7,066 6,376 6,370 5,484 5,743 5,409 2,967 4,366 (C) OTHER SALARIES AND WAGES 14,464 15,214 15,098 15,682 15,234 14,243 14,843 16,859 19,209 16,527
TOTAL SALARIES AND WAGES $39,515 $42,224 $42,362 $41,475 $40,468 $38,006 $38,859 $39,863 $43,152 $41,195
2. EMPLOYEE BENEFITS 5,427 5,776 5,875 6,017 5,996 5,510 5,983 6,030 6,506 6,886
TOTAL SALARIES AND BENEFITS $44,942 $48,000 $48,237 $47,492 $46,564 $43,516 $44,842 $45,893 $49,658 $48,081
3. LIBRARY ACQUISITIONS 1,208 1,220 1,312 1,402 1,442 1,297 1,334 1,391 1,448 1,608
4. EQUIPMENT & FURNITURE PURCHASE, RENTAL AND MAINTENANCE 1,701 2,369 2,873 2,259 2,002 3,074 4,849 6,026 8,282 5,107
5. OPERATIONAL SUPPLIES AND EXPENSES 3,414 3,779 3,913 4,103 4,410 4,209 3,458 3,191 5,796 6,549
6. COST OF GOODS SOLD 3,045 3,743 3,905 4,070 3,635 3,689 4,120 4,681 5,182 5,927
7. UTILITIES 1,871 1,899 2,168 2,272 2,275 2,192 2,276 2,245 2,365 2,488
8. MUNICIPAL TAXES 322 356 401 440 456 433 419 411 398 0
9. RENOVATIONS LAND ALTERATIONS 796 1,514 1,905 884 229 134 45 191 40 1,936
10. EXTERNALLY CONTRACTED SERVICES 1,438 1,495 1,632 1,880 2,125 1,751 1,705 1,474 1,728 177
11. SCHOLARSHIPS, BURSARIES, ETC. 611 535 947 1,028 1,276 1,465 1,953 2,433 3,174 3,784
12. PRINCIPAL AND INTEREST REPAYMENTS 886 1,432 1,808 1,769 1,794 1,739 1,526 1,566 1,556 1,507
13. LAND AND SITE SERVICES 387 4 257 316 21 0 0 0 0 0
14. BUILDINGS 5,393 - - 3,421 0 0 0 0 0 0
15. MISCELLANEOUS 3,328 3,279 3,525 4,041 4,084 3,424 3,220 3,664 1,728 2,834
16. INTERNAL COST ALLOCATIONS 0 0 0 0 0 17 0 0 0 0
17. EXTERNAL COST RECOVERIES (846) (899) (1,183)
TOTAL $69,342 $69,625 $72,883 $75,377 $70,313 $66,940 $69,747 $72,320 $80,456 $78,815
Source: Table 3, Council of Ontario Universities COFO-UO Reports
Note: Based on changes in the CICA Handbook which COFO-UO is adhering to, external cost recoveries are not netted between the other expense categories
Institutional AnalysisNovember 2001
COFOUEXP.WK4

02/15/2002
OPERATING INCOME AND EXPENDITURES1991/92 to 2000/01(In Thousands of Dollars)
INCOME 1991/92 1992/93 1993/94 1994/95 1995/96 1996/97 1997/98 1998/99 1999/00 2000/01
Government Grants $36,173 $38,250 $35,733 $33,993 $32,768 $28,179 $27,912 $29,032 $30,520 $30,715Tuition Fees $10,652 $12,742 $14,522 $16,379 $17,249 $19,256 $21,506 $21,510 $24,021 $24,287Other $1,190 $2,032 $1,649 $2,014 $1,971 $1,653 $1,112 $2,538 $1,597 $1,933
TOTAL $48,015 $53,024 $51,904 $52,386 $51,988 $49,088 $50,530 $53,080 $56,138 $56,935
EXPENDITURES
Salaries $35,374 $37,258 $37,482 $37,546 $40,942 $34,278 $34,782 $36,103 $39,020 $37,659Benefits $5,278 $5,488 $5,688 $5,831 $5,853 $5,397 $5,619 $5,690 $6,506 $6,399Utilities $1,577 $1,690 $1,748 $1,837 $1,820 $1,767 $1,753 $1,763 $1,991 $2,056Other $6,379 $7,384 $7,475 $7,422 $6,890 $7,637 $7,805 $9,155 $10,489 $12,011
TOTAL $48,608 $51,820 $52,393 $52,636 $55,505 $49,079 $49,959 $52,711 $58,006 $58,125
Source: Lakehead University Financial Statements
Institutional AnalysisNovember 2001
OPER$&EX.WK4

02/15/2002
REVENUE FROM RESEARCH GRANTS AND CONTRACTS - 1991/92 TO 2000/01RESEARCH GRANTS AND CONTRACTS - 1991/92 TO 2000/01 - 1991/92 TO 2000/01(In Thousands of Dollars)
1991/92 1992/93 1993/94 1994/95 1995/96 1996/97 1997/98 1998/99 1999/00 2000/01
NSERC -- Individual $826 $900 $846 $660 $715 $688 $732 $765 $859 $799 -- Equipment 156 101 29 51 14 48 72 41 47 42 -- Other 88 107 88 80 72 50 50 55 87 233
TOTAL $1,070 $1,108 $963 $791 $801 $786 $854 $861 $992 $1,074
SSHRC -- Individual $170 $96 $50 $107 $61 $0 $85 $100 $114 85 -- Other 105 54 18 88 41 17 17 16 16 29
TOTAL $275 $150 $68 $195 $102 $17 $102 $116 $131 $114
CIHR - - - - - - - - - 90
TOTAL $0 $0 $0 $0 $0 $0 $0 $0 $0 $90
Employment Immigration $304 $97 $48 $29 $15 $3 $0 $0 $0 $0CDN Forestry Service 2 164 467 529 221 12 0 0 0 0Environment Canada 0 97 51 63 145 99 0 7 0 0Atomic Energy 0 0 0 0 0 0 0 0 0 0CIDA NA 220 341 418 324 390 354 566 643 704NRC NA NA NA NA NA NA 136 111 118 118Human Resources Canada NA NA NA NA NA NA 87 162 13 0Ministry of Natural Resources NA NA NA NA NA NA 38 0 10 0Ministry of Northern Dev & Mines NA NA NA NA NA NA 37 21 0 0Health Canada NA NA NA NA NA NA NA NA 98 333Canada Research Chairs NA NA NA NA NA NA NA NA NA 10Other 355 124 167 165 356 142 92 134 107 65
TOTAL $661 $702 $1,074 $1,204 $1,061 $646 $744 $1,001 $988 $1,230
TOTAL FEDERAL $2,006 $1,960 $2,105 $2,190 $1,964 $1,449 $1,700 $1,978 $2,111 $2,508
Ontario $2,673 $2,415 $2,671 $1,864 $2,069 $1,232 $1,197 $1,320 $1,355 $1,563Other Gov't/Municipal 64 7 14 12 13 0 2 68 32 39Non-Government & Misc.* 856 1,014 1,418 1,394 1,721 1,531 908 699 549 516
TOTAL TO UNIVERSITY $5,599 $5,396 $6,208 $5,461 $5,767 $4,212 $3,807 $4,065 $4,047 $4,626
* Includes Centres of Excellence
Source: Finance Office (Financial Statements)
REVENUE.WK4

11/07/2002
LAKEHEAD UNIVERSITY INTERNAL SCHOLARSHIPS, BURSARIES AND AWARDS
UNDERGRADUATE & GRADUATE 1990/91 1991/92 1992/93 1993/94 1994/95 1995/96 1996/97 1997/98 1998/99 1999/00 2000/01
Admission Scholarship $207,415 $230,229 $313,344 $339,681 $275,817 $251,337 $396,898 $333,468 $293,992 $325,509 $444,602
In-Course Scholarship $183,161 $223,059 $284,065 $309,811 $383,099 $519,338 $412,991 $403,670 $375,754 $384,695 $412,795
Graduate Awards $79,359 $79,500 $79,132 $123,100 $187,879 $218,550 $274,819 $316,039 $322,580 $354,406 $464,564
Bursaries $51,165 $54,170 $61,220 $294,516 $351,879 $287,411 $380,787 $900,043 $1,441,009 $2,109,172 $2,462,979
TOTAL $521,100 $586,958 $737,761 $1,067,108 $1,198,674 $1,276,636 $1,465,495 $1,953,220 $2,433,335 $3,173,782 $3,784,940
INCREASE 22.3% 12.6% 25.7% 44.6% 12.3% 6.5% 14.8% 33.3% 24.6% 30.4% 19.3%
1) Graduate awards include: all endowed awards, Faculty Research Scholarships, Lakehead portion of OGSST and OGS.2) Figures do not include Canada Scholarships, CIDA, OGS, and other externally awarded scholarships.3) In addition to the OGS Open Scholarships, ten institutional scholarships are available for Lakehead students.4) Increase in 1993/94 bursaries due to additional Disability Grants, Ontario Special Bursaries and Child Care Bursaries andgraduate awards due to Saunders endowment.5) Increase in 1997/98 (and subsequent years) bursaries due in part to OSOTF but mainly to an increase in the reinvestment tuition fund.
Institutional AnalysisNovember 2001
BURSARIE.WK4

02/15/2002
DONATIONS AND BEQUESTS
OPERATING CAPITAL TRUST & ENDOWMENTYEAR FUNDS FUNDS FUNDS TOTAL
1990/91 $938,000 $405,000 $1,343,000
1991/92 $953,000 $477,000 $1,430,000
1992/93 $729,000 $566,000 $1,295,000
1993/94 $581,000 $523,000Other Special Contributions $468,000 $1,572,000
1994/95 $735,000 $1,126,000 $1,861,000
1995/96 $588,000 $756,000 $1,344,000
1996/97 $387,000 $1,770,000 $2,157,000
1997/98 $30,000 $1,279,000 $1,309,000
1998/99 $420,000 $79,000 $1,261,000 $1,340,000
1999/00 $545,000 $296,000 $473,000 $1,314,000
2000/01 $1,013,000 $442,000 $464,000 $1,919,000
CUMULATIVE FUND TOTAL $1,978,000 $9,160,000 $11,631,000 $22,349,000
Note: Cumulative total includes funds received commencing 1972/73.
DONATION.WK4

SECTION 5 - SPACE
University Land
Distribution of Physical Space
Residence Accommodation
Campus Map

02/08/2002
UNIVERSITY LAND (in Hectares)
UNIVERSITY LAND AMOUNT
Main Campus 116.0
Forest Areas
Forbes Township 21.8
Trout Lake 1,060.0
Silver Mountain 282.0
Raith 6,452.0
Rural Resource Centre 3.6
Big Thunder 10.0
TOTAL 7,945.4
LAND.WK4

02/08/2002
DISTRIBUTION OF PHYSICAL SPACEas of November 1, 2001
SQUAREUSAGE METERS *
Classrooms 6,188Laboratories Undergraduate 11,846 Graduate and Faculty 4,452Offices Academic 6,604 Administrative 3,830Facilities Bookstore / Merchandising 723.3 Audio Visual / Television 270.7 Health Services 179.9 Assembly / Exhibition 1,167Central Services 1,378Library 6,329Recreation/Athletic 4,601Study Activity and Common Use 2,934Food Services 2,999Plant Maintenance 1,172Residential 28,292Non-Assignable 33,113Other 3,663
TOTAL 119,741
* Net Assignable Square Meters. Measurements are approximate.
Source: Physical Plant
SPACE.WK4

02/08/2002
RESIDENCE ACCOMMODATION
TOTAL ACCOMMODATION
1992/93 1993/94 1994/95 1995/96 1996/97 1997/98 1998/99 1999/00 2000/01 2001/02
Dormitories 670 737 709 709 709 711 711 672 650 615
Townhouses 428 430 430 430 430 430 430 430 430 430
Total 1098 1167 1139 1139 1139 1141 1141 1102 1080 1045
FEES
1992/93 1993/94 1994/95 1995/96 1996/97 1997/98 1998/99 1999/00 2000/01 2001/02
Single $2,248 $2,287 $2,353 $2,438 $2,484 $2,549 $2,796 $2,852 $2,909 $3,218
Super Single - - - - - - - $3,284 $3,350 $3,670
Double $2,028 $2,058 $2,118 $2,195 $2,237 $2,295 $2,531 $2,531 $2,582 $2,882
Townhouse (+ Utilities) $3,069 $3,125 $3,245 $3,347 $3,403 $3,481 $3,620 $3,684 $3,750 $3,978
Full Meal Plan $1,995 $2,055 $2,114 $2,211 $2,240 $2,284 $2,255 $2,408 $2,455 $2,523
Lakehead University has dormitory and townhouse style residences.Dormitories offer double, single and super single rooms.Townhouses have four single bedrooms each with the exception of twohouses which have three bedrooms each. Handicap accommodation is available inboth dormitories and residences. Meal plans are required in dormitories and areavailable to townhouse residents.
ACCOMOD.WK4

HIGHLIGHTS OF LAKEHEAD UNIVERSITY'S ECONOMIC IMPACT ON THE CITY OF THUNDER BAYas of December 2001 $168.6 Million The total economic impact of Lakehead University on the City of Thunder Bay (with multiplier of
2.14 x operating expenditures).
$78.8 Million Total operating expenditures of Lakehead in 2000/01 (including operations, capital, research andscholarships and bursaries).
1,600 Employees Lakehead University is a major employer in the City of Thunder Bay. This includes approximately650 full-time positions.
$47.4 Million Salaries and benefits paid by Lakehead University in 2001.
$4.0 Million Monthly payroll.
6,140 Students Total number of students enrolled at Lakehead University. This includes 4,862 full-time graduateand undergraduate students.
3,350 Students Approximately 70 % of full-time students attending Lakehead University are from outside the localcommuting area.
$55.0 Million New money brought into the City of Thunder Bay by students from outside the local commuting area.
$0.38 Million Paid by Lakehead University to the City of Thunder Bay in lieu of taxes in 2001.
$5.8 Million Research support received by Lakehead University in 2000/01.
$3.8 Million Paid to students this year in scholarships, bursaries and awards.