Embed Size (px)
Citation preview

INSTITUTIONAL INVESTORS, FINANCIAL
MARKET EFFICIENCY AND FINANCIAL STABILITY
E Philip DavisBrunel University
West [email protected]
www.geocities.com/e_philip_davisgroups.yahoo.com/group/financial_stability

Introduction
• Rapid growth of institutional investors –expansion faster than financial sector
• Underlying supply and demand factors• Scope for further growth, notably in Europe,
making study of financial implications timely• Analysis of financial efficiency and stability
drawn largely from global experience and theory• Financial efficiency – ability to fulfil functions of
financial system:

– Clearing, settlement, liquidity– Pooling of funds– Transfer economic resources– Manage uncertainty and control risk– Provide price information– Deal with incentive problems
• Financial stability aspects– Market dynamics, asset pricing and risk
management– Systemic consequences of herding– Life insurance issues– Prudential regulation
Size of institutions
• Growth in financial superstructure…• …also in financial intermediation…• …and institutional investors therein• Relative size of sectors in G-7 and EU
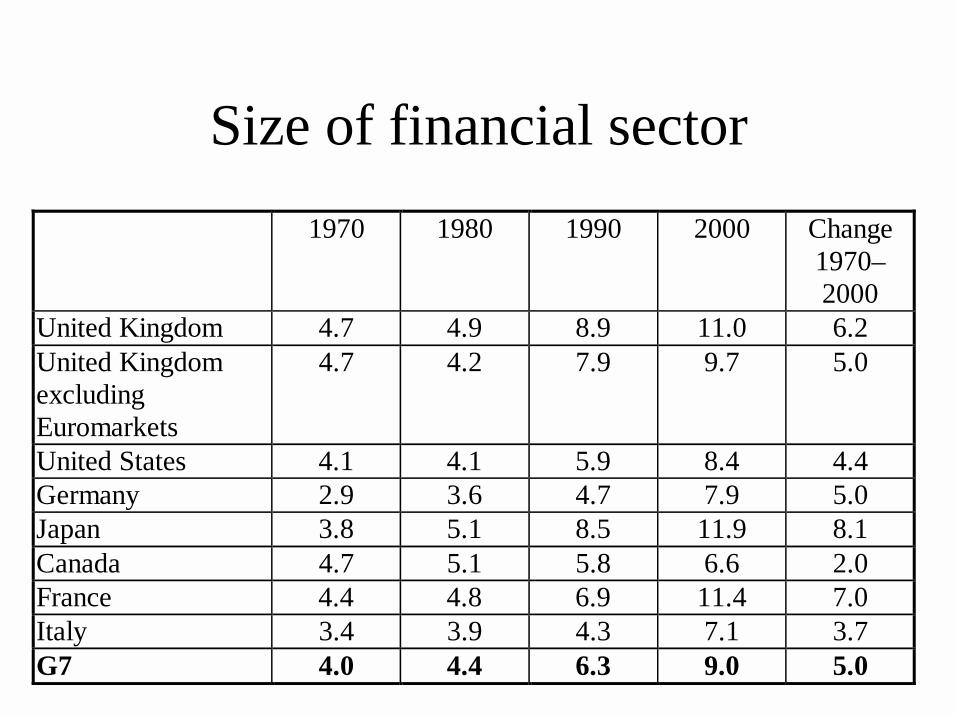
Size of financial sector 1970 1980 1990 2000 Change
1970–2000
United Kingdom 4.7 4.9 8.9 11.0 6.2 United Kingdom excluding Euromarkets
4.7 4.2 7.9 9.7 5.0
United States 4.1 4.1 5.9 8.4 4.4 Germany 2.9 3.6 4.7 7.9 5.0 Japan 3.8 5.1 8.5 11.9 8.1 Canada 4.7 5.1 5.8 6.6 2.0 France 4.4 4.8 6.9 11.4 7.0 Italy 3.4 3.9 4.3 7.1 3.7 G7 4.0 4.4 6.3 9.0 5.0
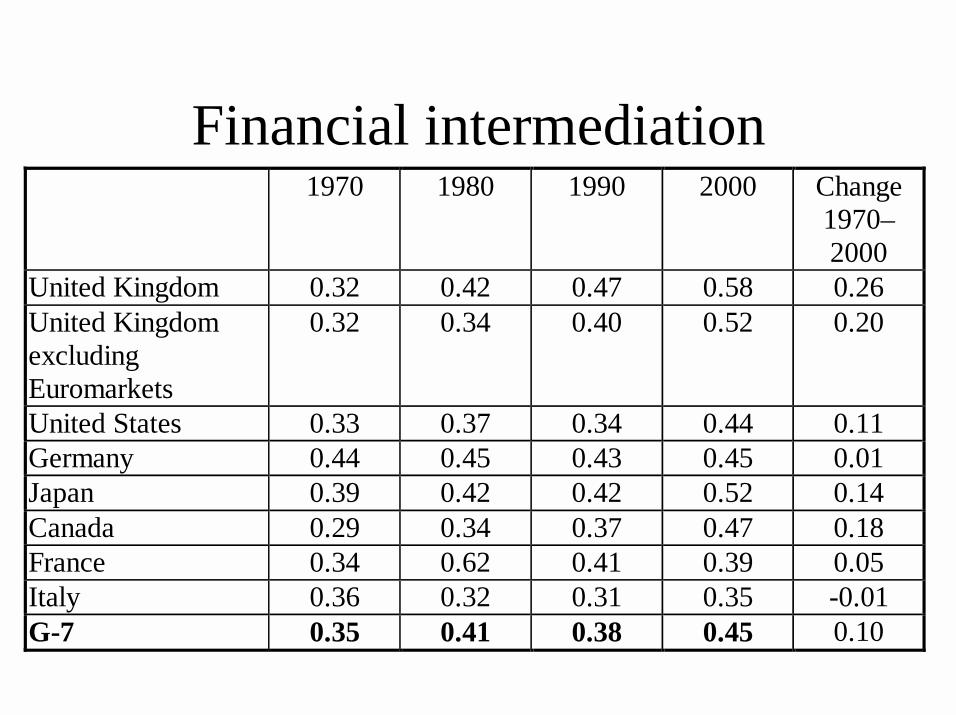
Financial intermediation 1970 1980 1990 2000 Change
1970–2000
United Kingdom 0.32 0.42 0.47 0.58 0.26 United Kingdom excluding Euromarkets
0.32 0.34 0.40 0.52 0.20
United States 0.33 0.37 0.34 0.44 0.11 Germany 0.44 0.45 0.43 0.45 0.01 Japan 0.39 0.42 0.42 0.52 0.14 Canada 0.29 0.34 0.37 0.47 0.18 France 0.34 0.62 0.41 0.39 0.05 Italy 0.36 0.32 0.31 0.35 -0.01 G-7 0.35 0.41 0.38 0.45 0.10
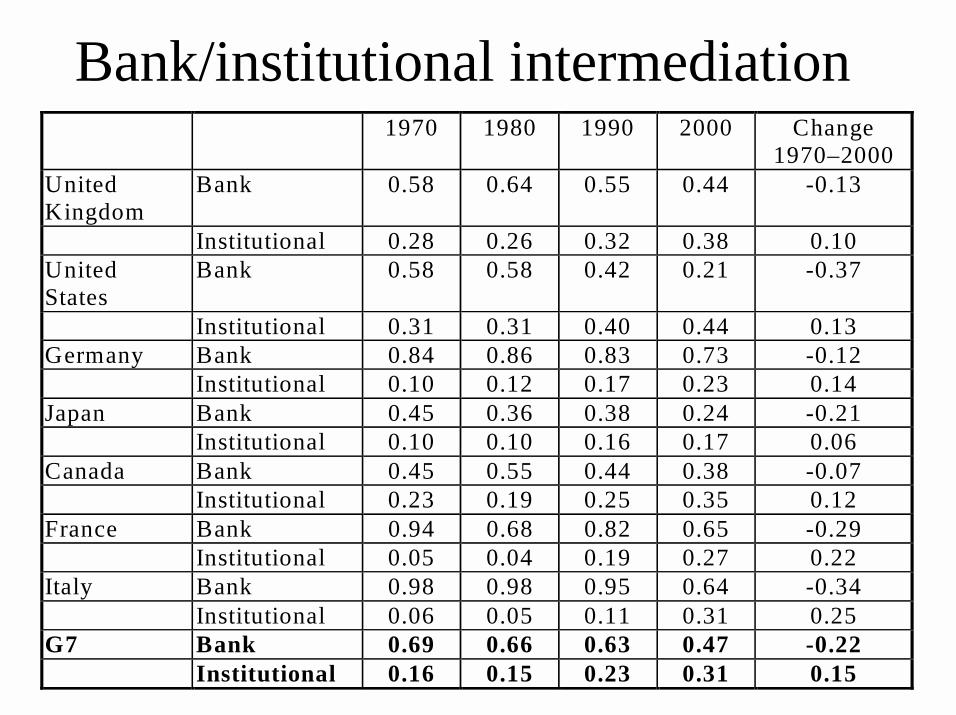
Bank/institutional intermediation 1970 1980 1990 2000 Change
1970–2000 United Kingdom
Bank 0.58 0.64 0.55 0.44 -0.13
Institutional 0.28 0.26 0.32 0.38 0.10 United States
Bank 0.58 0.58 0.42 0.21 -0.37
Institutional 0.31 0.31 0.40 0.44 0.13 Germany Bank 0.84 0.86 0.83 0.73 -0.12 Institutional 0.10 0.12 0.17 0.23 0.14 Japan Bank 0.45 0.36 0.38 0.24 -0.21 Institutional 0.10 0.10 0.16 0.17 0.06 Canada Bank 0.45 0.55 0.44 0.38 -0.07 Institutional 0.23 0.19 0.25 0.35 0.12 France Bank 0.94 0.68 0.82 0.65 -0.29 Institutional 0.05 0.04 0.19 0.27 0.22 Italy Bank 0.98 0.98 0.95 0.64 -0.34 Institutional 0.06 0.05 0.11 0.31 0.25 G7 Bank 0.69 0.66 0.63 0.47 -0.22 Institutional 0.16 0.15 0.23 0.31 0.15
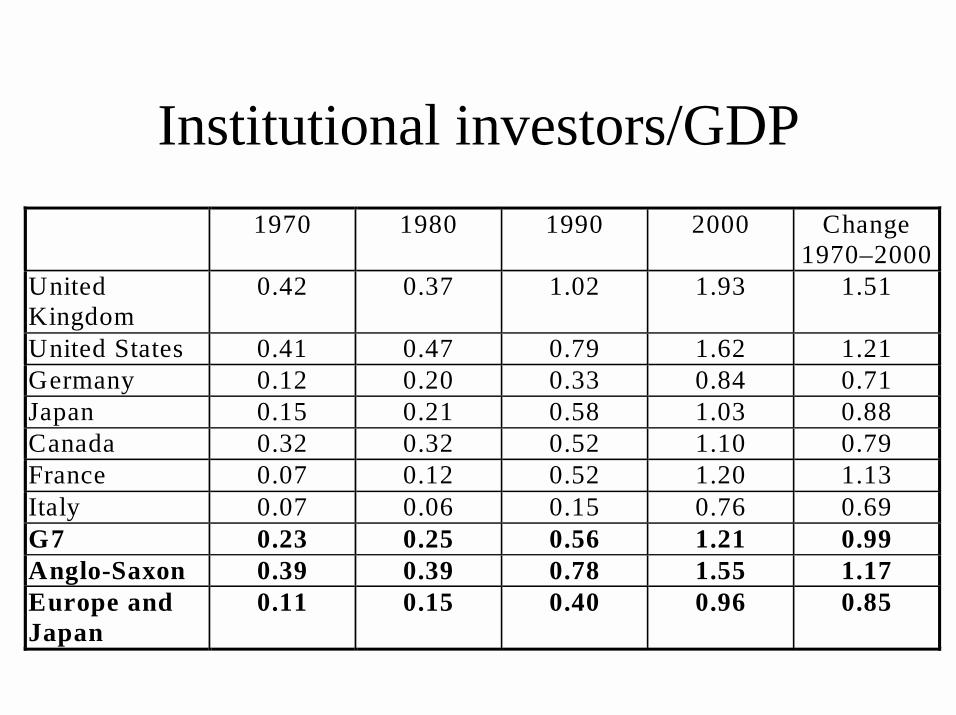
Institutional investors/GDP 1970 1980 1990 2000 Change
1970–2000 United Kingdom
0.42 0.37 1.02 1.93 1.51
United States 0.41 0.47 0.79 1.62 1.21 Germany 0.12 0.20 0.33 0.84 0.71 Japan 0.15 0.21 0.58 1.03 0.88 Canada 0.32 0.32 0.52 1.10 0.79 France 0.07 0.12 0.52 1.20 1.13 Italy 0.07 0.06 0.15 0.76 0.69 G7 0.23 0.25 0.56 1.21 0.99 Anglo-Saxon 0.39 0.39 0.78 1.55 1.17 Europe and Japan
0.11 0.15 0.40 0.96 0.85
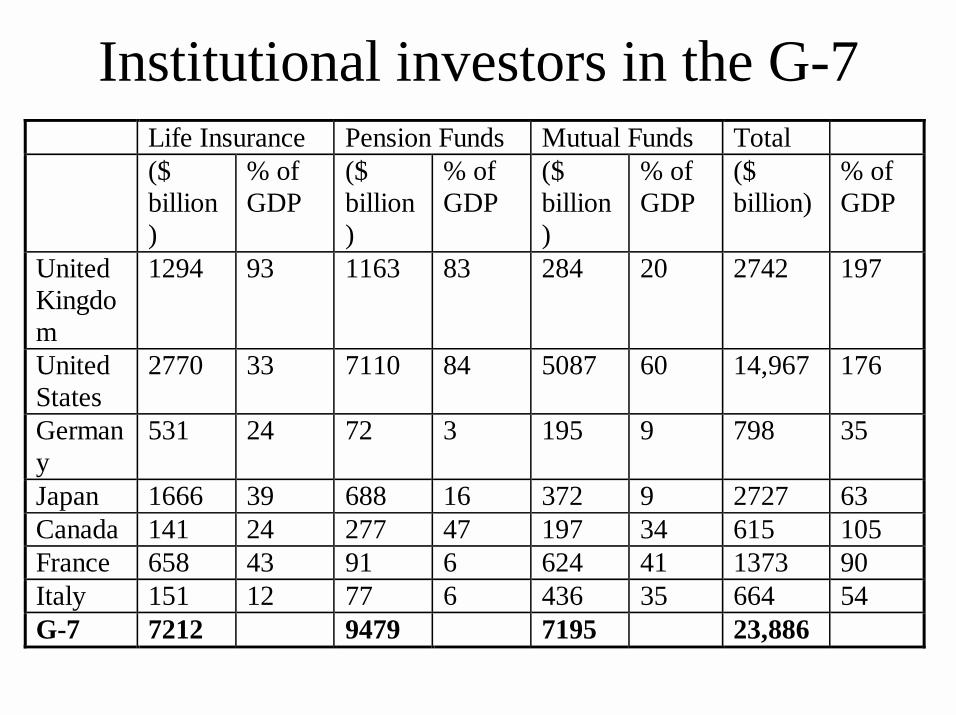
Institutional investors in the G-7 Life Insurance Pension Funds Mutual Funds Total ($
billion)
% of GDP
($ billion)
% of GDP
($ billion)
% of GDP
($ billion)
% of GDP
United Kingdom
1294 93 1163 83 284 20 2742 197
United States
2770 33 7110 84 5087 60 14,967 176
Germany
531 24 72 3 195 9 798 35
Japan 1666 39 688 16 372 9 2727 63 Canada 141 24 277 47 197 34 615 105 France 658 43 91 6 624 41 1373 90 Italy 151 12 77 6 436 35 664 54 G-7 7212 9479 7195 23,886
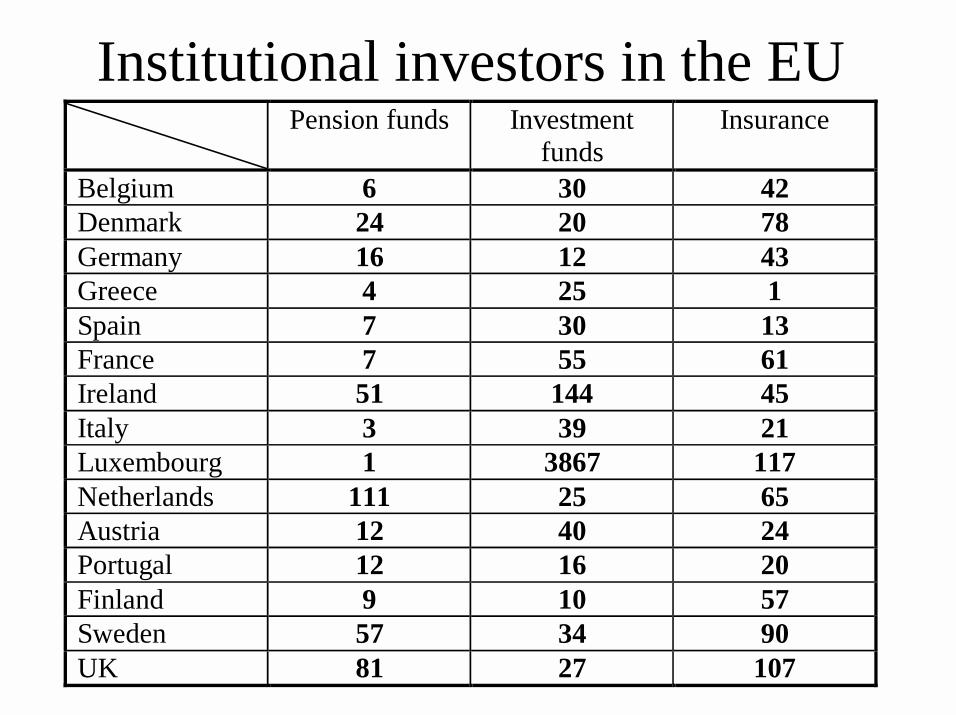
Institutional investors in the EU Pension funds Investment
funds Insurance
Belgium 6 30 42 Denmark 24 20 78 Germany 16 12 43 Greece 4 25 1 Spain 7 30 13 France 7 55 61 Ireland 51 144 45 Italy 3 39 21 Luxembourg 1 3867 117 Netherlands 111 25 65 Austria 12 40 24 Portugal 12 16 20 Finland 9 10 57 Sweden 57 34 90 UK 81 27 107
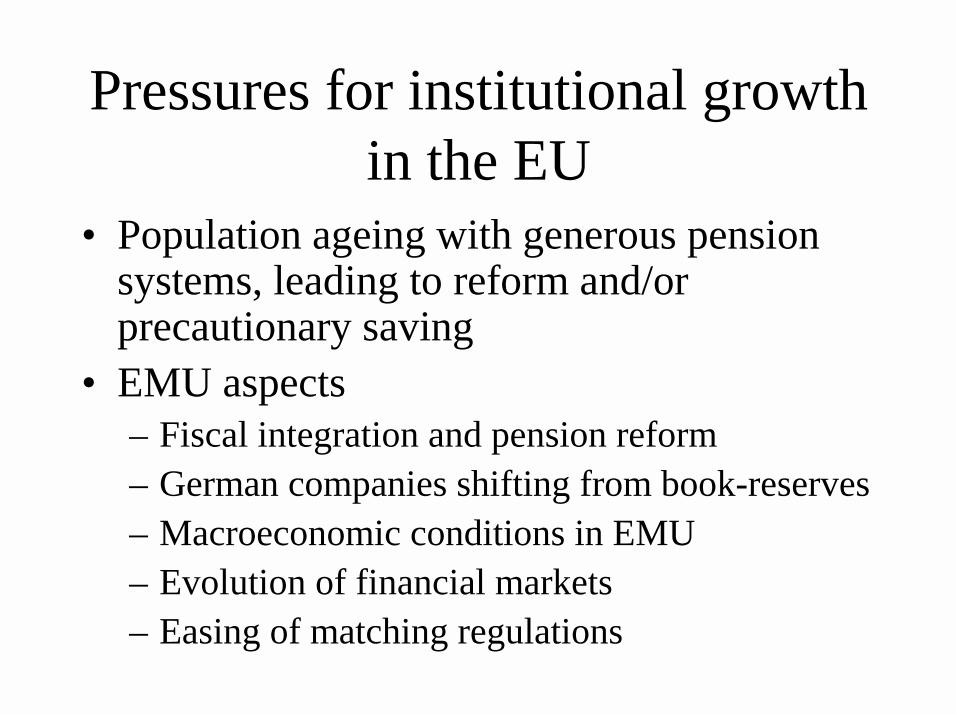
Pressures for institutional growth in the EU
• Population ageing with generous pension systems, leading to reform and/or precautionary saving
• EMU aspects– Fiscal integration and pension reform– German companies shifting from book-reserves– Macroeconomic conditions in EMU– Evolution of financial markets– Easing of matching regulations

• Complementary role of Single Market, leading to internationalisation of asset management
• Stimuli for banks to focus on asset management
• Autonomous factors

Portfolio behaviour of institutional investors
• Common features– Risk pooling– Liquidity preference– Information processing– Size of institutions– Process of asset management – fiduciary and
principal-agent aspects

• Main types of institutional investor– Differ in contractual relations between owners and
managers, rules of risk and return distribution, regulation and in liabilities – implications for Europe
• Pension funds– Key issue is liabilities set in real terms and highly
illiquid so focus on equities, property, foreign
• Life insurers– Liabilities vary between money fixed (matched by
bonds) and variable (scope for equity finance)
• Mutual and hedge funds– Portfolio as set out in prospectus, public demand drives
overall asset allocation
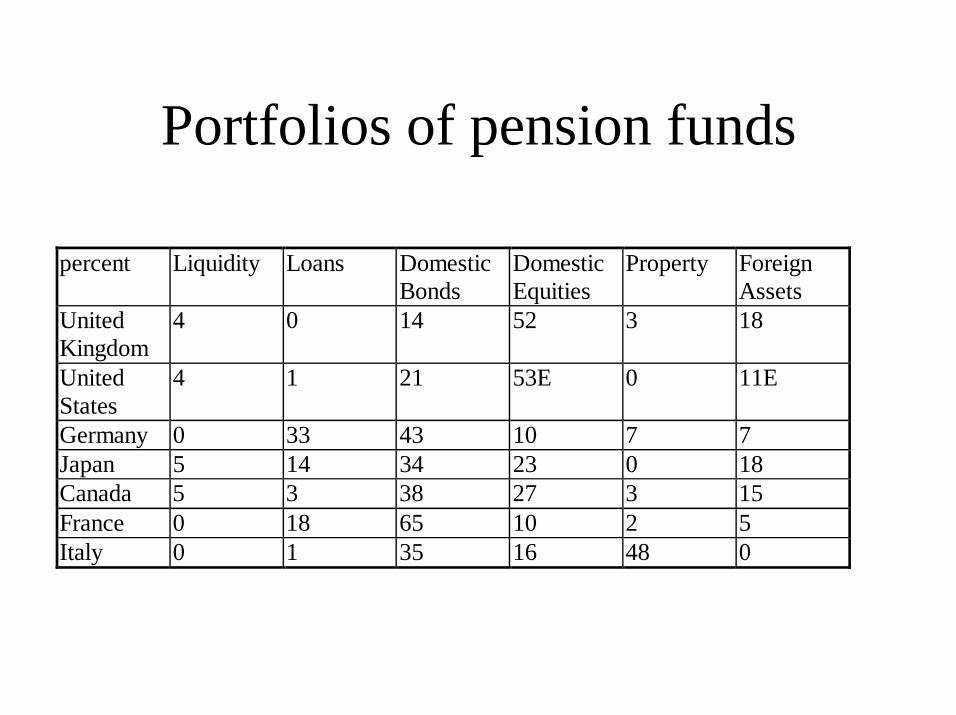
Portfolios of pension funds
percent Liquidity Loans Domestic Bonds
Domestic Equities
Property Foreign Assets
United Kingdom
4 0 14 52 3 18
United States
4 1 21 53E 0 11E
Germany 0 33 43 10 7 7 Japan 5 14 34 23 0 18 Canada 5 3 38 27 3 15 France 0 18 65 10 2 5 Italy 0 1 35 16 48 0
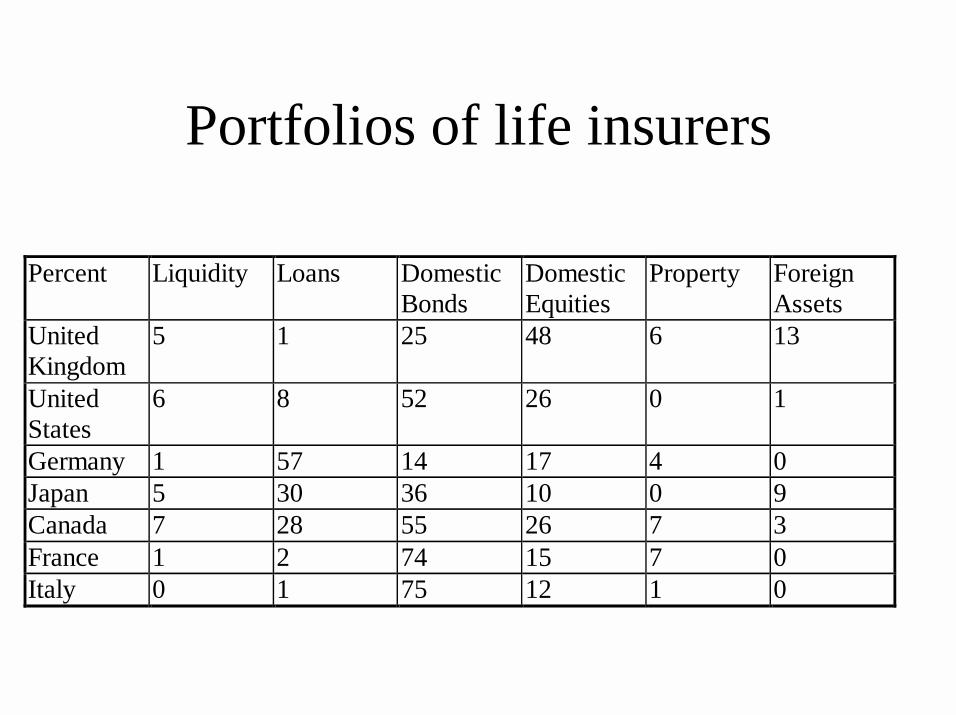
Portfolios of life insurers
Percent Liquidity Loans Domestic Bonds
Domestic Equities
Property Foreign Assets
United Kingdom
5 1 25 48 6 13
United States
6 8 52 26 0 1
Germany 1 57 14 17 4 0 Japan 5 30 36 10 0 9 Canada 7 28 55 26 7 3 France 1 2 74 15 7 0 Italy 0 1 75 12 1 0

Portfolios of mutual funds
Percent Liquidity Loans Domestic Bonds
Domestic Equities
Property Foreign Assets
United Kingdom
4 0 8 56 2 33
United States
17 0 30 51 0 N.A.
Germany 10 0 22 18 0 29 Japan 23 18 27 9 0 22 Canada 20 3 18 31 0 23 France 29 0 37 20 0 14 Italy 19 0 54 22 0 0
• Locus of risk bearing shifting towards household (defined contribution pension funds, variable life policies)
• Household influence on asset allocation• Blurring of distinctions between types of
institution

Institutions, saving andinvestment
• Financial function of resource transfer• General considerations – the life cycle and saving
in countries where institutions large• Avenues for influence on saving
– Illiquidity of claims– Liquidity constraints on households– Retirement income and retirement behaviour– Unfunded social security and saving– Tax aspects– Offsetting effects on government saving
• Some key results– 30-50% of US defined benefit funds are new
saving– Effects on saving from DC - US 401(k)s– No benefit from short maturity instruments– Pension reform and saving in emerging market
economies– Unfunded social security cuts saving, notably
with imperfect capital markets– Institutional investment and financial
liberalisation– Compulsory saving and low income persons– Ageing and saving – institutions not causal
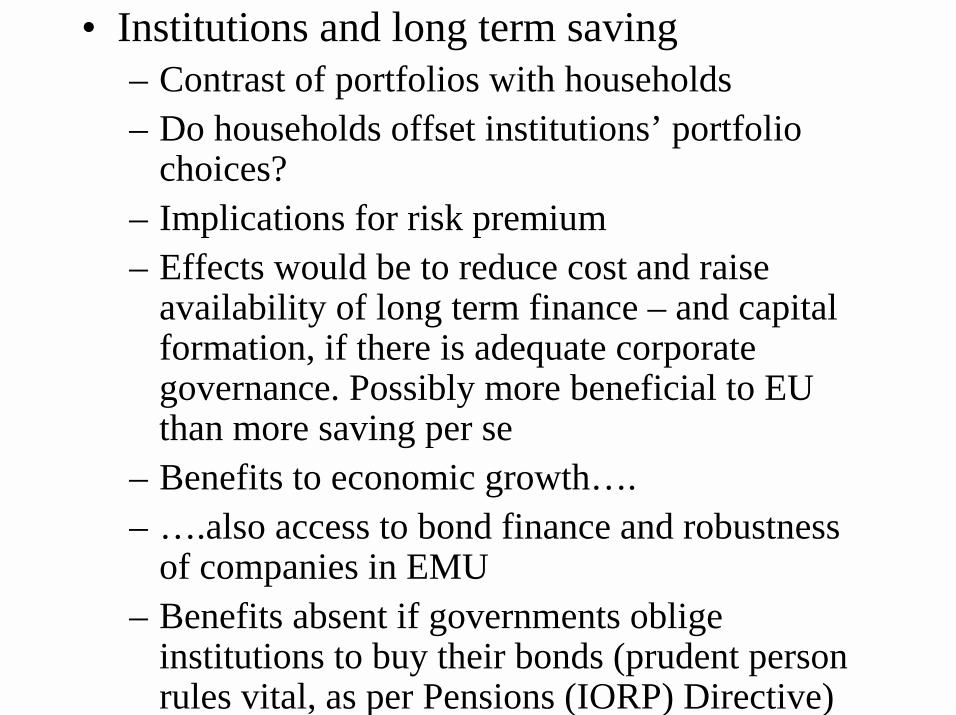
• Institutions and long term saving– Contrast of portfolios with households– Do households offset institutions’ portfolio
choices?– Implications for risk premium– Effects would be to reduce cost and raise
availability of long term finance – and capital formation, if there is adequate corporate governance. Possibly more beneficial to EU than more saving per se
– Benefits to economic growth….– ….also access to bond finance and robustness
of companies in EMU– Benefits absent if governments oblige
institutions to buy their bonds (prudent person rules vital, as per Pensions (IORP) Directive)
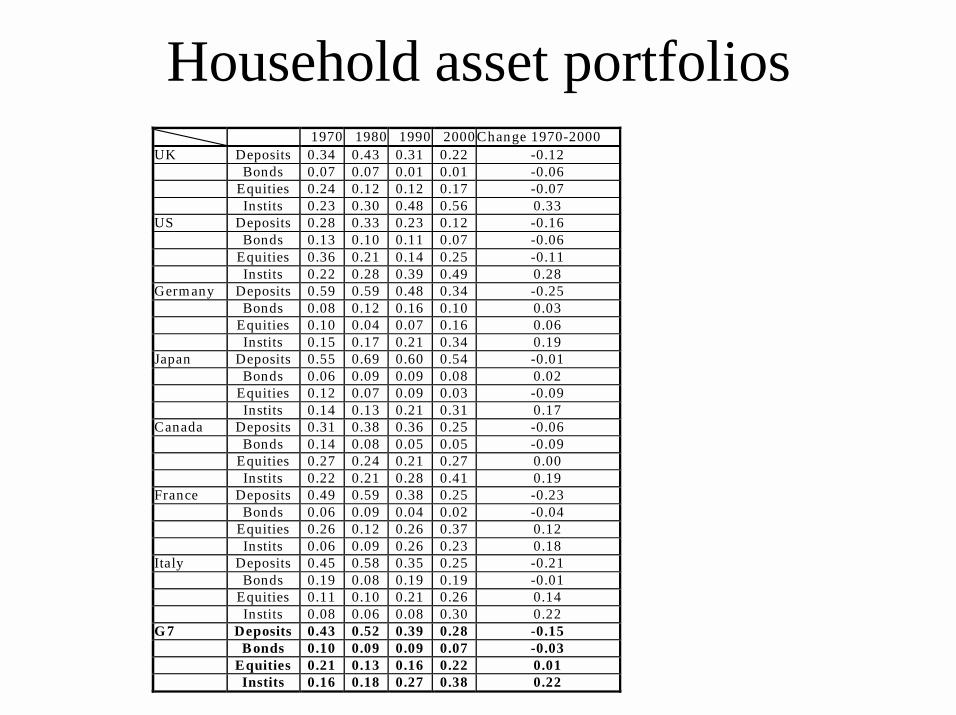
Household asset portfolios 1970 1980 1990 2000 Change 1970-2000 UK Deposits 0.34 0.43 0.31 0.22 -0.12 Bonds 0.07 0.07 0.01 0.01 -0.06 Equities 0.24 0.12 0.12 0.17 -0.07 Instits 0.23 0.30 0.48 0.56 0.33 US Deposits 0.28 0.33 0.23 0.12 -0.16 Bonds 0.13 0.10 0.11 0.07 -0.06 Equities 0.36 0.21 0.14 0.25 -0.11 Instits 0.22 0.28 0.39 0.49 0.28 Germ any Deposits 0.59 0.59 0.48 0.34 -0.25 Bonds 0.08 0.12 0.16 0.10 0.03 Equities 0.10 0.04 0.07 0.16 0.06 Instits 0.15 0.17 0.21 0.34 0.19 Japan Deposits 0.55 0.69 0.60 0.54 -0.01 Bonds 0.06 0.09 0.09 0.08 0.02 Equities 0.12 0.07 0.09 0.03 -0.09 Instits 0.14 0.13 0.21 0.31 0.17 Canada Deposits 0.31 0.38 0.36 0.25 -0.06 Bonds 0.14 0.08 0.05 0.05 -0.09 Equities 0.27 0.24 0.21 0.27 0.00 Instits 0.22 0.21 0.28 0.41 0.19 France Deposits 0.49 0.59 0.38 0.25 -0.23 Bonds 0.06 0.09 0.04 0.02 -0.04 Equities 0.26 0.12 0.26 0.37 0.12 Instits 0.06 0.09 0.26 0.23 0.18 Italy Deposits 0.45 0.58 0.35 0.25 -0.21 Bonds 0.19 0.08 0.19 0.19 -0.01 Equities 0.11 0.10 0.21 0.26 0.14 Instits 0.08 0.06 0.08 0.30 0.22 G 7 Deposits 0.43 0.52 0.39 0.28 -0.15 B onds 0.10 0.09 0.09 0.07 -0.03 Equities 0.21 0.13 0.16 0.22 0.01 Instits 0.16 0.18 0.27 0.38 0.22

Corporate liabilities 1970 1980 1990 2000 Change 1970-2000 UK Bond 0.07 0.02 0.00 0.07 0.00 Equity 0.49 0.37 0.53 0.67 0.17 Loan 0.15 0.22 0.21 0.21 0.06 US Bond 0.14 0.17 0.18 0.14 0.00 Equity 0.55 0.49 0.39 0.63 0.08 Loan 0.15 0.13 0.18 0.10 -0.04 Germany Bond 0.03 0.02 0.02 0.01 -0.02 Equity 0.27 0.20 0.31 0.49 0.22 Loan 0.47 0.52 0.42 0.37 -0.09 Japan Bond 0.02 0.03 0.06 0.10 0.07 Equity 0.16 0.22 0.29 0.29 0.13 Loan 0.48 0.45 0.45 0.40 -0.08 Canada Bond 0.12 0.08 0.13 0.18 0.07 Equity 0.46 0.41 0.41 0.54 0.08 Loan 0.15 0.22 0.22 0.12 -0.03 France Bond 0.03 0.04 0.04 0.04 0.01 Equity 0.41 0.34 0.56 0.70 0.29 Loan 0.54 0.60 0.38 0.14 -0.40 Italy Bond 0.08 0.04 0.03 0.01 -0.07 Equity 0.32 0.52 0.48 0.52 0.20 Loan 0.60 0.43 0.41 0.30 -0.29 G7 Bond 0.07 0.05 0.07 0.08 0.01 Equity 0.38 0.36 0.43 0.55 0.17 Loan 0.36 0.37 0.32 0.24 -0.13

Institutional investors and corporate governance
• Function of overcoming incentive problems• Growing share of equity held by institutions• The overall issue of corporate governance –
asymmetric information, agency costs and lack of complete contracts
• Conventional instruments of shareholder control – boards and voting rights
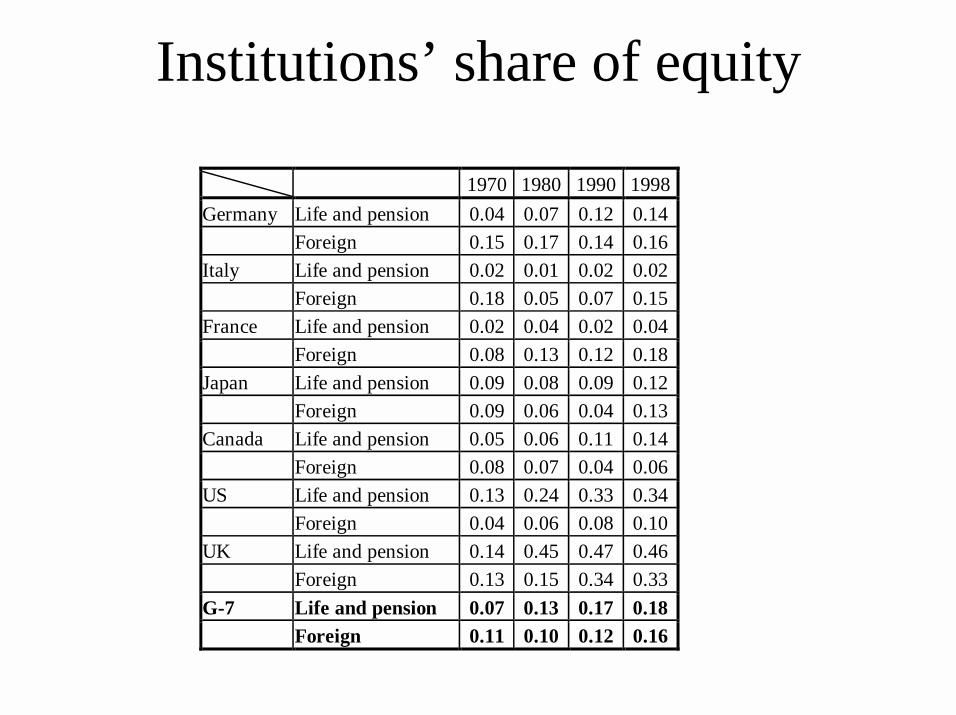
Institutions’ share of equity
1970 1980 1990 1998 Germany Life and pension 0.04 0.07 0.12 0.14 Foreign 0.15 0.17 0.14 0.16 Italy Life and pension 0.02 0.01 0.02 0.02 Foreign 0.18 0.05 0.07 0.15 France Life and pension 0.02 0.04 0.02 0.04 Foreign 0.08 0.13 0.12 0.18 Japan Life and pension 0.09 0.08 0.09 0.12 Foreign 0.09 0.06 0.04 0.13 Canada Life and pension 0.05 0.06 0.11 0.14 Foreign 0.08 0.07 0.04 0.06 US Life and pension 0.13 0.24 0.33 0.34 Foreign 0.04 0.06 0.08 0.10 UK Life and pension 0.14 0.45 0.47 0.46 Foreign 0.13 0.15 0.34 0.33 G-7 Life and pension 0.07 0.13 0.17 0.18 Foreign 0.11 0.10 0.12 0.16

• Four paradigms of corporate governance– Market control via equity (takeovers)– Market control via debt (LBOs)– Direct control via equity (“corporate governance
movement”)– Direct control via debt (relationship banking) – EU
issues and possible transformation – loss of “time series risk sharing”?
• Empirical results on governance– Benefits of takeovers mainly to target shareholders?– Is there short termism?– Governance action changes management structures but
not performance– Some macro effects detectable of institutions – boost
dividends, restrain investment, raise productivity• EU regulatory initiatives
Other efficiency aspects
• Demand for liquidity helps generate it by various channels – lower volatility, easier transfer of liquidity, lower cost of capital
• Manage risk via tailored financial innovations• Ability to employ price information – render
markets efficient domestically and cross border, ensuring efficient capital allocation
• All likely to benefit EU capital markets as institutions develop further
Asset allocation, risk management, market dynamics
• Financial system with institutions predominant should be more stable than bank based in many cases (especially if mispriced safety net protection of banks)
• Securitised financial markets have stabilising features (marking to market, matching of assets and liabilities, distance from safety net, multiple channels)

• But principal-agent problems could give rise to volatility– Possibility of “rational herding”, all buy and sell at
once, which may be “positive feedback”– Means of control – short mandates and performance
measurement– Reputation and desire to show of good quality may lead
to herding as cling to benchmark – or follow successful– Direct effects of performance checks– Short time horizons and information acquisition
• Risk management, shortfall risk, dynamic hedging and VaRs
• Style management and herding• Sales by households• Benchmark matching• Limits on contrarian positions
Systemic consequences
• Sporadic market disruption:• (1) Price volatility following shift in expectations
(1987 crash, ERM, 1994 bonds)• (2) Market liquidity crises (junk bonds,
Russia/LTCM)• Threat to EMEs, banks, non financial sector
countries lacking institutions – but even institutions may be constrained to sell further (e.g. if solvency limits)
• Points mitigating systemic concerns• Further risks for the banking sector in an
institutionalised financial system
Financial stability and life insurance
• Note predominance of sector in most EU countries• Errors in mortality projections• Errors in asset return projections• Increased credit risk• Possible links to banks• Population ageing and life insurance
– Credit risks and credit cycles– Asset prices and ageing
• Issues in Japan – errors in management. Poor regulation, accounting and links to banks

Aspects of prudential regulation• Differing regulation of types of institution – varies
with solvency risk• Institutions and lender of last resort• International LOLR and institutional herding• Liquidity failure and market robustness – EMU-
related integration should aid in Europe• Accounting, regulation and forbearance in Japan• Can herding be reduced?
– Longer mandates and holding periods?– Move to defined contribution?– Prudent person rules?– How to reintroduce contrarian behaviour– Transparency of hedge funds
Conclusions
• Institutions are major financial innovation, becoming pervasive
• Likely impact on Continental Europe of particular interest
• Impacts on financial structure and efficiency – but some unfamiliar risks to stability
• Need for continuing attention to appropriate regulation