Embed Size (px)
Citation preview

1
2015 Swiss Institutional Investors Conference
2
A Robust Approach to Volatility Trading
Alexandre Capez Managing Director, Head of Quantitative Risk Strategies Investment Banking Credit Suisse
Investments – Workshop 7
This material is solely directed at Professional Clients and Eligible Counterparties as defined by the FCA, and is not directed at, and should not be relied upon by, Retail Clients.
A Robust Approach to Volatility Trading
16th September 2015
Alexandre Capez
4
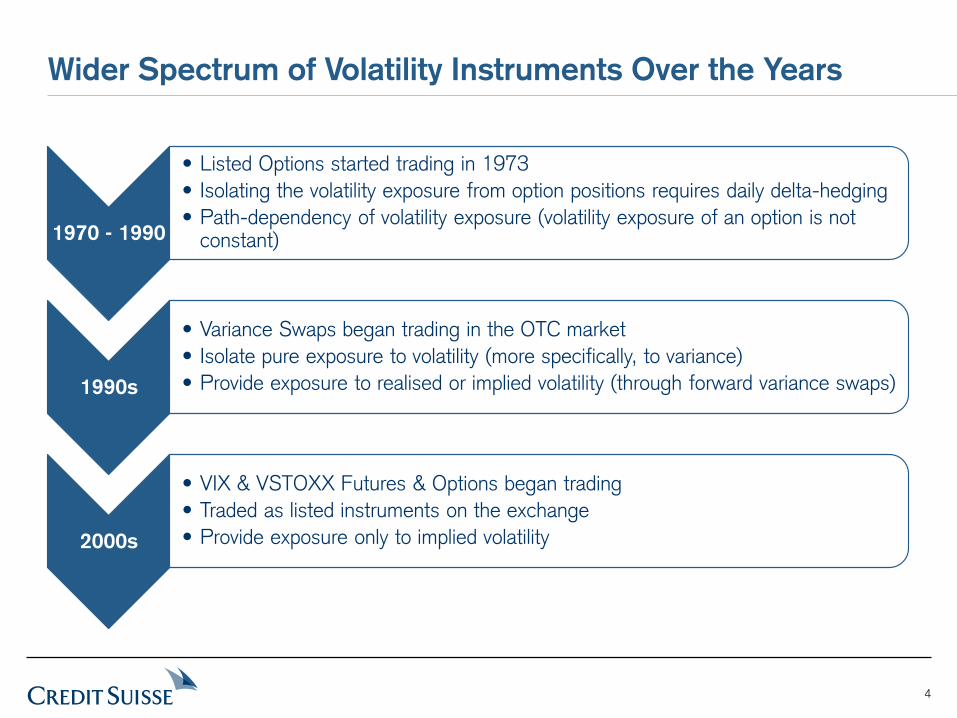
Wider Spectrum of Volatility Instruments Over the Years
1970 - 1990
• Listed Options started trading in 1973 • Isolating the volatility exposure from option positions requires daily delta-hedging • Path-dependency of volatility exposure (volatility exposure of an option is not
constant)
1990s
• Variance Swaps began trading in the OTC market • Isolate pure exposure to volatility (more specifically, to variance) • Provide exposure to realised or implied volatility (through forward variance swaps)
2000s
• VIX & VSTOXX Futures & Options began trading • Traded as listed instruments on the exchange • Provide exposure only to implied volatility

Typography of Investors
6
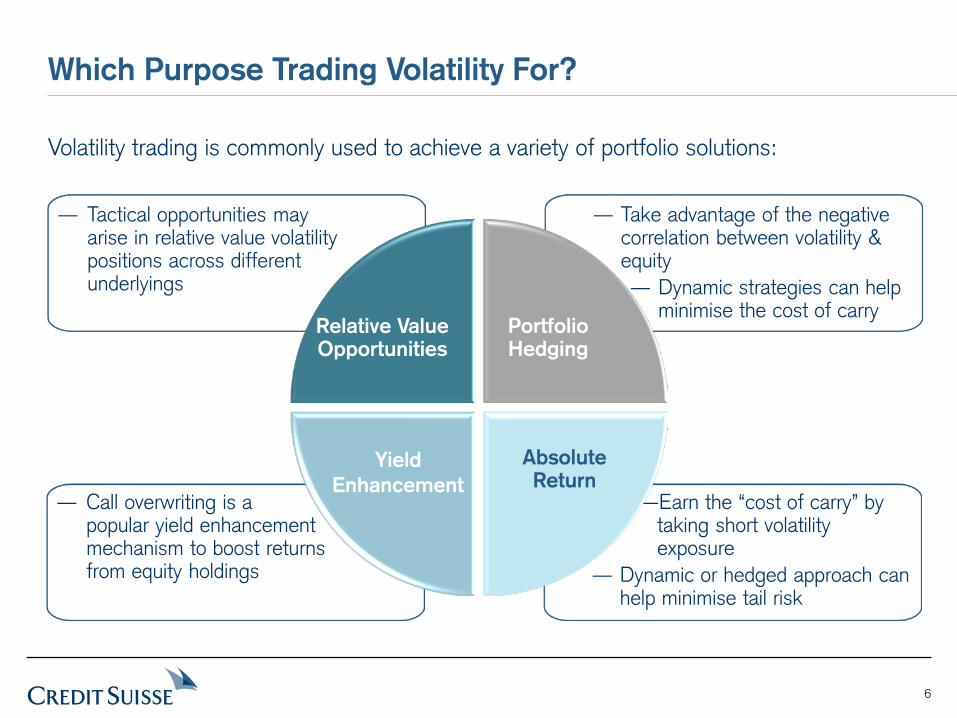
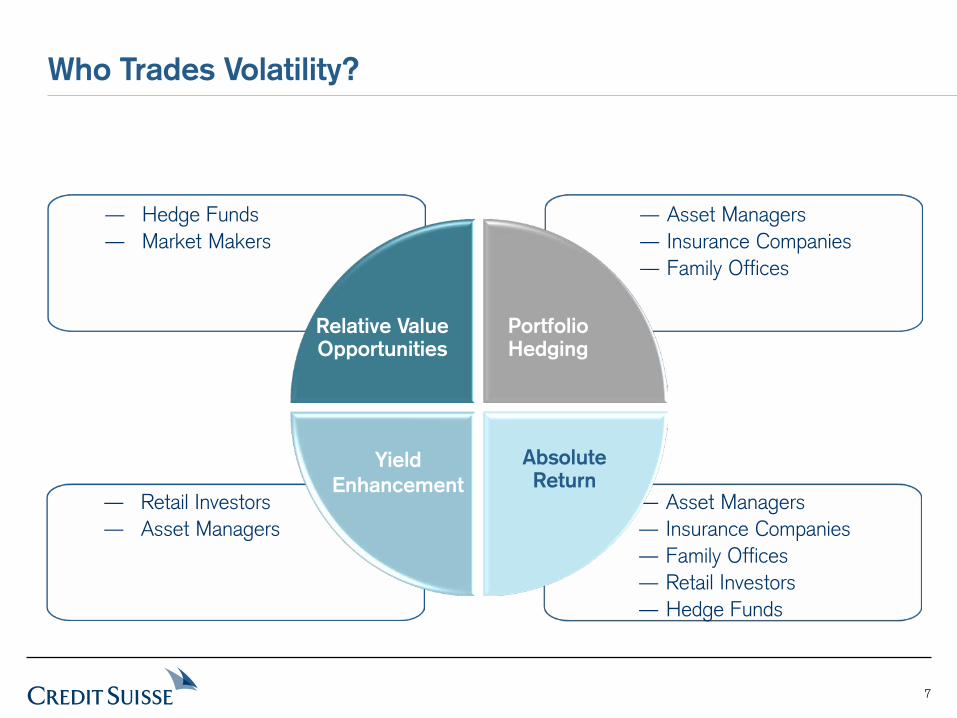
― Tactical opportunities may arise in relative value volatility positions across different underlyings
Relative Value Opportunities
Which Purpose Trading Volatility For?
Volatility trading is commonly used to achieve a variety of portfolio solutions:
―Earn the “cost of carry” by taking short volatility exposure
― Dynamic or hedged approach can help minimise tail risk
― Call overwriting is a popular yield enhancement mechanism to boost returns from equity holdings
― Take advantage of the negative correlation between volatility & equity ― Dynamic strategies can help
minimise the cost of carry
Yield Enhancement
Absolute Return
Portfolio Hedging
7
― Hedge Funds ― Market Makers
Relative Value Opportunities
Who Trades Volatility?
― Asset Managers ― Insurance Companies ― Family Offices ― Retail Investors ― Hedge Funds
― Retail Investors ― Asset Managers
― Asset Managers ― Insurance Companies ― Family Offices
Yield Enhancement
Absolute Return
Portfolio Hedging

Volatility Properties at a Glance
9
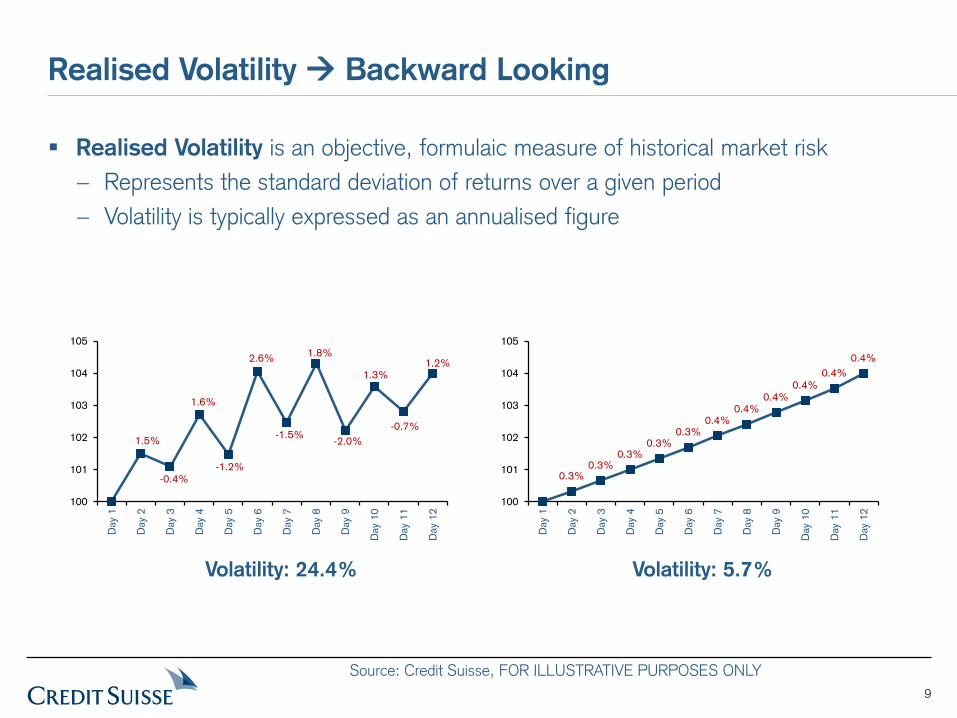
Realised Volatility Backward Looking
Realised Volatility is an objective, formulaic measure of historical market risk − Represents the standard deviation of returns over a given period − Volatility is typically expressed as an annualised figure
1.5%
-0.4%
1.6%
-1.2%
2.6%
-1.5%
1.8%
-2.0%
1.3%
-0.7%
1.2%
100
101
102
103
104
105
Day
1
Day
2
Day
3
Day
4
Day
5
Day
6
Day
7
Day
8
Day
9
Day
10
Day
11
Day
12
0.3%0.3%
0.3%0.3%
0.3%0.4%
0.4%0.4%
0.4%0.4%
0.4%
100
101
102
103
104
105
Day
1
Day
2
Day
3
Day
4
Day
5
Day
6
Day
7
Day
8
Day
9
Day
10
Day
11
Day
12
Volatility: 24.4% Volatility: 5.7%
Source: Credit Suisse, FOR ILLUSTRATIVE PURPOSES ONLY

10
Implied Volatility Forward Looking
Implied Volatility is a subjective measure derived from the market price of options − Influenced by demand and supply of options − Can be seen as a measure of market sentiment or perceived risk
Black-Scholes Option Valuation
Spot Price
Strike Price
Interest Rate
Time to maturity
Volatility
Market Price for Option
Implied Volatility
11
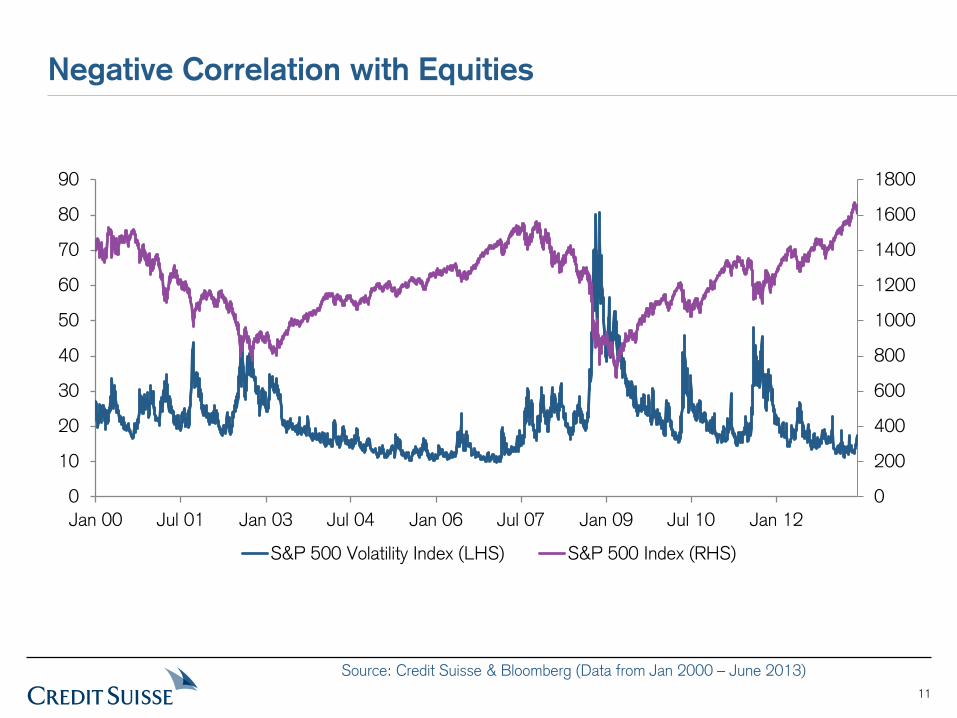
Negative Correlation with Equities
0
200
400
600
800
1000
1200
1400
1600
1800
0
10
20
30
40
50
60
70
80
90
Jan 00 Jul 01 Jan 03 Jul 04 Jan 06 Jul 07 Jan 09 Jul 10 Jan 12
S&P 500 Volatility Index (LHS) S&P 500 Index (RHS)
Source: Credit Suisse & Bloomberg (Data from Jan 2000 – June 2013)
12
0
10
20
30
40
50
60
70
80
90
Jan 00 Jul 01 Jan 03 Jul 04 Jan 06 Jul 07 Jan 09 Jul 10 Jan 12
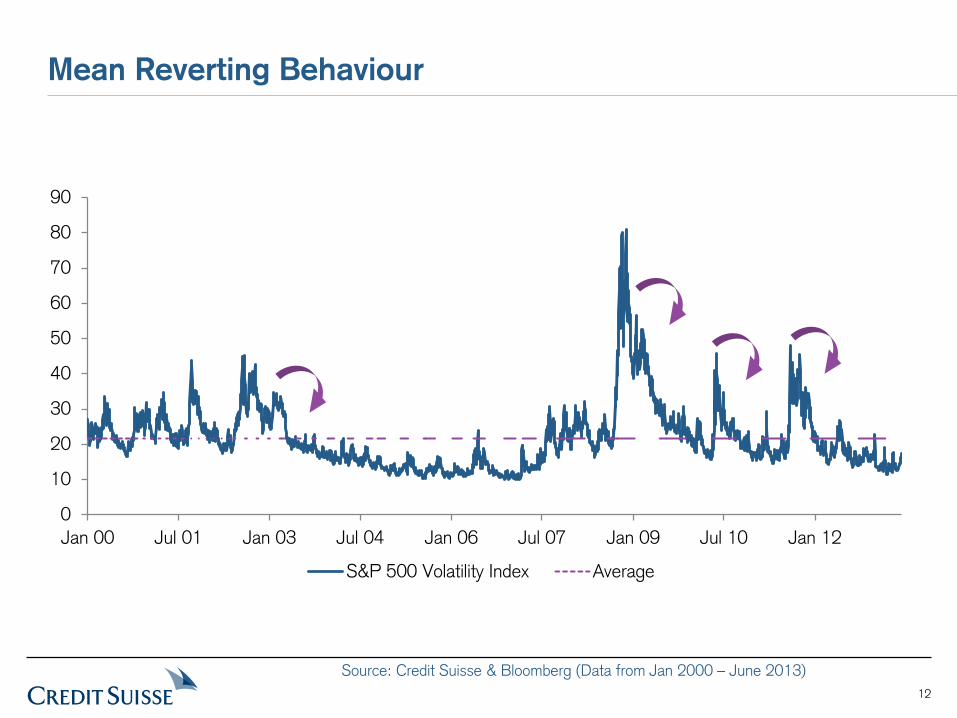
S&P 500 Volatility Index Average
Mean Reverting Behaviour
Source: Credit Suisse & Bloomberg (Data from Jan 2000 – June 2013)
13
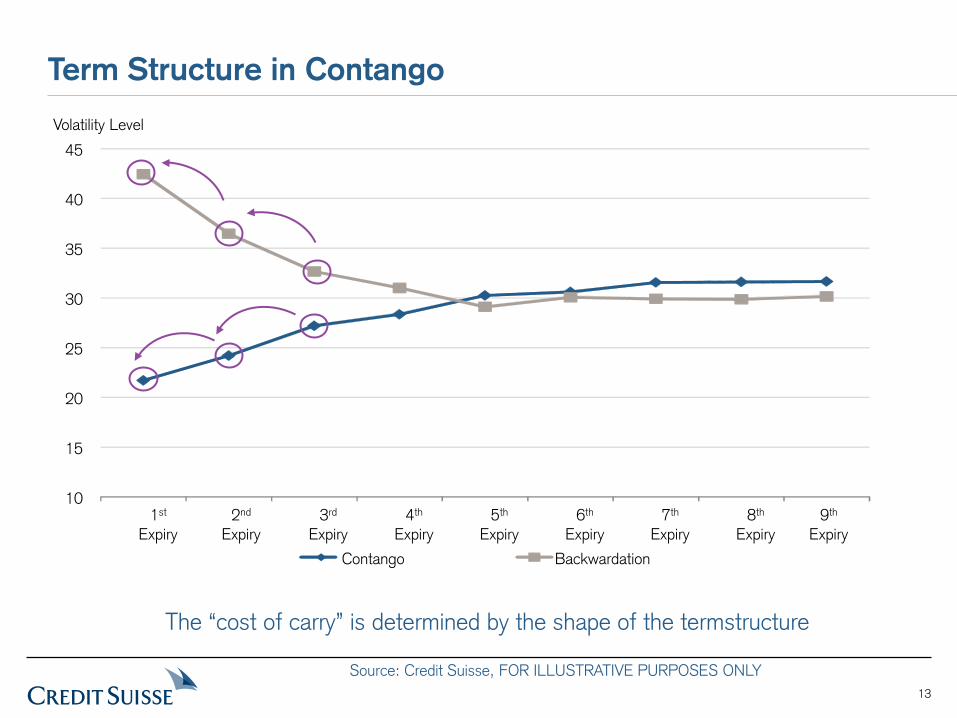
Term Structure in Contango
10
15
20
25
30
35
40
45 Volatility Level
1st Expiry
2nd Expiry
3rd Expiry
4th Expiry
5th Expiry
6th Expiry
7th Expiry
8th Expiry
9th Expiry
Contango Backwardation
The “cost of carry” is determined by the shape of the termstructure
Source: Credit Suisse, FOR ILLUSTRATIVE PURPOSES ONLY
14
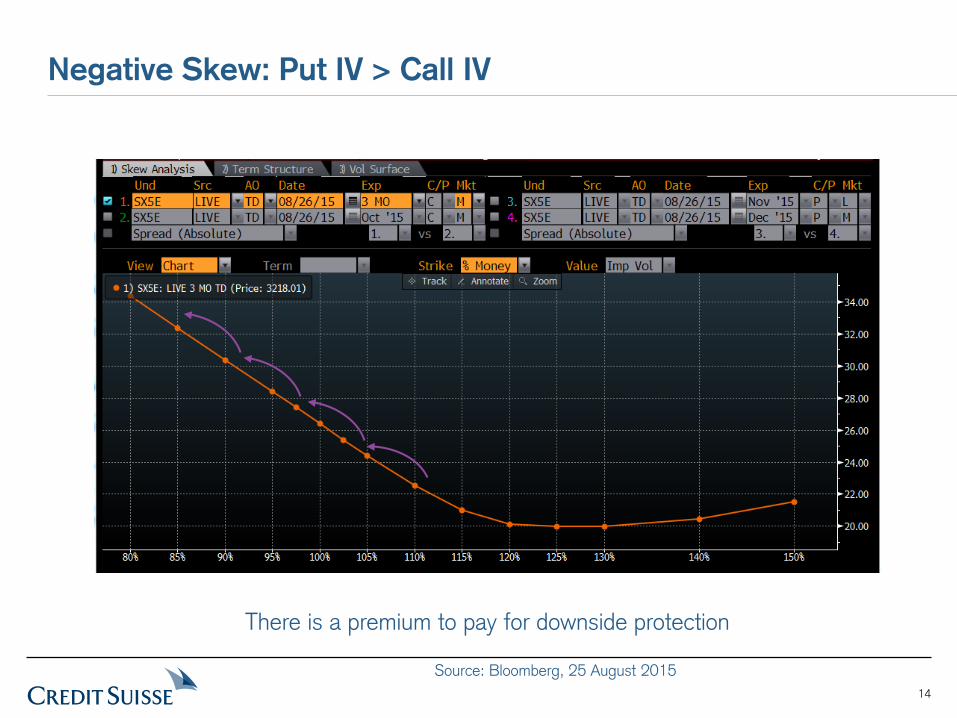
Negative Skew: Put IV > Call IV
There is a premium to pay for downside protection
Source: Bloomberg, 25 August 2015
15
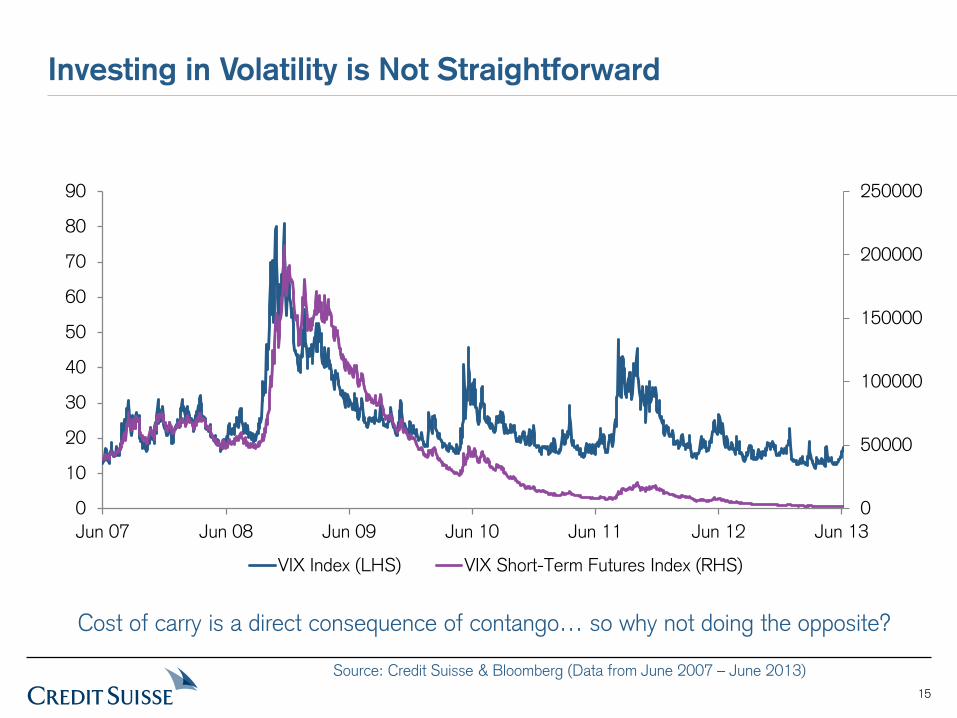
Investing in Volatility is Not Straightforward
0
50000
100000
150000
200000
250000
0
10
20
30
40
50
60
70
80
90
Jun 07 Jun 08 Jun 09 Jun 10 Jun 11 Jun 12 Jun 13
VIX Index (LHS) VIX Short-Term Futures Index (RHS)
Cost of carry is a direct consequence of contango… so why not doing the opposite?
Source: Credit Suisse & Bloomberg (Data from June 2007 – June 2013)
Volatility Carry: A Slippery Fish
17
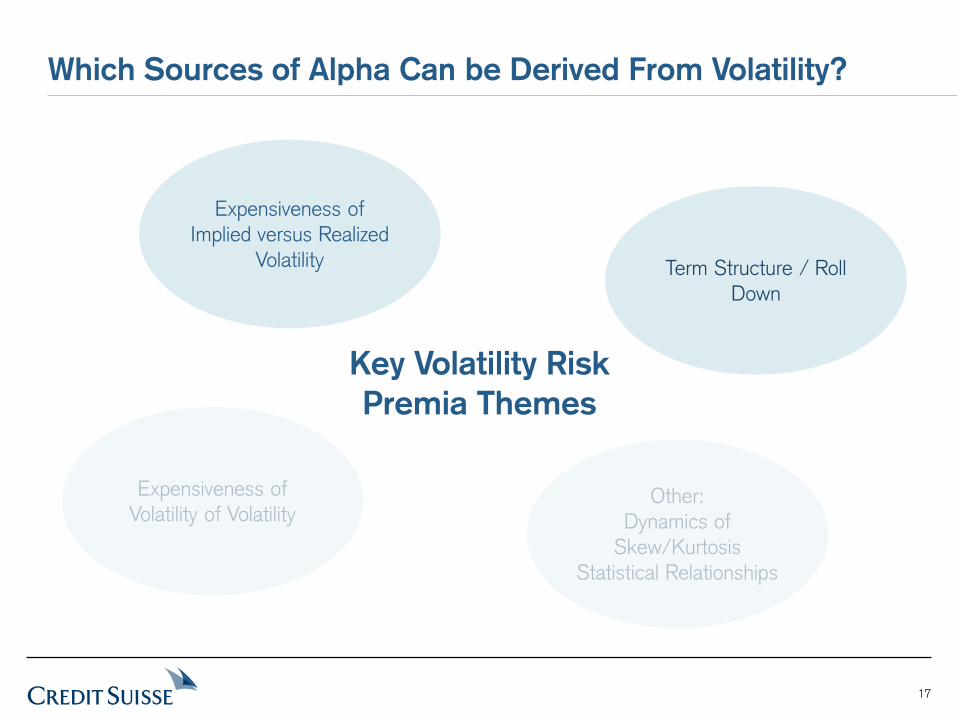
Key Volatility Risk Premia Themes
Which Sources of Alpha Can be Derived From Volatility?
Expensiveness of Implied versus Realized
Volatility
Expensiveness of Volatility of Volatility
Term Structure / Roll Down
Other: Dynamics of
Skew/Kurtosis Statistical Relationships
18
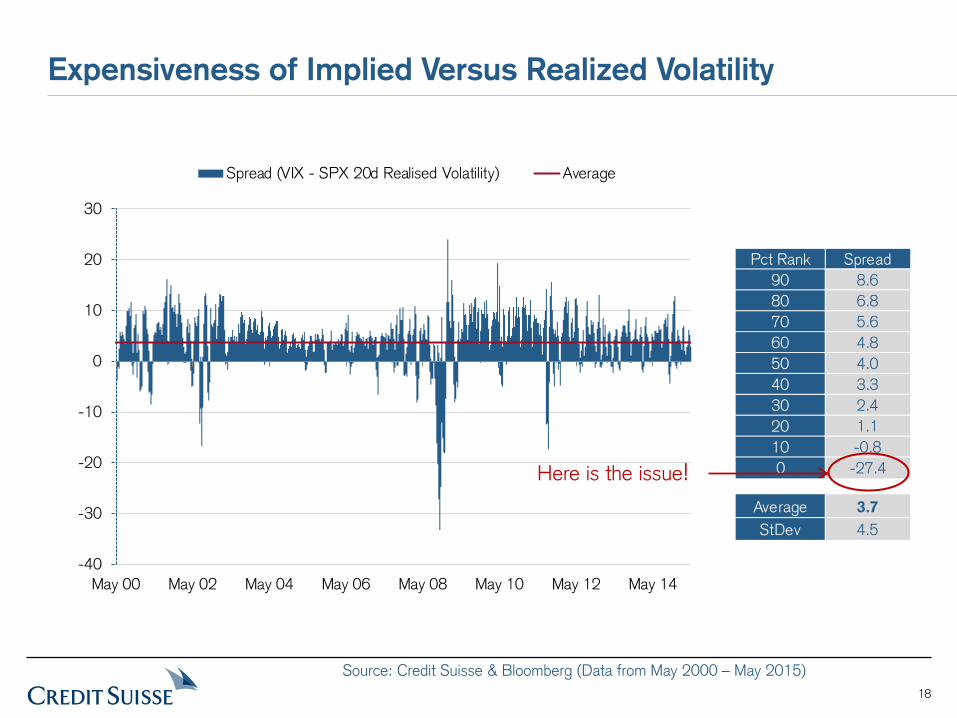
Expensiveness of Implied Versus Realized Volatility
-40
-30
-20
-10
0
10
20
30
May 00 May 02 May 04 May 06 May 08 May 10 May 12 May 14
Spread (VIX - SPX 20d Realised Volatility) Average
Pct Rank Spread90 8.680 6.870 5.660 4.850 4.040 3.330 2.420 1.110 -0.80 -27.4
Average 3.7StDev 4.5
Here is the issue!
Source: Credit Suisse & Bloomberg (Data from May 2000 – May 2015)
19
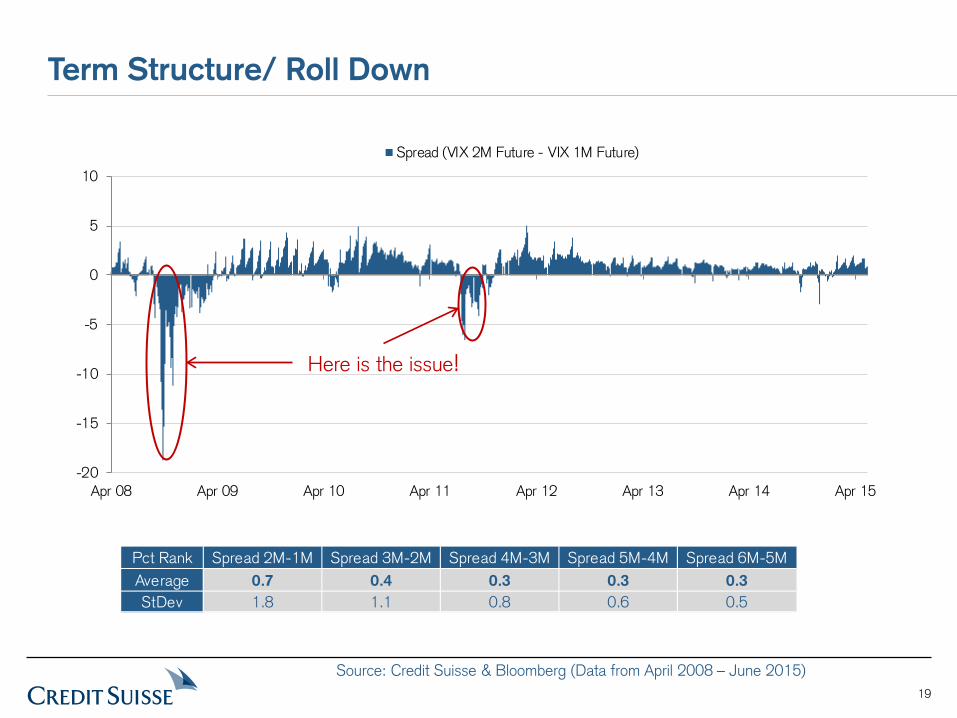
Term Structure/ Roll Down
Pct Rank Spread 2M-1M Spread 3M-2M Spread 4M-3M Spread 5M-4M Spread 6M-5MAverage 0.7 0.4 0.3 0.3 0.3StDev 1.8 1.1 0.8 0.6 0.5
-20
-15
-10
-5
0
5
10
Apr 08 Apr 09 Apr 10 Apr 11 Apr 12 Apr 13 Apr 14 Apr 15
Spread (VIX 2M Future - VIX 1M Future)
Here is the issue!
Source: Credit Suisse & Bloomberg (Data from April 2008 – June 2015)
20
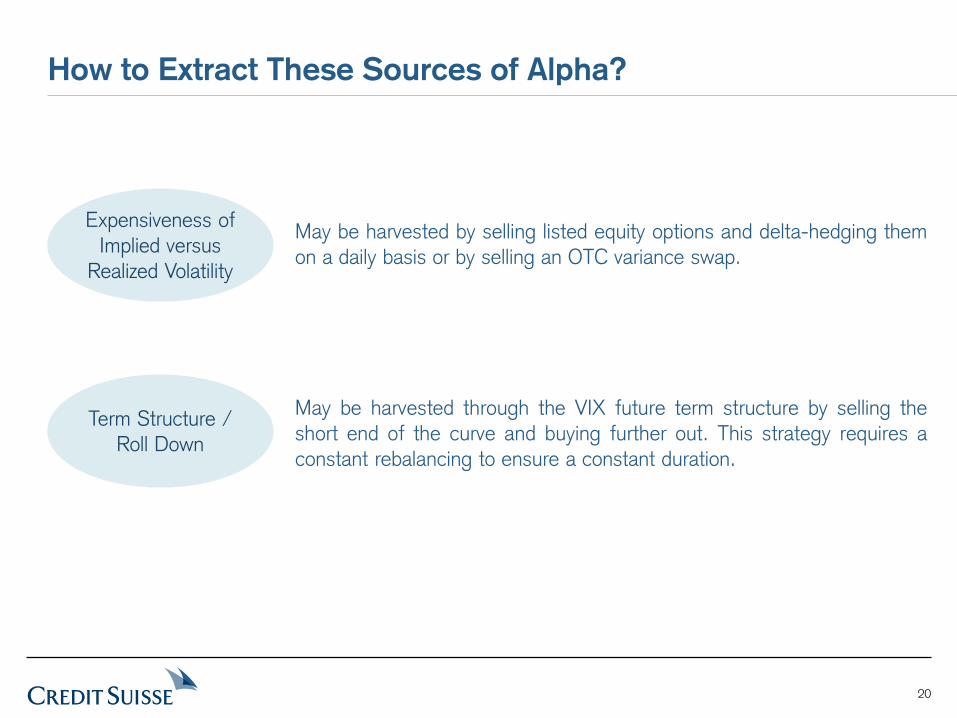
How to Extract These Sources of Alpha?
Expensiveness of Implied versus
Realized Volatility
Term Structure / Roll Down
May be harvested by selling listed equity options and delta-hedging them on a daily basis or by selling an OTC variance swap.
May be harvested through the VIX future term structure by selling the short end of the curve and buying further out. This strategy requires a constant rebalancing to ensure a constant duration.
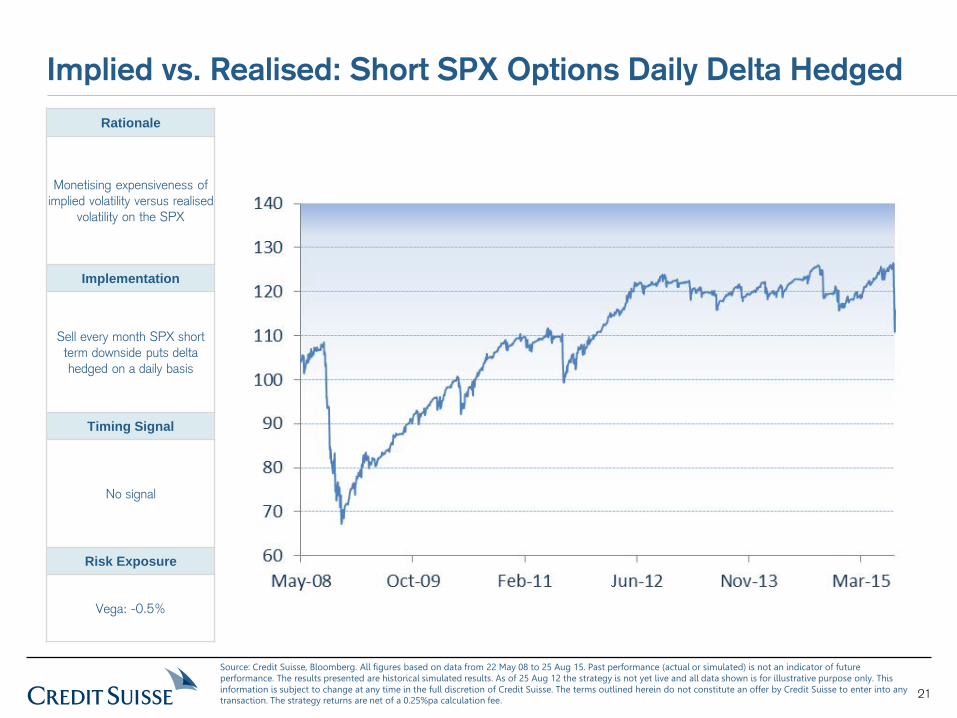
21
Implied vs. Realised: Short SPX Options Daily Delta Hedged Rationale
Monetising expensiveness of implied volatility versus realised
volatility on the SPX
Implementation
Sell every month SPX short term downside puts delta hedged on a daily basis
Timing Signal
No signal
Risk Exposure
Vega: -0.5%
Source: Credit Suisse, Bloomberg. All figures based on data from 22 May 08 to 25 Aug 15. Past performance (actual or simulated) is not an indicator of future performance. The results presented are historical simulated results. As of 25 Aug 12 the strategy is not yet live and all data shown is for illustrative purpose only. This information is subject to change at any time in the full discretion of Credit Suisse. The terms outlined herein do not constitute an offer by Credit Suisse to enter into any transaction. The strategy returns are net of a 0.25%pa calculation fee.
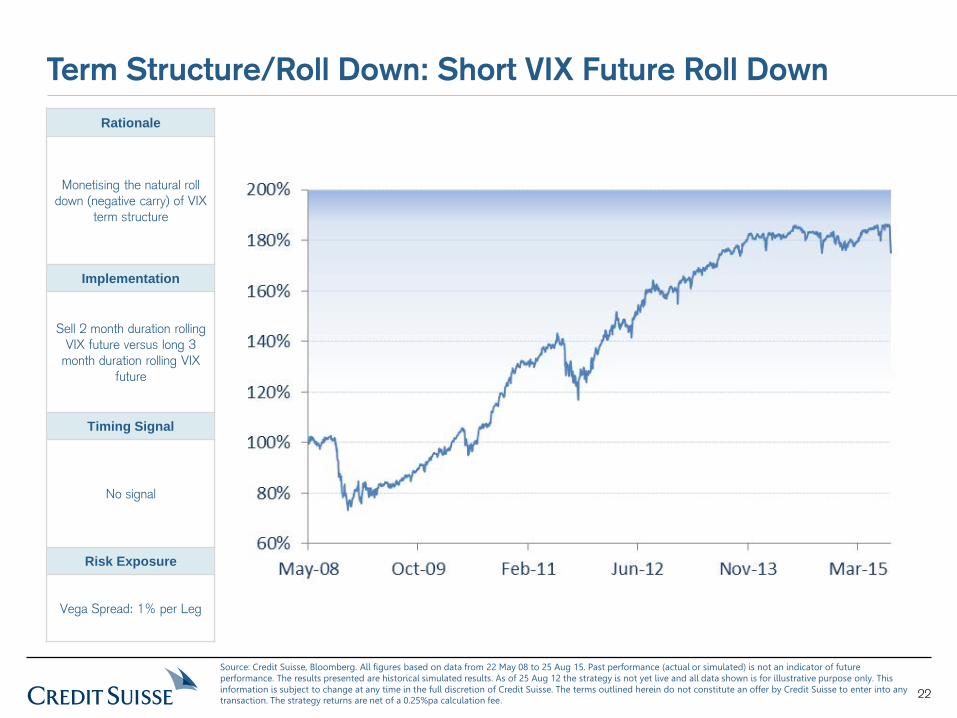
22
Term Structure/Roll Down: Short VIX Future Roll Down Rationale
Monetising the natural roll down (negative carry) of VIX
term structure
Implementation
Sell 2 month duration rolling VIX future versus long 3
month duration rolling VIX future
Timing Signal
No signal
Risk Exposure
Vega Spread: 1% per Leg
Source: Credit Suisse, Bloomberg. All figures based on data from 22 May 08 to 25 Aug 15. Past performance (actual or simulated) is not an indicator of future performance. The results presented are historical simulated results. As of 25 Aug 12 the strategy is not yet live and all data shown is for illustrative purpose only. This information is subject to change at any time in the full discretion of Credit Suisse. The terms outlined herein do not constitute an offer by Credit Suisse to enter into any transaction. The strategy returns are net of a 0.25%pa calculation fee.

Virtual or Real Alpha
24
Alpha Comes and Goes. Outsmart It But With Caution!
Equity volatility “naïve” Alpha has declined over the past few years as seen previously (despite a good start of the year in 2015)
This has led to a need for alternative solutions or “smart” Alpha to compensate for lack of returns
… however, this search for which unfortunately can end up searching Alpha where there is none!
25
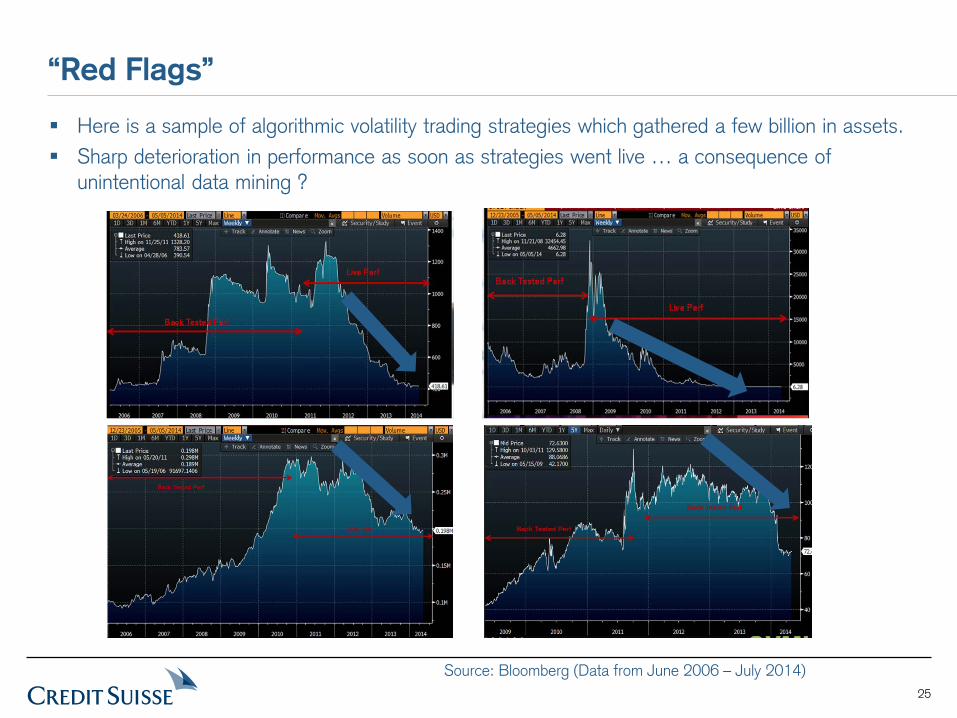
“Red Flags”
Here is a sample of algorithmic volatility trading strategies which gathered a few billion in assets. Sharp deterioration in performance as soon as strategies went live … a consequence of
unintentional data mining ?
Source: Bloomberg (Data from June 2006 – July 2014)
26
“Red Flags”
Some of the common traps on systematic strategies may attributed to the below effects:
Multiplication of Embedded Signals in the Strategy:” “With four parameters I can fit an elephant, and with five I can make him wiggle his trunk” John Von Neumann
Lack of Fundamentals: The fallacy of: Post hoc ergo propter hoc (“After this, therefore because of this”) Correlation does not imply Causation “Noise can be confused with signal in many ways” Blinded by Optimism (Winton Capital, 2013)
Selection Bias: Selecting best-in-class strategies among a universe of backtested performance decreases the likelihood for the selected strategy to be effective. The bigger the sample of backtested strategies the smaller the probability for the strategy to perform.
Survivorship Bias or “Silent evidence” (The Black Swan, Nassim Taleb) Extrapolation of the Selection bias: A PM selecting CTAs purely based on performance and discarding poor strategies is likely to suffer “regression to the mean”
27
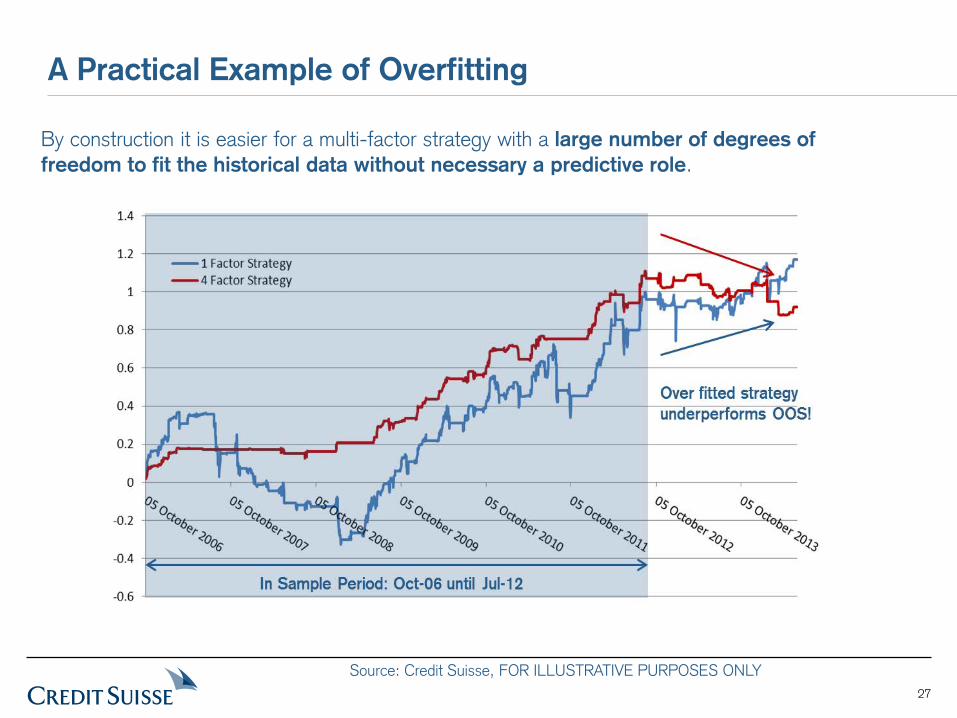
A Practical Example of Overfitting
By construction it is easier for a multi-factor strategy with a large number of degrees of freedom to fit the historical data without necessary a predictive role.
Source: Credit Suisse, FOR ILLUSTRATIVE PURPOSES ONLY
A Robust Approach to Volatility Trading
29
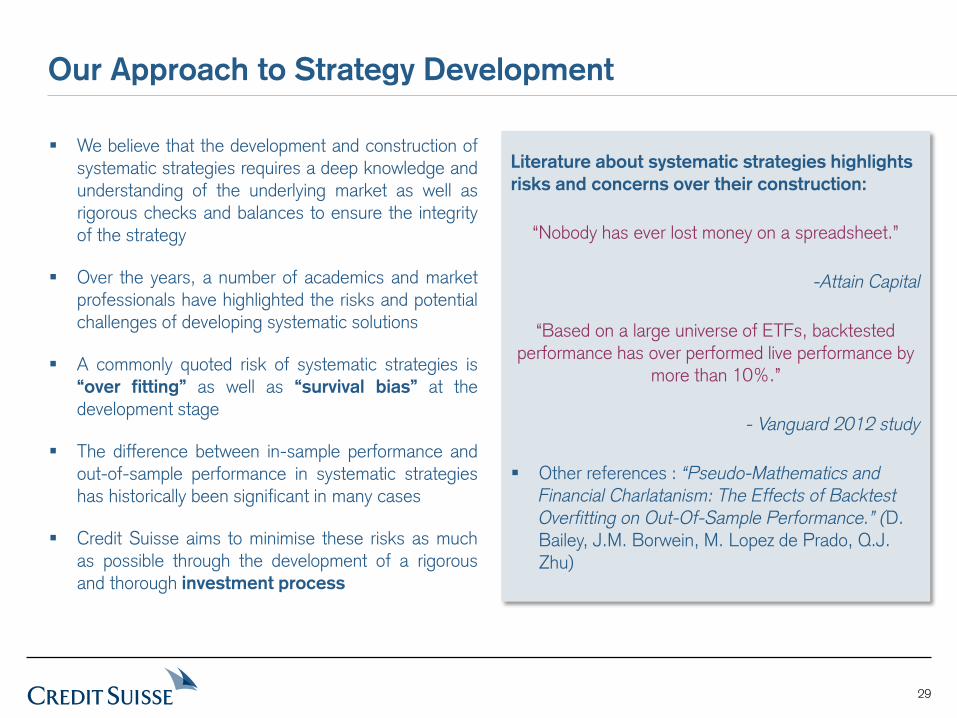
We believe that the development and construction of systematic strategies requires a deep knowledge and understanding of the underlying market as well as rigorous checks and balances to ensure the integrity of the strategy
Over the years, a number of academics and market professionals have highlighted the risks and potential challenges of developing systematic solutions
A commonly quoted risk of systematic strategies is “over fitting” as well as “survival bias” at the development stage
The difference between in-sample performance and out-of-sample performance in systematic strategies has historically been significant in many cases
Credit Suisse aims to minimise these risks as much as possible through the development of a rigorous and thorough investment process
Our Approach to Strategy Development
Literature about systematic strategies highlights risks and concerns over their construction:
“Nobody has ever lost money on a spreadsheet.”
-Attain Capital
“Based on a large universe of ETFs, backtested performance has over performed live performance by
more than 10%.”
- Vanguard 2012 study
Other references : “Pseudo-Mathematics and Financial Charlatanism: The Effects of Backtest Overfitting on Out-Of-Sample Performance.” (D. Bailey, J.M. Borwein, M. Lopez de Prado, Q.J. Zhu)
30
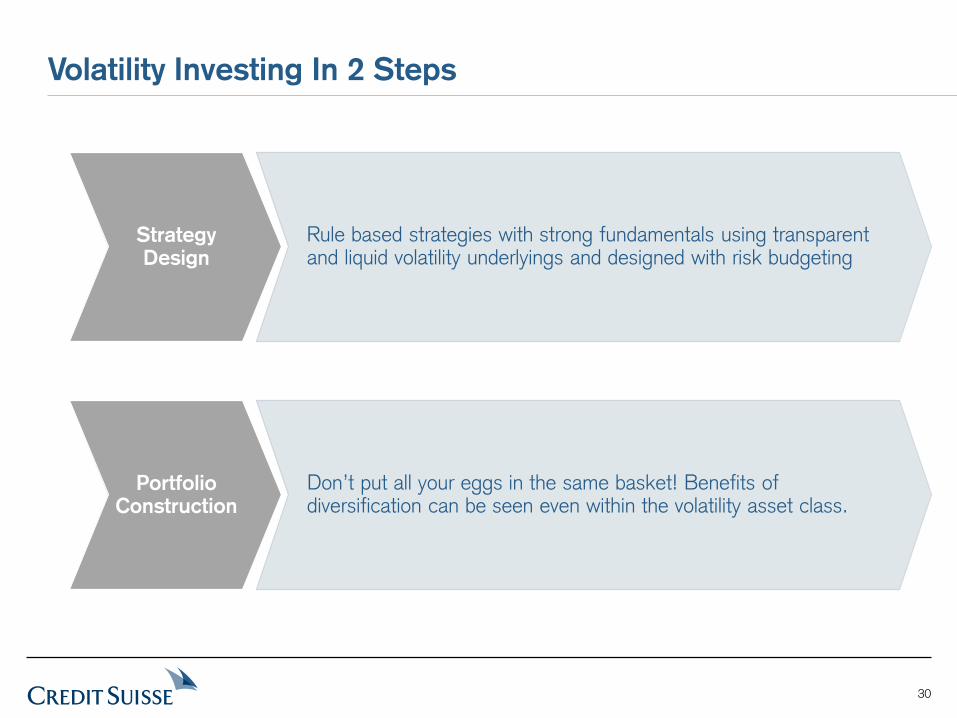
Volatility Investing In 2 Steps
Strategy Design
Rule based strategies with strong fundamentals using transparent and liquid volatility underlyings and designed with risk budgeting
Portfolio Construction
Don’t put all your eggs in the same basket! Benefits of diversification can be seen even within the volatility asset class.
31
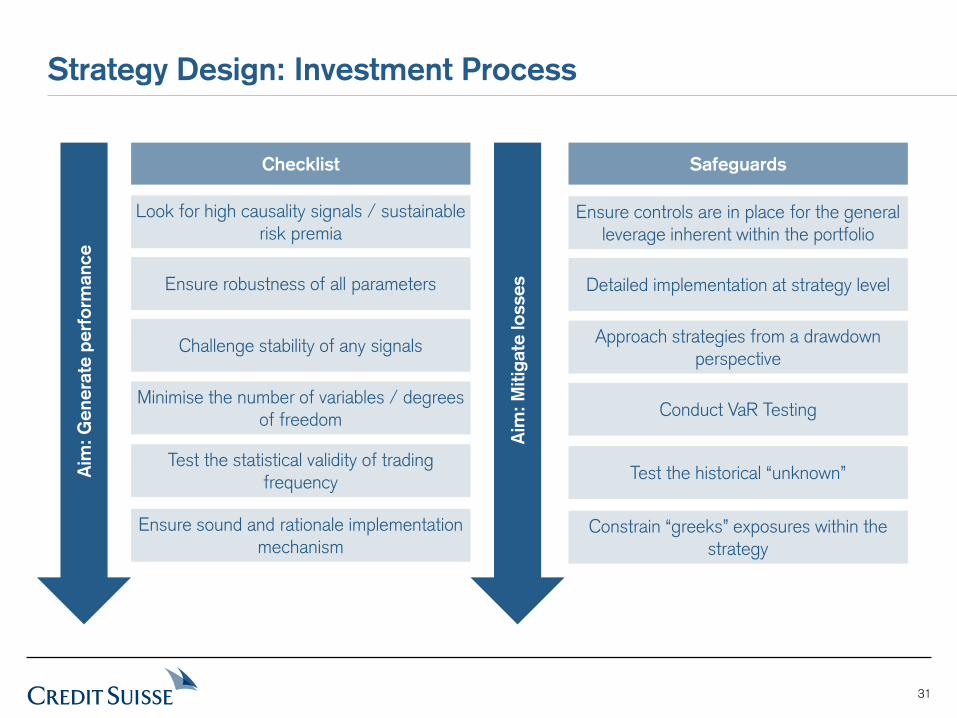
Strategy Design: Investment Process
Checklist
Look for high causality signals / sustainable risk premia
Ensure robustness of all parameters
Challenge stability of any signals
Minimise the number of variables / degrees of freedom
Safeguards
Test the statistical validity of trading frequency
Ensure controls are in place for the general leverage inherent within the portfolio
Approach strategies from a drawdown perspective
Test the historical “unknown”
Constrain “greeks” exposures within the strategy
Aim
: Gen
erat
e pe
rfor
man
ce
Aim
: Miti
gate
loss
es
Conduct VaR Testing
Ensure sound and rationale implementation mechanism
Detailed implementation at strategy level
32
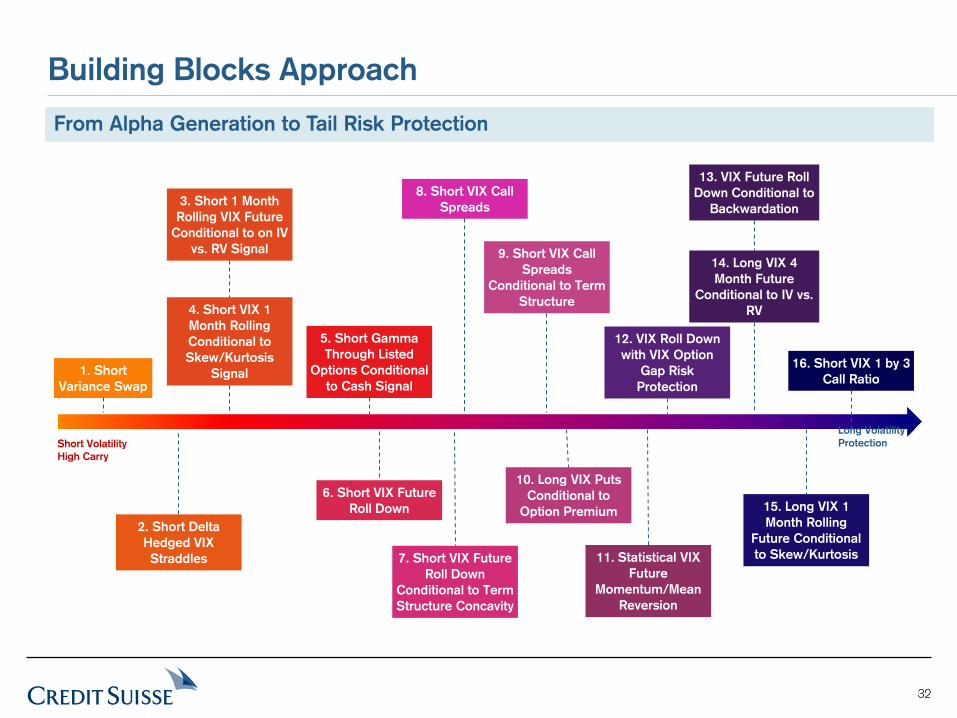
Building Blocks Approach
Short Volatility High Carry
Long Volatility Protection
1. Short Variance Swap
3. Short 1 Month Rolling VIX Future
Conditional to on IV vs. RV Signal
4. Short VIX 1 Month Rolling Conditional to Skew/Kurtosis
Signal
2. Short Delta Hedged VIX Straddles
5. Short Gamma Through Listed
Options Conditional to Cash Signal
6. Short VIX Future Roll Down
7. Short VIX Future Roll Down
Conditional to Term Structure Concavity
10. Long VIX Puts Conditional to
Option Premium
8. Short VIX Call Spreads
9. Short VIX Call Spreads
Conditional to Term Structure
11. Statistical VIX Future
Momentum/Mean Reversion
12. VIX Roll Down with VIX Option
Gap Risk Protection
14. Long VIX 4 Month Future
Conditional to IV vs. RV
13. VIX Future Roll Down Conditional to
Backwardation
15. Long VIX 1 Month Rolling
Future Conditional to Skew/Kurtosis
16. Short VIX 1 by 3 Call Ratio
From Alpha Generation to Tail Risk Protection
33
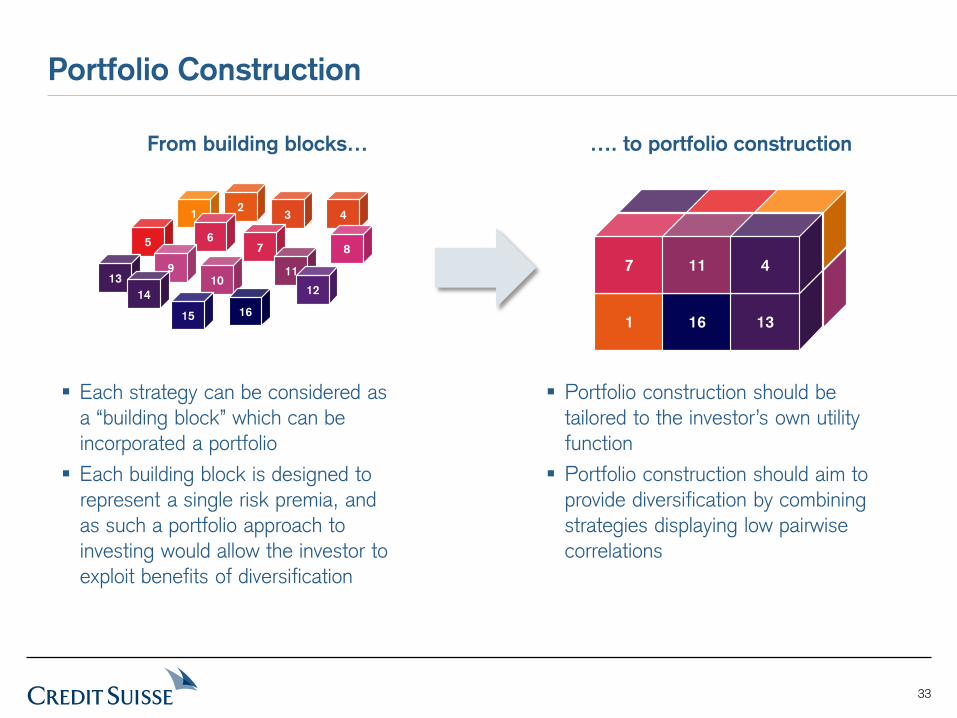
Portfolio Construction
Strategy 2
Strategy 2
1
7
Strategy 2
Strategy 2
16
11
Strategy 2
Strategy 2
13
4
1 3 2
4
From building blocks… …. to portfolio construction
Each strategy can be considered as a “building block” which can be incorporated a portfolio Each building block is designed to
represent a single risk premia, and as such a portfolio approach to investing would allow the investor to exploit benefits of diversification
Portfolio construction should be tailored to the investor’s own utility function Portfolio construction should aim to
provide diversification by combining strategies displaying low pairwise correlations
5 7 6
8
9 11 10
12 13
15
14 16
34
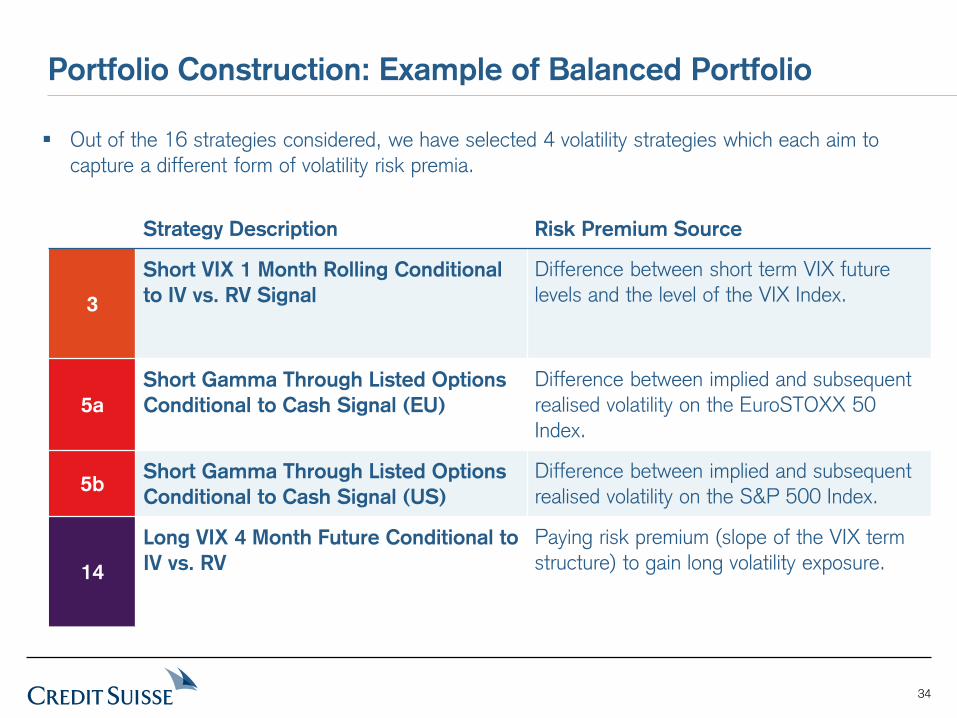
Strategy Description Risk Premium Source
3
Short VIX 1 Month Rolling Conditional to IV vs. RV Signal
Difference between short term VIX future levels and the level of the VIX Index.
5a Short Gamma Through Listed Options Conditional to Cash Signal (EU)
Difference between implied and subsequent realised volatility on the EuroSTOXX 50 Index.
5b Short Gamma Through Listed Options Conditional to Cash Signal (US)
Difference between implied and subsequent realised volatility on the S&P 500 Index.
14
Long VIX 4 Month Future Conditional to IV vs. RV
Paying risk premium (slope of the VIX term structure) to gain long volatility exposure.
Portfolio Construction: Example of Balanced Portfolio
Out of the 16 strategies considered, we have selected 4 volatility strategies which each aim to capture a different form of volatility risk premia.

35
3
Short VIX 1 Month Rolling Conditional to IV vs. RV Signal
5a Short Gamma Through Listed Options Conditional to Cash Signal (EU)
5b Short Gamma Through Listed Options Conditional to Cash Signal (US)
14
Long VIX 4 Month Future Conditional to IV vs. RV
Portfolio Construction: Fundamental Diversification
Select strategies which should fundamentally display low correlations
Short Volatility
Long Volatility
Forward Volatility Exposure
Spot Volatility Exposure
Upside Short
Gamma
Downside Short
Gamma
36
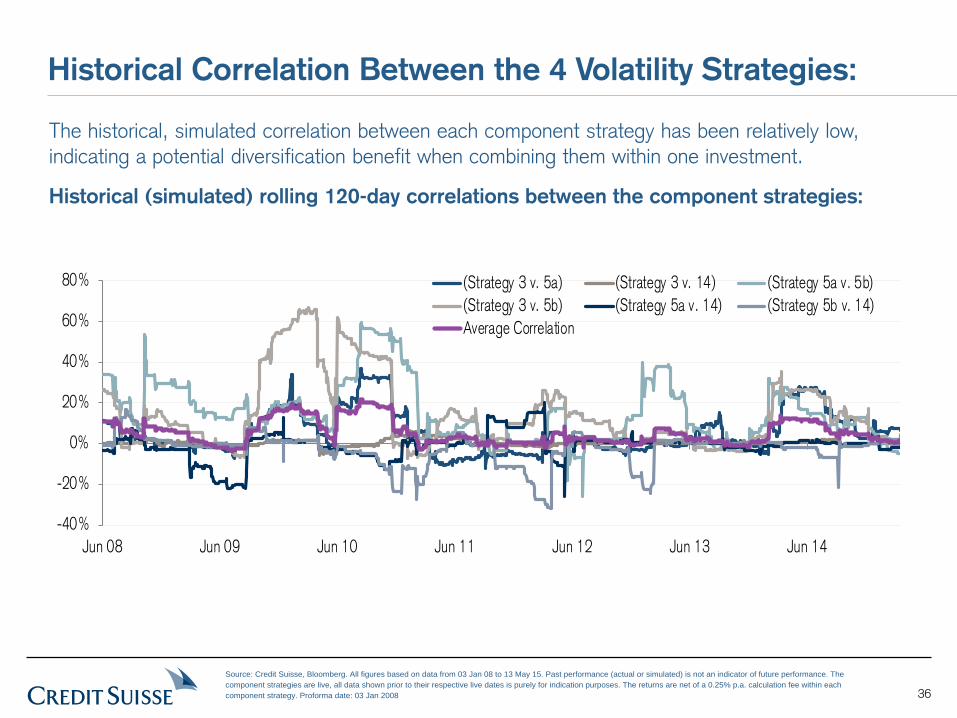
Historical Correlation Between the 4 Volatility Strategies:
The historical, simulated correlation between each component strategy has been relatively low, indicating a potential diversification benefit when combining them within one investment.
Historical (simulated) rolling 120-day correlations between the component strategies:
-40%
-20%
0%
20%
40%
60%
80%
Jun 08 Jun 09 Jun 10 Jun 11 Jun 12 Jun 13 Jun 14
(Strategy 3 v. 5a) (Strategy 3 v. 14) (Strategy 5a v. 5b)(Strategy 3 v. 5b) (Strategy 5a v. 14) (Strategy 5b v. 14)Average Correlation
Source: Credit Suisse, Bloomberg. All figures based on data from 03 Jan 08 to 13 May 15. Past performance (actual or simulated) is not an indicator of future performance. The component strategies are live, all data shown prior to their respective live dates is purely for indication purposes. The returns are net of a 0.25% p.a. calculation fee within each component strategy. Proforma date: 03 Jan 2008
37
0
20
40
60
80
100
120
140
160
180
200
Jan 08 Jan 09 Jan 10 Jan 11 Jan 12 Jan 13 Jan 14 Jan 15
Balanced Portfolio
Strategy is not yet live, all data shown is indicative
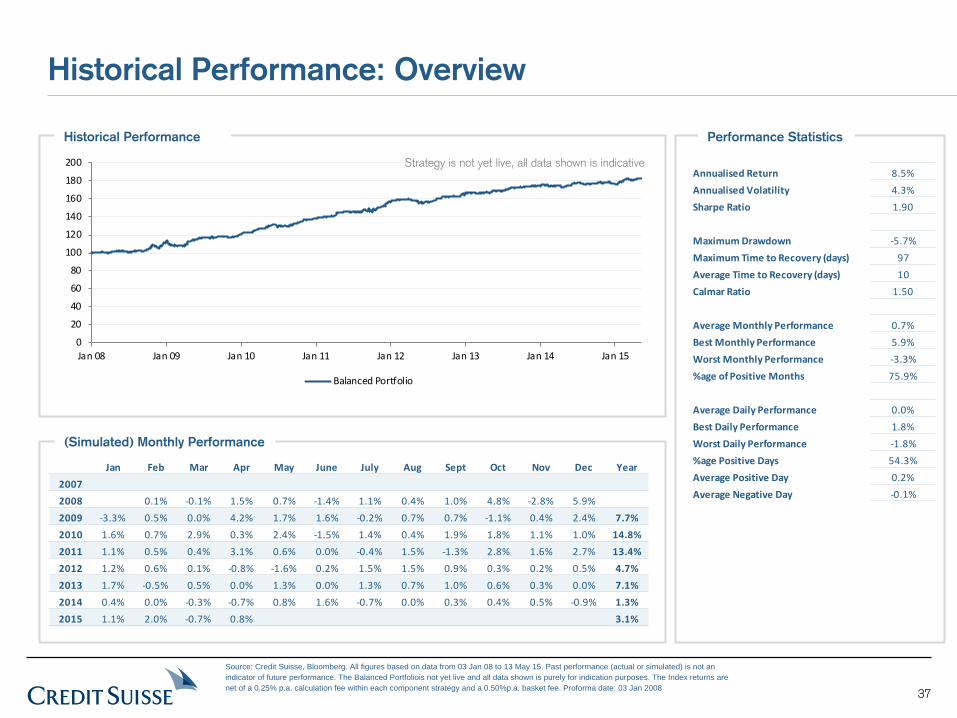
Historical Performance: Overview
(Simulated) Monthly Performance
Performance Statistics Historical Performance
Jan Feb Mar Apr May June July Aug Sept Oct Nov Dec Year20072008 0.1% -0.1% 1.5% 0.7% -1.4% 1.1% 0.4% 1.0% 4.8% -2.8% 5.9%2009 -3.3% 0.5% 0.0% 4.2% 1.7% 1.6% -0.2% 0.7% 0.7% -1.1% 0.4% 2.4% 7.7%2010 1.6% 0.7% 2.9% 0.3% 2.4% -1.5% 1.4% 0.4% 1.9% 1.8% 1.1% 1.0% 14.8%2011 1.1% 0.5% 0.4% 3.1% 0.6% 0.0% -0.4% 1.5% -1.3% 2.8% 1.6% 2.7% 13.4%2012 1.2% 0.6% 0.1% -0.8% -1.6% 0.2% 1.5% 1.5% 0.9% 0.3% 0.2% 0.5% 4.7%2013 1.7% -0.5% 0.5% 0.0% 1.3% 0.0% 1.3% 0.7% 1.0% 0.6% 0.3% 0.0% 7.1%2014 0.4% 0.0% -0.3% -0.7% 0.8% 1.6% -0.7% 0.0% 0.3% 0.4% 0.5% -0.9% 1.3%2015 1.1% 2.0% -0.7% 0.8% 3.1%
Annualised Return 8.5%Annualised Volatility 4.3%Sharpe Ratio 1.90
Maximum Drawdown -5.7%Maximum Time to Recovery (days) 97Average Time to Recovery (days) 10Calmar Ratio 1.50
Average Monthly Performance 0.7%Best Monthly Performance 5.9%Worst Monthly Performance -3.3%%age of Positive Months 75.9%
Average Daily Performance 0.0%Best Daily Performance 1.8%Worst Daily Performance -1.8%%age Positive Days 54.3%Average Positive Day 0.2%Average Negative Day -0.1%
Source: Credit Suisse, Bloomberg. All figures based on data from 03 Jan 08 to 13 May 15. Past performance (actual or simulated) is not an indicator of future performance. The Balanced Portfoliois not yet live and all data shown is purely for indication purposes. The Index returns are net of a 0.25% p.a. calculation fee within each component strategy and a 0.50%p.a. basket fee. Proforma date: 03 Jan 2008
38
Disclaimer (1/2)
IMPORTANT NOTICE – PLEASE READ
These materials do not constitute an offer or a solicitation of an offer to buy or sell investment products or securities, nor do they constitute a prospectus for any securities, nor do they otherwise constitute an agreement to provide investment services. These materials are provided for information purposes only and do not contain all of the information that is material to an investor. By reading these materials, you agree as follows:
These materials and any associated oral presentation or discussion (together the “materials”) are strictly confidential and have been provided to you by Credit Suisse Europe Limited (“CSSEL”) and/or its affiliates (together, “Credit Suisse”, “we” or “us”) and may not be used or relied upon unless expressly agreed in writing with us. These materials and the information contained herein are intended solely for your information and may not be disclosed or distributed to any other person, or otherwise replicated in any form without the prior written consent of Credit Suisse.
These materials are not for distribution to Retail Clients, as defined by the FCA Rules. Any investment or services to which these materials may relate will not be made available to Retail Clients.
CREDIT SUISSE IS ACTING SOLELY AS AN ARM’S LENGTH CONTRACTUAL COUNTERPARTY AND NOT AS A FINANCIAL ADVISER (OR IN ANY OTHER ADVISORY CAPACITY INCLUDING TAX, LEGAL, ACCOUNTING OR OTHERWISE) OR IN A FIDUCIARY CAPACITY. ANY INFORMATION PROVIDED DOES NOT CONSTITUTE ADVICE OR A RECOMMENDATION TO ENTER INTO OR CONCLUDE ANY TRANSACTION. BEFORE ENTERING INTO ANY TRANSACTION WITH US, YOU SHOULD ENSURE THAT YOU FULLY UNDERSTAND THE POTENTIAL RISKS AND REWARDS AND INDEPENDENTLY DETERMINE THAT IT IS APPROPRIATE FOR YOU GIVEN YOUR OBJECTIVES, EXPERIENCE, FINANCIAL AND OPERATIONAL RESOURCES, AND OTHER RELEVANT CIRCUMSTANCES. YOU SHOULD CONSULT WITH SUCH ADVISERS (INCLUDING, WITHOUT LIMITATION, TAX ADVISERS, LEGAL ADVISERS AND ACCOUNTANTS) AS YOU DEEM NECESSARY.
This material has been prepared by us based on assumptions and parameters determined by us in good faith. The assumptions and parameters used are not the only ones that might reasonably have been selected and therefore no guarantee is given as to the accuracy, completeness or reasonableness of any such quotations, disclosure or analyses. A variety of other or additional assumptions or parameters, or other market factors and other considerations, could result in different contemporaneous good faith analyses or assessment of the transaction described above.
Past performance should not be taken as an indication or guarantee of future performance, and no representation or warranty, express or implied, is made regarding future performance. We assume no responsibility for independent verification of such information and have relied on such information being complete and accurate in all material respects. Any commentary in these materials constitutes our preliminary judgment at, and is based solely on the information received by us before, the date hereof and is subject to change without notice.
We make no representation as to the completeness or accuracy of the information. We do not accept any liability for any direct, indirect or consequential loss or damage arising from reliance on this information.
The price and value of investments mentioned and any income that might accrue may fluctuate and may fall or rise. If an investment is denominated in a currency other than your base currency, changes in the rate of exchange may have an adverse effect on value, price or income.

39
Disclaimer (2/2) All projections, valuations and analyses are provided to assist you in the evaluation of the matters described herein and (i) may be based on subjective assessments and
assumptions, (ii) may use one among alternative methodologies that produce different results and (iii) to the extent they are based on historical information, should not be relied upon as an accurate prediction of future performance. Certain analysis is presented herein and is intended solely for purposes of indicating a range of outcomes that may result from changes in market parameters. It is not intended to suggest any outcome is more likely than another, and it does not include all possible outcomes or the range of possible outcomes, one of which may be that the investment value declines to zero. All projections and forecasts in these materials are therefore illustrative only.
Back-tested, hypothetical or simulated performance results have inherent limitations. Simulated results are achieved by the retroactive application of a back-tested model itself designed with the benefit of hindsight. The back-testing of performance differs from the actual account performance because the investment strategy may be adjusted at any time, for any reason and can continue to be changed until desired or better performance results are achieved. Alternative modeling techniques or assumptions might produce significantly different results and prove to be more appropriate. Past hypothetical back-test results are neither an indicator nor a guarantee of future returns. Actual results will vary from the analysis.
To the extent that the products are structured securities or other forms of structured products, such instruments are complex instruments, typically involving a high degree of risk and are intended for sale only to sophisticated investors who are capable of understanding and assuming the risks involved. The market value of any structured security or structured product may be affected by changes in economic, financial and political factors (including, but not limited to, spot and forward interest and exchange rates), time to maturity, market conditions and volatility and the credit quality of any issuer or reference issuer. Any investor interested in purchasing a structured product should conduct its own investigation and analysis of the product and consult with its own professional advisers as to the risks involved in making such a purchase.
These materials were designed for use by specific persons familiar with the business and the affairs of your company and we assume no obligation to update or otherwise revise these materials.
Credit Suisse or its employees may have a position or holding, or other material interest, or effect transactions in, any securities mentioned or options thereon, or other investments related thereto. We may provide (or have already provided) significant advice or investment services in relation to the investment concerned or a related investment to any company or issuer mentioned. Some investments referred to in this information will be offered by a single entity and, in the case of some investments, solely by us, or one of our affiliates. We have no obligation to use any information obtained from another source for the purposes of any the activities contemplated herein or to furnish such information to you or your affiliates.
Credit Suisse has adopted policies and guidelines designed to preserve the independence of its research analysts. Credit Suisse’s policies prohibit employees from directly or indirectly offering a favorable research rating or specific price target, or offering to change a research rating or price target, as consideration for or an inducement to obtain business or other compensation. Credit Suisse’s policies prohibit research analysts from being compensated for their involvement in investment banking transactions. This document does not constitute investment research or a research recommendation.
Credit Suisse Securities Europe Limited (“CSSEL”) which is authorised by the Prudential Regulation Authority and regulated by the Financial Conduct Authority and the Prudential Regulation Authority.
Additional information is available from us upon request. Copyright © 2015 Credit Suisse Group AG and/or its affiliates. All rights reserved.