Embed Size (px)
Citation preview

INSTITUTIONAL EQUITY RESEARCH
Page | 1 | PHILLIPCAPITAL INDIA RESEARCH
NBFC Sector Rising above challenges INDIA | NBFC
5 March 2015
Recovery in M&HCV and passenger vehicle augurs well for financiers; LCV remains a drag The Auto finance market witnessed moderation in line with downward trending industry volume in last couple of years. The slowdown in auto volumes can be attributed to factors like declining economic activity; low disposable income; high fuel prices etc. Medium & heavy commercial vehicle (M&HCV) & passenger vehicle (cars & utility vehicle) segment witnessed some rebound in growth driven by reversal of the said factors. However the LCV segment remains under stress. Nonetheless, the LCV market remains under penetrated at just 2.15 per M&HCV compared to global average of 6 per M&HCV. With the improvement in demand for M&HCV, the demand for LCV will follow but with a lag of 3‐4 quarters. Economic downturn in rural geography had been with a lag; revivals will also be delayed A sharp deceleration in economic activity over FY12‐14 had immediate bearing on urban regions but the rural economy continued to do well, helped by good monsoons, high MSPs and government welfare schemes. However last two years have not been good , as rural economy is facing slow down driven by moderate growth in MSPs; declining sowing acreage; lack of employment opportunity and stagnation in rural wage. We believe that NBFCs with larger dependency on rural economy to remain under pressure. Increased focus towards longer term assets; making balance sheet more stable All the four NBFCs viz CIFC, MMFS, SHTF, SCUF we have covered in the report have diversified portfolio spanning across Vehicle finance, LAP, SME, Gold. However one thing which is common among most of the NBFCs is their rising focus towards longer term assets. NBFC like Chola and SCUF have increased their portfolio share in LAP/ SME to 28%/ 53% from 24% each in FY11. An average Vehicle finance loan has tenure of 2 years, whereas SME loan or LAP goes upto 5 years. A longer term assets bring stability to balance sheet, as the repayment is spread over a longer time frame. Interest rates trending down; huge benefit on the cost front The large part of these NBFCs borrowing is comprised of bank loan followed by bonds. While around 75‐90% of the bank loans are linked to base rate across NBFCs, bonds issuances normally done at a spread of 50‐100bps over 10 year GSec. While GSec yields have come down by 100bps since the beginning of the year, bank base rate have been stable at 10‐10.25%. With interest rates trending down, NBFCs will get benefit in the range of 60‐90bps on their cost of funds over FY16/17. The emerging trends in NBFC business suggests a favorable operating environment which translate into improved return ratio. We maintain BUY on SHTF – a play on liability re‐pricing, revival of Used ‐ CV demand and easing pressure on asset quality. We Initiate coverage on CIFC & SCUF with Buy rating – given favorable interest rate environment; demand revival and improving efficiency. We also initiate coverage on MMFS with NEUTRAL rating, as demand in rural economy remains weak and recovery still far away.
Companies CHOLAMANDALAM INVESTMENT & FINANCE Reco BUY CMP, Rs 595 Target Price, Rs 750 Upside (%) 26 MAHINDRA & MAHINDRA FINANCE Reco NEUTRAL CMP, Rs 257 Target Price, Rs 220 Upside (%) ‐14 SHRIRAM TRANSPORT FINANCE Reco BUY CMP, Rs 1209 Target Price, Rs 1470 Upside (%) 22 SHRIRAM CITY UNION FINANCE Reco BUY CMP, Rs 2015 Target Price, Rs 2450 Upside (%) 22 Pradeep Agrawal (+ 9122 6667 9953) [email protected] Manish Agarwalla (+ 9122 6667 9962) [email protected]
Peer Valuation CMP Reco Target MCAP _______RoA (%)_______ _______RoE (%)_______ _______ABV (Rs)_______ _______P/ABV (x)_______(Rs) Price (Rs) Rs bn FY15E FY16E FY17E FY15E FY16E FY17E FY15E FY16E FY17E FY15E FY16E FY17E
CIFC 595 BUY 750 92 1.8 2.0 2.4 15.3 15.7 18.8 193.8 206.4 246.8 3.1 2.9 2.4MMFS 257 NEUTRAL 220 145 2.3 2.5 2.8 14.1 14.7 16.5 80.4 87.3 105.1 3.2 2.9 2.4STFC 1209 BUY 1470 274 2.2 2.3 2.6 14.0 15.6 17.8 394.6 452.7 523.8 3.1 2.7 2.3SCUF 2015 BUY 2450 133 3.3 3.6 3.6 16.5 16.3 17.7 605.3 674.1 760.7 3.3 3.0 2.6
Source: Company, PhillipCapital India Research

Page | 2 | PHILLIPCAPITAL INDIA RESEARCH
NBFC SECTOR
Table of Contents INDUSTRY ∙∙∙∙∙∙∙∙∙∙∙∙∙∙∙∙∙∙∙∙∙∙∙∙∙∙∙∙∙∙∙∙∙∙∙∙∙∙∙∙∙∙∙∙∙∙∙∙∙∙∙∙∙∙∙∙∙∙∙∙∙∙∙∙∙∙∙∙∙∙∙∙∙∙∙∙∙∙∙∙∙∙∙∙∙∙∙∙∙∙∙∙∙∙∙∙∙∙∙∙∙∙∙∙∙∙∙∙∙∙∙∙∙∙ 3
Companies Section Cholamandalam Investment & Finance ∙∙∙∙∙∙∙∙∙∙∙∙∙∙∙∙∙∙∙∙∙∙∙∙∙∙∙∙∙∙∙∙∙∙∙∙∙∙∙∙∙∙∙∙∙∙∙∙∙∙∙∙∙∙∙∙∙∙∙∙∙∙∙∙∙∙∙ 9
M&M Financial Services ∙∙∙∙∙∙∙∙∙∙∙∙∙∙∙∙∙∙∙∙∙∙∙∙∙∙∙∙∙∙∙∙∙∙∙∙∙∙∙∙∙∙∙∙∙∙∙∙∙∙∙∙∙∙∙∙∙∙∙∙∙∙∙∙∙∙∙∙∙∙∙∙∙∙∙∙∙∙∙∙∙∙∙∙∙∙∙∙∙∙ 20
Shriram Transport Finance ∙∙∙∙∙∙∙∙∙∙∙∙∙∙∙∙∙∙∙∙∙∙∙∙∙∙∙∙∙∙∙∙∙∙∙∙∙∙∙∙∙∙∙∙∙∙∙∙∙∙∙∙∙∙∙∙∙∙∙∙∙∙∙∙∙∙∙∙∙∙∙∙∙∙∙∙∙∙∙∙∙∙∙∙∙∙ 33
Shriram City Union Finance ∙∙∙∙∙∙∙∙∙∙∙∙∙∙∙∙∙∙∙∙∙∙∙∙∙∙∙∙∙∙∙∙∙∙∙∙∙∙∙∙∙∙∙∙∙∙∙∙∙∙∙∙∙∙∙∙∙∙∙∙∙∙∙∙∙∙∙∙∙∙∙∙∙∙∙∙∙∙∙∙∙∙∙∙∙ 44

Page | 3 | PHILLIPCAPITAL INDIA RESEARCH
NBFC SECTOR
Industry Firm recovery in M&HCV and passenger vehicle segment augurs well for the financing market; LCV remains a drag The Auto finance market witnessed moderation in line with downward trending industry volume in last couple of years. The slowdown in auto volumes can be attributed to factors like declining economic activity; low disposable income; high fuel prices etc. Medium & heavy commercial vehicle (M&HCV) & passenger vehicle (cars & utility vehicle) segment witnessed some rebound in growth driven by reversal of factors mentioned above but the LCV segment remains under stress. M&HCV sales grew by 13% in 9MFY15 after nine consecutive quarters of negative growth whereas passenger vehicle reported a 4% growth over same period. But LCV sales declined by 12.4% in 9MFY15. LCV which has started witness stress with a lag compared to M&HCV will take time to recover. The LCV market remains under penetrated at 2.15 per M&HCV compared to global average of 6 per M&HCV. With the improvement demand for M&HCV, the demand for LCV will follow but with a lag of 3‐4 quarters. Growth in M&HCV & LCV finance market (percent)
Source: PhillipCapital India Research
Growth in Passenger vehicle, tractor & used vehicle finance market (percent)
Source: PhillipCapital India Research
‐40‐30‐20‐100102030405060
2008
‐09
2009
‐10
2010
‐11
2011
‐12
2012
‐13
2013
‐14
2014
‐15e
2015
‐16e
2016
‐17e
M&HCV LCV
‐20
‐10
0
10
20
30
40
2008
‐09
2009
‐10
2010
‐11
2011
‐12
2012
‐13
2013
‐14
2014
‐15e
2015
‐16e
2016
‐17e
CAR & UV tractor Used Vehicle segment

Page | 4 | PHILLIPCAPITAL INDIA RESEARCH
NBFC SECTOR
Within the auto financing segment, M&HCV & passenger vehicle market are expected to witness strong CAGR of 23 % & 19% respectively over FY14‐17. However other segments like LCV & tractors is expected to grow at ‐1 % & 10% respectively over same period of time. Used CV segment to witness 16% growth over same period of time. Product wise auto financing market (Rs bn)
Source: PhillipCapital India Research Economic downturn in rural geography had been with a lag; revivals will also be delayed A sharp deceleration in economic activity over FY12‐14 had immediate bearing on urban regions but the rural economy continued to do well, helped by (1) good monsoons, (2) high MSPs and (3) government welfare schemes. The Central Government’s pro‐rural policies over FY07‐13 led to a sharp improvement in rural cash flows (1) The introduction of NREGS in FY07, and (2) ~15% CAGR in MSPs over FY07‐13 and (3) higher credit to the agriculture sector helped rural economy flourish. However last two years have not been good as MSPs increased by just 5%/1.3% in FY13/14 respectively and output was lower. According to the Second Advance Estimates, food grain production in FY15 is estimated at 257.07 mn tonnes, down 3.2% yoy. Food grain production is down due to poor monsoons in the Kharif season and low Rabi acreage. While the southwest monsoon was 12% deficient, total area coverage as on February 13, 2015 under Rabi crops declined to 61.6 mn hectares from 65.9 mn hectares in FY14. Lower agricultural production, falling yields and crop prices are impacting rural cash flows. Non‐agricultural demand pull has also been subdued as infrastructure and construction failed to pick up. Movement of MSP & Change in sowing acreage
Source: PhillipCapital India Research
146
372
175
329
48124 145 142
260
503 474
758
74
180236
436
80131 149
197214
392460
724
0
100
200
300
400
500
600
700
800
2008‐09 2011‐12 2013‐14 2016‐17e
MHCV LCV CAR Utility Vehicle Tractor Used Vehicle segment
0
10
20
30
40
50
1996
‐97
1997
‐98
1998
‐99
1999
‐00
2000
‐01
2001
‐02
2002
‐03
2003
‐04
2004
‐05
2005
‐06
2006
‐07
2007
‐08
2008
‐09
2009
‐10
2010
‐11
2011
‐12
2012
‐13
2013
‐14
2014
‐15
Kharif MSP yoy Rabi MSP yoy
‐8
‐6
‐4
‐2
0
2
4
6
8
10
2010‐11 2011‐12 2012‐13 2013‐14 2014‐15
Karif crop Rabi crop

Page | 5 | PHILLIPCAPITAL INDIA RESEARCH
NBFC SECTOR
Empirical data suggest that the rural economy facing slow down due to moderate growth in MSPs; declining sowing acreage; lack of employment opportunity due to slow down in construction activity in rural area and stagnation in rural wage. The passenger car sales volume data of Maruti Suzuki suggest a recovery in urban sales volume whereas rural volume reports moderation. Similarly, Indian market Research Bureau (IMRB) data suggest that rural consumption, which had propelled FMCG firms' growth in CY2013, slowed in CY2014. Household FMCG consumption volume (all categories) grew by 4% in CY2014 compared to ‐3% in CY2013. Similarly, rural volume growth declined 3% in CY2014, versus zero growth in CY2013. Household consumption trends were similar in value terms, too. For urban India, growth in 2014 stood at 6%, compared to 2% in CY2013. For rural India's the same number stood at 3% in CY2014 Vs 4% in CY2013. Geography wise passenger vehicle volume growth (Maruti)
Source: MSIL, PhillipCapital India Research
‐20
‐15
‐10
‐5
0
5
10
15
20
25
FY12 FY13 FY14 FY15YTD
Rural Sales Growth (%) Urban Sales Growth (%)

Page | 6 | PHILLIPCAPITAL INDIA RESEARCH
NBFC SECTOR
NBFC, play on interest rate cycle; lower interest rates to drive benefit on the cost front The large part of these four NBFCs borrowing is comprised of bank loan followed by bonds. While around 75‐90% of the bank loans are linked to base rate across NBFCs, bonds issuances are normally done at a spread of 50‐100bps over 10 year GSec. While GSec yields have come down by 100bps since the beginning of the year, bank base rate have been stable at 10‐10.25%. This has provided limited benefit on cost front, as more than 50% of borrowing is from banks. However as RBI has cut repo rate by 50bps in the last three months, we expect the banks to also bring down their base rate starting from Q1FY16 onwards. With interest rates trending down, NBFCs will get benefit in the range of 60‐90bps on their cost of funds spread over FY16/17. NBFC historically have shown strong correlation to interest rates as they tend to benefit significantly in term of lower cost, which leads to improvement in their Margins. In the last downward interest rate cycle of FY09‐FY11, these four NBFC saw more than 100bps decline in their cost of funds. Average 1 Year Fwd p/ABV also improved to 2.3x in March 2011 from 1.2% in March 2009. In the current downward cycle which started from Sept 2013, average valuations of these four NBFCs have increased from 2x to 2.9x. With further downtrend in interest rates the average valuation of these NBFC is expected to move up further. We expect the downward interest rate cycle to be more prolonged and will continue till FY17. Our Economist expect around 100bps further cut in interest rate in FY16/17. 1 Year Fwd P/ ABV Chart Vs Interest rate – Downward rate cycle drive valuation higher
Source: PhillipCapital India Research NBFC stock Price movement Vs Interest rate – strong correlation
Source: PhillipCapital India Research
0.0
2.0
4.0
6.0
8.0
10.0
12.0
14.0
4/26/2008 4/26/2009 4/26/2010 4/26/2011 4/26/2012 4/26/2013 4/26/2014
CIFC SHTF MMFS SCUF AA Corp Bond 3 Yr Repo rates
0
2
4
6
8
10
12
14
0
200
400
600
800
1000
1200
1400
1600
3/16/2006 3/16/2007 3/16/2008 3/16/2009 3/16/2010 3/16/2011 3/16/2012 3/16/2013 3/16/2014
CIFC SHTF MMFS SCUF Repo rate 3 yr AA Corp Bond yield

Page | 7 | PHILLIPCAPITAL INDIA RESEARCH
NBFC SECTOR
Increased focus towards longer term assets; making balance sheet more stable All the four NBFC CIFC, MMFS, SCUF, STFC, covered in the report have diversified portfolio spanning across Vehicle finance, LAP, SME, and Gold. However one thing which is common among most of the NBFCs is their increased focus on longer term assets. NBFC like Chola and SCUF have increased their portfolio share in LAP/ SME to 28%/ 53% from 24% each in FY11. An average Vehicle finance matures in of 2‐3 years, whereas SME loan or LAP goes upto 4‐5 years. A longer term assets bring stability to balance sheet, as the repayment is spread over a longer time frame. As a result CIFC and SCUF AUM has grown at a higher CAGR of 29‐36% over FY10‐14. We expect the share of longer maturity portfolio to increase further to 35%/60% for CIFC and SCUF respectively. As a result the AUM will also grow at higher pace than peers at 24‐26% CAGR over FY15‐17. AUM breakup % of portfolio SCUF CIFC MMFS SHTF HCV 8 4 63 LCV 19 9 29 Mini LCV‐3W & SCV 6 Cars & MUV 8 10 53 Used Vehicles 20 15 Tractors 7 19 5 Home Equity 28 Gold 17 1 MSME 53 1 Home Loans 1 2 Wheeler 18 Personal Loans 4 Total AUM (Rsmn) 161,770 247,363 365,023 570,713
Source: PhillipCapital India Research Rising share of longer duration products driving higher growth
___Higher maturity portfolio share___ __________AUM CAGR__________
FY11 9MFY15 FY17E FY10‐14 FY15‐17E
CIFC 24% 28% 35% 36% 26%MMFS NA NA NA 35% 11%STFC NA NA NA 16% 21%SCUF 24% 53% 60% 29% 24%
Source: PhillipCapital India Research

Page | 8 | PHILLIPCAPITAL INDIA RESEARCH
NBFC SECTOR
Compa
nies Sectio
n

INSTITUTIONAL EQUITY RESEARCH
Page | 9 | PHILLIPCAPITAL INDIA RESEARCH
Cholamandalam Investment & Finance (CIFC IN) Multiple levers to drive RoA to the next level INDIA | NBFCs | Initiating coverage
5 March 2015
Optimised product mix & economies of scale to boost profitability ratios. The company is in a sweet spot as the confluence of several levers will drive RoA to the next level. Factors such as a rising share of the LAP book, recovery in the CV cycle and a decline in opex ratio will boost RoA, by about 50 bps, to 2.4% over the next two years. With a recovery in the CV cycle, the credit cost in the vehicle‐finance segment will moderate to 1.5% by FY17 from 1.9% in 9MFY15. Investment in technology and economies of scale will drive a 30 bps cut in opex/asset ratio. Besides, as LAP share (higher RoA business) increases in the portfolio it will have a positive impact on aggregate RoA. These factors will drive RoA to 2.4% by FY17 from 1.8% in FY14. Under‐penetration, structural factors to drive medium to long‐term growth. The recovery of the CV cycle augurs well for CV financiers like Cholamandalam, which has almost 35% of its AUM in the new CV segment and 15‐20% in the used‐CV segment. M&HCV growth is on the uptrend and growth in the LCV segment is likely to pick up with a lag of 3‐4 quarters. The long‐term growth potential for the LCV segment is intact, given (1) the low penetration of LCVs, (2) emergence of a hub‐and‐spoke model for transport and (3) increased urbanisation. These factors will drive 17% CAGR in vehicle finance over FY14‐17E. Sticky LAP book offers stability to the balance sheet. CIFC home equity portfolio (LAP), is the company’s second‐largest product segment, after vehicle finance, accounting for 27% of assets under management. Disbursement CAGR over FY12‐14 was 20% but with longer‐tenure loans, LAP grew by a higher 38% CAGR. The home equity portfolio has lent stability to the balance sheet as it is a longer‐tenure product with average tenure of 4‐5 years against two years in the vehicle‐finance segment. Average ticket size is also higher, at Rs5 mn, against 0.4‐0.5 mn in the vehicle‐finance segment. We expect AUM under LAP to post 27% CAGR over FY14‐17. Strong risk management limits asset‐quality deterioration. Cholamandalam’s asset quality, with GNPA ratio of 2.8%, compares favourably with most of its peers. Companies like Mahindra Finance and Shriram Transport Finance, which operate mainly in the vehicle‐finance space, have a significantly higher GNPA ratio of 7.1% and 3.6% respectively. Strong understating of borrowers’ cash flow and robust credit appraisal systems underpin the company’s better asset quality. Although the downtrend in CV cycle contributed to a gradual rise in GNPA ratio over the past two years, the deterioration has been less than that of peers. With the start of the uptrend in the CV cycle, asset‐quality pressure will subside gradually. By FY17, we expect the GNPA ratio to ease to 2.3%. Valuation and recommendation Cholamandalam is expected to deliver strong earnings CAGR of 26% over FY14‐17, driving sharp improvement in RoAs and RoEs. RoA will improve by 50 bps to 2.4% and RoE to 18.8% by FY17. Improving operating matrix and profitability ratios, to result in further re‐rating in the stock. We value CIFC at 3x FY17ABV arriving at a price target of Rs750. We initiate coverage with a BUY rating.
BUY CMP RS 595 TARGET RS 750 (+26%) COMPANY DATA O/S SHARES (MN) : 144MARKET CAP (RSBN) : 86MARKET CAP (USDBN) : 1.452 ‐ WK HI/LO (RS) : 607 / 229LIQUIDITY 3M (USDMN) : 1.8PAR VALUE (RS) : 10 SHARE HOLDING PATTERN, % PROMOTERS : 57.7FII / NRI : 20.9FI / MF : 13.0NON PROMOTER CORP. HOLDINGS : 2.9PUBLIC & OTHERS : 5.6 PRICE PERFORMANCE, %
1MTH 3MTH 1YRABS 7.0 27.1 157.9REL TO BSE 5.2 24.2 119.4 PRICE VS. SENSEX
Source: Phillip Capital India Research KEY FINANCIALS Rs mn FY15E FY16E FY17ENet Income 17,577 20,425 24,510% growth 18 16 20Net Profit 4,145 5,258 7,313% growth 13.9 26.8 39.1EPS (Rs) 28.9 33.8 47.0PER (x) 20.7 17.7 12.8Book value (Rs) 218.9 229.9 270.8P/BV (Rs) 2.7 2.6 2.2Adj. book value (Rs) 193.8 206.4 246.8P/ABV (Rs) 3.1 2.9 2.4
Source: PhillipCapital India Research Est. Pradeep Agrawal (+ 9122 6667 9953) Manish Agarwalla (+ 9122 6667 9962)
050
100150200250300350
Apr‐11 Jul‐12 Oct‐13 Jan‐15CholamandalamBSE Sensex

Page | 10 | PHILLIPCAPITAL INDIA RESEARCH
CHOLAMANDALAM INVESTMENT AND FINANCE INITIATING COVERAGE
Optimised product mix, economies of scale to boost RoA Cholamandalam Investment and Finance (CIFC) kept its RoA stable, at 1.7‐1.9 over FY12‐14, despite a 100‐bp decline in RoA in the vehicle‐finance portfolio. The negative impact of Vehicle finance segment was offset by a 70‐bp increase in the LAP RoA and increase in LAP book proportion. We do not expect the LAP RoA to improve further, but continued increase in the LAP book proportion, due to the sticky nature of the loans, will contribute about 10‐bp improvement to aggregate RoA over the next 2‐3 years. Besides, a recovery in the CV cycle will ease credit costs in the vehicle‐finance segment to 1.5% by FY17 from 1.9% in 9MFY15, boosting aggregate RoA by 15 bps. Reduction in the opex ratio will also contribute to RoA expansion. CIFC reduced its opex ratio by 46 bps over FY12‐14 but it still is one of the highest among peers. The management guidance indicated it would reduce it to 2.5‐3% over 3‐5 years as the company has invested in technology and process improvements aimed at enhancing productivity and reducing operating costs. Besides, its home equity branches are located along with vehicle‐finance branches. This cuts operating expenses to a large extent. We expect the opex ratio to fall by 35 bps to 3.1% in FY17. The combined impact of above mentioned three factors will drive about 50 bps improvement in RoA, to 2.4%, by FY17. Higher RoA in LAP compensated for lower RoA in Vehicle finance ____Vehicle finance____ _____Home equity_____ ______Aggregate______As % of assets FY12 FY14 Chng, % FY12 FY14 Chng, % FY12 FY14 Chng, %NIM 7.7 7.1 ‐0.6 5.4 5.6 0.2 7.4 7.7 0.3Expense ratio 4.1 3.5 ‐0.6 2.0 1.6 ‐0.4 4.1 3.4 ‐0.7Provisions 0.5 1.6 1.1 0.3 0.2 ‐0.1 0.6 1.1 0.5RoA 3.1 2.1 ‐1.0 3.1 3.8 0.7 2.7 2.8 0.1AUM share 73.1 73.4 0.3 22.9 25.2 2.3
Source: Company, PhillipCapital India Research Dupont analysis of peers ________FY14 Dupont________ ________FY17 Dupont________ ____Change in FY17 over FY14____ Chola MMFS SCUF SHTF Chola MMFS SCUF SHTF Chola MMFS SCUF SHTFInterest Income 16.3 16.5 19.3 14.6 16.1 16.2 19.7 15.7 (0.2) (0.3) 0.4 1.2 Interest Expense 8.9 7.7 8.3 8.4 8.4 7.3 7.7 8.2 (0.5) (0.4) (0.6) (0.2)Net interest margins 7.3 8.8 11.0 6.2 7.7 8.9 12.0 7.5 0.4 0.1 1.0 1.3 Other income total 0.2 0.8 0.6 2.3 0.2 0.7 0.6 0.2 (0.0) (0.1) (0.0) (2.1)Net Income total 7.5 9.7 11.6 8.4 7.9 9.7 12.6 7.7 0.4 0.0 1.0 (0.7)Operating expenses total 3.3 3.2 4.4 2.1 3.1 3.4 5.0 1.7 (0.2) 0.2 0.5 (0.4)Preprovision profit 4.2 6.5 7.1 6.4 4.8 6.3 7.6 6.0 0.6 (0.2) 0.5 (0.4)Provisions 1.4 1.8 2.4 2.5 1.3 2.2 2.3 2.2 (0.1) 0.4 (0.1) (0.3)Profit before tax and exceptional items 2.8 4.7 4.8 3.9 3.5 4.1 5.4 3.8 0.7 (0.6) 0.6 (0.1)Profit before tax 2.8 4.1 4.8 3.9 3.5 3.5 5.4 3.8 0.7 (0.6) 0.6 (0.1)Tax total 0.9 1.6 1.6 1.2 1.2 1.4 1.8 1.3 0.2 (0.2) 0.2 0.1 Reported Profit after tax 1.8 3.1 3.2 2.7 2.3 2.8 3.6 2.6 0.5 (0.3) 0.4 (0.1)Adjusted Profit after tax 1.8 3.1 3.2 2.7 2.3 2.8 3.6 2.6 0.5 (0.3) 0.4 (0.1)RoAA 1.8 3.1 3.2 2.7 2.3 2.8 3.6 2.6 0.5 (0.3) 0.4 (0.1)Leverage 9.3 6.0 6.3 6.1 8.0 5.8 4.9 7.0 (1.3) (0.2) (1.4) 0.9 RoAE 17.1 18.6 20.2 16.3 18.3 16.1 17.7 17.8 1.2 (2.4) (2.6) 1.5
Source: Company, PhillipCapital India Research

Page | 11 | PHILLIPCAPITAL INDIA RESEARCH
CHOLAMANDALAM INVESTMENT AND FINANCE INITIATING COVERAGE
LCV a drag in near term; under‐penetration, structural factors to drive growth in medium to long term The M&HCV segment is showing signs of recovery following two years of a downtrend, but the LCV segment remains under stress. M&HCV sales grew by 8.6% in Q2FY15 after nine consecutive quarters of negative growth. However LCV sales declined by 9.4% in Q2FY15. We expects the decline in the LCV segment to continue until H1FY16, as the impact of a slowdown in the economy on LCV segment also took place with a lag of 4‐5 quarters. The LCV segment is CIFC’s largest product segment under vehicle finance, contributing 36% to its overall vehicle finance AUM. Consequently, it will weigh on overall growth in the vehicle‐finance portfolio. Nonetheless, other product segments like HCV, refinance and older vehicles, have begun to show good traction, offsetting loss of business in the LCV segment. AUM mix Vehicle‐finance portfolio mix
Source: Company, PhillipCapital India Research The LCV segment might continue to contract for a couple of quarters more but the long‐term growth potential is intact, given (1) low penetration, (2) emergence of a hub‐and‐spoke model for transport, and (3) increased urbanisation. The LCV penetration has doubled over past five years with M&HCV: LCV ratio reaching ~1:2 in FY14 from ~1:1 in FY09. However, it is significantly lower than the 1:6 in developed nations. These factors are expected to help the vehicle‐finance book to post 17% CAGR over FY14‐17. LCV penetration (Industry) MCV/LCV growth in the system
Source: Company, PhillipCapital India Research, SIAM
Vehicle Finance71%
Home Equity27%
Gold/ MSME/
Home Loans2%
HCV11%
LCV28%
Mini LCV9%
Cars/ MUV13%
Refinance15%
Older Vehicles14%
Tractors10%
0.0
0.5
1.0
1.5
2.0
2.5LCV to M&HCV ratio
32.9 31.9
8.0
‐23.1 ‐25.3
1.9
43.5
25.4 27.5
14.1
‐17.7‐14.2
‐30
‐20
‐10
0
10
20
30
40
50
FY10 FY11 FY12 FY13 FY14 YTDFY15
M&HCV LCV

Page | 12 | PHILLIPCAPITAL INDIA RESEARCH
CHOLAMANDALAM INVESTMENT AND FINANCE INITIATING COVERAGE
Home equity (LAP) portfolio gives stability to the balance sheet The CIFC home equity portfolio (LAP) is the company’s second largest product segment after vehicle finance, accounting for 27% of assets under management. The company added this product in FY07 and has since rapidly ramped it up. About 90% of this product portfolio comprises self‐occupied residential property, and the rest of the mix comprises rented, commercial and others. While the CAGR in disbursement over FY12‐14 was 20%, with longer tenure of loans, AUM under LAP grew by a higher 38% CAGR. The home‐equity portfolio has lent stability to company balance sheet as it is a longer tenure product with average tenure of 4‐5 years against the two‐year average maturity in the vehicle‐finance segment. The average ticket size is higher (Rs5 mn) against Rs0.4‐0.5 mn in the vehicle‐finance segment. We expect AUM under LAP to grow at a CAGR of 27% over FY14‐17. LAP is more stable portfolio with higher tenure and ticket size Vehicle Finance Home EquityAUM 174678 64864% of total portfolio 71% 27%Average ticket size (Rsmn) 0.5 5Tenure (Years) 2 4
Source: Company, PhillipCapital India Research Rising share of LAP in the portfolio Advance maturity profile‐ Increase in higher duration loans
Source: Company, PhillipCapital India Research
10
12
14
16
18
20
22
24
26
0
10000
20000
30000
40000
50000
60000
70000
FY09 FY10 FY11 FY12 FY13 FY14
LAP (Rsmn) as % of AUM (RHS)
‐
10
20
30
40
50
FY09 FY10 FY11 FY12 FY13 FY14
% of p
ortfolio
< 1 Year 1‐3 Years 3‐5 Years > 5 Years

Page | 13 | PHILLIPCAPITAL INDIA RESEARCH
CHOLAMANDALAM INVESTMENT AND FINANCE INITIATING COVERAGE
New product lines to drive sustainable, long‐term growth The company has been consistently adding new products to its portfolio to fill gaps in its product offerings. The company started operations as a vehicle financier in FY92 and added LAP in FY07 and gold loans in FY12. It added home loans, rural financing, MSME loans and construction equipment finance to its bouquet of products over FY13‐14. Though the combined AUM of new products added over the past 3‐4 years is less than 2%, we believe with the roll out of these products in more branches the share in the overall AUM will gradually pick up. While this will not only reduce the company’s risk from product concentration, but also act as a catalyst for growth in the medium to long term and help in optimisation of cost ratios. Product details Business Year of
commencement Products Share in
AUM (%)Average tenure (years)
Average yield (%)
LTV (%) Average ticket size
Borrower profile Area of operation
Vehicle finance FY92 New and used M&HCVs, LCVs, SCVs, cars,
MUVs, tractors
70 2 ~17 65‐90 LCVs: Rs0.4‐0.5
mn; M&HCVs:
Rs1.2‐1.3 mn
SME and agri‐based customers account for 65% of disbursements
Tier‐II, III towns
Home equity FY07 Self‐occupied residential property
28 4 ‐5 14‐15 50 Rs5 mn Largely self‐employed individuals
Tier‐I, II towns
Others FY13‐14 Gold and home loans, MSME, rural finance
2 2‐10 NA NA NA Self‐employed individuals, MSME
Tier‐I, II, III towns
Source: Company, PhillipCapital India Research Evenly spread branch network minimises region‐specific risks CIFC has 579 branches, spread across all the four regions, with a slightly higher concentration in South India. South India comprises about 33% of the branch network, followed by North and West India, with 24% each and East India, which has 20% of the branches. Over the past three years, the company has ramped up its branch presence in the eastern region from 56 to 115 branches. The AUM is also well spread across states with no single state contributing more than 12% of the AUM. Maharashtra, Rajasthan, Chhattisgarh, Andhra Pradesh and Madhya Pradesh are the top 5 business generating regions for the company. Evenly spread branch network across regions… ...largely in rural and semi‐urban areas (%)
Source: Company, PhillipCapital India Research
15% 17% 19% 20%
21% 24% 24% 24%
23%24% 24% 24%
40% 35% 33% 33%
375 518 574
0%
20%
40%
60%
80%
100%
FY12 FY13 FY14 Dec‐14
West North South Branches
579
10% 10% 10% 10%
19% 19% 19% 19%
71% 71% 71% 71%
0%
20%
40%
60%
80%
100%
FY12 FY13 FY14 Dec‐14
Urban Semi Urban Rural

Page | 14 | PHILLIPCAPITAL INDIA RESEARCH
CHOLAMANDALAM INVESTMENT AND FINANCE INITIATING COVERAGE
Branch productivity, advanced technology to lower costs Over the past couple of years the company has invested in technology and process improvement, which has helped the company to improve productivity and lower opex. Introduction of higher tenure products helped to improve business per branch/ employee. AUM per branch improved to Rs427 mn from Rs359 mn in FY12 and AUM/employee increased from Rs17 mn to Rs19 mn. We believe that as the company leverages its platform and technology across product categories, productivity ratios will improve. We expect cost ratio to decline from the current 3.5% to 3.1% by FY17. Improving productivity of Branches and Employees FY12 FY13 FY14 9MFY15 Branches 375.0 518.0 574.0 579.00 Employees 8,437 10,919 11,187 12,941 AUM (Rs mn) 145,047 201,779 232,534 247,363 AUM/branch 386.8 389.5 405.1 427.2 AUM/employee 17.2 18.5 20.8 19.1
Source: Company, PhillipCapital India Research Strong risk management limits asset‐quality deterioration CIFL’s asset quality, with GNPA ratio of 2.8%, compares favourably with most of its peers. Companies like Mahindra Finance and Shriram Transport Finance, which are predominantly in the vehicle‐finance space, operate at significantly higher delinquency ratios of 7.1% and 3.8% respectively. A strong understanding of borrowers’ cash flows, robust credit‐appraisal systems and less exposure to the M&HCV segment have made for better asset quality for the company. Though with a downtrend in the CV cycle the GNPA ratio increased to 2.8% in Q3FY15 from 0.9% in FY12. But the deterioration has been limited compared to peers. With an uptrend in the CV cycle, asset quality is likely to improve to 2.3% by FY17. GNPA better than most of the peers (%)
Source: Company, PhillipCapital India Research
7.1
3.63.0 2.8
2.4
0.0
1.0
2.0
3.0
4.0
5.0
6.0
7.0
8.0
MMFS STFS SCUF CHOLA SUNDF

Page | 15 | PHILLIPCAPITAL INDIA RESEARCH
CHOLAMANDALAM INVESTMENT AND FINANCE INITIATING COVERAGE
Borrowing skewed to bank loans; falling rates to reduce costs Almost 56% of the company’s borrowings are in the form of bank loans, followed by debentures (18%). Almost 97% of the bank borrowings are linked to the base rate, and hence any cut by the banks in the base rate will correspondingly cut costs of borrowings. We expect 100‐125 bps cut in the base rate by banks over FY16‐17, and hence expect a significant decline in companies’ borrowing costs over FY16‐17. 90%+ bank borrowing linked to base rate
_____Amount (Rsmn) _____ ________% Share________(Rs mn) FY14 FY13 FY14 FY13Base rate 41830 30883 45.9 44.5Base rate + average spread of 1% 46133 27450 50.6 39.6Fixed rate 3250 11000 3.6 15.9Total 91213 69333 100.0 100.0
Source: Company, PhillipCapital India Research On the debentures side, about 30% of the borrowings, raised at an average cost of 10.75 ‐11.25%, will mature in FY16‐17. The company borrowed at 9.75‐10.5% in H2FY15. With a cut in benchmark rates by the RBI, the cost will come down further. We expect further reduction in bond yields over FY16‐17, which is likely to drive reduction in bond raising costs. On the overall book, including bank borrowings, we expect 60‐90 bps reduction in borrowing costs over FY16‐17. Borrowing profile (%)‐ skewed towards banks Bonds maturity year wise (Rsbn)
Source: Company, PhillipCapital India Research
Banks56%
CP13%
Debentures18%
Tier II Capital13%
Banks CP Debentures Tier II Capital
16.1
10.0
6.0
3.3
5.4
3.0 3.5 3.6 3.82.9
0
2
4
6
8
10
12
14
16
18
FY15 FY16 FY17 FY18 FY19 FY20 FY21 FY22 FY23 FY24
Maturity
Page | 16 | PHILLIPCAPITAL INDIA RESEARCH
CHOLAMANDALAM INVESTMENT AND FINANCE INITIATING COVERAGE
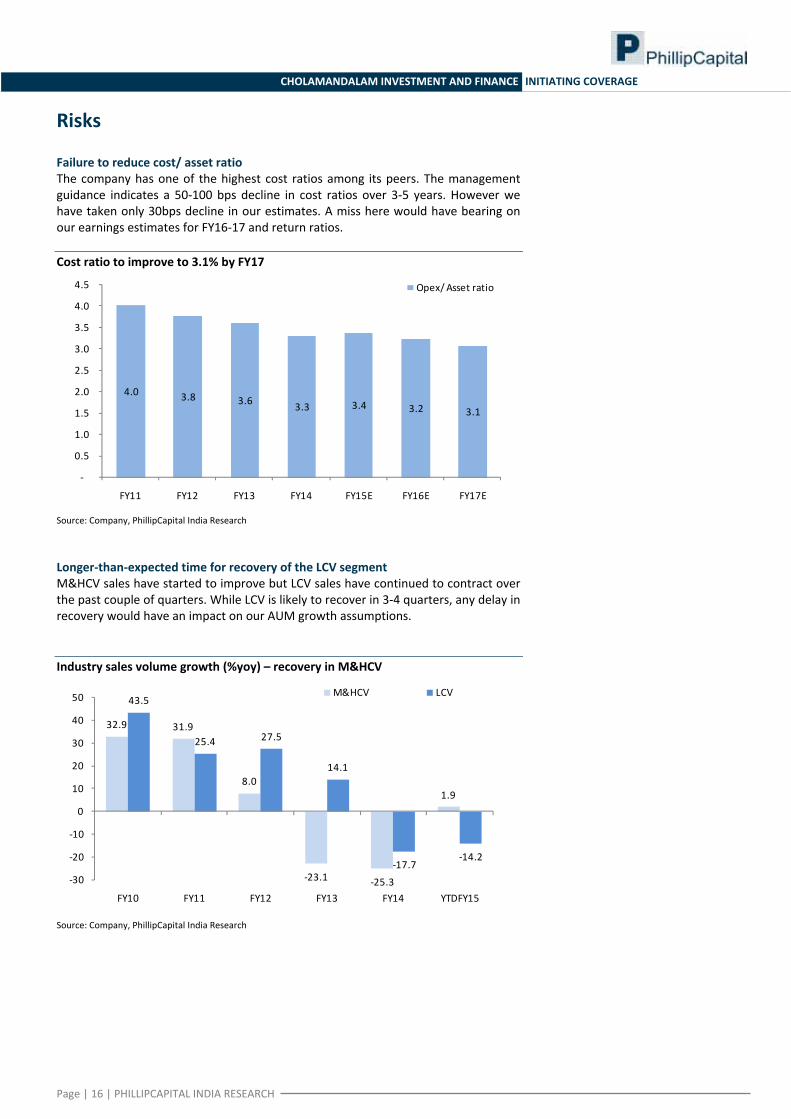
Risks Failure to reduce cost/ asset ratio The company has one of the highest cost ratios among its peers. The management guidance indicates a 50‐100 bps decline in cost ratios over 3‐5 years. However we have taken only 30bps decline in our estimates. A miss here would have bearing on our earnings estimates for FY16‐17 and return ratios. Cost ratio to improve to 3.1% by FY17
Source: Company, PhillipCapital India Research Longer‐than‐expected time for recovery of the LCV segment M&HCV sales have started to improve but LCV sales have continued to contract over the past couple of quarters. While LCV is likely to recover in 3‐4 quarters, any delay in recovery would have an impact on our AUM growth assumptions. Industry sales volume growth (%yoy) – recovery in M&HCV
Source: Company, PhillipCapital India Research
4.0 3.8 3.6 3.3 3.4 3.2 3.1
‐
0.5
1.0
1.5
2.0
2.5
3.0
3.5
4.0
4.5
FY11 FY12 FY13 FY14 FY15E FY16E FY17E
Opex/ Asset ratio
32.9 31.9
8.0
‐23.1 ‐25.3
1.9
43.5
25.4 27.5
14.1
‐17.7‐14.2
‐30
‐20
‐10
0
10
20
30
40
50
FY10 FY11 FY12 FY13 FY14 YTDFY15
M&HCV LCV

Page | 17 | PHILLIPCAPITAL INDIA RESEARCH
CHOLAMANDALAM INVESTMENT AND FINANCE INITIATING COVERAGE
Valuation Our investment thesis for Cholamandalam Finance is based on a sharp improvement in its profitability ratios, aided by levers like the CV‐cycle recovery, lower opex and low credit costs. A gradual pick‐up in growth, aided by recovery in the CV cycle and an increasing share of the higher duration LAP book in the portfolio will drive NII CAGR of 18% over FY14‐17. Moreover, reduction of opex ratio by 30 bps over FY15‐17E, (helped by increased adoption of technology) and decline in credit costs will enhance RoA. We expect the company to improve RoA to 2.4% from 1.8% and RoE to 18.8% on a sustainable basis. Improving operating matrix and profitability ratios, to drive further re‐rating in the stock. We value CIFC at 3x FY17ABV arriving at a price target of Rs750. We initiate coverage with a BUY rating. 1 year Fwd P/ ABV Band
Source: Company, PhillipCapital India Research
0
100
200
300
400
500
600
Apr‐09Jul‐09Oct‐09
Jan‐10Apr‐10Jul‐10Oct‐10
Jan‐11Apr‐11Jul‐11Oct‐11
Jan‐12Apr‐12Jul‐12Oct‐12
Jan‐13Apr‐13Jul‐13Oct‐13
Jan‐14Apr‐14Jul‐14Oct‐14
Jan‐15
0.5x
1.3x
2.0x
2.7x

Page | 18 | PHILLIPCAPITAL INDIA RESEARCH
Cholamandalam Investment and Finance Ltd INITIATING COVERAGE
Annexure: 1
Background Cholamandalam Investment and Finance Company (CIFC) was incorporated in 1978 as the financial services arm of the Murugappa Group. It commenced business as an equipment‐financing company and has emerged as a comprehensive financial services provider, offering vehicle finance, home loans, home equity loans and SME loans. Chola operates from over 579 branches in India with assets under management of Rs247 bn. Subsidiaries include Cholamandalam Securities (CSEC) and Cholamandalam Distribution Services (CDSL).
Management Mr. M.B.N. Rao, Chairman. He is a graduate in agriculture, an Associate of the Chartered Institute of Bankers, London, a Certified Associate of the Indian Institute of Bankers and a Fellow of the Indian Institute of Banking & Finance. He holds a diploma in computer studies from the University of Cambridge and the National Centre for Information Technology, United Kingdom. He used to be the chairman and managing director of Canara Bank and Indian Bank. Has over 40 years of varied experience in the fields of banking, finance, economics, technology, human resources, marketing, treasury and administration. Has over nine years of international banking experience in Singapore and Indonesia. He is a member of the Singapore Institute of Management, was chairman of Indian Banks Association and a member of various committees constituted by the RBI, MoF, SEBI and the National Institute of Bank Management. He is on the boards of various reputed companies including E.I.D. Parry (India), Ramco Cements and Taj GVK Hotels and Resorts. He joined the Board of CIFC in July 2010. Mr. Vellayan Subbiah, Managing Director. He is a Bachelor of Technology in civil engineering from IIT Madras and holds a Masters in Business Administration from the University of Michigan. He worked with McKinsey and Company, Chicago, 24/7 Customer Inc. and Sundaram Fasteners and was managing director of Laserwords, Chennai, between January 2007 and August 2010. He is a director on the boards of SRF and certain other Murugappa Group companies. He joined the Board of CIFC in August 2010. Key Shareholders
Numbers (mn) % of total Promoters 82.8 57.66 Tube Investments Of India Ltd. 72.2 50.3 Ambadi Investments Pvt Ltd. 7.2 5.03 Others 0.0 2.33Other key shareholders Norwest Venture Partners X Fii ‐ Mauritius 7.1 4.93 Creador I Llc 6.6 4.61 Amansa Holdings Private Limited 6.2 4.29 International Finance Corporation 5.9 4.12 Multiples Private Equity Fii I 4.8 3.33 HSBC Bank (Mauritius) Limited A/C Jwalamukhi Investment Holdings 3.1 2.17 Apax Viii Gp Co. Limited A/C Cornalina Acquisition(Fii) Limited 3.0 2.06 Aquarius Investments Ltd 2.7 1.85 Multiples Private Equity Fund 1.9 1.34Total 120.7 86.4
Source: Company, PhillipCapital India Research

Page | 19 | PHILLIPCAPITAL INDIA RESEARCH
CHOLAMANDALAM INVESTMENT AND FINANCE LTD INITIATING COVERAGE
Financials Profit and loss (Rs mn) Balance sheet (Rs mn)(Year Ending Mar 31) FY14 FY15E FY16E FY17E (Year Ending Mar 31) FY14 FY15E FY16E FY17E
Net interest income 14,587 17,202 19,988 24,001 Equity 1,433 1,433 1,555 1,555Other income 331 375 436 510 Reserves 21,515 29,921 34,211 40,560Net Income 14,918 17,577 20,425 24,510 Net worth 22,947 31,354 35,766 42,115Operating expenses 6,582 7,715 8,450 9,573 Borrowings 180,932 196,237 233,636 284,569Preprovision profit 8,335 9,862 11,975 14,938 Current liabilities & others 11,589 12,160 12,267 12,385Provisions 2,833 3,596 4,027 4,129 Total liabilities 215,468 239,751 281,669 339,070Profit before tax 5,502 6,266 7,947 10,808 Net block 729 758 822 936Tax 1,862 2,120 2,689 3,495 Investments 824 710 710 710Tax rate 33.8 33.8 33.8 32.3 Loans 194,281 218,650 260,503 317,790Adjusted Profit after tax 3,640 4,145 5,258 7,313 Current assets & others 19,634 19,634 19,634 19,634 Total assets 215,468 239,751 281,669 339,070
Dupont (as % of Assets) Key ratios(Year Ending Mar 31) FY14 FY15E FY16E FY17E (Year Ending Mar 31) FY14 FY15E FY16E FY17E
Interest Income 16.3 16.2 16.1 16.1 NIM (%) 7.3 7.6 7.7 7.7Interest Expense 8.9 8.7 8.5 8.3 NIM (%) ‐On AUM 6.9 7.1 7.1 6.7Net Interest Income 7.3 7.6 7.7 7.7 Cost/ Income (%) 44.1 43.9 41.4 39.1Other income total 0.2 0.2 0.2 0.2 Credit cost (%) 1.4 1.6 1.5 1.3Net Income total 7.5 7.7 7.8 7.9 RoA(%) 1.8 1.8 2.0 2.4Operating expenses total 3.3 3.4 3.2 3.1 RoE (%) 17.1 15.3 15.7 18.8Preprovision profit 4.2 4.3 4.6 4.8 Leverage (x) 9.3 8.4 7.8 8.0Provisions 1.4 1.6 1.5 1.3 Tier I (%) 10.9 12.9 12.6 11.8Profit before tax and exc. items 2.8 2.8 3.0 3.5 CAR (%) 17.2 20.9 19.0 17.9Profit before tax 2.8 2.8 3.0 3.5 No of shares (mn) 143.3 143.3 155.5 155.5Tax total 0.9 0.9 1.0 1.1 Gross NPA (%) 1.9 2.8 2.6 2.3 Profit after tax 1.8 1.8 2.0 2.4 Net NPA (%) 0.8 1.5 1.3 1.1 Provision coverage (%) 59.7 46.4 50.0 52.2
Growth (%) Valuation ratios(Year Ending Mar 31) FY14 FY15E FY16E FY17E (Year Ending Mar 31) FY14 FY15E FY16E FY17E
Net interest income 31.7 17.9 16.2 20.1 EPS (Rs) 25.4 28.9 33.8 47.0Net Income total 30.3 17.8 16.2 20.0 PER (x) 23.6 20.7 17.7 12.8Preprovision profit 44.9 18.3 21.4 24.7 Book value (Rs) 160.2 218.9 229.9 270.8Profit before tax 22.1 13.9 26.8 36.0 P/BV (Rs) 3.7 2.7 2.6 2.2Profit after tax 18.7 13.9 26.8 39.1 Adjusted book value (Rs) 148.9 193.8 206.4 246.8Loan 16.9 12.5 19.1 22.0 P/ABV (Rs) 4.0 3.1 2.9 2.4Disbursement 8.2 ‐5.0 19.0 22.0 P/ PPP 2.8 3.2 3.0 2.8AUM 22.4 9.1 23.4 28.4 Dividend yield (%) 0.6 0.6 0.6 0.6

INSTITUTIONAL EQUITY RESEARCH
Page | 20 | PHILLIPCAPITAL INDIA RESEARCH
M&M Financial Services (MMFS IN)
In the midst of a cyclical downturn INDIA | NBFCs | Initiating coverage
5 March 2015
MMFS is in midst of asset‐quality deterioration cycle: MMFS’ asset quality is a reflection of rural economic growth. As the economic slowdown percolates into rural India, MMFS’ asset quality has come under severe pressure. An analysis of historical trends suggests a business cycle for MMFS normally lasts eight years—the first four years being an up‐cycle followed by four years of a down‐cycle. From FY14 MMFS entered a down‐cycle with agricultural growth slowing. This impacted MMFS’ asset quality with the GNPA ratio rising from 3% in FY13 to 4.4% in FY14 and to 7.1% in M9FY15. The company is running into its second year of a down‐cycle and asset quality is likely to deteriorate further with GNPA ratio expected to increase to 8.4% in FY16, before moderating in FY17. AUM/branch close to optimum, limits growth prospects: MMFS’ AUM per branch increased from Rs166 mn in FY07 to a peak of Rs463 mn in Q3FY14, before moderating to Rs338 mn in Q2FY15. The moderation was largely driven by a steep increase of 54% in the branch network over the past four quarters. However, 90% of these branches are pure recovery centers and do not generate business. So, effectively AUM per “business‐generating branch” is Rs473 mn. MMFS’ branches can handle 2,800‐3,000 customers, and with an average ticket size of Rs200,000, each branch can manage AUM of Rs550‐600 mn. With 1.7 mn live customers, on average, each branch handles 2,500 customers, close to the maximum capacity of MMFS branches. With pressure on asset quality and lack of growth drivers, AUM is expected to grow moderately at 10% CAGR over FY14‐17 as compared to 31% CAGR over FY11‐14. Rural economy on the back foot; a poor monsoon can worsen the situation: With 80% of MMFS branches concentrated in rural areas, it’s’ fortunes are directly linked to the rural economy. A sharp deceleration in economic activity over FY12‐14 had immediate impact on urban regions, but the rural economy continued to do well, helped by (1) a good monsoon, (2) higher MSPs and (3) government welfare schemes. Moderate increase of just 5%/1.3% in MSP in FY13/14, coupled with lower farm production in FY15, is affecting rural cash flows. As the cash flows of MMFS customers are already stretched due to a slow rural economy, another year of poor rains can worsen an already poor asset‐quality situation. Banks gain ground in rural areas—is that a threat to MMFS? Banks have made significant inroads into rural areas over the past 3‐4 years as is evident from a sharp rise in the number of bank outlets. The outlets (branches plus business correspondents or BCs) in villages increased from 67,694 in FY10 to 383,804 in FY14, but only 12% were in the form of brick‐and‐mortar branches, with 88% being BCs and other modes. BCs are used mainly for liability‐based transactions (deposits and payments‐related) and play a limited role in credit growth. While the banks’ deposit‐account penetration has more than doubled, from 33 accounts per 100 rural adults in FY01 to 68 in FY13, credit penetration increased from 5.7% to just 8.9%. Valuation and recommendation: MMFS’ earnings will post a muted 7% CAGR over FY14‐17, as weak AUM growth, higher opex and steep provisioning will weigh on profitability. Asset quality to remain under pressure in FY16 as rural economy slows down further. At its current market price, the stock trades at 2.9x/2.4x FY16E/FY17E ABV with average RoA and RoE of 2.6%/15.4% over FY16/17. We initiate coverage with a NEUTRAL rating and price target of Rs220.
NEUTRAL CMP Rs257 TARGET Rs220 (‐14%) COMPANY DATA O/S SHARES (MN) 569MARKET CAP (Rs BN) 145MARKET CAP (US$ BN) 2.352 ‐ WK HI/LO (Rs) 345 / 230LIQUIDITY 3M (USDMN) 10.1PAR VALUE (Rs) 10 SHARE HOLDING PATTERN, % PROMOTERS 52.0FII/NRI 41.7FI/MF 1.7NON‐PROMOTER CORP. HOLDINGS 0.6PUBLIC & OTHERS 3.9 PRICE PERFORMANCE, %
1MTH 3MTH 1YRABS ‐1.8 ‐21.6 4.7REL TO BSE ‐3.5 ‐24.4 ‐33.9 PRICE VERSUS SENSEX
Source: Phillip Capital India Research KEY FINANCIALS Rs mn FY15E FY16E FY17ENet Income 29,976 33,337 37,228% growth 8 11 12Net Profit 7,518 8,715 10,934% growth ‐15.3 15.9 25.5EPS (Rs) 13.3 15.5 19.4PER (x) 19.2 16.6 13.2Book value (Rs) 99.4 110.4 125.0P/BV (Rs) 2.6 2.3 2.0Adj. book value (Rs) 80.4 87.3 105.1P/ABV (Rs) 3.2 2.9 2.4
Source: PhillipCapital India Research estimates Pradeep Agrawal (+ 9122 6667 9953) Manish Agarwalla (+ 9122 6667 9962)
0
50
100
150
200
250
Apr‐11 Apr‐12 Apr‐13 Apr‐14
Mah Finance BSE Sensex
Page | 21 | PHILLIPCAPITAL INDIA RESEARCH
MAHINDRA & MAHINDRA FINANCE INITIATING COVERAGE
Focus on recovery; growth takes back seat • The company is in its second year of the down‐cycle, and is likely to see another
year of pain before showing signs of recovery in asset quality • MMFS has opened more than 400 branches over the past five quarters, 90% of
which are pure recovery centres, putting pressure on cost ratios • With 1.7 mn live customers, on average, each business‐generating branch
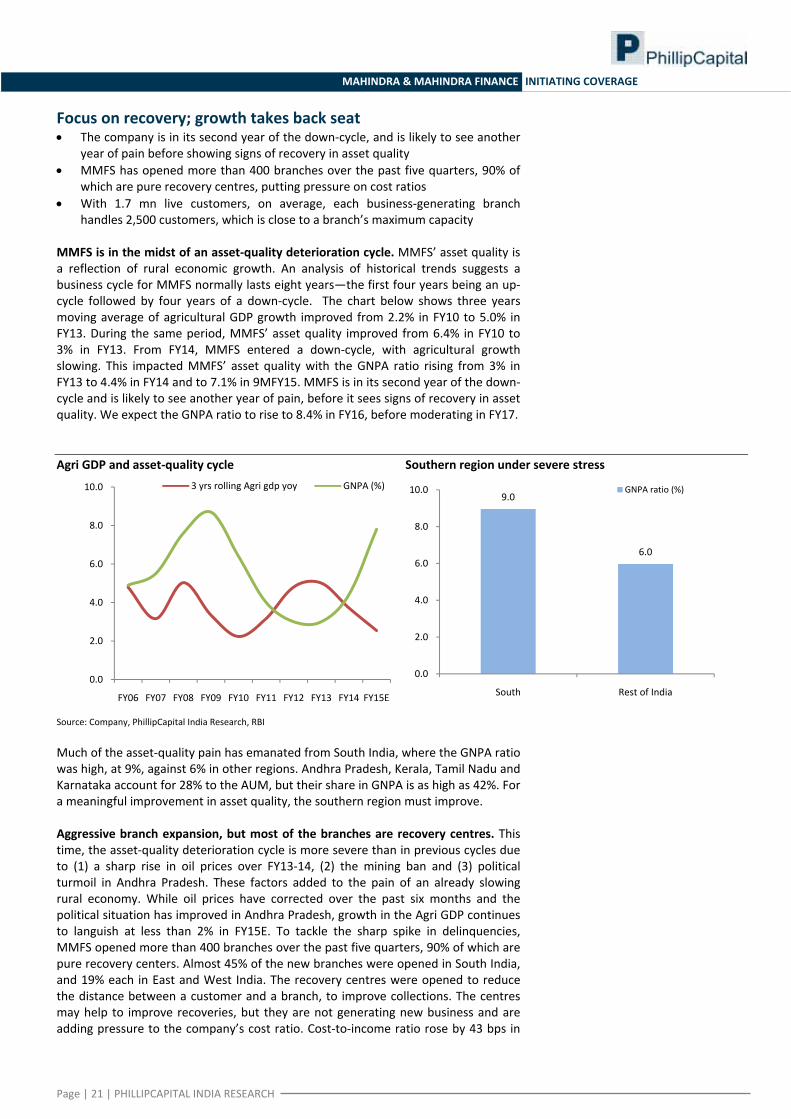
handles 2,500 customers, which is close to a branch’s maximum capacity MMFS is in the midst of an asset‐quality deterioration cycle. MMFS’ asset quality is a reflection of rural economic growth. An analysis of historical trends suggests a business cycle for MMFS normally lasts eight years—the first four years being an up‐cycle followed by four years of a down‐cycle. The chart below shows three years moving average of agricultural GDP growth improved from 2.2% in FY10 to 5.0% in FY13. During the same period, MMFS’ asset quality improved from 6.4% in FY10 to 3% in FY13. From FY14, MMFS entered a down‐cycle, with agricultural growth slowing. This impacted MMFS’ asset quality with the GNPA ratio rising from 3% in FY13 to 4.4% in FY14 and to 7.1% in 9MFY15. MMFS is in its second year of the down‐ cycle and is likely to see another year of pain, before it sees signs of recovery in asset quality. We expect the GNPA ratio to rise to 8.4% in FY16, before moderating in FY17. Agri GDP and asset‐quality cycle Southern region under severe stress
Source: Company, PhillipCapital India Research, RBI Much of the asset‐quality pain has emanated from South India, where the GNPA ratio was high, at 9%, against 6% in other regions. Andhra Pradesh, Kerala, Tamil Nadu and Karnataka account for 28% to the AUM, but their share in GNPA is as high as 42%. For a meaningful improvement in asset quality, the southern region must improve. Aggressive branch expansion, but most of the branches are recovery centres. This time, the asset‐quality deterioration cycle is more severe than in previous cycles due to (1) a sharp rise in oil prices over FY13‐14, (2) the mining ban and (3) political turmoil in Andhra Pradesh. These factors added to the pain of an already slowing rural economy. While oil prices have corrected over the past six months and the political situation has improved in Andhra Pradesh, growth in the Agri GDP continues to languish at less than 2% in FY15E. To tackle the sharp spike in delinquencies, MMFS opened more than 400 branches over the past five quarters, 90% of which are pure recovery centers. Almost 45% of the new branches were opened in South India, and 19% each in East and West India. The recovery centres were opened to reduce the distance between a customer and a branch, to improve collections. The centres may help to improve recoveries, but they are not generating new business and are adding pressure to the company’s cost ratio. Cost‐to‐income ratio rose by 43 bps in
0.0
2.0
4.0
6.0
8.0
10.0
FY06 FY07 FY08 FY09 FY10 FY11 FY12 FY13 FY14 FY15E
3 yrs rolling Agri gdp yoy GNPA (%)9.0
6.0
0.0
2.0
4.0
6.0
8.0
10.0
South Rest of India
GNPA ratio (%)

Page | 22 | PHILLIPCAPITAL INDIA RESEARCH
MAHINDRA & MAHINDRA FINANCE INITIATING COVERAGE
FY14 and by 123 bps in 9MFY15, to 34.3%. We expect the cost ratio to move up further to ~35% in FY17. Branch expansion over the years Highest incremental addition in FY14/15
Source: Company, PhillipCapital India Research Branches operating closer to full capacity, limiting growth prospects. MMFS’ AUM per branch increased from Rs166 mn in FY07 to a peak of Rs463 mn in Q3FY14, before moderating to Rs338 mn in Q2FY15. The moderation was driven largely by a steep increase of ~60% in the branch network over the past five quarters. More than 90% of these branches are pure recovery centres and do not generate business. So, effectively AUM per “business‐generating branch” is Rs473 mn. MMFS’ branches can handle 2,800‐3,000 customers. With a ticket size of Rs0.2 mn, it can manage an AUM of Rs550‐600 mn. With 1.7 mn live customers, on average, each branch handles 2,500 customers, which is close to the maximum capacity of an MMFS branch. Hence to attain meaningful AUM growth, the recovery branches need to be converted into fully operational branches. However, considering the economic environment and asset‐quality position, we do not expect this in the medium term. AUM and branches AUM per “business‐generating branch”
Source: Company, PhillipCapital India Research
55 59 59 56 59 74 79 107 13174 83 83 86 99 105 111148 162
108 113 113 120 128 136 147173
218
72 74 74 74 88 100 107
128
170
89 100 100 113156
172190
302
370
403 436 436 459547
607657
893
1088
0
200
400
600
800
1000
1200
South North Central West North East East
98
33
0
23
88
6050
236
195
‐25
25
75
125
175
225
275South North Central West North East East
67 78 83 101 143 20
6 279 34
1
365403 436
436
459 54
7 607 657 713
738
0
100
200
300
400
500
600
700
800
AUM (Rsbn) Business generating branches
166 178 191220
262
340
425479 495
0
100
200
300
400
500
600 AUM/ branch (Rsmn)

Page | 23 | PHILLIPCAPITAL INDIA RESEARCH
MAHINDRA & MAHINDRA FINANCE INITIATING COVERAGE
High repayment ratio to keep AUM growth sub‐optimal in FY16. As the average tenure of loans is a little over two years, slowing disbursement growth in FY13/14, which worsened with a decline of 8% in M9FY15, will result in higher repayment rates in FY16/17. While disbursement CAGR was 32% over FY10‐14, repayments CAGR was a relatively lower 24%, resulting in a decline in repayment rates from 68% in FY10 to 50% in FY14. Historically, repayment rates have been in the range of 50‐85%, with the bottom last seen in FY06. Amid rising NPA concerns and a slowdown in rural India, we expect disbursements to decline by 5% in FY15 before showing moderate growth of 10% in FY16. Consequently, repayment rates will increase to 52% in FY16 from ~47% in FY15. As a result of moderate disbursement growth and rising repayment rates, AUM growth will fall to 7% in FY16E from 22.3% growth in FY14. In the last cycle GNPA peaked out with disbursement‐to‐repayment ratio at 1.1; in FY14 it was at a high 1.5x
Source: Company, PhillipCapital India Research
Diversified across vehicle segments – AUM
Source: Company, PhillipCapital India Research
0
2
4
6
8
10
0
20000
40000
60000
80000
100000
120000
140000
160000
180000
200000
FY03 FY04 FY05 FY06 FY07 FY08 FY09 FY10 FY11 FY12 FY13 FY14 FY15E FY16E
Disbursement (Rsmn) Repayments(Rsmn)
GNPA ratio peaked out at disbursement to repayment ratio
of 1.1x
Disbursement to Repayment ratio stood at a high 1.5x
43% 38% 38% 33% 31% 30% 28% 29% 30%
26%23% 24% 30% 31% 31%
24% 24% 23%
19%25% 25% 23% 23% 20%
19% 19% 19%
9% 7% 7% 8% 9% 12%17% 15% 13%
3% 7% 6% 6% 6% 7% 12% 13% 15%
0%
20%
40%
60%
80%
100%
FY07 FY08 FY09 FY10 FY11 FY12 FY13 FY14 FY15
Auto/ Utility vehicles Cars Tractors Commercial Vehicles Refinance & Others

Page | 24 | PHILLIPCAPITAL INDIA RESEARCH
MAHINDRA & MAHINDRA FINANCE INITIATING COVERAGE
Rural economy falters; poor monsoons can worsen things • MMFS’ performance is directly linked to the fortunes of rural India, as 80% of its
branches are in rural areas • Despite poor economic conditions over FY12‐14, rural India did not see a
slowdown due to (1) good monsoons, (2) high MSPs and (3) government welfare schemes, which helped to keep the rural cash‐flow buoyant
• A fall in agricultural production, lower yields and weakening crop prices in FY15 have started to impact rural cash flows, which is also evident from MMFS’ deteriorating asset quality
A proxy play on the rural economy, MMFS benefits from pro‐rural policies. With 80% of its branches in rural areas, MMFS’ fortune is directly linked to the rural economy. A sharp deceleration in economic activity over FY12‐14 had immediate bearing on urban regions but the rural economy continued to do well, helped by (1) good monsoons, (2) high MSPs and (3) government welfare schemes. The Central Government’s pro‐rural policies over FY07‐13 led to a sharp improvement in rural cash flows, which had a significant positive impact on MMFS’ balance‐sheet growth and asset quality. (1) The introduction of NREGS in FY07, and (2) ~15% CAGR in MSPs over FY07‐13 and (3) higher credit to the agriculture sector helped MMFS directly and indirectly. MMFS did not benefit directly from NREGS, but the scheme improved rural cash flows, from which MMFS benefited. Higher MSPs and a sharp growth in agricultural credit improved the credit profile of customers, which had a direct bearing on vehicle sales and asset quality.
Decline in production/moderating MSPs impact rural cash flow. FY11‐13 were among the best years for the rural economy as the average minimum selling price for all crops posted 16% CAGR against 8% CAGR over past 20 years. Besides, food grain production increased by a healthy 12.2% yoy/6% yoy in FY11/12 respectively, which led to higher cash flow in rural areas. However last two years have not been as good as MSPs increased by just 5%/1.3% in FY13/14 respectively and output was lower. According to the Second Advance Estimates, food grain production in FY15 is estimated at 257.07 mn tonnes, down 3.2% yoy. Food grain production is down due to poor monsoons in the Kharif season and low Rabi acreage. While the southwest monsoon was 12% deficient, total area coverage as on February 13, 2015 under Rabi crops declined to 61.6 mn hectares from 65.7 mn hectares in FY14. Lower agricultural production, falling yields and crop prices are impacting rural cash flows. Non‐agricultural demand pull has also been subdued as infrastructure and construction failed to pick up.
A lot depends on 2015 monsoon: The monsoons are expected to be close to normal in 2015, according to initial forecasts, but meteorologists say it is too early for accurate monsoon predictions. As the cash flow of MMFS customers are stretched due to a slow rural economy, another year of poor rains can have a spiralling effect on MMFS’ already poor asset quality.

Page | 25 | PHILLIPCAPITAL INDIA RESEARCH
MAHINDRA & MAHINDRA FINANCE INITIATING COVERAGE
Banks gain ground in rural areas—is this threat to MMFS? • Banking outlets (branches and bank correspondents) in villages increased from
67,694 in FY10 to 383,804 in FY14, with only 12% being branches • While the banks’ deposit‐account penetration increased significantly from 33
accounts per 100 rural adults in FY01 to 68 accounts in FY13, credit penetration increased from 5.7% to just 8.9%
• In the past three years (FY12‐14) banks opened 27,000 branches across India, 41% of which were in tier‐5 and ‐6 centres.
Bank penetration has increased significantly over the past five years. Banks made significant inroads into rural areas over the past 3‐4 years as is evident from a sharp rise in the number of banking outlets. The banking outlets in villages increased from 67,694 in FY10 to 383,804 in FY14, but only 12% were brick‐and‐mortar branches and 88% were banking correspondents. Business correspondents are used mainly for liability‐based transactions (deposits and payment‐related) and play a limited role in credit growth. Besides, as most borrowers in rural areas do not have a credit profile, banks’ credit penetration in rural areas is low.
Rise in banking outlets in the last four years Banking correspondents form 88 % of the outlets
Source: RBI Deposit penetration up sharply but credit penetration is low in rural areas. While banks’ deposit‐account penetration increased significantly from 33 accounts per 100 rural adults in FY01 to 68 accounts in FY13, credit penetration increased from 5.7% to just 8.9%. This was mainly due to (1) lack of credit worthiness of rural borrowers due to irregular cash flows, (2) a long time taken by banks to sanction loans and (3) large distances between branches and customers. Deposit penetration increases sharply, credit penetration increase marginal Penetration (%) FY01 FY10 FY11 FY12 FY13
Deposit accounts/100 people All INDIA >19 yrs 76.2 105.5 113.6 123.6 139.7Rural > 19 yrs 33.4 48.5 52.9 58.4 67.6Urban > 19yrs 176.9 217.9 233.2 252.2 281.9Credit accounts/100 people All India > 19yrs 9.3 17.0 16.9 17.9 17.1Rural > 19 yrs 5.7 7.8 8.3 8.5 8.9Urban > 19yrs 17.9 35.2 34.0 36.5 33.5
Source: RBI
0
20,000
40,000
60,000
80,000
100,000
120,000
140,000
160,000
10‐Mar 11‐Mar 12‐Mar 13‐Mar
Banking Outlets in Villages >2,000 popolation
Banking Outlets in Villages <2,000 population
33,378 34,811 37,471 40,837 46,126 48,12634,17480,802
141136221341
328,678387,626
142595
3,146
6,276
9,000
11,000
0
100,000
200,000
300,000
400,000
500,000
10‐Mar 11‐Mar 12‐Mar 13‐Mar FY14 H1FY14
Banking Outlets in Villages ‐Branches Banking Outlets in Villages ‐BCs Banking Outlets in Villages ‐Other Modes
Page | 26 | PHILLIPCAPITAL INDIA RESEARCH
MAHINDRA & MAHINDRA FINANCE INITIATING COVERAGE
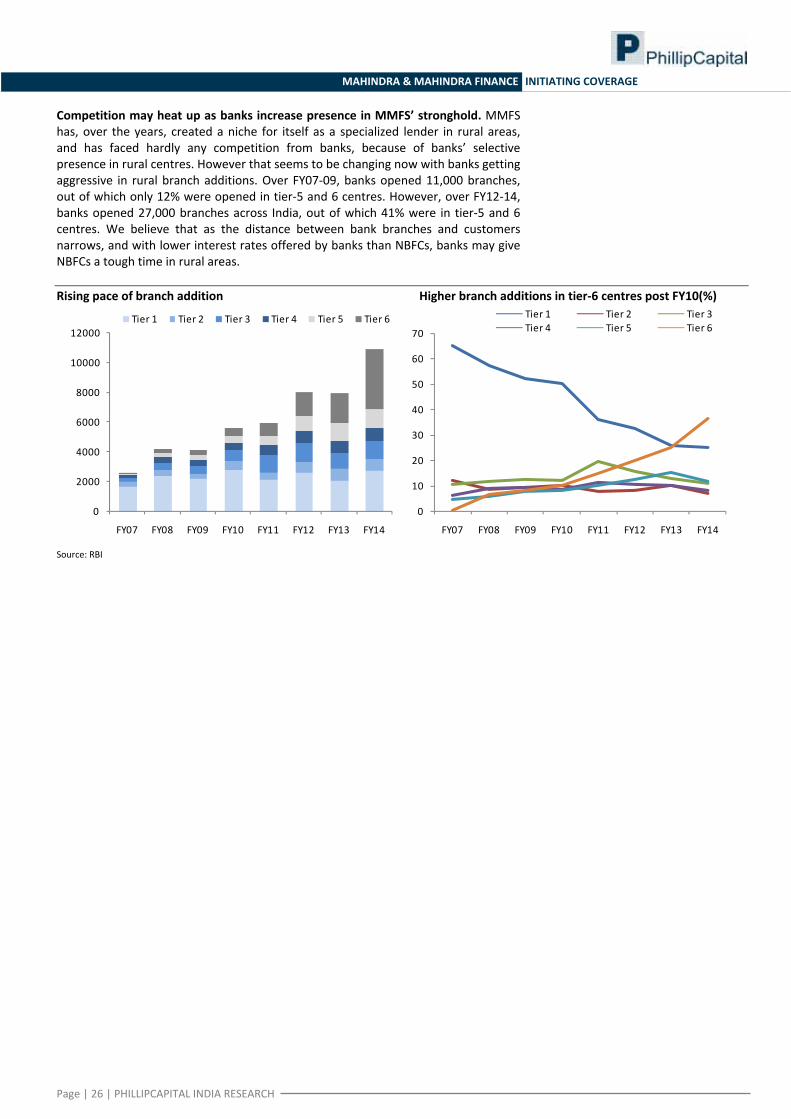
Competition may heat up as banks increase presence in MMFS’ stronghold. MMFS has, over the years, created a niche for itself as a specialized lender in rural areas, and has faced hardly any competition from banks, because of banks’ selective presence in rural centres. However that seems to be changing now with banks getting aggressive in rural branch additions. Over FY07‐09, banks opened 11,000 branches, out of which only 12% were opened in tier‐5 and 6 centres. However, over FY12‐14, banks opened 27,000 branches across India, out of which 41% were in tier‐5 and 6 centres. We believe that as the distance between bank branches and customers narrows, and with lower interest rates offered by banks than NBFCs, banks may give NBFCs a tough time in rural areas. Rising pace of branch addition Higher branch additions in tier‐6 centres post FY10(%)
Source: RBI
0
2000
4000
6000
8000
10000
12000
FY07 FY08 FY09 FY10 FY11 FY12 FY13 FY14
Tier 1 Tier 2 Tier 3 Tier 4 Tier 5 Tier 6
0
10
20
30
40
50
60
70
FY07 FY08 FY09 FY10 FY11 FY12 FY13 FY14
Tier 1 Tier 2 Tier 3Tier 4 Tier 5 Tier 6

Page | 27 | PHILLIPCAPITAL INDIA RESEARCH
MAHINDRA & MAHINDRA FINANCE INITIATING COVERAGE
Favourable interest rate climate to lead to lower costs • MMFS’ borrowing profile is largely dominated by bank borrowing, which
constitutes 49% of the book, followed by bonds (19%) and fixed deposits (16%), commercial paper (9%) and securitisation (7%)
• Around 83% of the borrowings will benefit from lower bond yields and base rates in FY16/17. A 1% change in borrowing cost in FY16/17 will drive 50‐60 bps reduction in overall cost of borrowings over FY16‐17
• With a favourable spread of 125‐200 bps in bonds over bank loans, the company is incrementally going for bond issuance. We expect the bond proportion in total borrowing to increase to 25‐30% in FY16.
Banks dominate the borrowing profile. MMFS’ borrowing profile is largely dominated by banks, which constitute 49% of the book, followed by bonds (19%) and fixed deposits (16%), commercial paper (9%) and securitisation (7%). Prior to FY09, bonds used to contribute almost 60% to the total borrowing, with bank loans being the second largest source of borrowing, at 26%. However due to adverse international developments and some domestic factors, liquidity conditions tightened significantly between mid‐September and October 2008, resulting in pressure on money markets, which in turn resulted in huge redemptions for mutual funds. As mutual funds were the leading source of borrowings for the company (contributing 41% to the total borrowing), the company had to shift to banks and insurance companies. As a result, the share of bonds in total borrowing declined from 60% in FY08 to 19% in FY11. As the interest rate environment remained tight until FY14, bond borrowing has been 20‐25% since FY11. Sources of borrowing – instrument wise Sources of borrowing – lender wise
Source: Company, PhillipCapital India Research Bank borrowing dominates the borrowing profile with wt. avg cost of ~10%
___________FY13___________ ___________FY14___________
Proportion in
total borrowings Weighted
average costProportion in
total borrowingsWeighted
average costBonds 28.9 9.9 24.4 9.8Banks 58.2 9.8 60.3 10.2Fixed Deposit 12.3 9.7 15.1 9.7Commercial paper/ ICD 0.5 9.2 0.2 9.5Total 100.0 9.8 100.0 10.0
Source: Company, PhillipCapital India Research
0%
20%
40%
60%
80%
100%
FY07 FY08 FY09 FY10 FY11 FY12 FY13 FY14
Bonds Bank Term Loans SecuritisationFixed Deposit Commercial Paper
0%
20%
40%
60%
80%
100%
FY07 FY08 FY09 FY10 FY11 FY12 FY13 FY14
Insurance Cos Mutual Fund Banks Others

Page | 28 | PHILLIPCAPITAL INDIA RESEARCH
MAHINDRA & MAHINDRA FINANCE INITIATING COVERAGE
Falling bond yields to boost bond borrowings; cut cost by 60‐70 bps over FY16‐17. While bond yields have eased considerably from a high of 9% in January 2014 to 7.8% now, banks’ base rates remain stable at 10‐10.25%. This has created a favourable spread of ~200 bps in bonds over bank loans. In FY13/14 MMFS’ bank borrowing and bond borrowing cost was almost at par at 9.8‐10.2%. Benefiting from falling bond yields, MMFS has, over the past few months, been borrowing mainly through the bond market. The company issued bonds at 8.5‐9% yield in November. We expect the bond proportion in total borrowing to increase to 25‐30% in FY16 and bank borrowing to fall by equal proportion. Around 30% of the total borrowings (with blended cost at 10.1%) will mature in FY15, out of which 26% comprises bond borrowings, 61%, bank borrowings and 12%, FD and commercial paper. Assuming MMFS replaces 50% of the total maturing borrowings in FY15 by bonds (at an average yield on 9.1%) it will drive 7‐8 bps improvement in cost in FY15. The larger benefit of the repricing will come in FY16/17 when 56% of the borrowings will mature. Besides, 27% of the total borrowings have a reset clause with the bank. So, in total, around 83% of the borrowings will benefit from lower bond yields and base rate in FY16/17. We expect a 60‐70 bps reduction in overall cost of borrowings over FY16‐17. 80%+ borrowings will get reprice at lower rates in FY16/17
Proportion of total borrowings
(%) Maturity profile of borrowings (On book)
Wt Avg Cost(%)
Total Borrowing (Rsbn)
Bank borrowing
Non Bank borrowing
Maturity beyond 5 years 10.00 7 0.0 3.0Maturing between 3 years to 5 years 10.25 28 9.0 2.5Maturing between 1 year to 3 years 9.94 134 33.2 22.9Maturing within 1 year 10.13 70 18.1 11.3Grand Total 10.02 239 60.3 39.7
Source: Company, PhillipCapital India Research
Falling interest rate to drive improvement in cost of funds
Source: Company, PhillipCapital India Research
0.0
2.0
4.0
6.0
8.0
10.0
12.0
14.0
Mar‐05 Mar‐07 Mar‐09 Mar‐11 Mar‐13 Mar‐15
10 Yr Gsec Yield (%) 3 Year AA Corp Bond yield Repo rate (%)
Page | 29 | PHILLIPCAPITAL INDIA RESEARCH
MAHINDRA & MAHINDRA FINANCE INITIATING COVERAGE
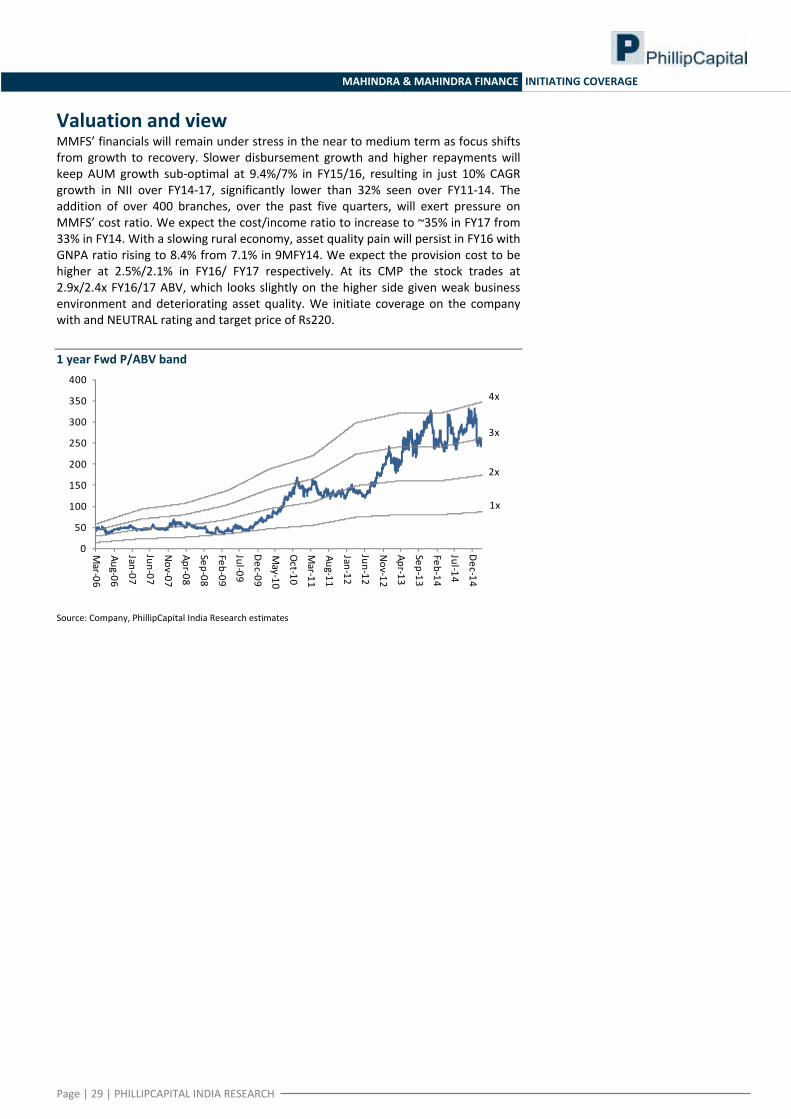
Valuation and view MMFS’ financials will remain under stress in the near to medium term as focus shifts from growth to recovery. Slower disbursement growth and higher repayments will keep AUM growth sub‐optimal at 9.4%/7% in FY15/16, resulting in just 10% CAGR growth in NII over FY14‐17, significantly lower than 32% seen over FY11‐14. The addition of over 400 branches, over the past five quarters, will exert pressure on MMFS’ cost ratio. We expect the cost/income ratio to increase to ~35% in FY17 from 33% in FY14. With a slowing rural economy, asset quality pain will persist in FY16 with GNPA ratio rising to 8.4% from 7.1% in 9MFY14. We expect the provision cost to be higher at 2.5%/2.1% in FY16/ FY17 respectively. At its CMP the stock trades at 2.9x/2.4x FY16/17 ABV, which looks slightly on the higher side given weak business environment and deteriorating asset quality. We initiate coverage on the company with and NEUTRAL rating and target price of Rs220. 1 year Fwd P/ABV band
Source: Company, PhillipCapital India Research estimates
0
50
100
150
200
250
300
350
400
Mar‐06
Aug‐06
Jan‐07
Jun‐07
Nov‐07
Apr‐08
Sep‐08
Feb‐09
Jul‐09
Dec‐09
May‐10
Oct‐10
Mar‐11
Aug‐11
Jan‐12
Jun‐12
Nov‐12
Apr‐13
Sep‐13
Feb‐14
Jul‐14
Dec‐14
1x
2x
3x
4x

Page | 30 | PHILLIPCAPITAL INDIA RESEARCH
MAHINDRA & MAHINDRA FINANCE INITIATING COVERAGE
Annexure: 1
MMFS: Background and business model Company background. Mahindra & Mahindra Financial Services, a subsidiary of Mahindra & Mahindra, is the second largest asset‐finance NBFC with assets under management of Rs365 bn. The company was incorporated in 1991 as a captive financier for M&M tractors and UVs. However since FY02 MMFS diversified its portfolio to other OEM products as well, which now constitute more than 50% of its AUM. MMFS also diversified its product portfolio to other vehicle categories such as commercial vehicles and cars. It ventured into insurance broking, mutual fund distribution and rural‐housing finance. MMFSL has a pan‐India presence, with 1,088 branches, of which almost 80% are in rural and semi‐urban areas. MMFS has two key subsidiaries engaged in insurance broking and rural housing finance. Well diversified portfolio. Since incorporation in 1991, until 2002, MMFS was the captive financier for its parent’s tractors and UVs. However after 2002 the company not only started financing other OEMs’ vehicles, but expanded its product portfolio to cars and commercial vehicles. Now, no single product segment contributes more than 30%, with highest contribution being from UVs (30%), followed by cars/tractors (23%/19%). Commercial vehicle/refinance, into which MMFS entered late, comprise 13%/15% of the product portfolio. The management is not expecting the product mix to change dramatically from here, but it expects the CV share to improve in the next 2‐3 years as the recovery plays out. Deeper rural penetration the backbone of the company’s business model. MMFS has been a major player in rural areas with almost 80% of its branches catering to rural customers. While the company is present in most of the districts (576 districts out of 676 districts in India), it has gone deeper into the rural hinterland as the distance between two branches has come down to 55 kms in H1FY15 from 104 kms in FY06. MMFS has penetration of as high as 45% in South India and 36‐38% in North and West India. With aggressive branch expansion distance between branches declined to 60kms
Source: Company, PhillipCapital India Research
0
20
40
60
80
100
120
0
200
400
600
800
1,000
1,200
FY06 FY07 FY08 FY09 FY10 FY11 FY12 FY13 FY14 FY15E
No of Branches Distance between branches (km)

Page | 31 | PHILLIPCAPITAL INDIA RESEARCH
MAHINDRA & MAHINDRA FINANCE INITIATING COVERAGE
Management Mr. Bharat Doshi, Chairman. Mr. Doshi joined Mahindra & Mahindra as an executive in 1973 and was elevated to the Board of the Company as Executive Director in 1992. In November 2013, he transited from his position as Executive Director & Group CFO to Non‐Executive Director. Mr. Doshi holds a Master's degree in law from Bombay University. He is a fellow member of the Institute of Chartered Accountants of India and the Institute of Company Secretaries of India. He also participated in the Program for Management Development (PMD) at Harvard Business School. Mr. Doshi was a Member of the Reserve Bank of India (RBI) constituted Working Group to examine emerging issues pertaining to regulation of the NBFC sector. He is a member of the RBI‐constituted Committee on Comprehensive Financial Services for Small Businesses and Low‐Income Households (CCFS). Mr. Ramesh Iyer, Managing Director. He has been the Managing Director of the company from April 30, 2001 and has been associated with the company since its inception. He holds a Bachelor's degree in Commerce and a Master's degree in Business Administration. He has vast experience in matters relating to business development, finance and marketing. He is also a member of the Group Executive Board of Mahindra & Mahindra, the holding company, and is on the boards of various Mahindra Group companies. Mr. Iyer is a member of the Banking & Finance Committee of the Bombay Chamber of Commerce and Industry, the core committee of Finance Industry Development Council (FIDC) and the Task Force of NBFCs of Federation of Indian Chambers of Commerce and Industry (FICCI). He is also co‐Chairman of the Group on Finance & Leasing and Insurance of the Council of Economic Affairs set up by Society of Indian Automobile Manufacturers (SIAM). Mr. V. Ravi, Chief Financial Officer. Mr. V. Ravi has been associated with the company since its inception. Mr. Ravi is also on the Board of other Mahindra Group Companies like Mahindra Rural Housing Finance Company, Mahindra Business and Consulting Services and Mahindra Finance USA LLC. He served with Mahindra Ugine Steel Company (MUSCO) for nine years on treasury, finance and diversification projects prior to his induction in Mahindra & Mahindra Financial Services. He is a member of the FICCI Committee on Corporate Finance. He has also been a member of the Asia Council of the Conference Board, USA, and the Informal Advisory Group of the Reserve Bank of India. Key Shareholders Number (mn) % of total
Mahindra & Mahindra Ltd 291 51.2 Cartica Capital Ltd 44.6 7.85 JP Morgan Sicav Investment Company (Mauritius) Ltd 6.2 1.08 JP Morgan Funds ‐ Emerging Markets Equity Fund 7.0 1.23 Government of Singapore 7.5 1.32 Aranda Investment (Mauritius) Pvt Ltd 10.8 1.91 Total 367.3 64.6
Source: Company, PhillipCapital India Research estimates, BSE

Page | 32 | PHILLIPCAPITAL INDIA RESEARCH
MAHINDRA & MAHINDRA FINANCE INITIATING COVERAGE
Financials
Profit and loss (Rs mn) Balance sheet (Rs mn) (Year Ending Mar 31) FY14 FY15E FY16E FY17E (Year Ending Mar 31) FY14 FY15E FY16E FY17E
Net interest income 25,231 27,552 30,697 34,344 Equity 1,127 1,127 1,127 1,127
Other income 2,419 2,424 2,635 2,868 Reserves 49,815 54,889 61,064 69,329
Net Income 27,650 29,976 33,332 37,211 Net worth 50,942 56,016 62,191 70,456
Operating expenses 9,134 10,180 11,441 12,889 Borrowings 239,306 263,474 273,412 309,927
Pre‐provision profit 18,516 19,796 21,891 24,322 Current liabilities & others 26,409 26,211 26,306 26,435
Provisions 5,058 8,576 8,888 8,376 Total liabilities 316,657 345,700 361,909 406,818
Profit before tax 13,458 11,221 13,003 15,946 Net block 1,195 1,029 894 798
Tax 4,585 3,703 4,291 5,023 Investments 8,692 8,691 8,691 8,691
Tax rate(%) 34.1 33.0 33.0 31.5 Loans 296,170 325,880 342,223 387,228
Adjusted Profit after tax 8,872 7,518 8,712 10,923 Current assets & others 10,601 10,100 10,100 10,100
Total assets 316,657 345,700 361,909 406,818
Dupont (as % of Assets) Key ratios (Year Ending Mar 31) FY14 FY15E FY16E FY17E (Year Ending Mar 31) FY14 FY15E FY16E FY17E
Interest Income 16.5 15.9 16.0 16.2 NIM (%) 8.8 8.3 8.7 8.9
Interest Expense 7.7 7.6 7.3 7.3 NIM (%) ‐On AUM 8.1 7.7 7.9 8.0
Net Interest Income 8.8 8.3 8.7 8.9 Cost/ Income (%) 33.0 34.0 34.3 34.6
Other income total 0.8 0.7 0.7 0.7 Credit cost (%) 1.8 2.6 2.5 2.2
Net Income total 9.7 9.1 9.4 9.7 RoA(%) 3.1 2.3 2.5 2.8
Operating expenses total 3.2 3.1 3.2 3.4 RoE (%) 18.6 14.1 14.7 16.5
Preprovision profit 6.5 6.0 6.2 6.3 Leverage (x) 6.0 6.2 6.0 5.8
Provisions 1.8 2.6 2.5 2.2 Tier I (%) 15.5 15.6 15.5 15.6
Profit before tax and ex items 4.7 3.4 3.7 4.2 CAR (%) 18.0 17.3 17.8 18.2
Profit before tax 4.7 3.4 3.7 4.2 No of shares (mn) 563.5 563.5 563.5 563.5
Tax total 1.6 1.1 1.2 1.3 Gross NPA (%) 4.4 7.8 8.4 6.5
Profit after tax 3.1 2.3 2.5 2.8 Net NPA (%) 1.9 3.3 3.8 2.9
Provision coverage (%) 59.1 58.0 55.0 55.0
Growth (%) Valuation ratios (Year Ending Mar 31) FY14 FY15E FY16E FY17E (Year Ending Mar 31) FY14 FY15E FY16E FY17E
Net interest income 23.0 9.2 11.4 11.9 FDEPS (Rs) 15.7 13.3 15.5 19.4
Net Income total 21.5 8.4 11.2 11.7 PER (x) 16.3 19.2 16.6 13.2
Preprovision profit 20.7 6.9 10.6 11.2 Book value (Rs) 90.4 99.4 110.4 125.0
Profit before tax 5.2 ‐16.6 15.9 22.7 P/BV (Rs) 2.8 2.6 2.3 2.0
Profit after tax 0.5 ‐15.3 15.9 25.5 Adjusted book value (Rs) 80.2 80.4 87.3 105.1
Loan 23.2 10.0 5.0 13.2 P/ABV (Rs) 3.2 3.2 2.9 2.4
Disbursement 6.5 ‐5.0 10.0 20.0 P/ PPP 7.8 7.3 6.6 5.9
AUM 22.3 9.4 7.0 15.0 Dividend yield (%) 1.5 1.5 1.6 1.6

INSTITUTIONAL EQUITY RESEARCH
Page | 33 | PHILLIPCAPITAL INDIA RESEARCH
Shriram Transport Finance (SHTF IN) On the cusp of recovery INDIA | NBFCs | Company update
5 March 2015
Disbursements show signs of gradual recovery. Uptick in sales of new commercial vehicles, moderate growth in stock of old commercial vehicles and the government’s focus on rural infrastructure will offer an impetus to growth in Shriram Transport Finance’s (SHTF’s) disbursements. This growth will accelerate with expected CAGR of ~17% over FY14‐17. Declining finance costs, sticky yields on the loan portfolio will aid margins on AUM by 90 bps. The rising differential between banks’ base rates and corporate bond yields has made non‐convertible debentures (NCDs) the preferred option, leading to a shift in the borrowing mix towards NCDs. An anticipated cut in the base rate and re‐pricing of fixed‐rate borrowing on maturity will reduce funding costs by 90 bps. Downward re‐pricing of liability will outpace asset re‐pricing, translating into improved margins. Truck operators’ improved financials, aided by lower fuel costs and higher utilization will ease concerns about asset quality. Credit cost to decline to 2.3% in FY17 from 3% in FY14. Lower fuel costs, higher utilization and stable freight rates have improved truck operators’ cash flows. A fall in diesel prices, diminishing discounts on new commercial vehicles and strong demand for new M&HCVs, have halted the fall in prices of pre‐owned commercial vehicles. This augurs well for demand for pre‐owned commercial vehicles, though with a lag. This will ease concerns about credit costs. We expect credit cost to decline to 2.3% in FY17 from 3% in FY14, even factoring a migration to 90 day NPA recognition norm Vs 180 days currently. Decline in NPA‐recognition norm will not impact SHTF’s business model. SHTF’s business model is supported by strong pillars. (1) Proximity to customers, (2) referral‐based lending, (3) continuous monitoring and door‐step collections, (4) superior product knowledge and the ability to assess the value of second‐hand vehicles, and (5) the ability to dispose of re‐possessed vehicles. The reduction in the norm for NPA recognition from 180 days currently to 90 days will impact asset quality in the medium but not jeopardize the business model. NBFCs have been granted a smooth transition period, which would enable them to tighten their recovery mechanism. High provision coverage of 80% will offer a cushion in terms of provision requirement during the transition. Risk: Weak credit‐growth visibility given a high base and monoline loan product SHTF’s loan‐book expansion has been a high 29% CAGR over FY06‐14, attaining an AUM base of Rs570 bn. The monoline product of financing pre‐owned commercial vehicles seems to have reached saturation with market share of 25% in the 5‐12 year‐old vintage category, 10% in the 2‐5 year‐old category and 2‐3% in the new CV segment. Growing at the historical pace is the key challenge, given the limited market size and high base. It has expanded its horizon beyond pre‐owned CVs by including all pre‐owned vehicles that are used for commercial purposes. Given the low ticket size compared to commercial vehicles, the cost of operation seems high and growth opportunity limited, until SHTF ventures into a new product segment.
Valuation and recommendation Improving business environment, strong business model and superior return ratio warrants a premium valuation. We believe that high operating cost and low credit profile customer will restrict new entrants. As SHTF is an established player with a well‐ diversified presence, sizeable loan portfolio, and is the largest financer in pre‐owned segment, it stands in a sweet spot to ride the commercial vehicle growth cycle. We maintain a BUY rating with price target of Rs1470 per share, thus valuing business at 2.75x FY17 ABVPS of Rs524 and ascribe a valuation of Rs32 per share to Shriram equipment finance company (1.5x FY16 ABVPS of Rs21.6).
BUY (Maintain) CMP Rs 1,210 TARGET PRICE: Rs 1470 (+21%) COMPANY DATA O/S SHARES (MN) 227MARKET CAP. (RSBN) 274MARKET CAP. (USDBN) 4.452 ‐ WK HI/LO (Rs) 1286 / 567LIQUIDITY 3M (USDMN) 10.4PAR VALUE (Rs) 10 SHARE HOLDING PATTERN, % PROMOTERS 26.1FIIs/NRIs 51.2FIs/MFs 4.3NON‐PROMOTER CORP. HOLDINGS 11.9PUBLIC & OTHERS 6.5 PRICE PERFORMANCE, %
1MTH 3MTH 1YRABS 5.7 0.4 108.6REL TO BSE 3.9 ‐2.5 70.1 PRICE VERSUS SENSEX
Source: PhillipCapital India Research KEY FINANCIALS Rs mn FY15E FY16E FY17ENet Income 42,072 52,331 63,688% growth 8 11 12Net Profit 12,365 15,871 21,163% growth ‐15.3 15.9 22.6EPS (Rs) 54.5 69.9 93.3PER (x) 22.2 17.3 13.0Book value (Rs) 415.2 480.1 567.1P/BV (Rs) 2.9 2.5 2.1Adj. book value (Rs) 394.6 452.7 523.8P/ABV (Rs) 3.1 2.7 2.3
Source: PhillipCapital India Research estimates Manish Agarwalla (+ 9122 6667 9962) Pradeep Agrawal (+ 9122 6667 9953)
40
80
120
160
200
Apr‐11 Apr‐12 Apr‐13 Apr‐14
Shriram Trans BSE Sensex

Page | 34 | PHILLIPCAPITAL INDIA RESEARCH
SHRIRAM TRANSPORT FINANCE COMPANY UPDATE
Disbursement shows signs of gradual recovery • The stock of used M&HCV (5‐12 years old) is expected to grow at a moderate
10% over FY14‐18 due to slowing/contraction of new M&HCV sales over FY11‐14. However improvement in new vehicle sale to boost overall disbursement.
• SHTF to post disbursement growth of ~17% over FY14‐17.
SHTF’s used commercial vehicle (CV) disbursement posted 25% CAGR from 2006‐07 until 2014‐15. This was due to (1) small‐fleet operators (SFOs) and first‐time users (FTUs) opting to buy used vehicles as freight availability was high; (2) growing use of the hub‐and‐spoke model and (3) a shift in market share from unorganized to organized players. However the overall disbursement CAGR has been 18% over the period due to the cyclical impact on new‐vehicle disbursements. New‐vehicle disbursements fell in the past two years, reflecting low CV volumes in the industry. Segment wise SHTF Disbursement
Source: company The stock of used M&HCV (5‐12 years old) is expected to grow at a moderate 10% over FY14‐18 due to slowing/contraction of new M&HCV sales over FY11‐14. However, new M&HCV sales have been picking up and we believe this would, to some extent, boost SHTF’s overall disbursement growth. We expect SHTF to post disbursement growth of ~17% over FY14‐17. SHTF Disbursement compared to Industry data
Source: company, PhillipCapital India Research
‐200
‐100
0
100
200
300
400
‐0.8
‐0.4
0.0
0.4
0.8
1.2
2006
‐07
2007
‐08
2008
‐09
2009
‐10
2010
‐11
2011
‐12
2012
‐13
2013
‐14
FY15
E
Used vehicle Rsbn New Vehicle RsbnUsed Vehicle grwth YoY % New Vehicle grwth YoY %
‐40%
‐20%
0%
20%
40%
60%
2008
‐09
2009
‐10
2010
‐11
2011
‐12
2012
‐13
2013
‐14
2014
‐15
2015
‐16
2016
‐17
Stock of used MHCV grwth % YoY New MHCV Industry Volume grwth % YoY
STFL disbursement grwth % YoY

Page | 35 | PHILLIPCAPITAL INDIA RESEARCH
SHRIRAM TRANSPORT FINANCE COMPANY UPDATE
Declining finance costs, sticky yields on loan portfolio to aid margins on AUM by 90 bps • STFL’s incremental cost of five‐year NCDs (rated AA+ by CARE/AA by
CRISIL) is 9.30‐9.15%, a significant discount to bank borrowing. • Proportion of NCDs in overall borrowing to increase from 40% at the end
of FY14 to 49% by FY17e. • Loan book are largely at fixed rate whereas 64% of borrowing bears fixed
rate interest. • We expect a 90 bps fall in cost of funds by the end of FY17 versus FY14. • The downward re‐pricing of liability will outstrip asset re‐pricing,
translating into higher margins. • NIM on AUM is expected to increase by 90bps to 7.6% in FY17 compared
to 6.7% in FY14. The rising differential between banks’ base rates and corporate bond yields has made non‐convertible debentures (NCDs) the preferred option for NBFCs. STFL’s incremental cost of five‐year NCDs (rated AA+ by CARE/AA by CRISIL) is 9.30‐9.15%, a significant discount to bank borrowing. Hence incremental borrowing will shift towards NCDs, increasing the proportion of NCDs in overall borrowing from 40% at the end of FY14 to 49% by FY17e. Base rate versus SHTF’s incremental cost of NCDs Bank base rate SHTF NCDs 5 year* Difference
SBI 10.00 9.15 0.85 PNB 10.25 9.15 1.10 BoI 10.20 9.15 1.05 BoB 10.25 9.15 1.10 ICICI Bank 10.00 9.15 0.85 Axis Bank 10.15 9.15 1.00 HDFC Bank 10.00 9.15 0.85
* issued in February 2015
Source: Bank, PhillipCapital India Research The on‐balance sheet borrowing profile comprises 36% floating‐rate borrowing (largely bank loans) and 64% fixed‐rate borrowings. The floating rate is subject to re‐pricing with revisions in banks’ base rates. Fixed‐rated borrowings have an average maturity of four years. STFL‐weighted average cost of fixed‐rate borrowing is ~11%, within which NCDs have a dominant portion, at 10.85%. The incremental cost of five‐year NCD is ~9.15%, a decline of 1.7% over the weighted average cost. Assuming a cut of 50 bps in the base rate over the next two years and re‐pricing of fixed‐rate borrowing on maturity, we expect a 90 bps fall in cost of funds by the end of FY17 versus FY14. The cost of funds fell by 30 bps over nine months of FY15 from 11.75% in FY14. We expect the cost to fall by 60 bps, by the end of FY17, to 10.85%. Re‐pricing schedule of borrowings Re‐pricing of existing borrowings
Floating rate loan
Weighted average cost Re‐priced at Saving in cost
Fixed‐rate loan
Weighted average cost Re‐priced at Saving in cost Total
FY15 36% 10.99% 10.99% 0.00% 20% 10.81% 9.50% ‐0.27% ‐0.27%FY16 36% 10.99% 10.75% ‐0.09% 12% 10.90% 9.20% ‐0.21% ‐0.30%FY17 36% 10.75% 10.50% ‐0.09% 12% 10.93% 9.15% ‐0.21% ‐0.30% Cumulative ‐0.87%
Source: PhillipCapital Research

Page | 36 | PHILLIPCAPITAL INDIA RESEARCH
SHRIRAM TRANSPORT FINANCE COMPANY UPDATE
Chart of borrowing mix % of borrowings 2012‐13 2013‐14 2014‐15 2015‐16 2016‐17Redeemable NCD 44.7 40.0 42.2 45.4 48.9loan from Banks 35.2 37.7 37.0 35.2 32.7Term loans from FI and corporate 2.6 3.2 2.9 2.5 2.2Subordinated debt 11.9 12.3 11.6 11.1 10.5commercial paper 1.2 0.4 0.4 0.4 0.4Fixed deposit 4.3 6.4 5.8 5.5 5.3others 0.0 0.0 0.0 0.0 0.0Total 100.0 100.0 100.0 100.0 100.0
Source: company, PhillipCapital India Research STFL’s loan book, which are at fixed‐ rate, have an average maturity of 4‐5 years. Given the customer profile (SFOs and FTUs) and specialized products (pre‐owned vehicles for commercial use), competition in the segment is limited, which we believe, will not exert pricing pressure. The interest charged on pre‐owned vehicles is 18‐24%, based on the vintage of the vehicles. Interest on new vehicles is 14‐16%. The downward re‐pricing of liability will outstrip asset re‐pricing, translating into higher margins. NIM on AUM is expected to increase by 90bps to 7.6% in FY17 compared to 6.7% in FY14. Chart of loan mix
Source: company Margin movement (percent)
Source: Company
28.7
40.7
22.2
5.4 3
Medium and Light CV
Heavy CV
Passenger Vehicle
Tractors
others
0
5
10
15
20
25
FY09‐10 FY10‐11 FY11‐12 2012‐13 2013‐14 2014‐15 2015‐16 2016‐17
Yield on advances Cost of fund Spreads Net interest margins

Page | 37 | PHILLIPCAPITAL INDIA RESEARCH
SHRIRAM TRANSPORT FINANCE COMPANY UPDATE
Low fuel costs, high utilization make for better financials for truck operators; ease concerns about asset quality • Truck operators’ cash flows have improved due to a fall in fuel costs,
uptick in utilization and stable freight rates. • Diminishing discounts on new commercial vehicles and strong demand
for new M&HCVs have arrested the fall in prices of pre‐owned commercial vehicles.
• Credit cost is expected to decline to 2.3% in FY17 from 3% in FY17, despite migration to 90 days NPA recognition norms.
Freight availability and transporters’ profitability are crucial factors that affect demand for commercial vehicles. Since FY12, freight availability was impacted by declining industrial activity (IIP), contracting capital expenditure and a ban on mining in various states. Besides, high fuel prices and lack of freight availability impacted truck operators’ profitability, leading to contraction in commercial vehicle growth. However, the recent fall in fuel price, increase in enquiries at the dealer level and decline in new‐vehicle discounts augur well for revival of the sector. M&HCVs will see traction and LCV recovery is expected with a lag. Chart: source: Auto/CV vs IIP
Source: PhillipCapital Research Truck operators’ cash flows have improved due to a fall in fuel costs, uptick in utilization and stable freight rates. Contribution (high freight, low fuel cost) per tonne kilometer has improved over the past few months, offering operators positive cash flow. Our channel checks suggest improvement in utilization, a critical element. The improvement in vehicle utilization level is attributable to improvement in goods movement and lack of capacity addition (de‐growth in M&HCV volume) in past few years.
‐100
‐50
0
50
100
150
200
‐10
‐5
0
5
10
15
20
25
Apr‐06
Sep‐06
Feb‐07
Jul‐0
7
Dec‐07
May‐08
Oct‐08
Mar‐09
Aug‐09
Jan‐10
Jun‐10
Nov
‐10
Apr‐11
Sep‐11
Feb‐12
Jul‐1
2
Dec‐12
May‐13
Oct‐13
Mar‐14
Aug‐14
IIP gwth % CV gwth %

Page | 38 | PHILLIPCAPITAL INDIA RESEARCH
SHRIRAM TRANSPORT FINANCE COMPANY UPDATE
Transport Operator’s contribution (Freight – fuel cost) per tonnee per kilometer
Source: PhillipCapital Research Cash flow of transport operator Round trip (2798 km/16.2 tonnes payload) Jan‐13 Jan‐14 Jan‐15Delhi‐Mumbai‐Delhi (Rs) 54,300 57,800 60,500MoM growth (%) 0 0 ‐3tonne kilometer 45,328 45,328 45,328Optimum payload per month (tonne km) 226,638 226,638 226,638Utilization (%) 50 50 55Contribution (per tonne km) 0.57 0.55 0.69Monthly contribution (Rs) 64,961 62,659 86,329 Other monthly expenses (Rs) Tyres 6,265 6,043 8,326Drivers and helpers 35,000 35,000 35,000EMI 29,511 26,621 24,929Miscellaneous expenses 3,248 3,133 4,316Total 74,024 70,798 72,572Net cash per month ‐9,063 ‐8,139 13,757 Assumption Price of vehicle (Rs) 1,430,000 1,290,000 1,208,000Interest (%) 15 15 15EMI (Rs) 29,511 26,621 24,929Tenure (years) 6 6 6Number of installments 72 72 72
Source: PhillipCapital India Research Market prices of pre‐owned vehicle have a direct bearing on asset quality. High diesel prices and discounts on new commercial vehicles suppressed prices of pre‐owned vehicles, leading to high credit costs. But the decline in diesel prices, diminishing discounts on new commercial vehicles and strong demand for new M&HCVs have arrested the fall in prices of pre‐owned commercial vehicles. These factors augur well for the demand of pre‐owned CVs, though with a lag, which would ease concerns about credit costs.
0.00
0.20
0.40
0.60
0.80
1.00
1.20
1.40
1.60Freight tone KM Diesel cost tone kilometer Contribution

Page | 39 | PHILLIPCAPITAL INDIA RESEARCH
SHRIRAM TRANSPORT FINANCE COMPANY UPDATE
All India average Diesel prices & price of new CV (net of discounts)
Source: PhillipCapital Research Most pre‐owned vehicles are used to carry essential goods, which are not very vulnerable to economic cycles. However, pre‐owned commercial equipment is an area of concern—its fate is linked to the uptick in infrastructure activity in rural and semi‐urban areas. We believe that given the government’s focus on rural infrastructure, it’s a matter of time before we see a reversal in this trend. Credit cost is expected to decline to 2.3% in FY17 from 3% in FY17, despite migration to 90 days NPA recognition norms. SHTF Credit cost
Source: Company, PhillipCapital Research
0
10
20
30
40
50
60
70
0
2
4
6
8
10
12
14
16 Average price (LCV), Rs Average price (MHCV), Rs
0.0
0.5
1.0
1.5
2.0
2.5
3.0
3.5
FY10 FY11 FY12 FY13 FY14 FY15E FY16E FY17E
provision to average loan book
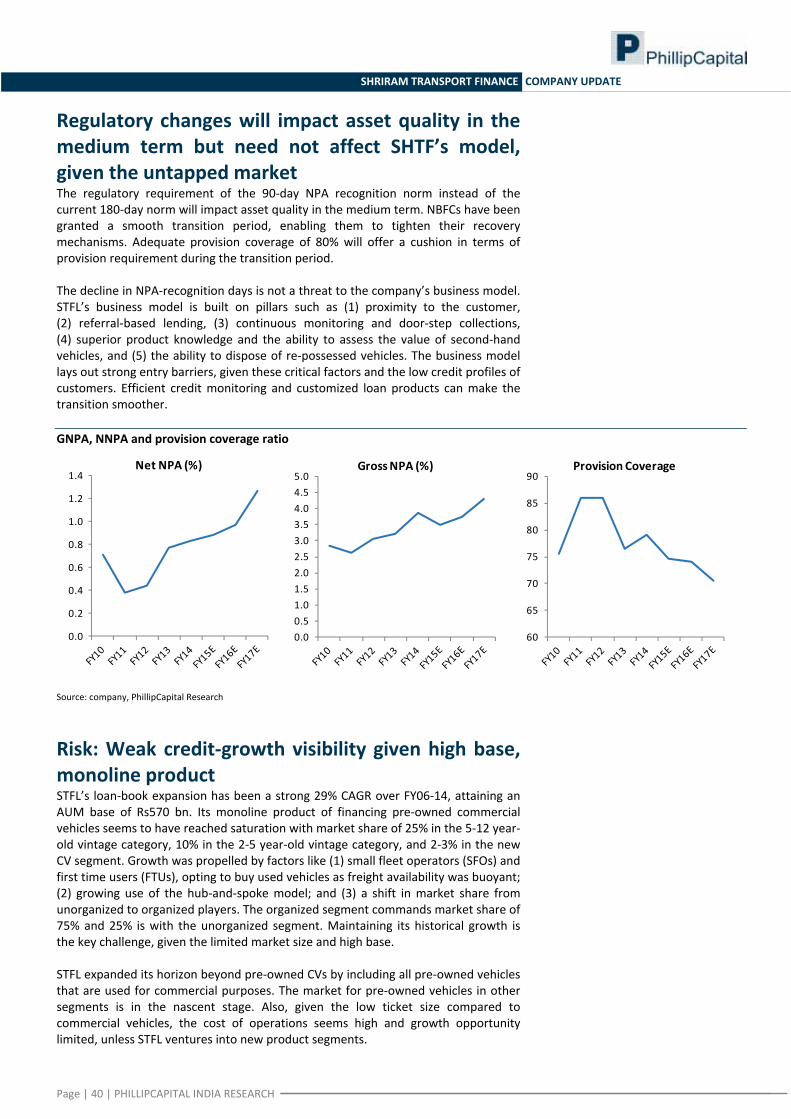
Page | 40 | PHILLIPCAPITAL INDIA RESEARCH
SHRIRAM TRANSPORT FINANCE COMPANY UPDATE
Regulatory changes will impact asset quality in the medium term but need not affect SHTF’s model, given the untapped market The regulatory requirement of the 90‐day NPA recognition norm instead of the current 180‐day norm will impact asset quality in the medium term. NBFCs have been granted a smooth transition period, enabling them to tighten their recovery mechanisms. Adequate provision coverage of 80% will offer a cushion in terms of provision requirement during the transition period. The decline in NPA‐recognition days is not a threat to the company’s business model. STFL’s business model is built on pillars such as (1) proximity to the customer, (2) referral‐based lending, (3) continuous monitoring and door‐step collections, (4) superior product knowledge and the ability to assess the value of second‐hand vehicles, and (5) the ability to dispose of re‐possessed vehicles. The business model lays out strong entry barriers, given these critical factors and the low credit profiles of customers. Efficient credit monitoring and customized loan products can make the transition smoother. GNPA, NNPA and provision coverage ratio
Source: company, PhillipCapital Research
Risk: Weak credit‐growth visibility given high base, monoline product STFL’s loan‐book expansion has been a strong 29% CAGR over FY06‐14, attaining an AUM base of Rs570 bn. Its monoline product of financing pre‐owned commercial vehicles seems to have reached saturation with market share of 25% in the 5‐12 year‐old vintage category, 10% in the 2‐5 year‐old vintage category, and 2‐3% in the new CV segment. Growth was propelled by factors like (1) small fleet operators (SFOs) and first time users (FTUs), opting to buy used vehicles as freight availability was buoyant; (2) growing use of the hub‐and‐spoke model; and (3) a shift in market share from unorganized to organized players. The organized segment commands market share of 75% and 25% is with the unorganized segment. Maintaining its historical growth is the key challenge, given the limited market size and high base. STFL expanded its horizon beyond pre‐owned CVs by including all pre‐owned vehicles that are used for commercial purposes. The market for pre‐owned vehicles in other segments is in the nascent stage. Also, given the low ticket size compared to commercial vehicles, the cost of operations seems high and growth opportunity limited, unless STFL ventures into new product segments.
0.0
0.2
0.4
0.6
0.8
1.0
1.2
1.4Net NPA (%)
0.00.51.01.52.02.53.03.54.04.55.0
Gross NPA (%)
60
65
70
75
80
85
90Provision Coverage

Page | 41 | PHILLIPCAPITAL INDIA RESEARCH
SHRIRAM TRANSPORT FINANCE COMPANY UPDATE
Subsidiaries Shriram Equipment Finance Company (SEFC) offers pre‐owned and new commercial‐construction equipment, such as forklifts, cranes and loaders to first‐time users, including STFL’s customers. The equipment is deployed at construction sites and for infrastructure development in the private sector in semi‐urban and rural areas. Having started its operations in October 2010, SEFC has already attained a very prominent position in the Construction Equipment Finance space with asset under management (AUM) registering a CAGR of 21% in last four years. Weak infrastructure activity in the economy took a toll on business growth and SEFC’s asset quality. AUM contracted by 6.7% in Q3FY15 after registering strong growth in the past. GNPA increased significantly from 1.3% in FY14 to 2.9% in Q3FY15. In 9MFY15, Shriram Equipment Finance registered an NII of Rs1.69 bn (12.5% YoY) and net profit of Rs71.9 mn (3.67% YoY). The company had AUM of Rs570 bn on December 31, 2014. RoA, GNPA and AUM growth (%)
Source: company Asset‐ quality pressure will continue in the medium term. We expect AUM growth of 12% and RoA of 1% in FY16. We value SEFC’s business at Rs7.5 bn, implying 1.5x FY16e ABV of Rs5bn. SHTF’s investment in SEFC stands at Rs2.6 bn (Rs2.5 bn in convertible bonds and Rs0.1 bn in equity). Shriram Automall India, which started its operation in FY10, operates 44 auto malls currently. An auto mall is a first‐of‐its‐kind mall that offers a common meeting platform for potential buyers and sellers. This platform has become a unique mechanism to ensure price discovery of pre‐owned vehicles. Auto mall offers transparency in the valuation process, backed by an assured title, quality and performance of the vehicle for buyers and assured payment for sellers. The Company has entered into a Memorandum of Understanding with a reputed Banks & Finance companies in India holding Heavy Commercial and Passenger Vehicles, Agricultural and Construction Equipment’s portfolio to provide various fee based services. Shriram automall provides facilitation service to buyers and seller of commercial vehicle and charge a facilitation fee. Unlike in the past, Shriram automall discontinued the buying and selling of used commercial vehicle. The business reported its maiden profit in FY13. During 9MFY15, Shriram Automall registered topline of Rs481 mn (‐12.6% YoY) and net profit of Rs71.9 mn (‐32.4% YoY). The decline in the top line and bottom line was due to lower sales volume in second‐hand vehicle market. SHTF’s equity investment in the subsidiary is Rs300 mn.
0
1
1
2
2
3
3
4
Jun‐13
Aug‐13
Oct‐13
Dec
‐13
Feb‐14
Apr‐14
Jun‐14
Aug‐14
Oct‐14
Dec
‐14
GNPA %
0
1
2
3
4
Jun‐13
Aug‐13
Oct‐13
Dec
‐13
Feb‐14
Apr‐14
Jun‐14
Aug‐14
Oct‐14
Dec
‐14
ROA (%)
‐10
0
10
20
30
40
50
Jun‐13
Aug‐13
Oct‐13
Dec
‐13
Feb‐14
Apr‐14
Jun‐14
Aug‐14
Oct‐14
Dec
‐14
AUM Growth (%)

Page | 42 | PHILLIPCAPITAL INDIA RESEARCH
SHRIRAM TRANSPORT FINANCE COMPANY UPDATE
Key Parameter Rs mn FY11 FY12 FY13 FY14 9MFY15Sale of used commercial vehicle 613 595 8 0 0no. of vehicle sold 1894 1679 25 0 0Buyer / seller Facilitation fee 8 478 741 733 481Net Profit / (Loss) ‐139 ‐3 140 83 33
Source: company Valuation Our investment thesis for SHTF is based on improving demand for new commercial vehicle which will trickle down to pre‐owned segment with a lag, declining funding cost and improved cash flow for transport operators owing to fuel price correction. Disbursement is expected to witness CAGR of 17% over FY14‐17 and re‐pricing of liability to bring down funding cost resulting improvement in margin. This will translate into CAGR of 18% in operating profit over FY14‐17. Credit cost is expected to moderate, despite SHTF migrating to 90days NPA recognition norms. High provision coverage of 80% provides buffer and smooth transition to new regime. Hence Profit after tax is expected to witness 19% CAGR between FY14‐17. We expect SHTF to report improvement in return on asset by 36bps to 2.6% and improvement in Return on equity by 380bps to 17.8% in FY17. At current market price of Rs1210 the stock trades at 2.7x FY16 ABVPS of Rs453 & 2.3x FY17 ABVPS of Rs524. Improving business environment, strong business model and superior return ratio warrants a premium valuation. We believe that high operating cost and low credit profile customer will restrict new entrants. As SHTF is an established player with a well‐ diversified presence, sizeable loan portfolio, and is the largest financer in pre‐owned segment, it stands in a sweet spot to ride the commercial vehicle growth cycle. We maintain a BUY rating with price target of Rs1470 per share, thus valuing business at 2.75x FY17 ABVPS of Rs524 and ascribe a valuation of Rs32 per share to Shriram equipment finance company (1.5x FY16 ABVPS of Rs21.6). 1 yr fwd P/ABV band
Source: company
0
200
400
600
800
1000
1200
1400
1600
1800
Oct‐08
Feb‐09
Jun‐09
Oct‐09
Feb‐10
Jun‐10
Oct‐10
Feb‐11
Jun‐11
Oct‐11
Feb‐12
Jun‐12
Oct‐12
Feb‐13
Jun‐13
Oct‐13
Feb‐14
Jun‐14
Oct‐14
Feb‐15
1x
1.8x
2.7x
3.7x

Page | 43 | PHILLIPCAPITAL INDIA RESEARCH
SHRIRAM TRANSPORT FINANCE COMPANY UPDATE
Financials Profit and loss (Rs mn) Balance sheet (Rs mn) (Year Ending Mar 31) FY14 FY15E FY16E FY17E (Year Ending Mar 31) FY14 FY15E FY16E FY17E
Net interest income 34,390 40,034 50,730 62,014 Equity 2,269 2,269 2,269 2,269
Other income 4,597 2,038 1,601 1,674 Reserves 80,463 91,932 106,672 126,411
Net Income 38,987 42,072 52,331 63,688 Net worth 82,732 94,201 108,941 128,680
Operating expenses 9,218 10,642 12,183 14,266 Borrowings 359,246 493,469 597,510 720,211
Preprovision profit 29,768 31,429 40,148 49,422 Current liabilities & others 50,279 47,978 47,929 48,711
Provisions 11,488 12,974 16,461 17,834 Total liabilities 492,257 635,648 754,380 897,602
Profit before tax 18,280 18,455 23,687 31,587 Net block 1,007 979 958 944
Tax 5,638 6,090 7,817 10,424 Investments 27,253 28,601 29,852 31,165
Tax rate 33.0 33.0 33.0 33.0 Loans 388,882 526,023 640,130 774,145
Adjusted Profit after tax 12,642 12,365 15,871 21,163 Current assets & others 75,116 80,045 83,440 91,348
Total assets 492,257 635,648 754,380 897,602
Dupont (as % of Assets) Key ratios (Year Ending Mar 31) FY14 FY15E FY16E FY17E (Year Ending Mar 31) FY14 FY15E FY16E FY17E
Interest Income 15.7 15.2 15.4 15.7 NIM (%) 8.0 7.6 7.8 8.0
Interest Expense 8.4 8.1 8.1 8.2 NII to AUM(%) 6.7 7.0 7.6 7.6
Net Interest Income 7.3 7.1 7.3 7.5 Cost/ Income (%) 23.6 25.3 23.3 22.4
Other income total 1.0 0.4 0.2 0.2 Credit cost (%) 3.0 2.5 2.6 2.3
Net Income total 8.3 7.5 7.5 7.7 RoA(%) 2.7 2.2 2.3 2.6
Operating expenses total 2.0 1.9 1.8 1.7 RoE (%) 16.3 14.0 15.6 17.8
Preprovision profit 6.4 5.6 5.8 6.0 Leverage (x) 6.1 6.4 6.8 7.0
Provisions 2.5 2.3 2.4 2.2 Tier I (%) 18.7 17.6 14.7 12.4
Profit before tax and exceptional items 3.9 3.3 3.4 3.8 CAR (%) 23.4 23.0 20.0 17.8
Profit before tax 3.9 3.3 3.4 3.8 No of shares (mn) 226.9 226.9 226.9 226.9
Tax total 1.2 1.1 1.1 1.3 Gross NPA (%) 3.9 3.5 3.8 4.3
Profit after tax 2.7 2.2 2.3 2.6 Net NPA (%) 0.8 0.9 1.0 1.3
Provision coverage (%) 79.1 74.7 74.1 70.5
Growth (%) Valuation ratios (Year Ending Mar 31) FY14 FY15E FY16E FY17E (Year Ending Mar 31) FY14 FY15E FY16E FY17E
Net interest income 23.0 9.2 11.4 11.9 EPS (Rs) 55.7 54.5 69.9 93.3
Net Income total 21.5 8.4 11.2 11.6 PER (x) 21.7 22.2 17.3 13.0
Preprovision profit 20.7 6.9 10.6 11.1 Book value (Rs) 364.6 415.2 480.1 567.1
Profit before tax 5.2 ‐16.6 15.9 22.6 P/BV (Rs) 3.3 2.9 2.5 2.1
Profit after tax 0.5 ‐15.3 15.9 22.6 Adjusted book value (Rs) 351.3 394.6 452.7 523.8
Loan 23.2 10.0 5.0 13.2 P/ABV (Rs) 3.4 3.1 2.7 2.3
Disbursement 6.5 ‐5.0 10.0 20.0 P/ PPP 2.8 3.0 2.7 2.6
AUM 22.3 9.4 7.0 15.0 Dividend yield (%) 0.6 0.6 0.6 0.7

INSTITUTIONAL EQUITY RESEARCH
Page | 44 | PHILLIPCAPITAL INDIA RESEARCH
Shriram City Union Finance (SCUF IN) The big daddy of SME lending INDIA | NBFCs | Initiating coverage
5 March 2015
Grossly under‐penetrated SME segment offers huge opportunity. There are about 26 mn operational SMEs in India, out of which only 5.1% avail of finance from formal institutions. The others either have no access to finance or depend on non‐institutional finance. This translates into an overall untapped market opportunity of Rs24 tn for organised players. This segment therefore offers ample opportunity to NBFCs, like Shriram City Union Finance (SCUF), whose core business is lending to SMEs. SCUF, with over 40% market share, is the leading player in the SME segment. With the SME book accounting for almost 53% of its portfolio, SCUF is the leading player in this segment with over 40% market share. Bajaj Finance is the second largest player, with market share of 13%, followed by Magma, Intec Capital, AU Financier and Cholamandalam. In the long term the SCUF management intends to increase its SME book proportion to 70% as it expands into new geographies and taps customers outside the Shriram chit fund ecosystem. High duration SME book to bring stability to the balance sheet. As SMEs remain the focus area for the company, we expect the SME share to increase to 60% by FY17 from current levels of 53%. With an average tenor of about three years, the increase in the SME segment’s share will lend the balance sheet more stability. Auto, two‐wheeler and personal loans have an average tenor of 24‐30 months and gold loans, four months. Two wheelers acts as a tool to gauge new market potential. With AUM of ~Rs30 bn, SCUF is one of the largest financiers of two wheelers in India. This product segment is of strategic importance to the company as it uses its products to enter new markets and appraise them. The company is opening branches in the northern and western regions with an aim to strengthen its presence in this segment. The management sees ample scope for growth in these regions. 50‐60 new branches in these regions only disburse two‐wheeler loans, but they will gradually roll out other products, such as SME loans. Strong customer understanding helps to control asset quality. The company’s asset quality is one of the best among peers, despite its operating in an SME segment, which is perceived as highly delinquent. The company’s GNPA has been below 3% over the past eight years. In fact, the SME portfolio is the least delinquent with 1.5% GNPA ratio, against 2.1% for gold loans, 4.2% for two wheelers and 4.6% for auto loans. Almost 60% of SCUF’s SME customers are Shriram chit fund members, which helps in better credit underwriting and appraisals. The company has managed its asset quality well due to its long‐standing relationships with customers with dependable track records. However, with SCUF moving to non‐chit regions, its ability to manage NPAs will be tested. Valuation and recommendation. SCUF is a niche play in the retail NBFC space as it is the only financier for which SME lending is part of its core business. We believe that with strong credit appraisal skills, gathered over the years, the company is well placed to benefit from huge untapped potential in the SME space. AUM will grow at a CAGR of 24% over FY15‐17, with disbursement CAGR of 22% over the similar period. Strong balance sheet growth with 100bps improvement in NIM’s to drive strong earnings CAGR of 23% over FY15‐17 with superior returns on assets of 3.6% and RoE of 17.7%. SCUF is consistently delivering 3%+ RoA over the last 5 Years. At the current market price, the stock trades at 3.0x/2.6 FY16/FY17e ABV. With superior return ratios as compared to peers and favourable outlook, we value SCUF at 3.2x FY17ABV assigning a price target of Rs2,450. We initiate coverage with a BUY rating.
BUY CMP RS 2015 TARGET RS 2450 (+22%) COMPANY DATA O/S SHARES (MN) : 659MARKET CAP (RSBN) : 133MARKET CAP (USDBN) : 2.152 ‐ WK HI/LO (RS) : 2200 / 991LIQUIDITY 3M (USDMN) : 1.3PAR VALUE (RS) : 10 SHARE HOLDING PATTERN, % PROMOTERS : 33.8FII / NRI : 49.7FI / MF : 2.2NON PROMOTER CORP. HOLDINGS : 11.7PUBLIC & OTHERS : 2.6 PRICE PERFORMANCE, %
1MTH 3MTH 1YRABS 3.2 7.7 129.6REL TO BSE 1.4 4.8 91.0 PRICE VS. SENSEX
Source: Phillip Capital India Research KEY FINANCIALS Rs mn FY15E FY16E FY17ENet Income 22,130 25,471 30,822% growth 17 15 21Net Profit 5,765 7,092 8,791% growth 10.6 23.0 23.9EPS (Rs) 87.9 87.5 133.5PER (x) 22.9 23.0 15.1Book value (Rs) 489 622 808P/BV (Rs) 4.1 3.2 2.5Adj. book value (Rs) 476 605 761P/ABV (Rs) 4.2 3.3 2.6
Source: PhillipCapital India Research estimates Pradeep Agrawal (+ 9122 6667 9953) Manish Agarwalla (+ 9122 6667 9962)
40
140
240
340
440
Apr‐11 Apr‐12 Apr‐13 Apr‐14
Shriram City BSE Sensex

Page | 45 | PHILLIPCAPITAL INDIA RESEARCH
SHRIRAM CITY UNION FINANCE INITIATING COVERAGE
Leading player + under‐penetrated market = strong growth • There are about 26mn operational SMEs in India, out of which only 5.2% of the
units avail of finance from formal institutions. This translates into overall market opportunity of Rs24 tn for organised players
• Among NBFCs, SCUF is the leading player in SME lending, with market share of more than 40%. Expansion into new geographies and beyond Shriram chit fund customers will drive market share gains
• The company’s SME portfolio grew at CAGR of 38% over FY11‐14. With the Andhra Pradesh issue behind and economic environment turning favourable, we expect the SME book to grow at a CAGR of 30%
Grossly under‐penetrated segment offers a big opportunity. There are about 26 mn operational SMEs in India, out of which only 5.1% of the units avail of finance from formal institutions and 2.1% get finance from non‐institutional sources. The others—92.8%—have no access to finance or depend on self finance. Most of the 94.9% SMEs (those that depend on their own finance and on non‐institutional sources of funding) are deprived of bank funding because they lack the required documentation, collateral and credit profile. This translates into an overall untapped market opportunity of Rs24 tn for organised players in the SME segment. This segment therefore offers ample opportunity to NBFCs like SCUF. Banks have not been very aggressive in lending to the SME segment due to a high risk perception, difficulty in appraising borrowers and inadequate collateral. That leaves SME‐financing NBFCs like SCUF in an advantageous position, as it gives them pricing power. Only 5% of SME units avail finance from institutional sources Registered Sector Unregistered Sector Total No of SME Enterprises (mn) 1.6 24.5 26.1Enterprises by Source of Finance: No Finance/Self Finance 87.3% 93.1% 92.8%Finance through Institutional Sources 11.3% 4.8% 5.1%Finance through Non‐Institutional Sources 1.4% 2.1% 2.1%
Source: All India census of MSME FY06‐07 Much dependence on informal sources Vicious cycle in funding pattern of NBFCs
Source: Company, PhillipCapital, RBI, All India census of MSME FY06‐07
No Finance/Self Finance , 93%
Finance through Inst. Sources, 5%
Finance through Non‐Inst.Sources,
2%
Lack of access to formal source
Alternative source of funds
Poor cash flow due to higher cost of credit
Higher risk profile
Loss in credit
worthiness for banks

Page | 46 | PHILLIPCAPITAL INDIA RESEARCH
SHRIRAM CITY UNION FINANCE INITIATING COVERAGE
SCUF leads in SME lending with over 40% market share. As lending to SMEs is perceived as riskier than other segments, very few players are aggressive in this segment. However, SCUF has not only managed to grow at a healthy 32% CAGR over FY12‐15, but its asset quality has been pretty decent with 3% GNPA and 0.6% NNPA. The company entered this segment in December 2005 and has ramped up this product quite fast as it had direct access to 0.8 mn Shriram chit fund customers. With the SME book forming almost 53% of the portfolio, SCUF is the leading player in this segment with over 40% market share. Bajaj Finance is the second largest player with market share of 13%, followed by Magma, Intec Capital, AU Financier and Cholamandalam. SCUF is the only NBFC for which the SME segment is the core of the product portfolio. The management intends to increase its SME book proportion to 70% in the long term. The SME book has grown at a CAGR of 32% SCUF has 40%+ market share among NBFCs in SME lending
Source: Company, PhillipCapital India Research Focus on non‐chit fund customers to widen customer base, aid market‐share gain The company started SME lending in FY06, with focus largely on its Shriram chit fund customers. This gave direct access to about 800,000 customers of Shriram chits and helped to maintain asset quality as SCUF was familiar with the credit details of those customers. However as the company has gained enough experience in this segment, and sharpened its risk management and credit appraisal systems, it is now increasingly focusing on non‐chit customers. The share of Shriram chit customers in SCUF has fallen to ~60% from ~90% in FY12. The management expects this ratio to decline in future. This will help SCUF to widen its customer base and reduce its dependence on Shriram chit customers for its growth. Falling dependence on Shriram chit customers
Source: Company, PhillipCapital India Research
0
10
20
30
40
50
60
70
80
90
100
FY12 FY13 FY14 FY15E
SME ‐AUM
0
20,000
40,000
60,000
80,000
100,000 MSME Book (Rsmn)
90%
80%
70%
60%
0%
20%
40%
60%
80%
100%
FY12 FY13 FY14 FY15P
Chit Fund customers proportion

Page | 47 | PHILLIPCAPITAL INDIA RESEARCH
SHRIRAM CITY UNION FINANCE INITIATING COVERAGE
SME portfolio to post 30% CAGR over FY15‐17e: SCUF’s SME portfolio posted a strong 82% CAGR over FY11‐13 also helped by low base. However, growth slowed down in FY14 to 17% as the management reduced LTV and tenure against a backdrop of a deteriorating macro‐economic situation and political instability in Andhra Pradesh. However as things settled down in Andhra Pradesh and growth outlook turned favourable, SCUF rolled back the curbs it had imposed. The LTV and tenure are now restored to earlier levels of 60%/3 years. We expect SCUF’s SME portfolio to post 30% CAGR over FY15‐17. Bank lending to SMEs (Rsbn) AUM (Rs mn)
Source: RBI, Company, PhillipCapital India Research High‐duration SME book to bring stability to the balance sheet As the SME segment is SCUF’s thrust area, we expect SME loans’ share in the loan portfolio to rise to 60% by FY17 from 53%. With an average tenor of three years, an increase in the SME segment’s share will lend stability to SCUF’s balance sheet. SME is the highest duration loan in the company’s portfolio (36 months). Tenures for auto, two wheeler and personal loans are 24‐30 months and four months for gold loans. Product portfolio and details
Started Avg. tenor (months) Yield (%)
Avg. ticket size (Rs 000) LTV (%)
Share in book (%)
Two wheelers Dec‐02 24 22‐24 35 70 18Auto loans Dec‐05 30 22‐24 150 60 9SME Dec‐05 36 18‐22 500 NA 52Personal loans Jan‐06 30 24‐27 75 NA 3Gold loans Oct‐06 4 16‐18 40 < 70 18Home loans Dec‐11 15 years 15‐16 1000 55 via subsidiary
Source: Company, PhillipCapital India Research
0
5
10
15
20
25
30
35
40
0
1,000
2,000
3,000
4,000
5,000
6,000
7,000
8,000
FY09 FY10 FY11 FY12 FY13 FY14
Bank Credit to Micro/ Small Enterprises yoy growth
‐20
0
20
40
60
80
100
120
0
20,000
40,000
60,000
80,000
100,000
120,000
140,000
160,000
180,000
FY07 FY08 FY09 FY10 FY11 FY12 FY13 FY14
AUM yoy growth (rhs)

Page | 48 | PHILLIPCAPITAL INDIA RESEARCH
SHRIRAM CITY UNION FINANCE INITIATING COVERAGE
The gold‐loan portfolio: Joker in the pack The gold‐loan portfolio was the highest growing segment for SCUF until about two years ago, contributing 40% to overall AUMs in September 2012. However, after regulatory tightening by the RBI and a sharp fall in gold prices, over the past two years, SCUF reduced the LTV in this portfolio to 55%. Consequently, the share of the gold‐loan portfolio share kept declining and was 15.4% in June 2014. However SCUF raised the LTV to 65% few quarters ago, resulting in healthy growth in Q2FY15. Gold prices are still volatile but the management sees great potential in this product and aims to increase its share in the portfolio, to 25% from 17%, over the long term. Gold loan‐book share halved to 18% Growth after seven successive quarters of decline
Source: Company, PhillipCapital India Research SCUF uses two‐wheeler segment to appraise new markets SCUF entered the two‐wheeler segment quite early, in FY03, but it contributed just 10% to the overall portfolio in December 2011. This portfolio posted 35% CAGR against just 7% CAGR in the ex‐two wheeler portfolio, resulting in the share rising to 18%. SCUF is one of the largest financiers of two wheelers in India and it expects to strengthen its presence in this segment. This product segment is of strategic importance to SCUF, which uses two wheelers to appraise new markets it may want to introduce its other products to. South India accounts for almost 80% of SCUF’s AUM. The company has been opening branches in the northern and western regions, and has been well received in those regions. The management sees ample scope for growth in these regions. There are 50‐60 new branches in these regions that only disburse two‐wheeler loans.
0%
20%
40%
60%
80%
100%
Dec
‐11
Feb‐12
Apr‐12
Jun‐12
Aug‐12
Oct‐12
Dec
‐12
Feb‐13
Apr‐13
Jun‐13
Aug‐13
Oct‐13
Dec
‐13
Feb‐14
Apr‐14
Jun‐14
Aug‐14
Gold Loan Non Gold Loan
‐30
‐20
‐10
0
10
20
30
0
10
20
30
40
50
60
70
Dec
‐11
Mar‐12
Jun‐12
Sep‐12
Dec
‐12
Mar‐13
Jun‐13
Sep‐13
Dec
‐13
Mar‐14
Jun‐14
Sep‐14
Dec
‐14
Gold Loan AUM (Rsbn) qoq growth

Page | 49 | PHILLIPCAPITAL INDIA RESEARCH
SHRIRAM CITY UNION FINANCE INITIATING COVERAGE
2 Wheeler segment grew at a CAGR of 24% over FY12‐15E
Source: Company, PhillipCapital India Research
Strong customer understanding helps maintain asset quality SCUF’s asset quality is one of the best among peers, despite its operating in the SME segment, which is perceived as highly delinquent. SCUF’s GNPA has never crossed 3% over the past eight years. In fact, the SME portfolio is the least delinquent with 1.5% GNPA ratio against 2.1% for gold loans, 4.2% for two wheelers and 4.6% for auto loans. Almost 60% of SCUF’s SME customers are Shriram chit fund members, which help in better understanding clients’ credit standing. The company has managed its asset quality well so far due to its long‐standing relationships with customers with dependable track records. However, with SCUF moving to non‐chit customers, its ability to manage NPAs will be tested. Better standing among peers in asset quality SME the least delinquent portfolio (%)
Source: Company, PhillipCapital India Research Strong capital position to support AUM growth The company has a strong capital position with capital adequacy ratio of 30.4%, including tier‐I ratio of 25.5%. In May 2014, SCUF issued preferential shares at Rs1,200 to Piramal Enterprises, raising Rs7.9 bn, which helped to boost capital ratios. With this capital base the company will not require capital for the next three years.
16
20
26
31
0
5
10
15
20
25
30
35
FY12 FY13 FY14 FY15E
Two Wheeler ‐AUM (Rsbn)
7.1
3.63.0 2.8
2.4
0.0
1.0
2.0
3.0
4.0
5.0
6.0
7.0
8.0
MMFS STFS SCUF CHOLA SUNDF
4.2%4.6%
2.7%
2.1%
1.5%
0.0%
1.0%
2.0%
3.0%
4.0%
5.0%
2 Wheelers Auto loans Overall Gold loans SME
GNPA %

Page | 50 | PHILLIPCAPITAL INDIA RESEARCH
SHRIRAM CITY UNION FINANCE INITIATING COVERAGE
Strong capital adequacy ratio – row 138
Source: Company, PhillipCapital India Research Borrowing largely from banks The company’s borrowing largely comprises bank loans (54% of borrowings) and retail borrowing (30%). Half SCUF’s bank loans have floating interest rates and half have fixed rates. However as banks’ base rate has been stable for quite some time, the company may not benefit in costs in this portion of the book in the near term. However with inflation declining and a fall in bond yields, banks may lower base rates from 1QFY16. We expect a 50 bps benefit on the cost front in FY16. Borrowing profile
Source: Company, PhillipCapital India Research
16.4%13.8% 14.6%
20.2%
25.5%20.5%17.4% 18.6%
26.1%
30.4%
0%
5%
10%
15%
20%
25%
30%
35%
FY11 FY12 FY13 FY14 9MFY15
Tier I Capital adequacy ratio
Banks Borrowings, 54%
Retail Borrowings, 28%
Market Borrowings, 7% Public
Issue(NCD), 11%
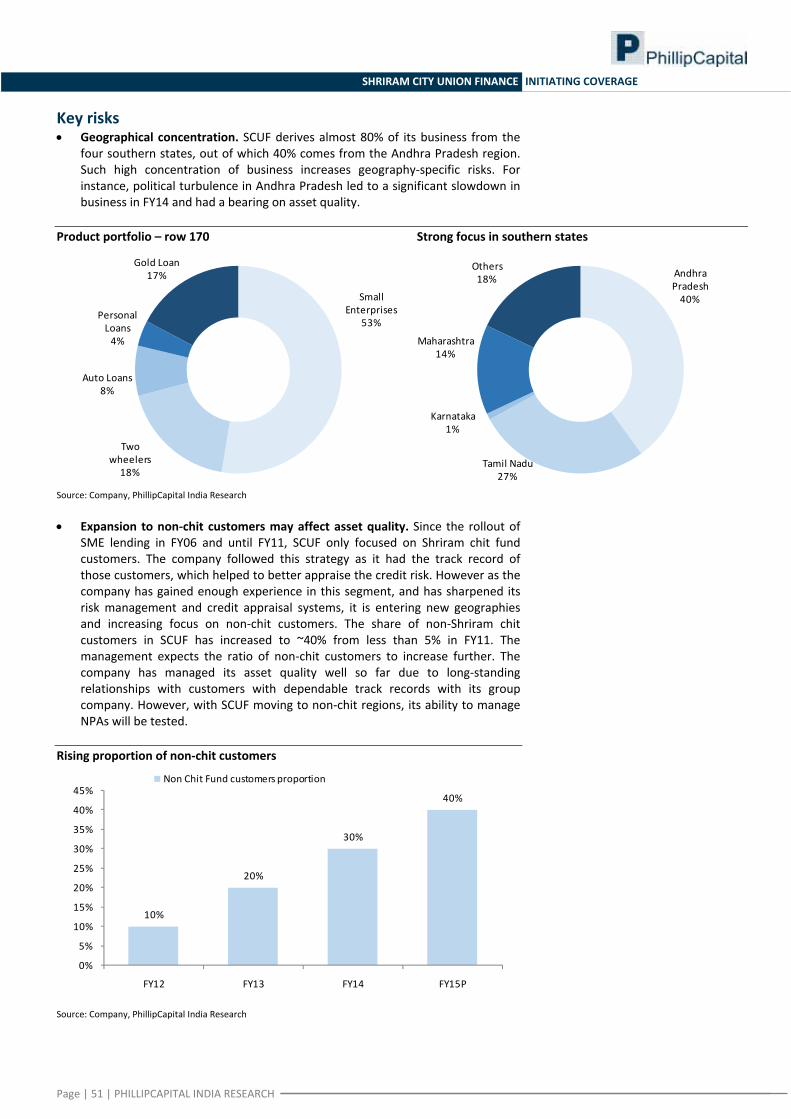
Page | 51 | PHILLIPCAPITAL INDIA RESEARCH
SHRIRAM CITY UNION FINANCE INITIATING COVERAGE
Key risks • Geographical concentration. SCUF derives almost 80% of its business from the
four southern states, out of which 40% comes from the Andhra Pradesh region. Such high concentration of business increases geography‐specific risks. For instance, political turbulence in Andhra Pradesh led to a significant slowdown in business in FY14 and had a bearing on asset quality.
Product portfolio – row 170 Strong focus in southern states
Source: Company, PhillipCapital India Research • Expansion to non‐chit customers may affect asset quality. Since the rollout of
SME lending in FY06 and until FY11, SCUF only focused on Shriram chit fund customers. The company followed this strategy as it had the track record of those customers, which helped to better appraise the credit risk. However as the company has gained enough experience in this segment, and has sharpened its risk management and credit appraisal systems, it is entering new geographies and increasing focus on non‐chit customers. The share of non‐Shriram chit customers in SCUF has increased to ~40% from less than 5% in FY11. The management expects the ratio of non‐chit customers to increase further. The company has managed its asset quality well so far due to long‐standing relationships with customers with dependable track records with its group company. However, with SCUF moving to non‐chit regions, its ability to manage NPAs will be tested.
Rising proportion of non‐chit customers
Source: Company, PhillipCapital India Research
Small Enterprises
53%
Two wheelers18%
Auto Loans8%
Personal Loans4%
Gold Loan17% Andhra
Pradesh40%
Tamil Nadu27%
Karnataka1%
Maharashtra14%
Others18%
10%
20%
30%
40%
0%
5%
10%
15%
20%
25%
30%
35%
40%
45%
FY12 FY13 FY14 FY15P
Non Chit Fund customers proportion

Page | 52 | PHILLIPCAPITAL INDIA RESEARCH
SHRIRAM CITY UNION FINANCE INITIATING COVERAGE
Valuation and view SCUF is a niche play in the retail NBFC space as it is the only financier for which SME lending is part of its core business. We believe that with strong credit appraisal skills, gathered over the years, the company is well placed to benefit from huge untapped potential in the SME space. AUM will grow at a CAGR of 24% over FY15‐17, with disbursement CAGR of 22% over the similar period. Strong balance sheet growth with 100bps improvement in NIM’s to drive strong earnings CAGR of 23% over FY15‐17 with superior returns on assets of 3.6% and RoE of 17.7%. SCUF is consistently delivering 3%+ RoA over the last 5 Years. At the current market price, the stock trades at 3.0x/2.6 FY16/FY17e ABV. With superior return ratios as compared to peers and favourable outlook, we value SCUF at 3.2x FY17ABV assigning a price target of Rs2,450. We initiate coverage with a BUY rating. 1 yr fwd P/ABV band
Source: Company, PhillipCapital India Research
0
500
1000
1500
2000
2500
Sep‐07Jan‐08May‐08
Sep‐08Jan‐09May‐09
Sep‐09Jan‐10May‐10
Sep‐10Jan‐11May‐11
Sep‐11Jan‐12May‐12
Sep‐12Jan‐13May‐13
Sep‐13Jan‐14May‐14
Sep‐14Jan‐15
0.6x
1.5x
2.5x
3.5x

Page | 53 | PHILLIPCAPITAL INDIA RESEARCH
SHRIRAM CITY UNION FINANCE INITIATING COVERAGE
Annexure: 1
Company background Shriram City Union Finance (SCUF) was set up in 1986 and is part of the three‐decade old Shriram Group. As a deposit‐accepting non‐banking financial company (NBFC), Shriram City is India's premier financial services company specializing in retail finance. The group’s consumer finance business had its origins from the needs of the Chit Funds customers and was started in year 2002 as a separate business unit, Shriram City Union Finance Ltd. Shriram City has a comprehensive range of offerings comprising finance for Two Wheelers and Three Wheelers, Four Wheeler Finance (both new and pre‐owned passenger and commercial vehicles), Personal Loans, Small Business Loans, and Loan against Gold. This has made Shriram City a dominant player in the field. Shriram City Union Finance leverages on the Shriram Group's ecosystem to reach out to prospective customers and Shriram City Union Finance's customer base over the years has significantly comprised of customers of other entities in the Shriram Group. Key shareholders
Number (mn) % of total 1 Shriram Capital (Promoter) 22.3 33.82 TPG India Investments I INC 13.4 20.43 Piramal Enterprise 6.6 10.04 Bessemer Venture Partners Trust 1.7 2.65 Norwest Venture Partners X FII‐Mauritius 2.2 3.36 Morgan Stanley Asia (Singapore) 1.4 2.17 Matthews India Fund 1.8 2.78 Steadview Capital Mauritius 1.1 1.79 Bank Muscat S A O G A/c Bank Muscat India 1.1 1.610 Acacia Partners 1.0 1.511 ABG Capital 0.8 1.312 Wasatch Emerging Markets Small Cap Fund 0.8 1.213 SBI Emerging Business Fund 0.7 1.114 Acacia Institutional Partners 0.7 1.0
Total 55.5 84.2
Source: Company, PhillipCapital India Research

Page | 54 | PHILLIPCAPITAL INDIA RESEARCH
SHRIRAM CITY UNION FINANCE INITIATING COVERAGE
Financials Profit and loss (Rs mn) Balance sheet (Rs mn)(Year Ending Mar 31) FY14 FY15E FY16E FY17E (Year Ending Mar 31) FY14 FY15E FY16E FY17E
Net interest income 17,848 20,729 24,071 29,296 Equity 593 659 659 659Other income 1,031 1,401 1,400 1,526 Reserves 28,390 40,296 45,642 52,577Net Income 18,879 22,130 25,471 30,822 Net worth 28,983 40,955 46,301 53,236Operating expenses 7,239 8,887 10,047 12,160 Borrowings 120,491 125,713 156,775 202,934Preprovision profit 11,641 13,242 15,424 18,661 Current liabilities & others 14,357 14,859 14,917 15,027Provisions 3,842 4,615 4,811 5,506 Total liabilities 163,831 181,527 217,993 271,197Profit before tax 7,799 8,627 10,613 13,155 Net block 1,014 1,347 2,274 4,979Tax 2,587 2,862 3,521 4,364 Investments 6,276 6,276 6,276 6,276Tax rate 33.2 33.2 33.2 33.2 Loans 128,535 154,900 190,439 240,938Adjusted Profit after tax 5,211 5,765 7,092 8,791 Current assets & others 28,007 19,004 19,004 19,004 Total assets 163,831 181,527 217,993 271,197
Dupont (as % of Assets) Key ratios(Year Ending Mar 31) FY14 FY15E FY16E FY17E (Year Ending Mar 31) FY14 FY15E FY16E FY17E
Interest Income 19.3 19.8 19.6 19.7 NIM (%) 11.0 12.0 12.1 12.0Interest Expense 8.3 7.8 7.6 7.7 NIM (%) ‐ On AUM 11.7 13.2 12.9 12.7Net Interest Income 11.0 12.0 12.1 12.0 Cost/ Income (%) 38.3 40.2 39.4 39.5Other income total 0.6 0.8 0.7 0.6 Credit cost (%) 2.4 2.7 2.4 2.3Net Income total 11.6 12.8 12.8 12.6 RoA(%) 3.2 3.3 3.6 3.6Operating expenses total 4.4 5.1 5.0 5.0 RoE (%) 20.2 16.5 16.3 17.7Preprovision profit 7.1 7.7 7.7 7.6 Leverage (x) 6.3 4.9 4.6 4.9Provisions 2.4 2.7 2.4 2.3 Tier I (%) 20.2 24.0 25.2 25.5Profit before tax and exceptional items 4.8 5.0 5.3 5.4 CAR (%) 25.6 29.7 27.8 25.7Profit before tax 4.8 5.0 5.3 5.4 No of shares (mn) 59.3 65.9 65.9 65.9Tax total 1.6 1.7 1.8 1.8 Gross NPA (%) 2.7 3.0 3.5 3.2Profit after tax 3.2 3.3 3.6 3.6 Net NPA (%) 0.6 0.7 1.0 1.3 Provision coverage (%) 77.6 76.7 71.4 59.4
Growth (%) Valuation ratios(Year Ending Mar 31) FY14 FY15E FY16E FY17E (Year Ending Mar 31) FY14 FY15E FY16E FY17E
Net interest income 9.3 16.1 16.1 21.7 FDEPS (Rs) 87.9 87.9 87.5 133.5Net Income total 12.9 17.2 15.1 21.0 PER (x) 22.9 22.9 23.0 15.1Preprovision profit 10.9 13.8 16.5 21.0 Book value (Rs) 488.9 488.9 621.8 808.3Profit before tax 17.2 10.6 23.0 23.9 P/BV (Rs) 4.1 4.1 3.2 2.5Profit after tax 15.9 10.6 23.0 23.9 Adjusted book value (Rs) 476.1 476.1 605.3 760.7Loan ‐3.8 20.5 22.9 26.5 P/ABV (Rs) 4.2 4.2 3.3 2.6Disbursement ‐11.3 14.0 20.0 23.0 P/ PPP 2.5 3.1 3.0 2.9AUM ‐7.3 14.2 22.0 25.7 Dividend yield (%) 0.5 0.5 0.5 0.6

Page | 55 | PHILLIPCAPITAL INDIA RESEARCH
NBFC SECTOR
Contact Information (Regional Member Companies)
SINGAPORE Phillip Securities Pte Ltd
250 North Bridge Road, #06‐00 Raffles City Tower, Singapore 179101
Tel : (65) 6533 6001 Fax: (65) 6535 3834 www.phillip.com.sg
MALAYSIA Phillip Capital Management Sdn Bhd B‐3‐6 Block B Level 3, Megan Avenue II,
No. 12, Jalan Yap Kwan Seng, 50450 Kuala Lumpur Tel (60) 3 2162 8841 Fax (60) 3 2166 5099
www.poems.com.my
HONG KONG Phillip Securities (HK) Ltd
11/F United Centre 95 Queensway Hong Kong Tel (852) 2277 6600 Fax: (852) 2868 5307
www.phillip.com.hk
JAPAN Phillip Securities Japan, Ltd
4‐2 Nihonbashi Kabutocho, Chuo‐ku Tokyo 103‐0026
Tel: (81) 3 3666 2101 Fax: (81) 3 3664 0141 www.phillip.co.jp
INDONESIA PT Phillip Securities Indonesia
ANZ Tower Level 23B, Jl Jend Sudirman Kav 33A, Jakarta 10220, Indonesia
Tel (62) 21 5790 0800 Fax: (62) 21 5790 0809 www.phillip.co.id
CHINA Phillip Financial Advisory (Shanghai) Co. Ltd.
No 550 Yan An East Road, Ocean Tower Unit 2318 Shanghai 200 001
Tel (86) 21 5169 9200 Fax: (86) 21 6351 2940 www.phillip.com.cn
THAILAND Phillip Securities (Thailand) Public Co. Ltd.
15th Floor, Vorawat Building, 849 Silom Road, Silom, Bangrak, Bangkok 10500 Thailand
Tel (66) 2 2268 0999 Fax: (66) 2 2268 0921 www.phillip.co.th
FRANCE King & Shaxson Capital Ltd.
3rd Floor, 35 Rue de la Bienfaisance 75008 Paris France
Tel (33) 1 4563 3100 Fax : (33) 1 4563 6017 www.kingandshaxson.com
UNITED KINGDOM King & Shaxson Ltd.
6th Floor, Candlewick House, 120 Cannon Street London, EC4N 6AS
Tel (44) 20 7929 5300 Fax: (44) 20 7283 6835 www.kingandshaxson.com
UNITED STATES Phillip Futures Inc.
141 W Jackson Blvd Ste 3050 The Chicago Board of Trade Building
Chicago, IL 60604 USA Tel (1) 312 356 9000 Fax: (1) 312 356 9005
AUSTRALIA PhillipCapital Australia
Level 37, 530 Collins Street Melbourne, Victoria 3000, Australia
Tel: (61) 3 9629 8380 Fax: (61) 3 9614 8309 www.phillipcapital.com.au
SRI LANKA Asha Phillip Securities Limited
Level 4, Millennium House, 46/58 Navam Mawatha, Colombo 2, Sri Lanka
Tel: (94) 11 2429 100 Fax: (94) 11 2429 199 www.ashaphillip.net/home.htm
INDIA PhillipCapital (India) Private Limited
No. 1, 18th Floor, Urmi Estate, 95 Ganpatrao Kadam Marg, Lower Parel West, Mumbai 400013 Tel: (9122) 2300 2999 Fax: (9122) 6667 9955 www.phillipcapital.in
Management (91 22) 2300 2999
Kinshuk Bharti Tiwari (Head – Institutional Equity) (91 22) 6667 9946(91 22) 6667 9735
Research Engineering, Capital Goods Pharma
Dhawal Doshi (9122) 6667 9769 Ankur Sharma (9122) 6667 9759 Surya Patra (9122) 6667 9768Priya Ranjan (9122) 6667 9965 Hrishikesh Bhagat (9122) 6667 9986 Mehul Sheth (9122) 6667 9996
Infrastructure & IT Services Retail, Real EstateManish Agarwalla (9122) 6667 9962 Vibhor Singhal (9122) 6667 9949 Abhishek Ranganathan, CFA (9122) 6667 9952Pradeep Agrawal (9122) 6667 9953 Deepan Kapadia (9122) 6667 9992Paresh Jain (9122) 6667 9948 Portfolio Strategy
Midcap Anindya Bhowmik (9122) 6667 9764Consumer, Media, Telecom Vikram Suryavanshi (9122) 6667 9951Naveen Kulkarni, CFA, FRM (9122) 6667 9947 TechnicalsJubil Jain (9122) 6667 9766 Metals Subodh Gupta, CMT (9122) 6667 9762Manoj Behera (9122) 6667 9973 Dhawal Doshi (9122) 6667 9769
Ankit Gor (9122) 6667 9987 Production ManagerCement Ganesh Deorukhkar (9122) 6667 9966Vaibhav Agarwal (9122) 6667 9967 Oil&Gas, Agri Inputs
Gauri Anand (9122) 6667 9943 Database ManagerEconomics Deepak Pareek (9122) 6667 9950 Deepak Agarwal (9122) 6667 9944Anjali Verma (9122) 6667 9969
Sr. Manager – Equities SupportRosie Ferns (9122) 6667 9971
Sales & Distribution Ashvin Patil (9122) 6667 9991 Sales Trader Zarine Damania (9122) 6667 9976Shubhangi Agrawal (9122) 6667 9964 Dilesh Doshi (9122) 6667 9747 Kishor Binwal (9122) 6667 9989 Suniil Pandit (9122) 6667 9745Sidharth Agrawal (9122) 6667 9934 ExecutionBhavin Shah (9122) 6667 9974 Mayur Shah (9122) 6667 9945
Corporate Communications
Vineet Bhatnagar (Managing Director)
Jignesh Shah (Head – Equity Derivatives)
Automobiles
Banking, NBFCs

Page | 56 | PHILLIPCAPITAL INDIA RESEARCH
NBFC SECTOR
Disclosures and Disclaimers PhillipCapital (India) Pvt. Ltd. has three independent equity research groups: Institutional Equities, Institutional Equity Derivatives and Private Client Group. This report has been prepared by Institutional Equities Group. The views and opinions expressed in this document may or may not match or may be contrary at times with the views, estimates, rating, target price of the other equity research groups of PhillipCapital (India) Pvt. Ltd. This report is issued by PhillipCapital (India) Pvt. Ltd. which is regulated by SEBI. PhillipCapital (India) Pvt. Ltd. is a subsidiary of Phillip (Mauritius) Pvt. Ltd. References to "PCIPL" in this report shall mean PhillipCapital (India) Pvt. Ltd unless otherwise stated. This report is prepared and distributed by PCIPL for information purposes only and neither the information contained herein nor any opinion expressed should be construed or deemed to be construed as solicitation or as offering advice for the purposes of the purchase or sale of any security, investment or derivatives. The information and opinions contained in the Report were considered by PCIPL to be valid when published. The report also contains information provided to PCIPL by third parties. The source of such information will usually be disclosed in the report. Whilst PCIPL has taken all reasonable steps to ensure that this information is correct, PCIPL does not offer any warranty as to the accuracy or completeness of such information. Any person placing reliance on the report to undertake trading does so entirely at his or her own risk and PCIPL does not accept any liability as a result. Securities and Derivatives markets may be subject to rapid and unexpected price movements and past performance is not necessarily an indication to future performance. This report does not have regard to the specific investment objectives, financial situation and the particular needs of any specific person who may receive this report. Investors must undertake independent analysis with their own legal, tax and financial advisors and reach their own regarding the appropriateness of investing in any securities or investment strategies discussed or recommended in this report and should understand that statements regarding future prospects may not be realized. In no circumstances it be used or considered as an offer to sell or a solicitation of any offer to buy or sell the Securities mentioned in it. The information contained in the research reports may have been taken from trade and statistical services and other sources, which we believe are reliable. PhillipCapital (India) Pvt. Ltd. or any of its group/associate/affiliate companies do not guarantee that such information is accurate or complete and it should not be relied upon as such. Any opinions expressed reflect judgments at this date and are subject to change without notice Important: These disclosures and disclaimers must be read in conjunction with the research report of which it forms part. Receipt and use of the research report is subject to all aspects of these disclosures and disclaimers. Additional information about the issuers and securities discussed in this research report is available on request. Certifications: The research analyst(s) who prepared this research report hereby certifies that the views expressed in this research report accurately reflect the research analyst’s personal views about all of the subject issuers and/or securities, that the analyst have no known conflict of interest and no part of the research analyst’s compensation was, is or will be, directly or indirectly, related to the specific views or recommendations contained in this research report. The Research Analyst certifies that he /she or his / her family members does not own the stock(s) covered in this research report. Independence/Conflict: PhillipCapital (India) Pvt. Ltd. has not had an investment banking relationship with, and has not received any compensation for investment banking services from, the subject issuers in the past twelve (12) months, and PhillipCapital (India) Pvt. Ltd does not anticipate receiving or intend to seek compensation for investment banking services from the subject issuers in the next three (3) months. PhillipCapital (India) Pvt. Ltd is not a market maker in the securities mentioned in this research report, although it or its employees, directors, or affiliates may hold either long or short positions in such securities. PhillipCapital (India) Pvt. Ltd may not hold more than 1% of the shares of the company(ies) covered in this report. Suitability and Risks: This research report is for informational purposes only and is not tailored to the specific investment objectives, financial situation or particular requirements of any individual recipient hereof. Certain securities may give rise to substantial risks and may not be suitable for certain investors. Each investor must make its own determination as to the appropriateness of any securities referred to in this research report based upon the legal, tax and accounting considerations applicable to such investor and its own investment objectives or strategy, its financial situation and its investing experience. The value of any security may be positively or adversely affected by changes in foreign exchange or interest rates, as well as by other financial, economic or political factors. Past performance is not necessarily indicative of future performance or results. Sources, Completeness and Accuracy: The material herein is based upon information obtained from sources that PCIPL and the research analyst believe to be reliable, but neither PCIPL nor the research analyst represents or guarantees that the information contained herein is accurate or complete and it should not be relied upon as such. Opinions expressed herein are current opinions as of the date appearing on this material and are subject to change without notice. Furthermore, PCIPL is under no obligation to update or keep the information current. Copyright: The copyright in this research report belongs exclusively to PCIPL. All rights are reserved. Any unauthorized use or disclosure is prohibited. No reprinting or reproduction, in whole or in part, is permitted without the PCIPL’s prior consent, except that a recipient may reprint it for internal circulation only and only if it is reprinted in its entirety. Caution: Risk of loss in trading in can be substantial. You should carefully consider whether trading is appropriate for you in light of your experience, objectives, financial resources and other relevant circumstances. For U.S. persons only: This research report is a product of PhillipCapital (India) Pvt Ltd. which is the employer of the research analyst(s) who has prepared the research report. The research analyst(s) preparing the research report is/are resident outside the United States (U.S.) and are not associated persons of any U.S. regulated broker‐dealer and therefore the analyst(s) is/are not subject to supervision by a U.S. broker‐dealer, and is/are not required to satisfy the regulatory licensing requirements of FINRA or required to otherwise comply with U.S. rules or regulations regarding, among other things, communications with a subject company, public appearances and trading securities held by a research analyst account. This report is intended for distribution by PhillipCapital (India) Pvt Ltd. only to "Major Institutional Investors" as defined by Rule 15a‐6(b)(4) of the U.S. Securities and Exchange Act, 1934 (the Exchange Act) and interpretations thereof by U.S. Securities and Exchange Commission (SEC) in reliance on Rule 15a 6(a)(2). If the recipient of this report is not a Major Institutional Investor as specified above, then it should not act upon this report and return the same to the sender. Further, this report may not be copied, duplicated and/or transmitted onward to any U.S. person, which is not the Major Institutional Investor. In reliance on the exemption from registration provided by Rule 15a‐6 of the Exchange Act and interpretations thereof by the SEC in order to conduct certain business with Major Institutional Investors, PhillipCapital (India) Pvt Ltd. has entered into an agreement with a U.S. registered broker‐dealer, Marco Polo Securities Inc. ("Marco Polo").Transactions in securities discussed in this research report should be effected through Marco Polo or another U.S. registered broker dealer. PhillipCapital (India) Pvt. Ltd. Registered office: No. 1, 18th Floor, Urmi Estate, 95 Ganpatrao Kadam Marg, Lower Parel West, Mumbai 400013