Embed Size (px)
Citation preview

Institutional Effects on Software Metrics Programs: A Structural Equation Model
Anand GopalRobert H. Smith School of Business
University of Maryland – College Park
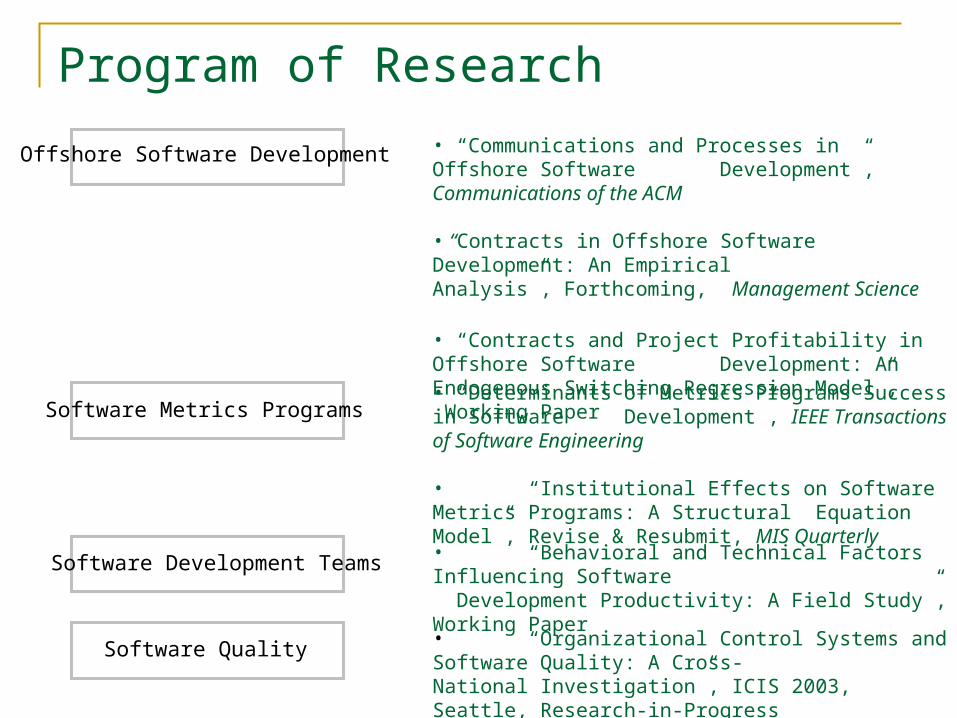
Program of Research
Offshore Software Development
Software Metrics Programs
Software Development Teams
• “Communications and Processes in Offshore Software Development”, Communications of the ACM
• “Contracts in Offshore Software Development: An Empirical Analysis”, Forthcoming, Management Science
• “Contracts and Project Profitability in Offshore Software Development: An Endogenous Switching Regression Model”, Working Paper
• “Determinants of Metrics Programs Success in Software Development”, IEEE Transactions of Software Engineering
• “Institutional Effects on Software Metrics Programs: A Structural Equation Model”, Revise & Resubmit, MIS Quarterly
• “Behavioral and Technical Factors Influencing Software Development Productivity: A Field Study”, Working Paper
Software Quality• “Organizational Control Systems and Software Quality: A Cross-
National Investigation”, ICIS 2003, Seattle, Research-in-Progress
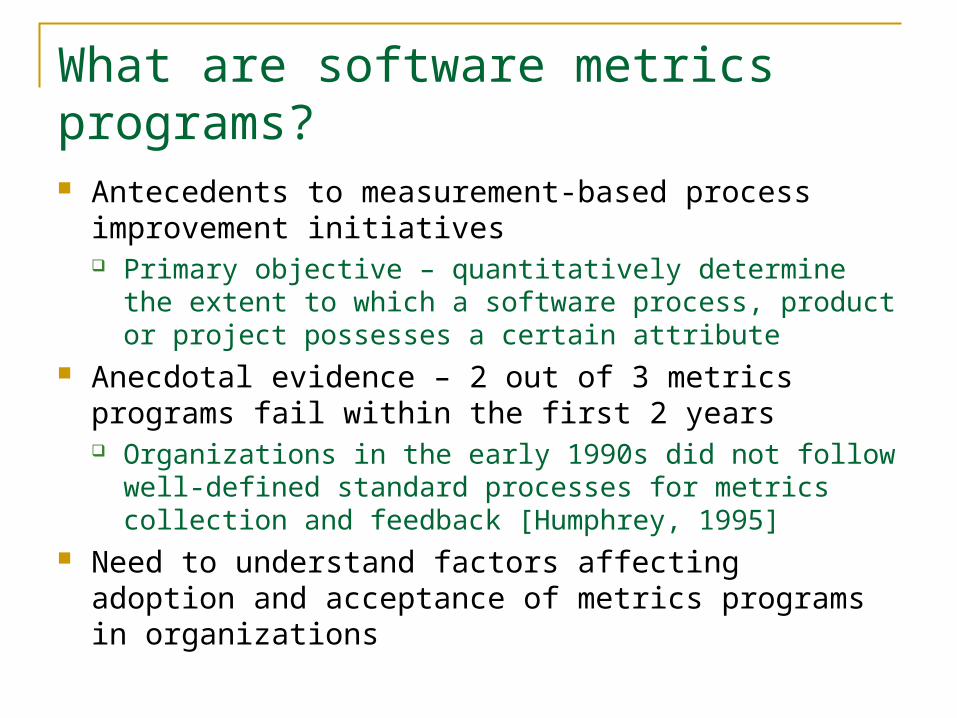
What are software metrics programs? Antecedents to measurement-based process
improvement initiatives Primary objective – quantitatively determine the extent to
which a software process, product or project possesses a certain attribute
Anecdotal evidence – 2 out of 3 metrics programs fail within the first 2 years Organizations in the early 1990s did not follow well-defined
standard processes for metrics collection and feedback [Humphrey, 1995]
Need to understand factors affecting adoption and acceptance of metrics programs in organizations
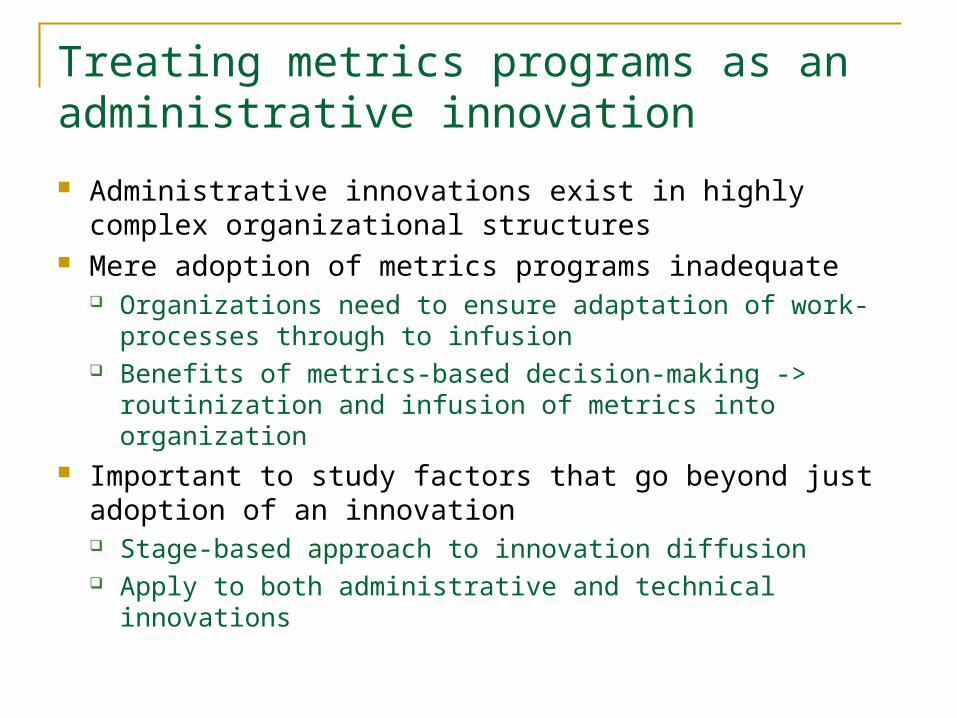
Treating metrics programs as an administrative innovation
Administrative innovations exist in highly complex organizational structures
Mere adoption of metrics programs inadequate Organizations need to ensure adaptation of work-processes
through to infusion Benefits of metrics-based decision-making -> routinization
and infusion of metrics into organization Important to study factors that go beyond just adoption of
an innovation Stage-based approach to innovation diffusion Apply to both administrative and technical innovations
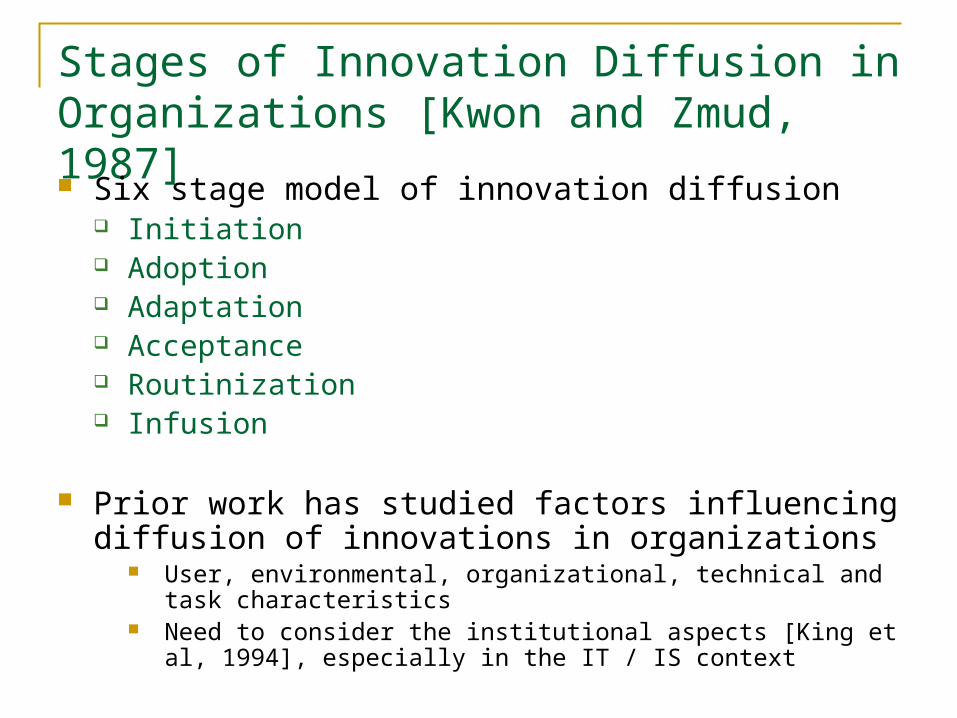
Stages of Innovation Diffusion in Organizations [Kwon and Zmud, 1987]
Six stage model of innovation diffusion Initiation Adoption Adaptation Acceptance Routinization Infusion
Prior work has studied factors influencing diffusion of innovations in organizations
User, environmental, organizational, technical and task characteristics
Need to consider the institutional aspects [King et al, 1994], especially in the IT / IS context
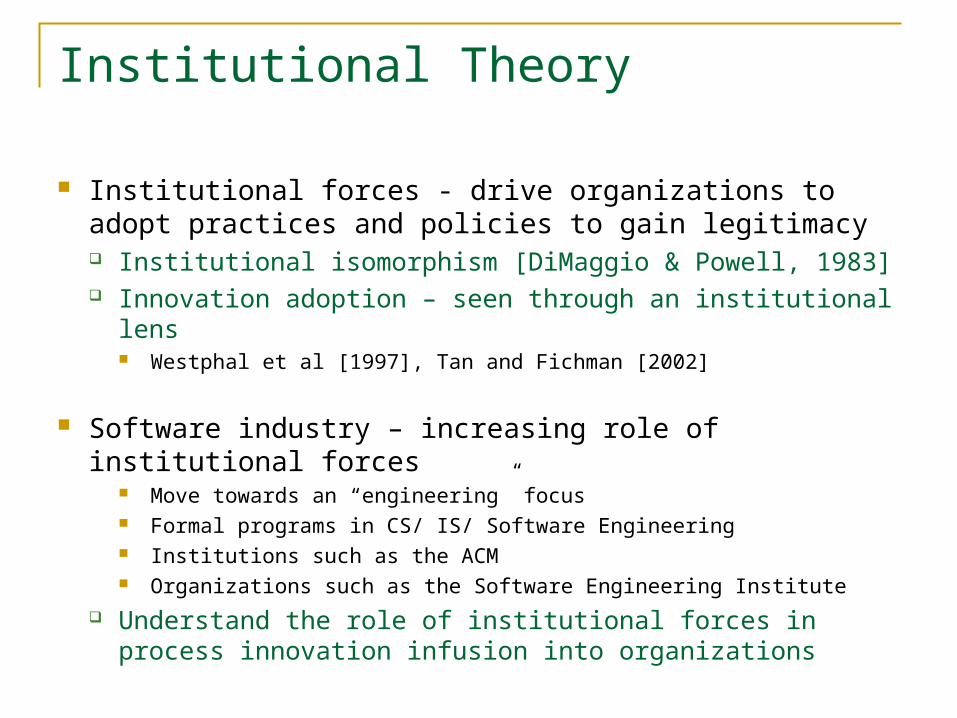
Institutional Theory
Institutional forces - drive organizations to adopt practices and policies to gain legitimacy Institutional isomorphism [DiMaggio & Powell, 1983] Innovation adoption – seen through an institutional lens
Westphal et al [1997], Tan and Fichman [2002]
Software industry – increasing role of institutional forces Move towards an “engineering” focus Formal programs in CS/ IS/ Software Engineering Institutions such as the ACM Organizations such as the Software Engineering Institute
Understand the role of institutional forces in process innovation infusion into organizations
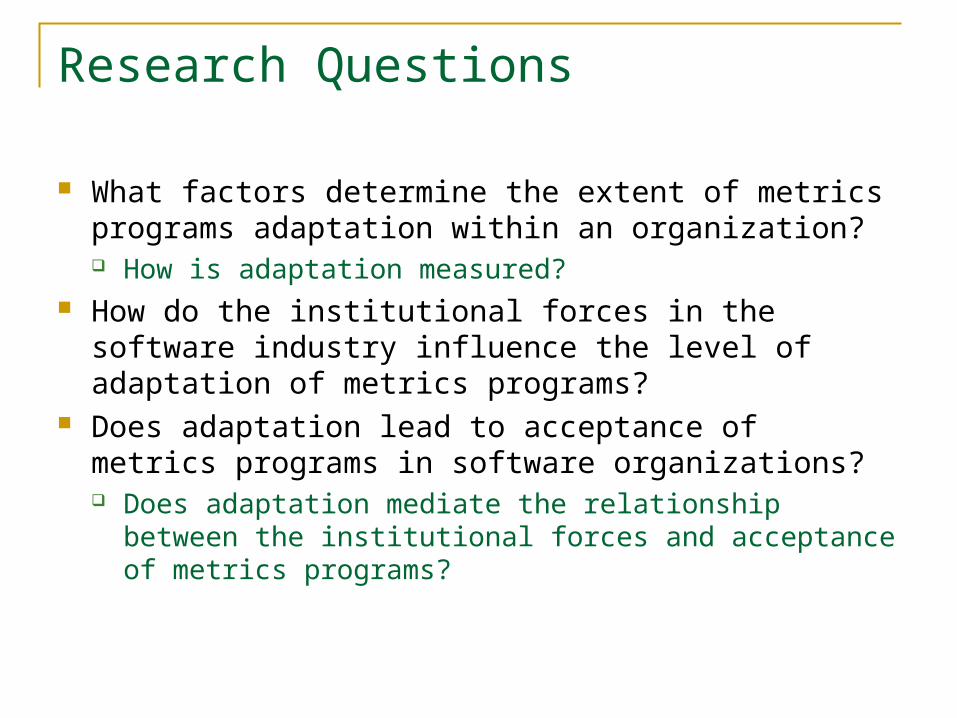
Research Questions
What factors determine the extent of metrics programs adaptation within an organization? How is adaptation measured?
How do the institutional forces in the software industry influence the level of adaptation of metrics programs?
Does adaptation lead to acceptance of metrics programs in software organizations? Does adaptation mediate the relationship between the
institutional forces and acceptance of metrics programs?
Background Theory
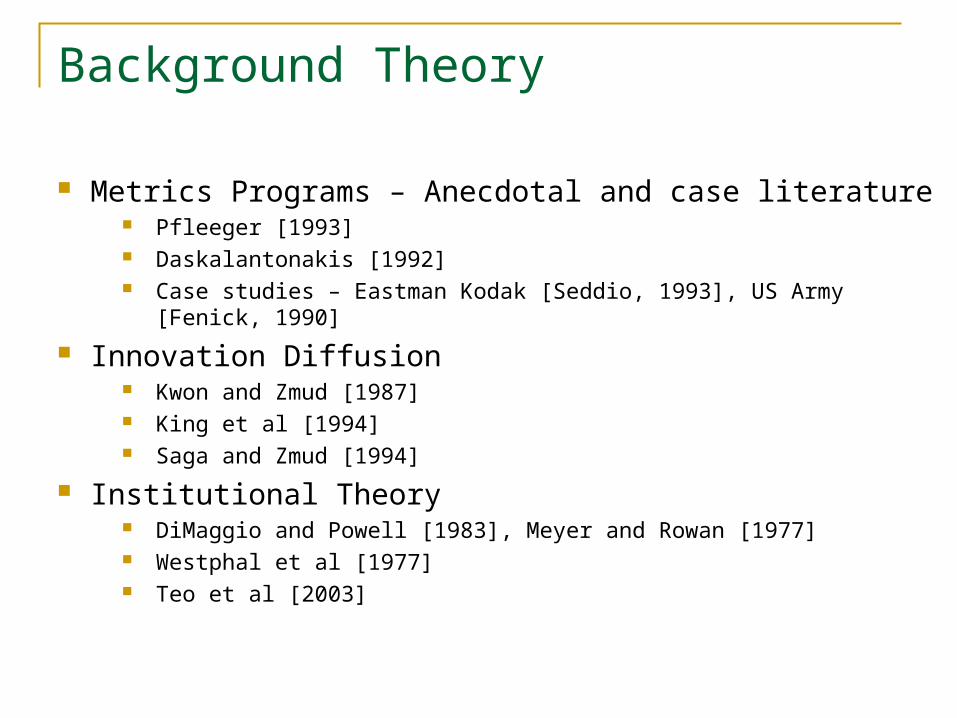
Metrics Programs – Anecdotal and case literature Pfleeger [1993] Daskalantonakis [1992] Case studies – Eastman Kodak [Seddio, 1993], US Army [Fenick, 1990]
Innovation Diffusion Kwon and Zmud [1987] King et al [1994] Saga and Zmud [1994]
Institutional Theory DiMaggio and Powell [1983], Meyer and Rowan [1977] Westphal et al [1977] Teo et al [2003]
Research Hypotheses
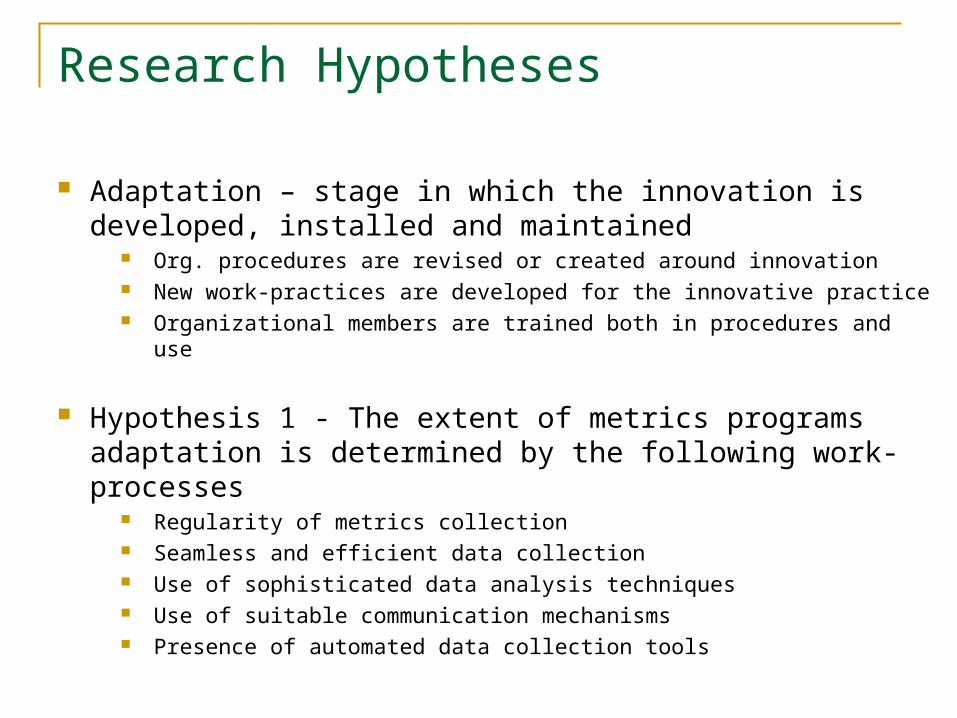
Adaptation – stage in which the innovation is developed, installed and maintained
Org. procedures are revised or created around innovation New work-practices are developed for the innovative practice Organizational members are trained both in procedures and use
Hypothesis 1 - The extent of metrics programs adaptation is determined by the following work-processes
Regularity of metrics collection Seamless and efficient data collection Use of sophisticated data analysis techniques Use of suitable communication mechanisms Presence of automated data collection tools
Research Hypotheses
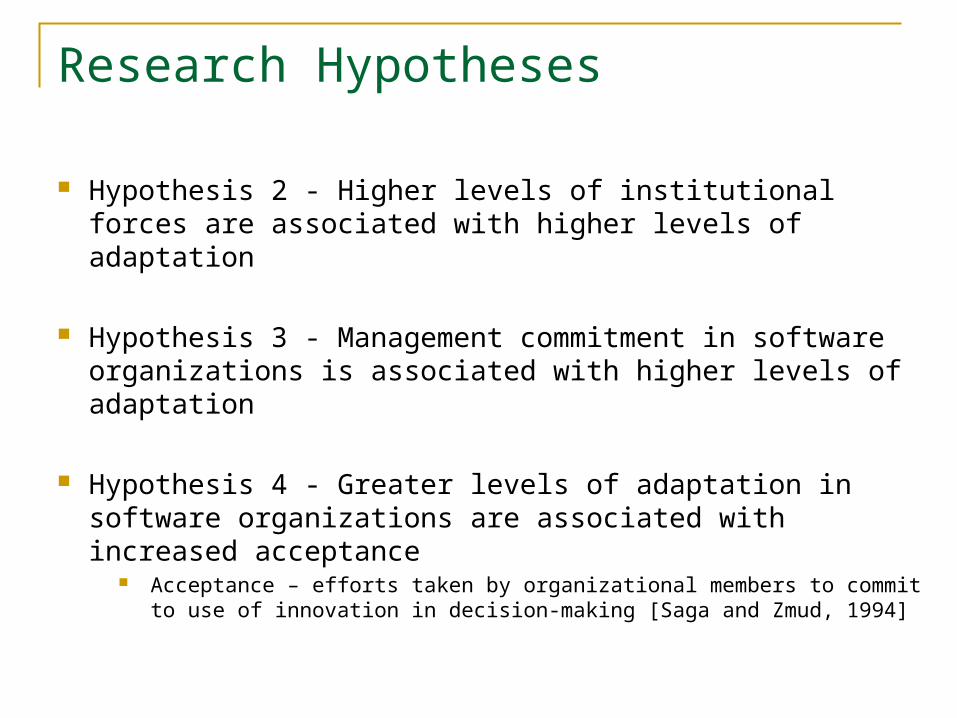
Hypothesis 2 - Higher levels of institutional forces are associated with higher levels of adaptation
Hypothesis 3 - Management commitment in software organizations is associated with higher levels of adaptation
Hypothesis 4 - Greater levels of adaptation in software organizations are associated with increased acceptance
Acceptance – efforts taken by organizational members to commit to use of innovation in decision-making [Saga and Zmud, 1994]
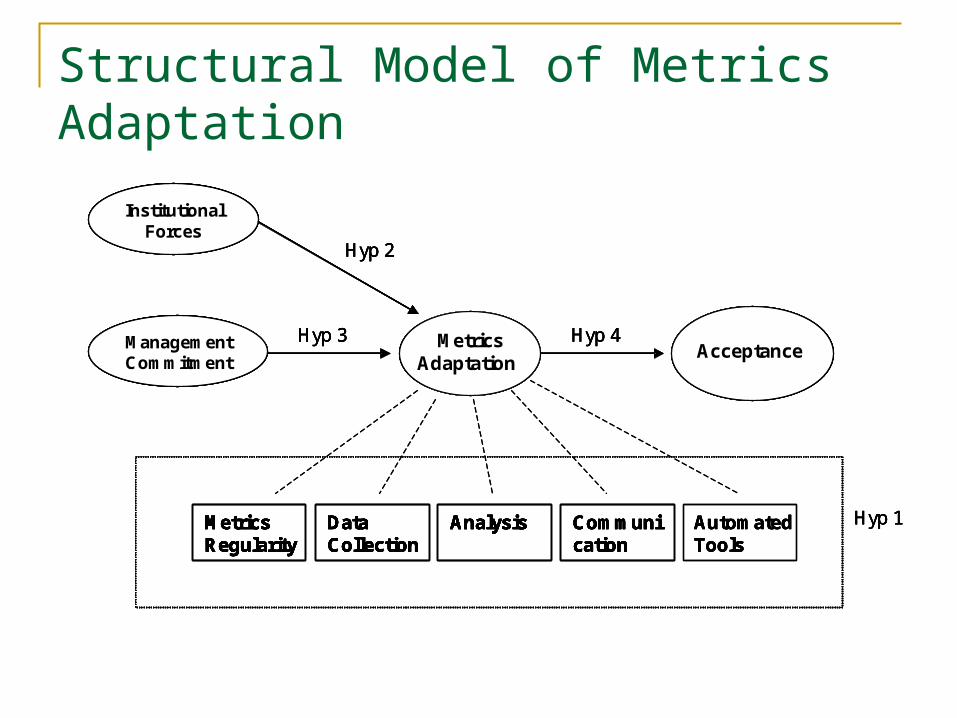
Structural Model of Metrics Adaptation
Institutional Forces
ManagementCommitment
Usage in Decision Making
Metrics Infusion
Metrics Regularity
Data Collection
Analysis Communication
AutomatedTools
Hyp 1
Hyp 3
Hyp 2
Hyp 4
Institutional Forces
ManagementCommitment
Metrics Adaptation
Metrics RegularityMetrics Regularity
Data CollectionData Collection
AnalysisAnalysis CommunicationCommunication
AutomatedTools
Hyp 1
Hyp 3
Hyp 2
Hyp 4Acceptance
Institutional Forces
ManagementCommitment
Usage in Decision Making
Metrics Infusion
Metrics RegularityMetrics Regularity
Data CollectionData Collection
AnalysisAnalysis CommunicationCommunication
AutomatedTools
Hyp 1
Hyp 3
Hyp 2
Hyp 4
Institutional Forces
ManagementCommitment
Metrics Adaptation
Metrics RegularityMetrics Regularity
Data CollectionData Collection
AnalysisAnalysis CommunicationCommunication
AutomatedTools
Hyp 1
Hyp 3
Hyp 2
Hyp 4Acceptance
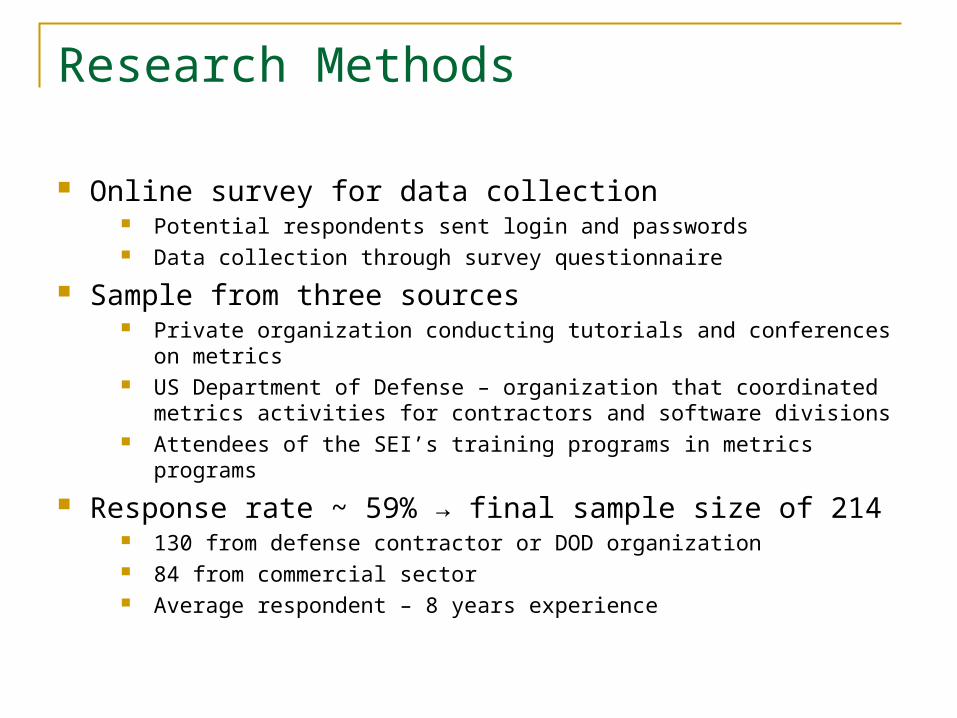
Research Methods
Online survey for data collection Potential respondents sent login and passwords Data collection through survey questionnaire
Sample from three sources Private organization conducting tutorials and conferences on metrics US Department of Defense – organization that coordinated metrics
activities for contractors and software divisions Attendees of the SEI’s training programs in metrics programs
Response rate ~ 59% → final sample size of 214 130 from defense contractor or DOD organization 84 from commercial sector Average respondent – 8 years experience
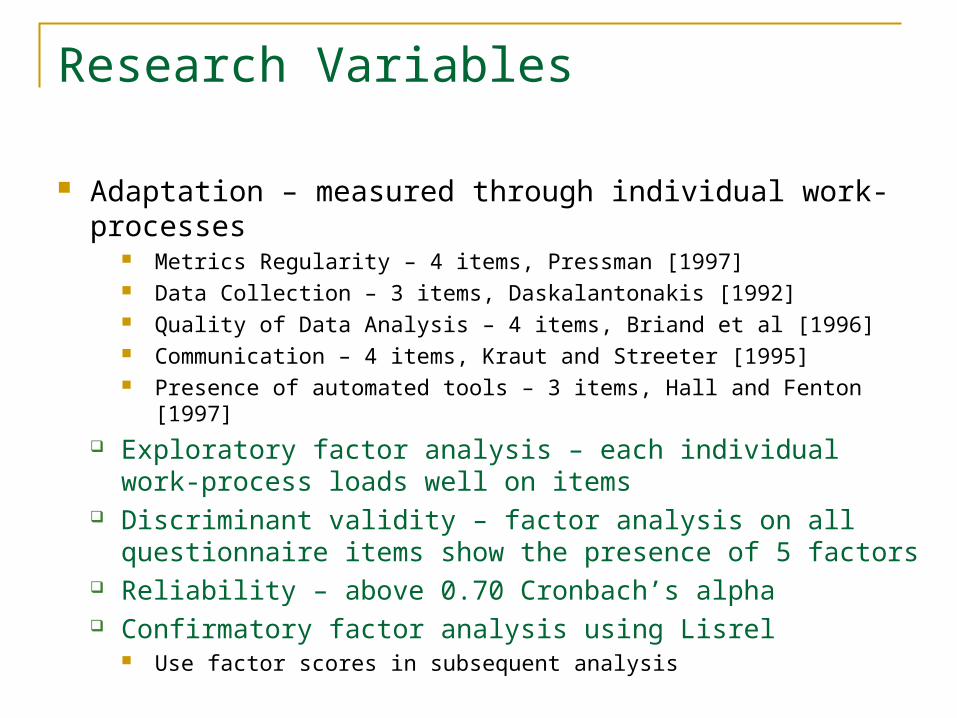
Research Variables
Adaptation – measured through individual work-processes Metrics Regularity – 4 items, Pressman [1997] Data Collection – 3 items, Daskalantonakis [1992] Quality of Data Analysis – 4 items, Briand et al [1996] Communication – 4 items, Kraut and Streeter [1995] Presence of automated tools – 3 items, Hall and Fenton [1997]
Exploratory factor analysis – each individual work-process loads well on items
Discriminant validity – factor analysis on all questionnaire items show the presence of 5 factors
Reliability – above 0.70 Cronbach’s alpha Confirmatory factor analysis using Lisrel
Use factor scores in subsequent analysis
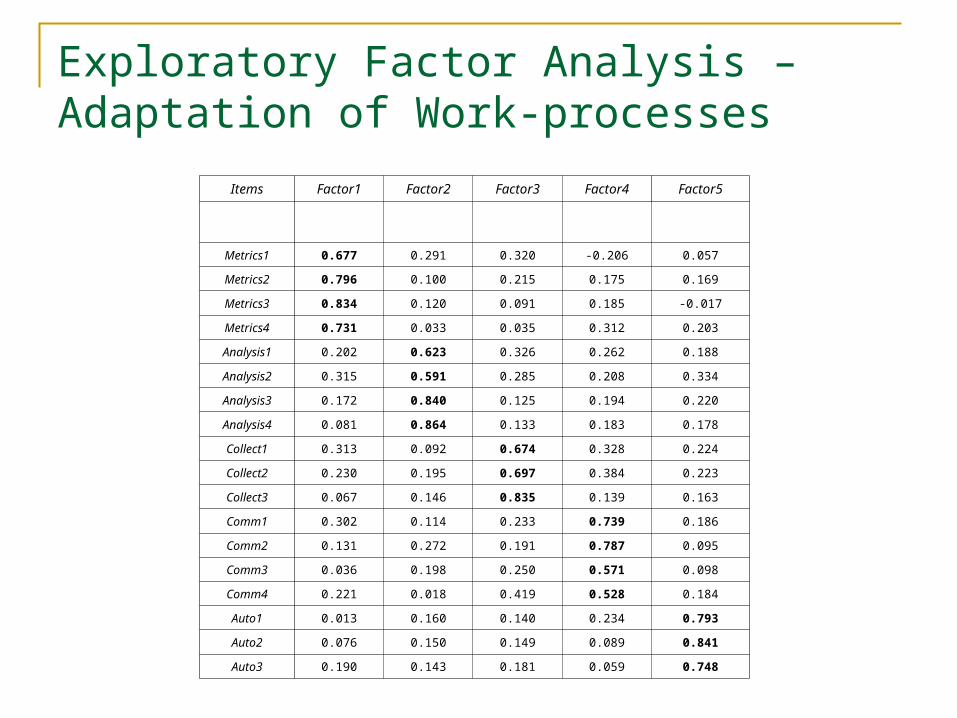
Exploratory Factor Analysis – Adaptation of Work-processes
Items Factor1 Factor2 Factor3 Factor4 Factor5
Metrics1 0.677 0.291 0.320 -0.206 0.057
Metrics2 0.796 0.100 0.215 0.175 0.169
Metrics3 0.834 0.120 0.091 0.185 -0.017
Metrics4 0.731 0.033 0.035 0.312 0.203
Analysis1 0.202 0.623 0.326 0.262 0.188
Analysis2 0.315 0.591 0.285 0.208 0.334
Analysis3 0.172 0.840 0.125 0.194 0.220
Analysis4 0.081 0.864 0.133 0.183 0.178
Collect1 0.313 0.092 0.674 0.328 0.224
Collect2 0.230 0.195 0.697 0.384 0.223
Collect3 0.067 0.146 0.835 0.139 0.163
Comm1 0.302 0.114 0.233 0.739 0.186
Comm2 0.131 0.272 0.191 0.787 0.095
Comm3 0.036 0.198 0.250 0.571 0.098
Comm4 0.221 0.018 0.419 0.528 0.184
Auto1 0.013 0.160 0.140 0.234 0.793
Auto2 0.076 0.150 0.149 0.089 0.841
Auto3 0.190 0.143 0.181 0.059 0.748
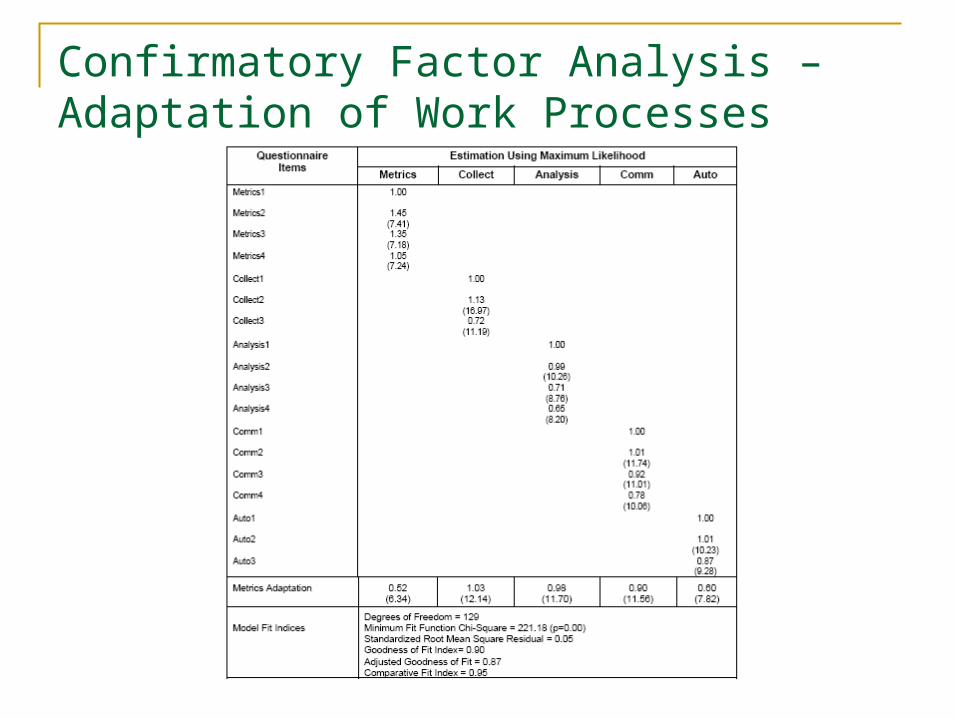
Confirmatory Factor Analysis – Adaptation of Work Processes
Research Variables
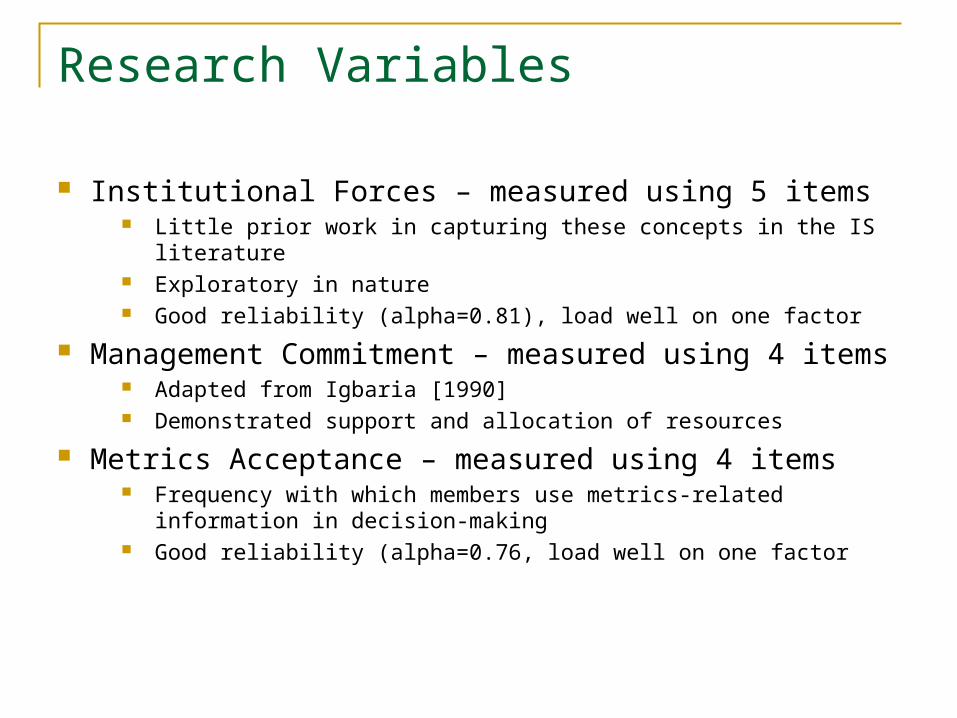
Institutional Forces – measured using 5 items Little prior work in capturing these concepts in the IS literature Exploratory in nature Good reliability (alpha=0.81), load well on one factor
Management Commitment – measured using 4 items Adapted from Igbaria [1990] Demonstrated support and allocation of resources
Metrics Acceptance – measured using 4 items Frequency with which members use metrics-related information in
decision-making Good reliability (alpha=0.76, load well on one factor
Data Analysis
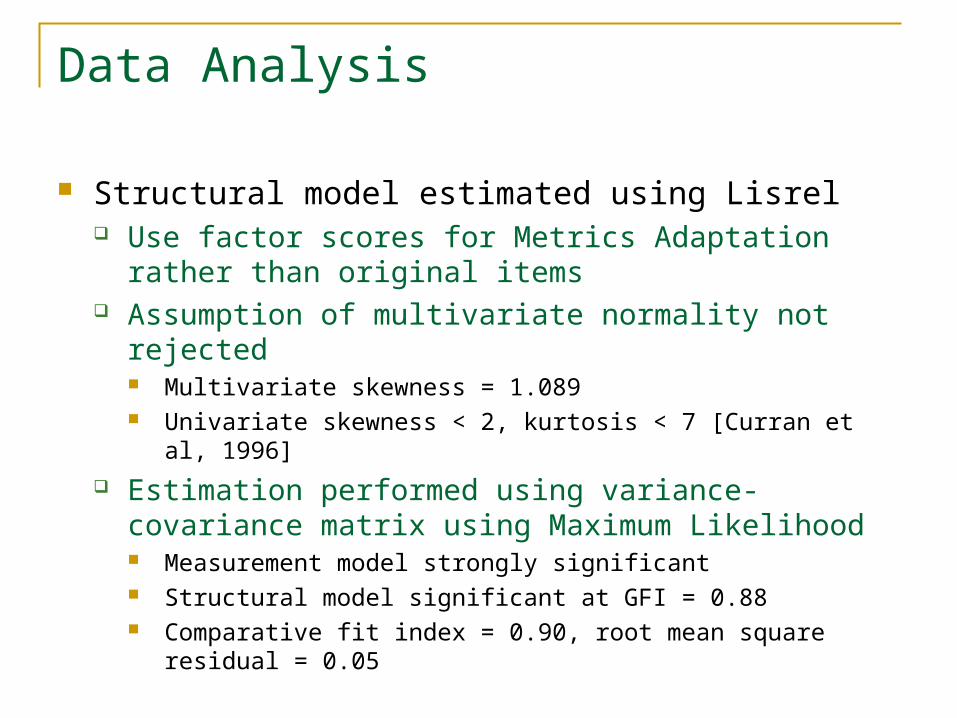
Structural model estimated using Lisrel Use factor scores for Metrics Adaptation rather than
original items Assumption of multivariate normality not rejected
Multivariate skewness = 1.089 Univariate skewness < 2, kurtosis < 7 [Curran et al, 1996]
Estimation performed using variance-covariance matrix using Maximum Likelihood Measurement model strongly significant Structural model significant at GFI = 0.88 Comparative fit index = 0.90, root mean square residual = 0.05
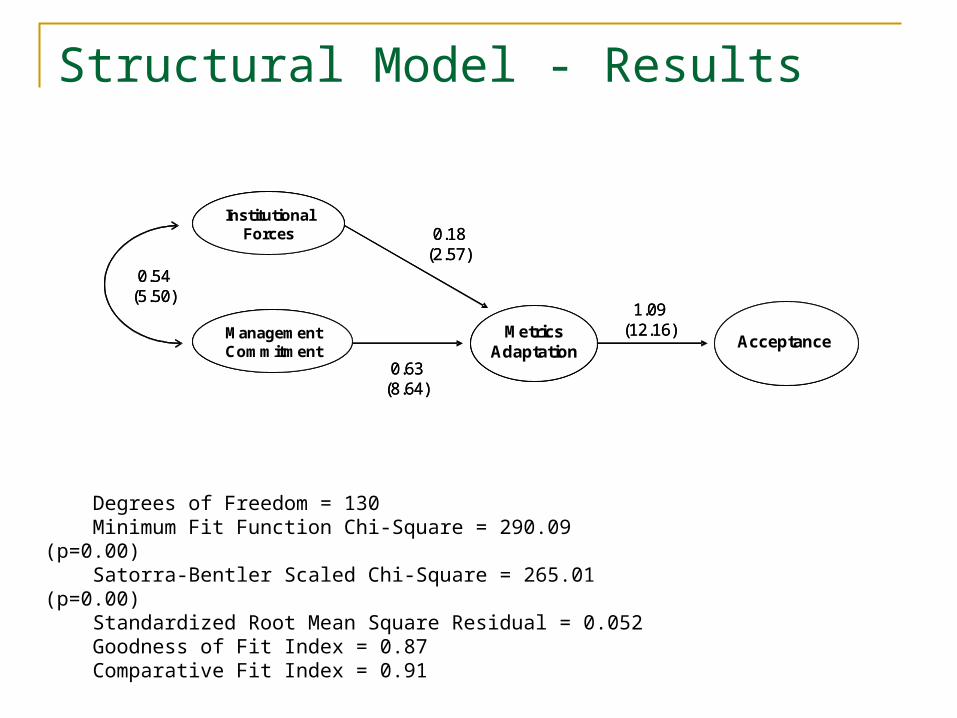
Structural Model - Results
Institutional Forces
ManagementCommitment
Metrics Adaptation
1.09(12.16)
0.18(2.57)
0.63(8.64)
0.54(5.50)
Acceptance
Institutional Forces
ManagementCommitment
Metrics Adaptation
1.09(12.16)
0.18(2.57)
0.63(8.64)
0.54(5.50)
Acceptance
Degrees of Freedom = 130Minimum Fit Function Chi-Square = 290.09
(p=0.00)Satorra-Bentler Scaled Chi-Square = 265.01
(p=0.00)Standardized Root Mean Square Residual =
0.052Goodness of Fit Index = 0.87Comparative Fit Index = 0.91
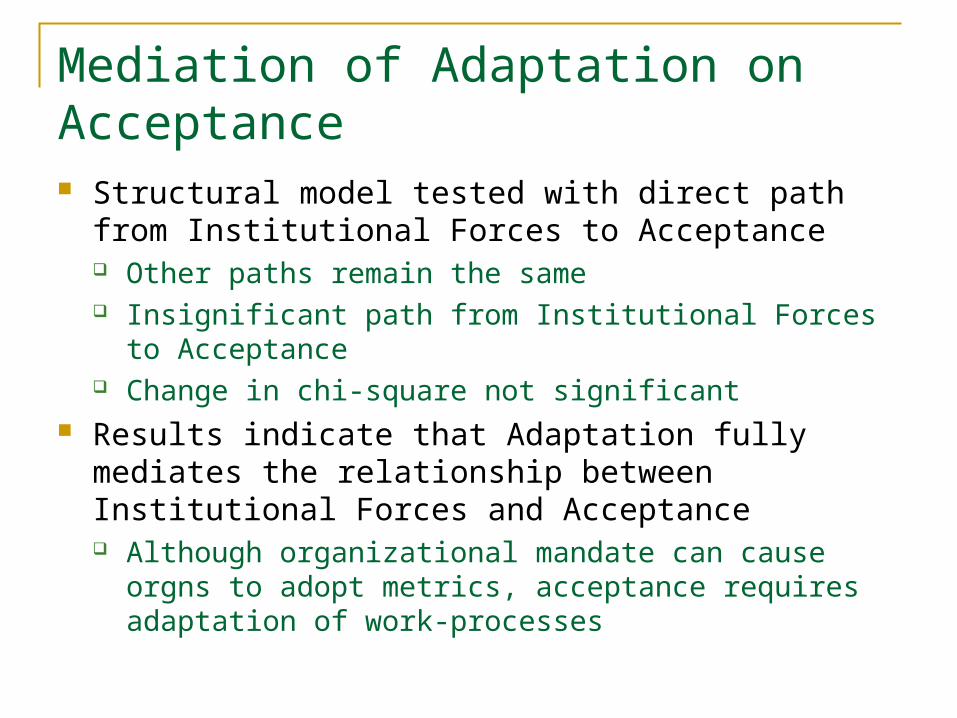
Mediation of Adaptation on Acceptance Structural model tested with direct path from Institutional
Forces to Acceptance Other paths remain the same Insignificant path from Institutional Forces to Acceptance Change in chi-square not significant
Results indicate that Adaptation fully mediates the relationship between Institutional Forces and Acceptance Although organizational mandate can cause orgns to adopt
metrics, acceptance requires adaptation of work-processes
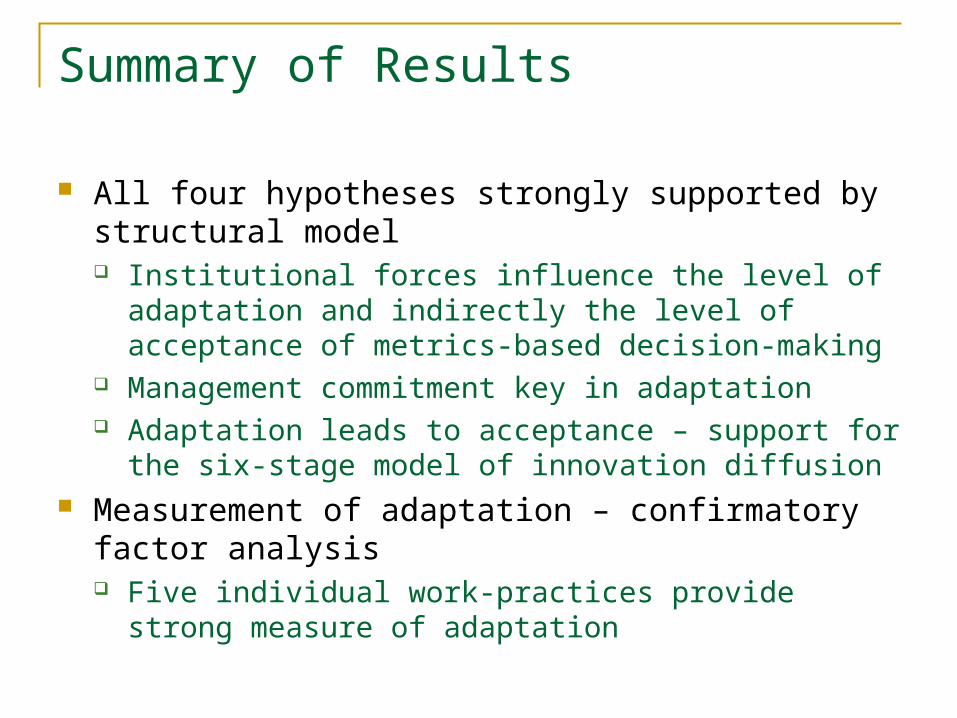
Summary of Results
All four hypotheses strongly supported by structural model Institutional forces influence the level of adaptation and
indirectly the level of acceptance of metrics-based decision-making
Management commitment key in adaptation Adaptation leads to acceptance – support for the six-stage
model of innovation diffusion Measurement of adaptation – confirmatory factor
analysis Five individual work-practices provide strong measure of
adaptation
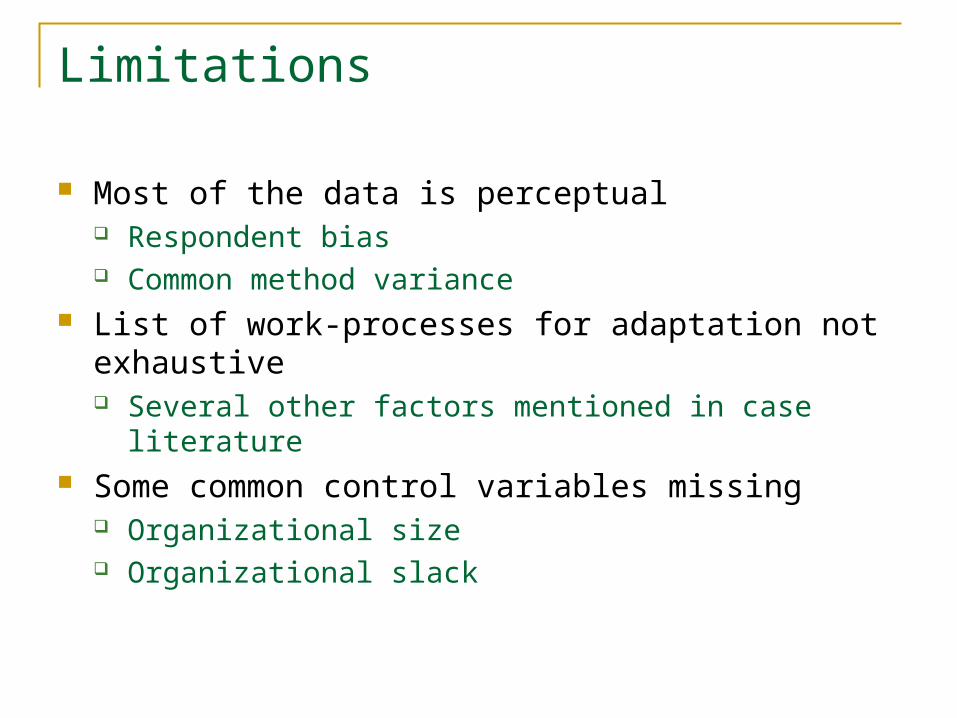
Limitations
Most of the data is perceptual Respondent bias Common method variance
List of work-processes for adaptation not exhaustive Several other factors mentioned in case literature
Some common control variables missing Organizational size Organizational slack
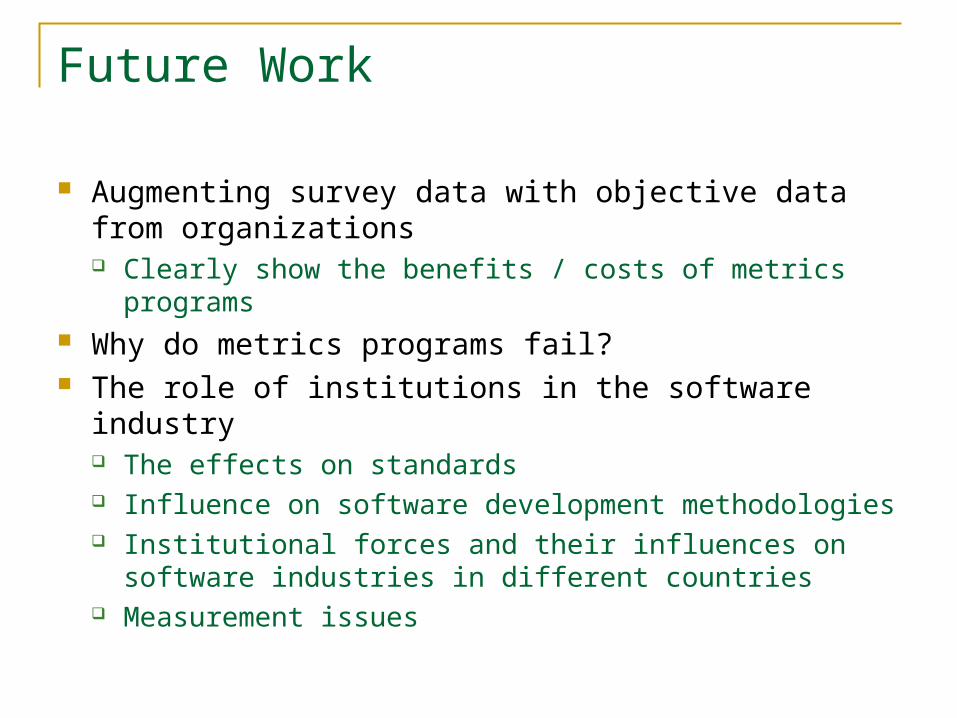
Future Work
Augmenting survey data with objective data from organizations Clearly show the benefits / costs of metrics programs
Why do metrics programs fail? The role of institutions in the software industry
The effects on standards Influence on software development methodologies Institutional forces and their influences on software
industries in different countries Measurement issues
Institutional Effects on Software Metrics Programs: A Structural Equation Model
Anand GopalRobert H. Smith School of Business
University of Maryland – College Park
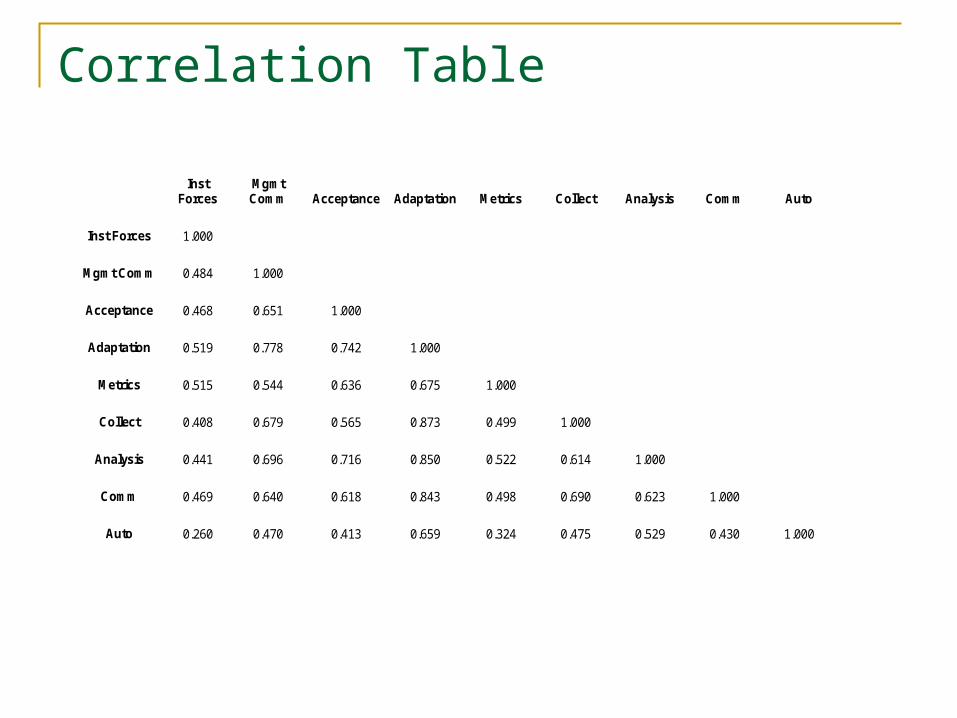
Correlation Table
Inst
Forces Mgmt Comm Acceptance Adaptation Metrics Collect Analysis Comm Auto
Inst Forces 1.000
Mgmt Comm 0.484 1.000
Acceptance 0.468 0.651 1.000
Adaptation 0.519 0.778 0.742 1.000
Metrics 0.515 0.544 0.636 0.675 1.000
Collect 0.408 0.679 0.565 0.873 0.499 1.000
Analysis 0.441 0.696 0.716 0.850 0.522 0.614 1.000
Comm 0.469 0.640 0.618 0.843 0.498 0.690 0.623 1.000
Auto 0.260 0.470 0.413 0.659 0.324 0.475 0.529 0.430 1.000
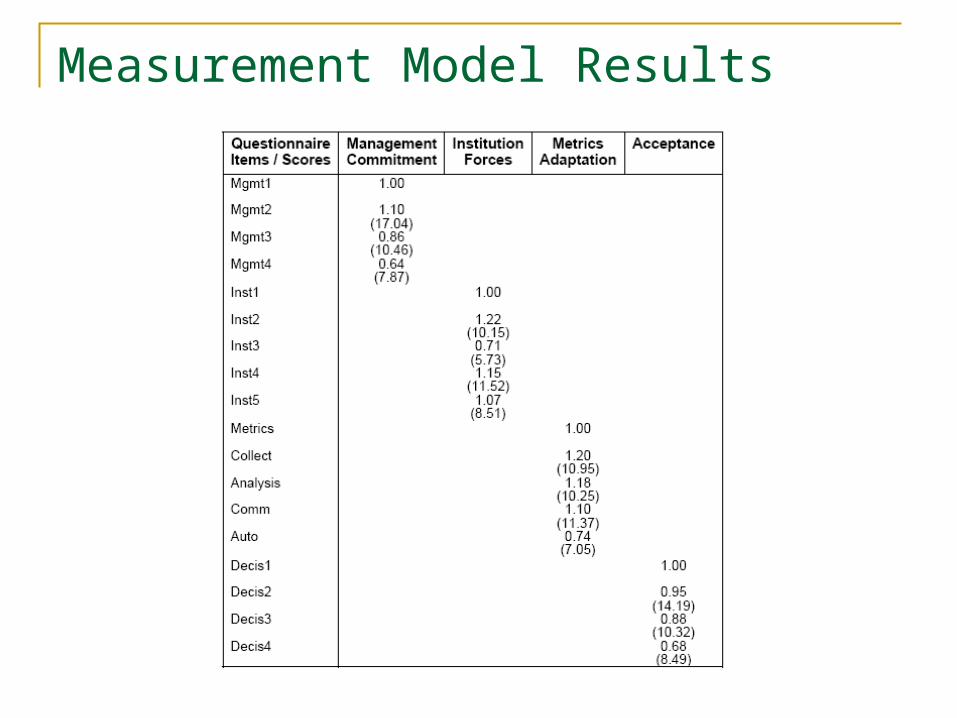
Measurement Model Results