Embed Size (px)
Citation preview

Inpatient Preanalytic Process ImprovementsElizabeth A. Wagar, MD; Ron Phipps, MBA, BS; Robert Del Guidice, MBA; Lavinia P. Middleton, MD; John Bingham, MHA;
Cheryl Prejean, BA; Martha Johnson-Hamilton, BS; Pheba Philip, BS; Ngoc Han Le, BS; Waheed Muses, BS
� Context.—Phlebotomy services are a common target forpreanalytic improvements. Many new, quality engineeringtools have recently been applied in clinical laboratories.However, data on relatively few projects have beenpublished. This example describes a complete applicationof current, quality engineering tools to improve preanalyticphlebotomy services.
Objectives.—To decrease the response time in thepreanalytic inpatient laboratory by 25%, to reduce thenumber of incident reports related to preanalytic phlebot-omy, and to make systematic process changes that satisfiedthe stakeholders.
Design.—The Department of Laboratory Medicine,General Services Section, at the University of Texas MDAnderson Cancer Center (Houston) is responsible forinpatient phlebotomy in a 24-hour operation, which serves689 inpatient beds. The study director was project directorof the Division of Pathology and Laboratory Medicine’s
Quality Improvement Section and was assisted by 2 qualitytechnologists and an industrial engineer from MD Ander-son Office of Performance Improvement.
Results.—After implementing each solution, using well-recognized, quality tools and metrics, the response timefor blood collection decreased by 23%, which was close tomeeting the original responsiveness goal of 25%. Theresponse time between collection and arrival in thelaboratory decreased by 8%. Applicable laboratory-relatedincident reports were reduced by 43%.
Conclusions.—Comprehensive application of qualitytools, such as statistical control charts, Pareto diagrams,value-stream maps, process failure modes and effectsanalyses, fishbone diagrams, solution prioritization matri-ces, and customer satisfaction surveys can significantlyimprove preset goals for inpatient phlebotomy.
(Arch Pathol Lab Med. 2013;137:1753–1760; doi:10.5858/arpa.2012-0458-OA)
Preanalytic process problems are a well-recognized sourceof clinical complaints and probably cause the most
identification errors.1–4 As the primary patient contact withthe clinical laboratory, phlebotomy is especially important tothe quality image of laboratory services for patients,clinicians, and other health care professionals. Clinicallaboratories have always been interested in improving theservices provided to their customers. Clinical laboratorieswere early users, for example, of statistical control charts,such as X-bar (averages) control charts and p (proportion)charts for investigating preanalytic problems. The College ofAmerican Pathologists expanded quality studies to include
multilaboratory surveys, as demonstrated by Q-probes(evaluating quality improvements in laboratories) and Q-tracks (Q-probe studies redesigned into longitudinal mon-itors).5.6 A continuing interest in improvement persists inthe clinical laboratory community today.
Additional quality tools have recently been added to thelist of possible aids for quality improvement projects.Among the tools that began to be widely applied in thepast 10 years were those related to Lean (Toyota, Aichi,Japan), Six Sigma (Motorola, Schaumburg, Illinois), andFailure Mode and Effects Analysis (FMEA). Lean projectsare initiatives focused on eliminating all waste in manufac-turing processes.7 Principles of Lean manufacturing includereducing waiting times (for collection and transportation),scheduling (dispatch mode rather than a dedicated staff),batch to flow (responding to individual collections andreducing batches of samples held before transportation),and line balancing (evenly distributing the blood drawsamong available phlebotomists).7 Six Sigma methods focuson reducing variance (of responsiveness time and defectslike incident reports) in processes to improve theircapability.7 The FMEA process is a systematized group ofactivities to recognize and evaluate the potential failures(delays) of a process, their causes and their effects, andactions that could eliminate or reduce the occurrence of thepotential failures.7 In one recent survey,8 the Six Sigmadesign phase and SIPOC (suppliers, input, process, output,and customers) tools were applied to determine the high-risk steps for phlebotomy. That survey8 demonstrated thatthe highest risk priority number scores were associated with
Accepted for publication March 7, 2013.From the Departments of Laboratory Medicine (Dr Wagar, Messrs
Del Guidice and Muses, and Ms Prejean), Pathology and LaboratoryMedicine Quality Improvement (Mr Phipps and Ms Han Le and MsJohnson-Hamilton), Pathology (Dr Middleton), Performance Im-provement (Mr Bingham), and Quality Measurement and Engineer-ing (Ms Philip), University of Texas MD Anderson Cancer Center,Houston. Mr Muses is now with the National Guard Health Affairs,Imam Abdulrahman Bin Feisal Hospital, Dammam, Kingdom ofSaudi Arabia.
The authors have no relevant financial interest in the products orcompanies described in this article.
Presented in part at the annual meeting of the Institute of IndustrialEngineers, Orlando, Florida, May 18–22, 2012, and won First Placein the 2012 Lean Best Practices Awards.
Reprints: Elizabeth A. Wagar, MD, Department of LaboratoryMedicine, University of Texas MD Anderson Cancer Center, Unit 85,1515 Holcombe Blvd, Houston, TX 77030 (e-mail: [email protected]).
Arch Pathol Lab Med—Vol 137, December 2013 Inpatient Preanalytic Process Improvements—Wagar et al 1753
preprinted, nonbarcoded admission labels and with com-paring hospital information orders with patient wristbandidentification. Tools used in that survey included thefishbone diagram, process mapping combined with FMEA,and the SIPOC approach. However, that project looked onlyat the design phase. The question remains as to howsuccessful these widely discussed tools actually perform inthe full implementation of a quality improvement project.The quality improvement steps described here show theresults of full use and analysis with these now-standard andfamiliar quality tools in the clinical laboratory.
MATERIALS AND METHODS
Inpatient phlebotomy at the University of Texas MD AndersonCancer Center (Houston) is performed primarily by phlebotomists(approximately 80% of all blood draws) in the General ServicesSection within the Department of Laboratory Medicine. It is a 24-hour operation, serving 689 inpatient beds and includes theintensive care unit and emergency center services to oncologypatients. The participants in the project included the departmentchair (sponsor), the clinical administrative director, and 2 super-visors in phlebotomy. The project director was the director of thePathology and Laboratory Medicine’s Quality Improvementdepartment, who was assisted by 2 quality technologists and anindustrial engineer from the MD Anderson Office of PerformanceImprovement. The group aligned the project with 2 of theinstitution’s strategic goals: (1) to increase the quality, safety, andvalue of clinical care; and (2) to enhance productivity, access, andefficiency by strengthening the infrastructure and support system.
The scope of the project focused on timely responsiveness whenphlebotomists are dispatched for STAT and routine blood draws.
The data include both specimens that were walked to thelaboratory and those that were sent by pneumatic tube system.Because the routine morning collections done for daily rounds andthe intensive care unit areas were performed by staff dedicated tothose certain areas, those data points were excluded. Baseline datawere established for the periods from requested collection time toactual collection time and from collection time to log-in in thespecimen laboratory during a 3-month period (February 2011 toApril 2011). Baseline raw data were collected electronically asfollows: (1) response time from request to collection was, onaverage, 21.5 minutes; (2) response time from collection to log-in inthe laboratory was, on average, 33.5 minutes; and (3) the numberof laboratory-related, inpatient incident reports reported fromJanuary 2010 to December 2010 totaled 308.
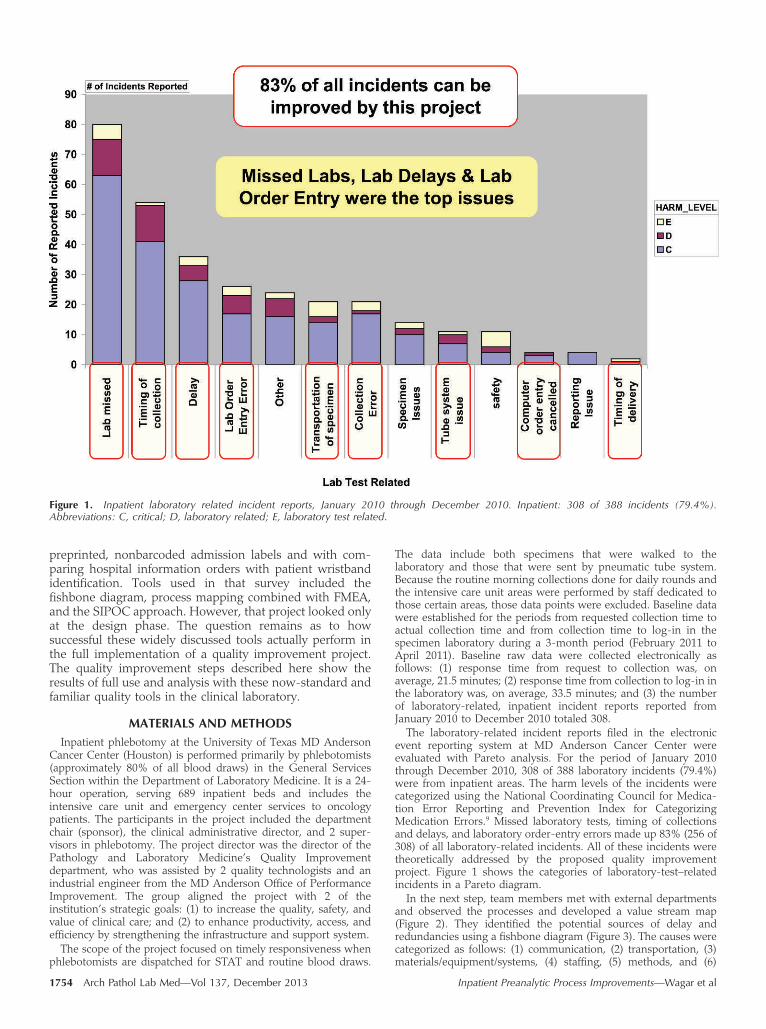
The laboratory-related incident reports filed in the electronicevent reporting system at MD Anderson Cancer Center wereevaluated with Pareto analysis. For the period of January 2010through December 2010, 308 of 388 laboratory incidents (79.4%)were from inpatient areas. The harm levels of the incidents werecategorized using the National Coordinating Council for Medica-tion Error Reporting and Prevention Index for CategorizingMedication Errors.9 Missed laboratory tests, timing of collectionsand delays, and laboratory order-entry errors made up 83% (256 of308) of all laboratory-related incidents. All of these incidents weretheoretically addressed by the proposed quality improvementproject. Figure 1 shows the categories of laboratory-test–relatedincidents in a Pareto diagram.
In the next step, team members met with external departmentsand observed the processes and developed a value stream map(Figure 2). They identified the potential sources of delay andredundancies using a fishbone diagram (Figure 3). The causes werecategorized as follows: (1) communication, (2) transportation, (3)materials/equipment/systems, (4) staffing, (5) methods, and (6)
Figure 1. Inpatient laboratory related incident reports, January 2010 through December 2010. Inpatient: 308 of 388 incidents (79.4%).Abbreviations: C, critical; D, laboratory related; E, laboratory test related.
1754 Arch Pathol Lab Med—Vol 137, December 2013 Inpatient Preanalytic Process Improvements—Wagar et al

working environment. Some examples of issues related to each ofthese categories are shown in Table 1. The team then used anFMEA to define risk priority numbers for the 69 possible causesthey identified (a portion of that is shown in Figure 4).
The team used the ranked causes to identify 75 possible short-term and long-term solutions for the higher-ranking risk prioritynumbers. These solutions were ranked according to the solution-prioritization matrix for implementation. The team has implement-ed 11 of those solutions as follows: (1) changing the pendinglaboratory query to enhance the number of pending collectionsseen and controlled by the phlebotomy dispatch personnel, (2)communicating the new dispatch process to nursing management,(3) training the dispatchers on using the new dispatch process, (4)piloting of the new dispatch process, (5) implementing a dispatchservice to all inpatient service areas, (6) acquiring enough pagersthat each phlebotomist has one (rather than sharing by shift), (7)standardizing the labeling and education regarding the use ofpneumatic tube system, (8) adjusting staffing start times, (9)consolidating all label printing from the unit areas to dispatch, and(10) training clerical floor staff regarding laboratory priorities, testcodes, laboratory order entry times, and labeling of print schedules.All of these activities occurred between March 2011 and July 2011.We also developed and implemented a computerized dispatchdatabase to track pending collections and personnel.
X-bar charts were used to group the raw data for all creatininetests ordered each week; the charts were ‘‘staged’’ according towhen process changes were made. The upper and lower controllimits were defined as 3 SD, were recalculated for each week’s datapoint, and were centered from the mean for the applicable stage.Student t tests (using 95% confidence intervals and not assumingequal variances) were used to evaluate the statistical significance ofthe difference in the means. These charts and analyses wereperformed using Minitab software (release 14.20, Minitab Inc, StateCollege, Pennsylvania).
RESULTS
After the interventions, the response time from request tocollection was decreased by 23% (from 21.5 to 16.6minutes). This reduced the wait time per week forphlebotomy by 343 hours (4222 blood draws per week).The stepped approach, with pilot baseline data and after fullimplementation, is shown in Figures 5 and 6. The meandifference was 4.9 minutes (P , .001).
The response time from collection to laboratory log-inwas decreased by 8% (from 33.5 to 30.8 minutes), as shownin Figure 6, which reduced the laboratory wait time perweek by more than 190 hours (4222 blood draws per week).The t test estimate for the difference of was 2.7 minutes (P ,
.001).The number of incidents reported that were within the
scope of the project showed a decrease in the weekly trendcompared with those in 2010 (4.9 incidents/wk). Theseincidents, which were 83% of all laboratory incidents atbaseline, were now only 42% (3.0 of 7.1 incidents per week)of the incidents. The new rate was 3.0 incidents/wk, with a ttest estimate for the difference of 1.9 events (P ¼ .04).Incidents related to delays, missed laboratory collections,and timing of collections were reduced by 43% (from 14 permonth to 8 per month).
In addition, a satisfaction survey queried the inpatientservice coordinators regarding their satisfaction with thenew phlebotomy dispatch process. They were asked tocompare how they felt about the process, their impression ofphlebotomist response times, the number of problemsencountered with the process, and the number of phonecalls required to request a phlebotomist for blood collection.
Figure 2. Inpatient preanalytic laboratory process flow, as of February 2011. Per policy, specimens sent by pneumatic tube system (PEVCO) caninclude all blood and urinalysis Vacutainer products and blood culture bottles. Walked specimens include spinal fluids, urinalysis containers, andliquid cultures (sputum, stools). Abbreviations: HIS, hospital information system; ID’s, identifies; ID, identification; LIS, laboratory informationsystem; LOE, laboratory order entry; phleb, phlebotomist.
Arch Pathol Lab Med—Vol 137, December 2013 Inpatient Preanalytic Process Improvements—Wagar et al 1755

The results of this survey showed a marked improvement inthe satisfaction of clerical personnel. Improved communi-cation between laboratory phlebotomists and clerical staffprobably contributed to these results in the satisfactionsurvey. The survey results are shown in Figure 7.
CONCLUSIONS
During the past 20 years, many studies have examinedlaboratory turnaround times as one of the most prominentsigns of laboratory service.10 Turnaround time is often usedas a key indicator of quality, despite the lack of indication
Figure 3. Preanalytic inpatient delays in turnaround time (TAT) fishbone. Abbreviations: LIS, laboratory information system; LOE, laboratory orderentry; PEVCO, pneumatic tube system; phleb, phlebotomist; Q, question; re, regarding; qty, quantity.
Cause Categorization for Sources of Delay and Redundancies (Partial List)
Category Source of Delay or Redundancy
Communication Phlebotomy dispatcher lacks good visibility of actual pending requestsDelays and poor resource use from the floor clerks having to call phlebotomy dispatch when orders
were electronically submittedFloor staff’s preferred collection-type information not up-to-date or availablePhlebotomy pagers not available at shift exchange
Transportation Underuse of pneumatic tube systemWalk time for resupply/specimen delivery
Materials/equipment/system Pneumatic tube system settings not optimizedLaboratory collection pending query of inaccuraciesNonstandardized phlebotomy supplies
Staffing Dispatcher has limited visibility and tracking ability of staffPhlebotomist and processor staffing levels not balanced with peak demands and priorities
Process Inadequate pneumatic tube trainingManual dispatching creates redundant data entryOveruse of STAT priorityLaboratory order entry practices used by clerks is not consistent
Working environment New floors have layouts different from existing floorsUneven work distribution among personnel
1756 Arch Pathol Lab Med—Vol 137, December 2013 Inpatient Preanalytic Process Improvements—Wagar et al

that decreased turnaround time improves patient care orhospital length-of-stay.11 For therapeutic turnaround time,
reducing preanalytic delays through faster sample transport
and delivery is probably the single, most important
improvement.10 Most problems within clinical laboratoriesare associated with preanalytic steps.1–4 An early evaluation
by Howanitz and Schifman12 suggested that phlebotomy
services would probably achieve their greatest gains by
Figure 4. Potential sources of delays and redundancies. Abbreviations: CVC, central venous catheter; Feb, February; LLT, laboratory liaisontechnician; RPN, risk priority number.
Figure 5. X-bar chart of trends in response time for requests to collect blood for creatinine test in all inpatient areas for all orders between 6:00 AM
and midnight on weekdays only. Abbreviations: LCL, lower control limit; UCL, upper control limit; X-bar, average.
Arch Pathol Lab Med—Vol 137, December 2013 Inpatient Preanalytic Process Improvements—Wagar et al 1757

Figure 6. X-bar chart of turnaround times from collection to log-in in laboratory. Abbreviations: LCL, lower control limit; UCL, upper control limit; Xbar, average.
Figure 7. Inpatient service coordinator satisfaction survey. Old versus new dispatch process. Abbreviation: N, total number of survey responses.
1758 Arch Pathol Lab Med—Vol 137, December 2013 Inpatient Preanalytic Process Improvements—Wagar et al

focusing on specific processes and administrative inefficien-cies. Unhappiness with turnaround times remains aproblem today. A 2006 report13 of a College of AmericanPathologists Q-probes survey of nursing satisfaction withclinical laboratory services indicated that respondents wereleast satisfied with issues related to turnaround time,including phlebotomy responsiveness to service requests.
Traditionally, laboratories have approached these prob-lems with an episodic approach, which included fullevaluation of incidents, followed by corrective actions. Morerecently, industrial engineering quality tools, such as Lean,Six Sigma, and FMEA, have been implemented in the healthcare environment. Results from these processes indicate thatthe procedures with the highest risk were linked to theadministrative aspects of phlebotomy and included accuracyof patient identification with preprinted, nonbarcodedadmission labels, when compared with the hospitalinformation orders using identification by patient wristband.However, that study8 looked only at the design phase andnot at the total process improvement of the project. Anotherinstitution14 used retrospective root cause analysis toinvestigate the role of phlebotomy in an emergencydepartment and determined that, among the delays wasorder-processing time, which was addressed with adedicated phlebotomist for the emergency department.
As exposure to these tools has penetrated health care, acommon question has been their applicability to the more-varied and economically constrained environment of theclinical laboratory. This quality improvement project dem-
onstrates real value for these various tools when applied in alarge medical center.
This project was designed to fully assess delays and issuesin phlebotomy in an institution currently functioningwithout a wristband barcode phlebotomy system. Identifi-cation of areas for improvement were systematically assessedby ‘‘connecting’’ the quality tools used, so the outputs ofeach tool determined the inputs for the next quality tool orimprovement-process phase. Various quality tools wereused, including statistical control charts, Pareto diagrams, avalue stream map, a process FMEA, a fishbone diagram, asolution prioritization matrix, and a customer satisfactionsurvey (Figure 8). Sequential use of these tools ascertainedthat all relevant areas for improvement were identified andretained the emphasis on process improvement.
Through these efforts, the preanalytic, inpatient, labora-tory responsiveness time (response time from request tocollection) was decreased by 23% (from 21.5 to 16.6minutes). The response time from collection to log-in inthe laboratory decreased by 8% (from 33.5 to 30.8 minutes).These results demonstrate that a concerted and thoroughapplication of quality tools can drive process improvementto a targeted quality goal in an active clinical laboratorysetting. Other laboratories may wish to select the mostuseful tools to match their project size and resources.However, this project clearly demonstrates the value of suchtools in assessing the circumstances of problems. Inaddition, it demonstrates the value of challenging theproject results with statistical control charts already familiarto most laboratory professionals, as recommended in a
Figure 8. Connecting the tools: Abbreviation: FMEA, Failure Modes and Effects Analysis.
Arch Pathol Lab Med—Vol 137, December 2013 Inpatient Preanalytic Process Improvements—Wagar et al 1759

recent comprehensive review of laboratory turnaroundtimes.10
Improved preanalytic processes undoubtedly contribute topatient safety. Patient safety will likely continue to be a focusfor the Joint Commission.15 States have also recently passedlegislation requiring the reporting of patient safety incidentsthat result in significant harm or death. Thorough review ofthe preanalytic processes in the clinical laboratory forefficiencies and safety is an important mechanism by whichthe clinical laboratory can contribute to a safe, efficient, andpatient-centric environment.
We thank Judith Johnson for her assistance in assembling andsubmitting this manuscript.
References
1. Bonini P, Plebani M, Ceriotti F, Rubboli F. Errors in laboratory medicine.Clin Chem. 2002;48(5):691–698.
2. Astion ML, Shojania KG, Hamill TR, Kim S, Ng VL. Classifying laboratoryincident reports to identify problems that jeopardize patient safety. Am J ClinPathol. 2003;120(1):18–26.
3. Plebani M, Carraro P. Mistakes in a STAT laboratory: types and frequency.Clin Chem. 1997;43(8, pt 1):1348–1351.
4. Wagar EA, Tamashiro L, Yasin B, Hilborne L, Bruckner DA. Patient safety inthe clinical laboratory: a longitudinal analysis of specimen identification errors.Arch Pathol Lab Med. 2006;130(11):1662–1668.
5. Howanitz PJ. Errors in laboratory medicine: practical lessons to improvepatient safety. Arch Pathol Lab Med. 2005;129(10):1252–1261.
6. Howanitz PJ, Renner SW, Walsh MK. Continuous wristband monitoringover 2 years decreases identification errors: a College of American PathologistsQ-Tracks study. Arch Pathol Lab Med. 2002;126(7):809–815.
7. American Society for Quality. Quality glossary. http://asq.org/glossary/.Accessed October 31, 2012.
8. Wagar EA, Raz M, Yasin B. Patient safety partnership projects in the clinicallaboratory. Am J Clin Pathol. 2006;126(suppl 1):S53–S60.
9. [NCC MERP] National Coordinating Council for Medication ErrorReporting and Prevention. NCC MERP Taxonomy of Medication Errors. Hague,Netherlands: NCC MERP; 1998. http://www.nccmerp.org/pdf/taxo2001-07-31.pdf. Accessed September 3, 2008.
10. Hawkins RC. Laboratory turnaround time. Clin Biochem Rev. 2007;28(4):179–194.
11. Howanitz JH, Howanitz PJ. Laboratory results: timeliness as a qualityattribute and strategy. Am J Clin Pathol. 2001;116(3):311–315.
12. Howanitz PJ, Schifman RB. Inpatient phlebotomy practices: a College ofAmerican Pathologists Q-probes quality improvement study of 2,351,643phlebotomy requests. Arch Pathol Lab Med. 1994;118(6):601–605.
13. Jones BA, Walsh MK, Ruby SG. Hospital nursing satisfaction with clinicallaboratory services: a College of American Pathologists Q-probes study of 162institutions. Arch Pathol Lab Med. 2006;130(12):1756–1761.
14. Fernandes CMB, Worster A, Hill S, McCallum C, Eva K. Root causeanalysis of laboratory turnaround times for patients in the emergency department.CJEM. 2004;6(2):116–122.
15. Joint Commission. National Patient Safety Goals. Oakbrook Terrace,Illinois; 2012. http://www.jointcommission.org/standards_information/npsgs.aspx. Accessed October 31, 2012.
1760 Arch Pathol Lab Med—Vol 137, December 2013 Inpatient Preanalytic Process Improvements—Wagar et al