Embed Size (px)
Citation preview

AHRQ Quality Indicators
Inpatient Quality Indicators Software Instruction SAS Version 43 (August 2011) Prepared for Agency for Healthcare Research and Quality US Department of Health and Human Services 540 Gaither Road Rockville MD 20850 httpwwwqualityindicatorsahrqgov Contract No 290-04-0020 (AHRQ SQI-II) Prepared by
505 King Avenue Columbus OH 43201 August 2011 (Revised 912011)
Version 43a is a maintenance release of Version 43 The differences between the two
versions are bull Version 43a includes Version 29 of the Limited License edition of the 3MTM APR-DRG
Grouper This grouper corrects an issue found in Version 28 of the Limited License edition of the 3MTM APR-DRG Grouper The grouper is only used with the Inpatient Quality Indicator (IQI) mortality measures Version 43 includes Version 28 of the Limited License edition of the 3MTM APR-DRG Grouper which was incorrectly assigning a Risk of Mortality (ROM) subclass for cases dated on or after 10110
bull Version 43a allows users to calculate area-level indicators for years 2010 and 2011 correcting an issue previously identified in Version 43
All other aspects of the software including measure specifications remain the same Thus this document (related to Version 43) remains unchanged
Inpatient Quality Indicators (IQI) Software Instruction SAS
Inpatient Quality Indicators (IQI) ii Version 43 (August 2011)
This document is based on research conducted by the Battelle under contract to the Agency for Healthcare Research and Quality (AHRQ) Rockville MD (Contract No 290-04-0020) The findings and conclusions in this document are those of the author(s) who are responsible for its content and do not necessarily represent the views of AHRQ No statement in this report should be construed as an official position of AHRQ or of the US Department of Health and Human Services The information in this report is intended to help clinicians employers policymakers and others make informed decisions about the provision of health care services This document is intended as a reference and not as a substitute for clinical judgment This document may be used in whole or in part as the basis for the development of clinical practice guidelines and other quality enhancement tools or as a basis for reimbursement and coverage policies AHRQ or US Department of Health and Human Services endorsement of such derivative products may not be stated or implied
Inpatient Quality Indicators (IQI) Software Instruction SAS
Inpatient Quality Indicators (IQI) iii Version 43 (August 2011)
This document is in the public domain and may be used and reprinted without permission except those copyrighted materials that are clearly noted in the document Further reproduction of those copyrighted materials is prohibited without the specific permission of copyright holders Suggested Citation Inpatient Quality Indicators Software Instruction SAS Version 43 (Prepared by Battelle under Contract No 290-04-0020) Rockville MD Agency for Healthcare Research and Quality August 2011
None of the investigators has any affiliations or financial involvement that conflicts with the material presented in this document
Inpatient Quality Indicators (IQI) Software Instruction SAS
Inpatient Quality Indicators (IQI) iv Version 43 (August 2011)
Abstract The AHRQ Quality Indicators were developed specifically to meet the short-term needs for
information on health care quality using standardized user-friendly methods and existing sources of data
This module of the AHRQ Quality Indicators was designed to capitalize on the availability of administrative data on inpatient stays to produce information for Inpatient Quality Indicators (IQI) These measures include
bull volume of certain intensive high-technology or highly complex procedures for which evidence suggests that institutions performing more of these procedures may have better outcomes
bull mortality for inpatient procedures and for inpatient conditions and
bull utilization indicators which examine procedures whose use varies significantly across hospitals and for which questions have been raised about overuse underuse or misuse
This document is the software instruction for the Inpatient Quality Indicators Version 43
which is provided on the AHRQ Quality Indicator Web site The software was developed in SAS for use on a personal computer AHRQs goal by making this tool publicly available is to assist users in producing information on health care quality more cost effectively
Detailed definitions of the IQI with complete listings of the ICD-9-CM and DRG codes specifically included or excluded are contained in the document Inpatient Quality Indicators Technical Specifications See Appendix A Links for links to this document as well as additional documents on the IQI (eg recent changes) and other documents on the AHRQ QI
Inpatient Quality Indicators (IQI) Software Instruction SAS
Inpatient Quality Indicators (IQI) v Version 43 (August 2011)
Contents Abstract iv
10 Introduction 1
20 Components of the Inpatient Quality Indicators Module 4
30 Quick Reference 5 31 Processing Steps 5 32 Inpatient Quality Indicator Module Details 8
40 Background 10
50 Data Elements and Coding Conventions 12 51 Input for the AHRQ Quality Indicators 12 52 Coding of Diagnoses Procedures and DRGs 14 53 APR-DRG Variables 15 54 Missing Values 15 55 Treatment of Missing Data 16
60 User Options 18
70 Producing Inpatient Quality Indicator Rates Processing Steps 19 71 Step 1 Identify Outcomes in Inpatient Records 19 72 Step 2 Identify Populations at Risk 19 73 Step 3 Calculate observed (raw) Inpatient Quality Indicator rates 19 74 Step 4 Risk-adjust the Inpatient Quality Indicator Rates 20 75 Step 5 Create MSX Smoothed Rates 20
80 Program Descriptions 21 81 Program 1 Modify Statements in the CONTROL_IQISAS Code 21 82 Program 2 Run IQFMTS 22 83 Program 3 Run IQSAS1 22 84 Program 4 Run IQSASP2 24 85 Program 5 Run IQSASP3 27 86 Program 6 Run IQSASA2 30 87 Program 7 Run IQSASA3 33
90 Reviewing the Printed Output 36 91 IQSAS1 36 92 IQSASP2 37 93 IQSASP3 38 94 IQSASA2 39 95 IQSASA3 40
100 Benchmark Timings 42 101 User Support 42
Inpatient Quality Indicators (IQI) Software Instruction SAS
Inpatient Quality Indicators (IQI) vi Version 43 (August 2011)
Appendix A Links 43
Appendix B Using Different Types of QI Rates 46
Appendix C IQI Input Data Dictionary 48
Appendix D SAS IQI Output Data Dictionary 52
List of Figures Figure 1 Processing steps for the inpatient quality provider indicators 6
Figure 2 Processing steps for the inpatient quality area indicators 7
List of Tables Table 1 Inpatient quality indicator (IQI) variables 8
Table 2 Prefixes for the inpatient quality indicator (IQI) variables 9
Table 3 Inpatient quality module contents 9
Table 4 Treatment of missing data elements 17
Table 5 How to set up IQI parameters and your data for using APR-DRG variables 24
Table 6 IQSASP2 Aggregation Possibilities 27
Table 7 IQSASA2 aggregation possibilities 32
Table 8 Provider level printed output 38
Table 9 Area level printed output 40
Inpatient Quality Indicators (IQI) Software Instruction SAS
Inpatient Quality Indicators (IQI) 1 Version 43 (August 2011)
10 Introduction This documentation describes the software for implementing the Inpatient Quality Indicator
(IQI) module of the AHRQ Quality Indicators Version 43 and highlights features of the analytic approach of particular interest to new users
The programs documented here were developed for use in Statistical Analysis System (SASreg)1 The SASreg version of the IQI software is designed as a PC-based single-user application It has been tested with SASreg version 92 on a 32-bit machine To use the SAS version of the QI software users must have access to the commercially-available SASreg statistical software package including but not limited to BASE SAS SASSTAT and SASACCESS For more information visit the SAS Institute website at httpwwwsascom
The IQI software consists of a series of computer programs that
bull Assign and calculate IQI from hospital discharge abstracts or UB (uniform billing) claims data
bull Print IQI results in SAS format or as an ASCII text file (comma delimited) that can be imported into word processing documents spreadsheets or graphics software at the users option
bull Provide four options for stratifying rates by geographic areas
bull Create smoothed (ie reliability-adjusted) rates that reduce fluctuations over time due to random variation
bull The reference population database used by the software was updated to HCUPrsquos Year 2008 State Inpatient Databases (SID) This database is used to create the regression coefficients applied in risk adjustment (see Section 74) and the shrinkage factors used to calculate smoothed rates (see Section 75)
bull The syntax now supports a data weighting variable (DISCWT) like those used in the Nationwide Inpatient Sample This numeric variable must be present in the input file (see Section 51) and should be set to 1 if weighting is not desired
bull Effective March 1 2007 the UB-04 data specification manual includes a Present on Admission indicator (httpwwwcdcgovnchsdataicd9icdguide09pdf ) For the IQI POA data may impact risk-adjusted rates by excluding secondary diagnoses coded as complications from the identification of covariates If the userrsquos input file does not include POA data an estimation procedure is used to adjust the prevalence of the covariates to account for the missing POA data You may include POA data for all your records some of your records or none of them Including records with and without POA data is also allowed the estimation procedure is applied to those records where POA data are missing and not to those records where POA data are not missing
bull Installation of Version 43 SAS syntax requires additional steps for the risk adjustment procedures to operate correctly Once completed for one AHRQ QI module (ie IQI PSI or
1 SAS is a statistical program distributed by the SAS Institute Inc (httpwwwsascom) The company may be contacted directly regarding the licensing of their products The SAS Institute Inc does not have any affiliation with AHRQ nor involvement in the development of the AHRQ QI
Inpatient Quality Indicators (IQI) Software Instruction SAS
Inpatient Quality Indicators (IQI) 2 Version 43 (August 2011)
PDI) the Prediction Module step does not need to be repeated for the other modules The steps are
bull Installing the Prediction Module software
bull Click ldquoPrediction Modulerdquo link at httpwwwqualityindicatorsahrqgovsoftwareSASaspx
bull Save the ldquoAHRQSetup 092190msirdquo file to a directory on local machine
bull Double-click ldquoAHRQSetup 092190msirdquo ndash this will install the Prediction Module executable and license files in ldquoCProgram FilesBattelleAHRQrdquo (6 files total)
bull Create a new folder ldquoCAHRQQIAHRQPredictionrdquo and copy all 6 installation files to that location (so they are located in both places)
bull Saving the required files to run the AHRQ QI SAS software
bull Create a sub-folder under ldquoCAHRQQIrdquo called ldquoIQIrdquo
bull The software package contains another zip file called ldquoIQI_GEE_Input_Filesziprdquo All of the files within this zip file need to be extracted to the sub-folder ldquoCAHRQQIIQIrdquo
bull The syntax will compute risk-adjusted rates and observed-to-expected ratios for the pre-defined set of stratification variables (eg age gender payer race) When stratifications other than hospital or area are selected the RPPSxx variables and their confidence intervals are observedexpected ratios to avoid confounding with risk adjustment variables
Version 43 of the IQI software includes the following changes
bull The IQI module Version 43 contains formats that incorporate ICD-9-CM and DRG coding through September 30 2011 A list of the coding changes made for the fiscal year and a Change Log for the IQI module may be found on the AHRQ QI website (IQI)
bull The 3Mreg APRreg DRG Limited License Grouper for SASreg software has been updated to FY2011 codes Beginning with Version 23 3M will update the APR-DRG every fiscal year The optional limited license grouper available with the AHRQ QI software is ldquomulti-versionrdquo (ie Versions 20 23 to 28) The software will apply the correct version based on the discharge year and quarter Users who have their own APR-DRG grouper can use either the applicable DRG version or the ICD-9-CM mapping to Version 20 See Section 53 for information on APR-DRG variables The Inpatient Quality Indicators Comparative Data document provides comparative values
including average volumes provider rates and population rates depending on the type of indicator The Inpatient Quality Indicators Technical Specifications document lists all ICD-9-CM and DRG codes included in and excluded from the numerator and denominator of each indicator
See Appendix A for links to these and other documents as well as Web sites that may be of interest to IQI users
See Appendix B ldquoUsing Different Types of QI Ratesrdquo for an explanation of observed expected risk adjusted and smoothed rates and for guidance in the use of these rates
This instruction includes
Inpatient Quality Indicators (IQI) Software Instruction SAS
Inpatient Quality Indicators (IQI) 3 Version 43 (August 2011)
bull A discussion of the data elements necessary to produce the AHRQ IQI and the uniform coding conventions recommended for those elements
bull Descriptions of the IQI processing steps in nontechnical language
bull Detailed descriptions of the functions of each IQI SAS program
Critical user information is highlighted with this symbol
Inpatient Quality Indicators (IQI) Software Instruction SAS
Inpatient Quality Indicators (IQI) 4 Version 43 (August 2011)
20 Components of the Inpatient Quality Indicators Module
As shown in Table 3 on page 9 the Inpatient Quality Indicators module consists of eight SAS programs and six ASCII text files that contain auxiliary data These programs and text files are described in the subsequent sections of this document
A note on the naming conventions for the Inpatient Quality Indicators (IQI) module programs Most programs use the naming format of IQSASi IQSASAi or IQSASPi The first two characters ldquoIQrdquo of the program name indicate an Inpatient Quality Indicators program to distinguish it from other modules that have been or will be released from AHRQ The next three characters of the program name are ldquoSASrdquo In the programs that are specific to either area-level or provider-level indicators the sixth character of the program name is either ldquoArdquo or ldquoPrdquo The sixth character is an ldquoArdquo if it is for the production of area-level indicator rates that use county or Office of Management and Budget (OMB) defined metropolitan or micropolitan area (Metro Area) populations as denominators The sixth character is a ldquoPrdquo if it is a program for the production of provider-level indicator rates that use subsets of the hospital discharge population The last character (i) of the variable name designates the number of the specific program
Inpatient Quality Indicators (IQI) Software Instruction SAS
Inpatient Quality Indicators (IQI) 5 Version 43 (August 2011)
30 Quick Reference The subsequent four pages are intended to serve as a quick reference to assist in reading this
documentation and in reviewing the Inpatient Quality Indicator (IQI) module outputs Processing steps are shown first (Figure 1 and Figure 2) followed by a listing of the module variables (Table 1) variable prefixes (Table 2) and module contents (Table 3) One suggestion is to print these pages in duplex mode on two sheets of paper so that they can then be easily referred to as the need arises
31 Processing Steps
Figure 1 shows processing steps for the Inpatient Quality provider-level Indicators while Figure 2 shows steps for the Inpatient Quality area-level Indicators
Inpatient Quality Indicators (IQI) Software Instruction SAS
Inpatient Quality Indicators (IQI) 6 Version 43 (August 2011)
Figure 1 Processing steps for the inpatient quality provider-level indicators
NOTE Each of the SAS Programs in Figure 1 incorporates the CONTROL_IQISAS program which contains code the user must modify in order to run the IQI software The modifications include such items as specifying the name and location of the input data set the population data set and the output data set
SIDyy(SAS dataset
conforming to HCUP coding conventions)
IQFMTSCreates IQI format library
that is used by most programs
IQSAS1Assigns 01 indicators for
IQI outcomesIQI format library
IQ1(inpatient data with 01
outcome indicators)
IQSASP2Calculates observed rates across stratifiers for the
provider volume utilization and mortality indicators
To the next page of the flow chart
To the next page of the flow chart
IQP2(observed rates for the provider IQIs across
stratifiers)PRDIQPlsaquoVERrsaquoTXT(file of parameters for
risk adjustment or prediction syntax file)
IQSASP3Creates risk-adjusted
smoothed and expected rates for the utilization
and mortality IQIs
IQP3(observed risk-adjusted smoothed and expected
utilization and mortality IQI rates and observed volumes
across stratifiers)MSXIQPlsaquoVERrsaquoTXT
(shrinkage factors from reference dataset)
LEGEND
SAS Data file Program Text file (supplied)
GEE_PIQ_Regression AnalysislsaquoQIrsaquoCSV
(regression coefficient from reference dataset)
Prediction_PIQ lsaquoQIrsaquoxml(input parameters for the
executable AHRQ Predictionexe)
Inpatient Quality Indicators (IQI) Software Instruction SAS
Inpatient Quality Indicators (IQI) 7 Version 43 (August 2011)
Figure 2 Processing steps for the inpatient quality area-level indicators
Inpatient Quality Indicators (IQI) Software Instruction SAS
Inpatient Quality Indicators (IQI) 8 Version 43 (August 2011)
32 Inpatient Quality Indicator Module Details The following tables list the module indicator variables (Table 1) variable prefixes (Table 2)
and module contents (Table 3)
Table 1 Inpatient quality indicator (IQI) variables IQI
number Indicator Age categories 18 to 39 40 to 64 65 +
Provider Volumes 1 Esophageal resection 2 Pancreatic resection 4 AAA repair 5 CABG No 6 PTCA No 7 Carotid endarterectomy
Provider Post-procedural Mortality Rates 8 Esophageal resection 9 Pancreatic resection 11 AAA repair 12 CABG No 30 PTCAa No 31 Carotid endarterectomya 13 Craniotomy 14 Hip replacement
Provider In-hospital Mortality Rates 15 AMI 32 AMI Without Transfer Cases 16 CHF 17 Stroke 18 GI hemorrhage 19 Hip fracture 20 Pneumonia
Provider Utilization Rates 21 Cesarean delivery 33 Primary Cesarean delivery 22 VBAC Uncomplicated 34 VBAC All 23 Laparoscopic Cholecystectomy 24 Incidental appendectomy among elderly No No 25 Bi-lateral cardiac catheterization
Area-level Utilization Rates 26 CABG No 27 PTCA No 28 Hysterectomy 29 Laminectomy
Inpatient Quality Indicators (IQI) Software Instruction SAS
Inpatient Quality Indicators (IQI) 9 Version 43 (August 2011)
Note AAA = Abdominal Aortic Aneurysm CABG = Coronary Artery Bypass Graph PTCA = percutaneous transluminal coronary angioplasty AMI = Acute Myocardial Infarction CHF = Chronic Heart Failure GI = Gastrointestinal VBAC = Vaginal Birth After Cesarean a PTCA and carotid endarterectomy mortality are not recommended as stand-alone indicators but are suggested as companion measures to the corresponding volume measures Table 2 Prefixes for the inpatient quality indicator (IQI) variables
Prefix Contents
EXAMPLES Provider
indicator 8 Esophageal resection
Area-level indicator 26
CABG utilization T Inpatient numerator (top) TPIQ08 TAIQ26
P Population denominator (pop) PPIQ08 PAIQ26
Q POA flag QPIQ08 NA
O Observed rate (not applicable to IQI 1-7) OPIQ08 OAIQ26
E Expected rate EPIQ08 NA
R Risk-adjusted Rate (not applicable to IQI 1-7) RPIQ08 RAIQ26
L Lower limit of confidence interval of risk-adjusted rate LPIQ08 NA
U Upper limit of confidence interval of risk-adjusted rate UPIQ08 NA
S Smoothed rate SPIQ08 NA
X Standard error of smoothed rate XPIQ08 NA Table 3 Inpatient quality module contents
SAS programs ASCII text files CONTROL_IQISAS POP95T11TXT IQFMTSSAS COVIQA43TXT IQSAS1SAS MSXIQP43TXT IQSASP2SAS IQSASP3SAS MSXIQA43TXT IQSASA2SAS gee_piqxx_RegressionAnalysisGeecsv IQSASA3SAS
Prediction_PIQxxxml PRDIQP43TXT
contained in PSI_GEE_Inputzip
The ASCII text files are data files provided with the Inpatient Quality module and are necessary for the programs to run There is no need to convert these files to SAS format for use with the software Note that POP95T11TXT is available on the website as a separate download
Inpatient Quality Indicators (IQI) Software Instruction SAS
Inpatient Quality Indicators (IQI) 10 Version 43 (August 2011)
40 Background The Inpatient Quality Indicator module contains 32 indicators that reflect the quality of care
inside hospitals The six volume measures are intended to be paired with the corresponding mortality indicators These indicators serve to highlight potential quality concerns identify areas that need further study and investigation and track changes over time The indicators include three groups of measures based on hospital stays
1 There are six Volume indicators for inpatient procedures for which there is evidence that a higher volume of procedures is associated with lower mortality A nontrivial number of these procedures are performed by institutions that do not meet recommended volume thresholds The volume indicators are measured as counts of admissions in which particular procedures were performed
2 There are 15 Inpatient Mortality indicators for medical conditions and surgical
procedures that have been shown to have mortality rates that vary substantially across institutions and for which evidence suggests that high mortality may be associated with deficiencies in the quality of care These indicators are measured as rates the number of deaths divided by the number of admissions for the procedure or condition
Eight of these mortality indicators are for procedures six of which are also measured by a
volume indicator The other seven mortality indicators are associated with medical conditions 3 There are eleven Utilization indicators for procedures for which there are questions of
overuse underuse or misuse The procedures being examined are ones whose use varies significantly across hospitals and areas and for which high or low rates by itself does not represent poor quality of care rather the information is intended to inform consumers about local practice patterns
4 Seven of the utilization indicators are rates based on the hospitalized population Four
other utilization indicators are rates based on an arearsquos residential population Two of these area-level utilization indicators (IQI 26 CABG and IQI 2 PTCA) have counterparts in the set of volume indicators
For the four area-level utilization indicators geographic areas are defined at the users option in one of four ways
bull County level with US Census FIPS1 bull County level with modified FIPS bull Metro Area with OMB 1999 definition bull Metro Area with OMB 2003 definition
1 Federal Information Processing Standard as defined by the US Department of Commerce National Institute of Standards and Technology (formerly National Bureau of Standards)
Inpatient Quality Indicators (IQI) Software Instruction SAS
Inpatient Quality Indicators (IQI) 11 Version 43 (August 2011)
The MSALEVL parameter has been renamed to MALEVL to reflect the change in OMB definitions for areas Refer to page 14 for information on these area definitions and MALEVL parameter settings
The indicators in the IQI module are listed in Table 1 on page 8 See also the Inpatient
Quality Indicators Technical Specifications for the detailed definition of each indicator See Appendix A for links to these and other documents
The data required for measuring these indicators come from hospital discharge abstracts or billing claims (administrative data) which are readily available within hospitals or from many state data organizations The residential population data for the four area-level utilization indicators are from the US Census Bureau
The software generates observed expected risk-adjusted and smoothed rates for all indicators excluding IQI 21-25 IQI 33-34 Observed rates are the raw rates Risk-adjusted and expected rates are derived from applying the average case mix of a reference population file that reflects a large proportion of the US hospitalized or residential population When stratifications other than hospital or area are selected the RPIQxx variables and their confidence intervals are observedexpected ratios to avoid confounding with risk adjustment variables Smoothed rates are estimates with removal of fluctuations over time due to random variation
Inpatient Quality Indicators (IQI) Software Instruction SAS
Inpatient Quality Indicators (IQI) 12 Version 43 (August 2011)
50 Data Elements and Coding Conventions See Appendix C for a detailed description of the input data elements and coding conventions used by the SAS QI software
51 Input for the AHRQ Quality Indicators The IQI software was written to process data from discharge data abstracts that contain
information about hospital stays The IQI module was tested on data from the AHRQ Healthcare Cost and Utilization Project (HCUP) HCUP is an ongoing Federal-State-private collaboration to build uniform databases from administrative hospital-based data collected by State data organizations and hospital associations
The input data files for the Inpatient Quality Indicators software must be in SAS
It is strongly recommended that users recode data elements in their input files to be consistent with the coding expected by the software This step will minimize the number of internal changes that will be necessary in the IQI software For example recoding the SEX data element in the input file to be consistent with the coding described in Appendix C (ie 1 for male and 2 for female) is easier than modifying all uses of the Sex data element in the IQI programs
Not every value for every data element is referenced by the IQI software For example only two of the discharge disposition (DISP) data element values are used in the software (DISP value ldquo2rdquo for short-term hospital and value ldquo20rdquo for died in the hospital) However the complete set of standardized values is included based on HCUP specifications (see Appendix A) to assist users of the uniform HCUP data files
To minimize internal changes to the software all required elements should be present in the input data file If a required element is not available a dummy element should be provided Failure to provide a dummy element will result in errors during the execution of the IQI programs
The data elements listed in Appendix C are those required for the input files of all the SAS QI modules When a variable is not required for the program the notation ldquoNot used by the IQI programrdquo will be present in the Comments column Standardizing the variables and data values in the input data file will be helpful for users who have access to both statistical software packages as well as users working to standardize their input file specifications for use with any of the AHRQ QI software modules
Appendix C has been standardized to represent the input data file specifications required for use with any of the three QI modules (IQI PQI or PSI) If a specific variable is not used by the PQI program it is not necessary to create a dummy variable in the input data file For example the variable APR-DRG is used only by the IQI software so it is not necessary to have this data element in the input data file or create a dummy variable for the PQI software program to run correctly
Inpatient Quality Indicators (IQI) Software Instruction SAS
Inpatient Quality Indicators (IQI) 13 Version 43 (August 2011)
The data element HOSPSTCO has been renamed to PSTCO to emphasize the importance of
calculating the area-level IQI by the location of the patient residence If the user wants to calculate the area-level IQI based on the population of the Metro Area or county associated with the patient residence the values for this variable should be the FIPS statecounty code associated with each individual patientrsquos place of residence If the patient information is not available or the user wants to calculate the IQI using the population associated with the hospital location as the denominator the values for this variable should be the individual hospital FIPS statecounty codes
If the hospital FIPS code is used in PSTCO users should be aware that rates may be biased for hospitals which serve as regional referral centers These hospitals are likely to treat patients from outside the Metro Area county or even the state in which the facility is located
Users no longer have to use the Modified FIPS codes assignment for area denominators However that option is still available In the modified FIPS codes certain independent cities (Baltimore City Carson City and St Louis City) and areas within Hawaii and Virginia are assigned to different area groupings in the Modified FIPS categories
Using the patient FIPS statecounty code for analysis may more accurately reflect the true population at risk Using the hospital FIPS statecounty code for analysis should be done with caution and at larger levels of geographic area (ie Metropolitan Area) to minimize the bias with patients that come from a different county than the hospital location
It is possible that some records in the input data file may be missing the patient FIPS code Users should be aware that any records with missing values (in the PSTCO data field) are excluded from the calculations of observed risk-adjusted and smoothed IQI area-level rates They will be included in the output from the first program (IQSAS1SAS)
The software will generate area-level IQI rates for each county included in the PSTCO data field If using the hospital FIPS statecounty code for analysis users are encouraged to limit cases in their input file to those patients discharged from the geographic area of interest For example if you are using data from the state of Wisconsin and are interested in generating a rate for Wisconsin you should remove the cases where the patientrsquos county of residence (FIPS code) is from another state Otherwise the total or overall rate will include the population at risk from the counties outside Wisconsin
The software provides the user with the option of producing output by Metro Area or by
county When Metro Area is selected urban areas are always defined by Metro Areas When
Inpatient Quality Indicators (IQI) Software Instruction SAS
Inpatient Quality Indicators (IQI) 14 Version 43 (August 2011)
county is selected urban areas will be defined by county Rural areas are always defined by county
In the software programs the MALEVL parameter should be set as follows 0-County level with US Census FIPS 1-County level with modified FIPS 2-Metro Area with OMB 1999 definition 3-Metro Area with OMB 2003 definition
The metropolitan area definitions are from three different sources 1) The ldquomodified FIPSrdquo
definition is from the Area Resource File The mapping is from county to modified FIPS county (eg Baltimore city to Baltimore county) 2) The ldquo1999 OMBrdquo definition is from the federal Office of Management and Budget (OMB) circular 99-04 (Last Revised May 6 2002) The mapping is from county to Metropolitan Statistical Area (MSA) except in New England where counties are assigned to New England County Metropolitan Area (NECMAs) OMB defines NECMAs as a county-based alternative to the city- and town-based New England MSAs and Consolidated MSAs (CMSAs) For example Hampden and Hampshire counties in Western Massachusetts are assigned to the Springfield MA NECMA even though Holland town in Hampden County is part of the Boston MSA and 3) The ldquo2003 OMBrdquo definition is from the federal OMB circular 03-04 (Last Revised December 4 2005) The mapping is from county to either Metropolitan Statistical Area or Micropolitan Statistical Area
52 Coding of Diagnoses Procedures and DRGs Diagnoses and procedures must be coded using the International Classification of Diseases 9th Revision Clinical Modification (ICD-9-CM)
Significant modifications to ICD-9-CM codes occurred in the early 1990s IQI definitions only reflect codes valid on and after October 1 1994 so they may not accurately analyze data collected before October 1994
bull Diagnosis and procedure codes should be in character strings
bull Diagnosis and procedure codes should not contain any decimal points
bull Diagnosis and procedure codes should be left justified Diagnosis codes with fewer than five digits should be padded with spaces (not zeros) on the right Procedure codes with fewer than four digits should be padded with spaces (not zeros) on the right
The IQI programs assume accurate and specific coding of ICD codes If an ICD code is specified using 5 digits the software recognizes only 5-digit versions of that code and not versions truncated at 3 or 4 digits Similarly if an ICD code is specified using 4 digits the software recognizes only 4 digit versions of that code and not versions truncated at 3 digits For example 4281 is the ICD-9-CM diagnosis code for left heart failure If your data are coded less specifically (ie 428 is used to designate ldquoheart
Inpatient Quality Indicators (IQI) Software Instruction SAS
Inpatient Quality Indicators (IQI) 15 Version 43 (August 2011)
failurerdquo) these less specific codes are not recognized by the software and will result in undercounting cases
bull Diagnosis-related groups (DRGs) are those derived from the Centers for Medicare amp Medicaid Services (previously Health Care Financing Administration) Medicare grouper The software expects that you will be using the DRG effective on the discharge date The software now refers to data elements DRG and MDC Your data should be coded accordingly The software may be modified at the userrsquos option to use other types of DRGs However the impact of using other types of DRGs should be evaluated carefully before making such a change
Version 43 of the software accounts for ICD-9-CM and DRG coding effective through FY2011 (through September 30 2011)
53 APR-DRG Variables
It is recommended that users either use their own 3Mreg APRreg DRG Grouper software or download and run the 3Mreg APRreg DRG Limited License Grouper for SASreg software on their patient data before running the IQI SAS programs The Limited License Grouper software is available on the AHRQ Inpatient Quality Indicators download page (see Appendix A for link)
The Grouper software creates APR-DRG categories and associated risk of mortality data elements These APR-DRG variables are used to enhance the risk-adjustment of selected IQI provider indicators
APR-DRG software must be downloaded and run separately
Users who wish to use APR-DRG results to risk-adjust the provider IQI rates should run the APR-DRG software on their patient data before running the IQI programs
The data elements in the AHRQ QI are based on the coding specifications used in the State
Inpatient Databases (SID) in the Healthcare Cost and Utilization Project (HCUP) The SID coding specifications are similar to the Uniform Bill (UB-04) but not identical For data elements used in the AHRQ QI crosswalks between the SID and UB-04 coding specifications are included in the SID documentation available at httphcup-usahrqgovdbstatesiddbdocumentationjsp
54 Missing Values
The IQI programs do not distinguish among different types of missing values
Cases that are missing data in fields used for indicator definitions or for risk adjustment (such as age and sex) will be excluded from analysis
Data files of hospital discharge abstract data may have numeric data elements coded using
special SAS missing ldquodotrdquo values For example besides the standard SAS value of ldquordquo For missing data there might also be present values of ldquoArdquo for invalid data ldquoBrdquo for data
Inpatient Quality Indicators (IQI) Software Instruction SAS
Inpatient Quality Indicators (IQI) 16 Version 43 (August 2011)
unavailable from a particular source ldquoCrdquo for inconsistent data However the IQI programs do not distinguish among the different types of missing codes Therefore all types of missing values in the input data to the IQI module must be represented by a single value ndash missing data () for numeric variables and blank (lsquo lsquo) for alphanumeric (or character) variables
55 Treatment of Missing Data The software is designed to handle missing data in a particular manner specifically the
software requires confirmation for the assignment of a poor outcome or negative event For instance in order to be assigned as a death each case must actually be coded as a death Missing data are considered neutral Missing data for some elements results in the exclusion of that case from the denominator For a few other elements the case is retained
Inpatient Quality Indicators (IQI) Software Instruction SAS
Inpatient Quality Indicators (IQI) 17 Version 43 (August 2011)
Table 4 lists the impact of missing data for each data element Table 4 Treatment of missing data elements
Variable Label D N E S Treatment of Missing Data
AGE Age In Years At Admission
X X X Case excluded from all analysis (eg dropped from the denominator of the discharge based indicators and from numerator of all population based measures)
ASOURCE Admission Source X Case excluded from denominator where used in specification (eg IQI- 32)
DISP Disposition Status X X Case excluded from denominator where used in specification (eg IQI-15)
DQTR Discharge Quarter X X X X Case excluded from all analysis (eg dropped from the denominator of the discharge based indicators and from numerator of all population based measures)
DX1 Principal Diagnosis Code
x x x x Record excluded from analysis
Sex Patient Gender X X X Case excluded from all analysis (eg dropped from the denominator of the discharge based indicators and from numerator of all population based measures)
PAY 1 Payer x Classified As ldquoOtherrdquo POINTOFORIGINUB04 Point of Origin x x Missing values of
POINTOFORIGINUB04 result in a case being excluded from the denominator for IQI 32 (along with ASOURCE)
PSTCO Location of Patient Residence or Hospital Location Modified FIPS StateCounty Code
X Dropped from denominator in rate calculations (stratified by county or Metro Area) case will appear in calculation of the overall rate
RACE Race X Classified As ldquoOtherrdquo YEAR Discharge Year X X X X Case excluded from all analysis (eg
dropped from the denominator of the discharge based indicators and from numerator of all population based measures)
Note D = Denominator N = Numerator E = Exclusion S = Stratification
Inpatient Quality Indicators (IQI) Software Instruction SAS
Inpatient Quality Indicators (IQI) 18 Version 43 (August 2011)
60 User Options The IQI software reflects the development and implementation of the software with
discharge data available to AHRQ through the HCUP program The goal was to develop the tools illustrate their use and then encourage others to adopt and use the tools for their own applications As a result users are encouraged to consider how AHRQ may modify or enhance the IQI software to better serve their measurement needs and interests
Modifications to the definitions of outcomes of interest (numerators) or populations at risk (denominators) are possible but not desirable Maintaining consistent definitions is important Once definitions are altered the ability to make comparisons of IQI based on original definitions is lost Users are encouraged to identify ways to improve the IQI methodology and to share their suggestions with AHRQ for future updates
AHRQ provides public access to HCUPnet (httphcupnetahrqgov)- an interactive tool for
identifying tracking analyzing and comparing statistics on hospital care HCUPnet queries generate statistics in a table format using data from the Nationwide Inpatient Sample (NIS) and State Inpatient Databases (SID) for those States that have agreed to participate HCUPnet includes statistics based on the AHRQ Quality Indicators (QIs) which have been applied to the HCUP NIS If users change definitions of the IQI it will not be possible to compare usersrsquo results to the national estimates in HCUPnet
Inpatient Quality Indicators (IQI) Software Instruction SAS
Inpatient Quality Indicators (IQI) 19 Version 43 (August 2011)
70 Producing Inpatient Quality Indicator Rates Processing Steps
Each Inpatient Quality Indicator (IQI) expressed as a rate is simply defined as
Outcome of interest Population at risk
[or]
Numerator Denominator
Conceptually five steps are necessary to produce the IQI rates The following describes the steps and how the software performs them
71 Step 1 Identify Outcomes in Inpatient Records Inpatient records are marked to indicate whether they contain the outcome of interest
(numerator or ldquoTrdquo for ldquotoprdquo) for each of the AHRQ IQI measures Records are marked by setting a series of flag variables each of which corresponds to the
numerator for a particular IQI For example if the inpatient record meets the conditions for inclusion in the outcome for IQI- 01 then the outcome indicator for IQI- 01 is set to one
This step requires one pass through the discharge-level data and outputs a discharge-level data file containing the flag indicator variables for the outcomes for each IQI This output file also contains the original input variables with the exception of the diagnosis and procedure variables which have been removed to reduce the size of the output file
The first six Inpatient Quality Indicators are volume measures and for these QIs this first step is all that is necessary The remaining steps two though five are relevant for the remaining indicators which are rates as opposed to total volume measures
72 Step 2 Identify Populations at Risk
For the Provider IQI the populations at risk (the denominators for calculating the IQI rates or ldquopoprdquo) are derived from the hospital discharge records
For the four Area-level IQI the populations at risk (the denominators for calculating the IQI rates) are derived from US Census population figures
73 Step 3 Calculate Observed (raw) Inpatient Quality Indicator rates
Using the output data from step 1 and either hospital discharge or US Census population
data from step 2 the IQI rates are calculated for user-specified combinations of stratifiers These stratifiers include hospitals age groups raceethnicity categories sex and payer categories for the Provider IQI and areas (Metro Areascounties) age groups raceethnicity categories and sex for the Area-level IQI
Inpatient Quality Indicators (IQI) Software Instruction SAS
Inpatient Quality Indicators (IQI) 20 Version 43 (August 2011)
The programs calculate observed IQI rates regardless of the number of cases available However IQI rates based on only a few cases should be interpreted with caution
In some performance measurement work it is often recommended that rates be suppressed
when there are fewer than 30 cases in the denominator This exclusion rule serves two purposes
bull It eliminates unstable estimates based on too few cases
bull It helps protect the identities of hospitals and patients
This step outputs the observed rates for user-specified categories alone or in combination For example Provider IQI observed rates could be output at the hospital level at the payer level or at the hospital level by payer
74 Step 4 Risk-adjust the Inpatient Quality Indicator Rates
Regression coefficients from a reference population database (reflecting a large proportion of the US population) are applied to the observed rates in the risk-adjustment process These reference population file regression coefficients are provided as part of the Generalized Estimating Equation GEE routines included with IQI module The risk-adjusted rates will then reflect the age and sex distribution (and the APR-DRG distribution for the provider indicators) of data in the reference population file rather than the distribution for the hospitals or areas present in the usersrsquo data This approach will allow risk-adjusted rates produced by various users to be compared directly to one another
The programs calculate risk-adjusted IQI rates regardless of the number of cases available (however a minimum of 3) However IQI rates based on only a few cases should be interpreted with caution
75 Step 5 Create MSX Smoothed Rates
Shrinkage factors are applied to the risk-adjusted rates for each IQI in a process called multivariate signal extraction (MSX) For each IQI the shrinkage estimate reflects a lsquoreliability adjustmentrsquo unique to each indicator The less reliable the IQI is over time and across hospitals or areas the more the estimate lsquoshrinksrsquo the IQI toward the overall area mean The resulting rate will appear ldquosmootherrdquo than the raw rate meaning the year-to-year fluctuations in performance are likely to be reduced The shrinkage factors are provided as part of the IQI software and do not need to be calculated by users
These five steps reflect the IQI module production in a nutshell The next section of this document describes the specifics of each software component of the IQI module software
Inpatient Quality Indicators (IQI) Software Instruction SAS
Inpatient Quality Indicators (IQI) 21 Version 43 (August 2011)
80 Program Descriptions This section describes the seven SAS programs that assign calculate and print the Inpatient
Quality Indicators For each program there is a description a list of input and output files and an explanation of
changes to the program that may be required The flow of data through the IQI module programs is shown in the flowcharts in Figure 1 and Figure 2 that begin on page 6
If you desire to create and examine observed IQI rates then the CONTROL_IQI IQFMTS and the IQSAS1 programs will need to be used followed by IQSASP2 (for Provider observed rates and volume indicators) andor IQSASA2 (for Area observed rates) If you also wish to create risk-adjusted and smoothed IQI rates then you will also need to run the IQSASP3 andor the IQSASA3 program
81 Program 1 Modify Statements in the CONTROL_IQISAS Code
The CONTROL_IQISAS code contains all of the SAS statements that you need to modify in order to run the remaining IQI module programs (with one exception noted below) This location is where you specify for example the path names or locations of all your input and output data sets There is also a TITLE line that the user can fill in The items that need to be changed in order to run the IQSAS1 IQSASP2 IQSASP3 IQSASA2 and IQSASA3 programs are described below each program
The CONTROL_IQISAS code is automatically inserted into the remaining programs when they are executed You do not need to run CONTROL_IQISAS as a separate program
All of the changes needed for the CONTROL_IQISAS code are listed in the following descriptions for programs 2 ndash 7 Each program description contains a section labeled ldquoChangesrdquo that enumerates the modifications for CONTROL_IQISAS that are associated with that particular program
Lines of code to be modified are identified by the phrase ldquolt===USER MUST modifyrdquo which means the user must make the change or by ldquolt===USER MAY modifyrdquo which means the modification is optional
In all of the remaining programs included with the IQI module there is one line of code near
the beginning of each program that needs to be modified This line of code starts with the phrase ldquoFILENAME CONTROLrdquo You must modify this line to point to the path name where you stored your modified copy of the CONTROL_IQISAS file Pathnames should not exceed 255 characters in length
CONTROL_IQISAS has a collection of parameters that allow you to read in data from different locations or pathnames and write out data to different locations or pathnames For example ldquoLIBNAME IN0rdquo points to the location of your input data set for program IQSAS1 and ldquoLIBNAME OUT1rdquo points to the location of the output data set created by the IQSAS1 program
Inpatient Quality Indicators (IQI) Software Instruction SAS
Inpatient Quality Indicators (IQI) 22 Version 43 (August 2011)
The parameters allow these locations to be different from one another However if you wish to read in and write out all of the data to the same location it is easiest to just make a global change in CONTROL_IQISAS changing ldquoCpathnamerdquo to the single directory location that you wish to use
There is a global PRINT parameter in CONTROL_IQISAS that as a default prints all of the output summary records at the end of the IQSASP2 IQSASP3 IQSASA2 and IQSASA3 programs These printouts may be quite large if you have a large database with a large number of hospitals and if you choose the results to be finely stratified If you wish to turn this feature off set PRINT to have a value of zero in CONTROL_IQISAS to turn this feature on set PRINT to have a value of 1
The global MALEVL parameter in CONTROL_IQISAS by default instructs all programs to define geographic areas by county for all areas in the input datasets Refer to Page 14 for a list of values for the MALEVL parameter
82 Program 2 Run IQFMTS
The IQFMTS program defines a format library which contains the diagnosis and procedure screens necessary for assigning the outcomes of interest This format library is used by most of the succeeding programs
The first few formats in this program are for the stratifiers (ie age sex raceethnicity and payer) These are followed by formats that are used for the identification of outcomes of interest in the IQSAS1 program and by formats that map FIPS county codes to Metro Areas in the IQSAS1 IQSASA2 and IQSASA3 programs At the end of the program are formats used to assign age categories for the risk adjustment process implemented in IQSASP3 and IQSASA3 and formats used with APR-DRG categories in IQSASP3 Input None Output Permanent SAS format library (FMTLIB) Changes
1 You must modify the ldquoFILENAME CONTROLrdquo statement at the beginning of the program to change the path so it points to your location of the CONTROL_IQISAS code
2 In CONTROL_IQISAS specify the location (path) of the format library in the
ldquoLIBNAME LIBRARYrdquo statement
83 Program 3 Run IQSAS1 The IQSAS1 program processes hospital discharge abstract data and flags inpatient records if
they contain outcomes of interest Outcome indicator names or numerators have prefix of ldquoTrdquo (Top) Stratifier variables are constructed at the beginning of the program
Inpatient Quality Indicators (IQI) Software Instruction SAS
Inpatient Quality Indicators (IQI) 23 Version 43 (August 2011)
This program assumes that the input data file (consisting of inpatient discharge abstract data) conforms to specific variable names attributes and coding conventions See Table 2 on page 9 for variable names and attributes for the input data file
Partial definitions of the Inpatient Quality Indicators are given in Table 1 on page 8 This table is presented to assist those individuals who desire to examine the software source code statements Complete definitions of the indicators are given in the document Inpatient Quality Indicators Technical Specifications (httpwwwqualityindicatorsahrqgovModulesiqi_overviewaspx) Input
1 User supplied SAS inpatient data set consisting of administrative hospital discharge abstract data This data set is a discharge level file with an array of diagnosis and procedure codes among other data elements
2 SAS format library (FMTLIB) created from the IQFMT program
Output
1 SAS dataset containing inpatient records with input variables stratifiers and flag indicators (TPIQxx and TAIQxx) for the outcomes of interest that will later form the numerators for the IQI rates
2 PROC MEANS (with N NMISS MIN MAX MEAN and SUM) of all of the
numeric variables in the output data file and a PROC CONTENTS of the output data file are output to hardcopy
3 A PROC PRINT of the first 24 observations in the output data file is output to
hardcopy Changes
1 The ldquoFILENAME CONTROLrdquo statement at the beginning of the program must be changed to reflect the location of the CONTROL_IQISAS code
2 In CONTROL_IQISAS specify the locations (paths) of the input and output files in
the ldquoLIBNAME IN0rdquo and ldquoLIBNAME OUT1rdquo statements
3 In CONTROL_IQISAS specify the names of the input and output files in the ldquoINFILE0rdquo and ldquoOUTFILE1rdquo statements
4 To define urban areas by Metro Area rather than by county change the MALEVL
parameter in CONTROL_IQISAS from 0 to 1 2 or 3 Rural areas will be defined by county no matter how MALEVL is specified Refer to page 14 for a list of values for the MALEVL parameter
5 The IQI module assumes that your starting SAS data set contains 30 diagnoses
and 30 procedures If these numbers are different in your input inpatient data then modify the NDX and NPR parameters in CONTROL_IQISAS
Inpatient Quality Indicators (IQI) Software Instruction SAS
Inpatient Quality Indicators (IQI) 24 Version 43 (August 2011)
If your variables are named differently from those used in the IQI software (see Table 1 on page 8) you MUST either rename those variables prior to running this program or modify IQSAS1 to include the renaming of your variables to match those expected by the software Similarly if your variables are not the same type ie character or numeric as those expected by the software (see Table 1) you MUST modify your variables prior to running this program
6 If you wish to use APR-DRG variables in the later IQSASP3 program to risk-adjust
the provider indicators then in CONTROL_IQISAS set the APRDRGFG flag parameter to one If you do not intend to run IQSASP3 to risk-adjust the provider indicators or if you do not have the APR-DRG variables available to you then set APRDRGFG to zero See Table 5 below
7 If you wish to risk-adjust the provider indicators by later running the IQSASP3
program then in CONTROL_IQISAS set the three APRDRG APRDRG_RISK_MORTALITY and XPRDRG_RISK_MORTALITY parameters to be the names of the DRG category variable and the mortality indicators created by APR-DRG software If you do not intend to use APR-DRG software then set the three APRDRG APRDRG_RISK_MORTALITY and XPRDRG_RISK_MORTALITY parameters to equal zero See Table 5 below
Table 5 How to set up IQI parameters and your data for using APR-DRG variables
If you do not intend to risk-
adjust the provider
indicators
If you are going to run IQSASP3 to risk adjust the provider indicators
If you have APR-DRG software available
If you do not have APR-DRG software
available
Preliminary data processing None
Run APR-DRG software to create APR-DRGs
and mortality indicators None
Setting the APRDRGFG parameter in
CONTROL_IQISAS Set to equal zero Set to equal one Set to equal zero
Setting the APR_DRG APRDRG_RISK_MORTAL
ITY and XPRDRG_RISK_MORTAL
ITY parameters in CONTROL_IQISAS
No action required
Set to equal the names of the variables output
from the APR-DRG software
Set to equal zero
84 Program 4 Run IQSASP2
For all but the volume indicators (IQI 01-07) the IQSASP2 program calculates the observed or raw rates for the provider-level Inpatient Quality Indicators using the data derived in a previous step (IQSAS1) These observed rates are stratified by combinations of providers sex age race and payer categories The program first totals the indicator flags created by the
Inpatient Quality Indicators (IQI) Software Instruction SAS
Inpatient Quality Indicators (IQI) 25 Version 43 (August 2011)
IQSAS1 program and then for each of the desired stratifiers divides these totals by the hospital discharges in the universe for the indicator The population denominators are stored in variables with names that have a prefix of ldquoPrdquo (Pop) The Observed rates are stored in variables that have a prefix of ldquoOrdquo Input
1 The SAS dataset that was created in the IQSAS1 This dataset is a discharge-level file that contains inpatient records with input variables stratifiers and the 30 flag indicators for the IQI Provider outcomes of interest
2 SAS format library (FMTLIB) created from the IQFMT program
Output
1 SAS dataset with summary records that contain observed rates (OPIQxx variables where lsquoxxrsquo refers to the indicator number) the counts of outcomes that formed the numerators of the rates (TPIQxx variables) and the hospital discharge totals that formed the denominators of the observed rates (PPIQxx variables) It also includes variables indentifying present on admission (POA) and conditions for provider based outcomes of interest (QPQIxx) The output file has records summarized to the various combinations of stratifiers specified in the TYPELVLP parameter that is described in item number 4 in the ldquoChangesrdquo section below Note that the observed rates and the denominator totals are not generated for the Provider volume indicators (IQI 01-07)
2 An optional ASCII (comma delimited) text file that the user can then import into a
spreadsheet This text file contains the same information as the SAS output dataset The text file will contain the OPIQxx observed rates the TPIQxx counts of outcomes that formed the numerators of the rates and the PPIQxx counts of outcomes that formed the denominators of the rates The different recordsrows in the text file will correspond to the different TYPELVLP stratification combinations
3 A PROC MEANS (with N NMISS MIN MAX MEAN and SUM) of the provider-
level summary records that shows statistics for the OPIQxx observed rates the TPIQxx counts of outcomes that formed the numerators of the rates and the PPIQxx counts of outcomes that formed the denominators of the rates These means will only be generated if the user included a value of 16 for the TYPELVLP parameter discussed in item 4 in the ldquoChangesrdquo section below
4 A PROC CONTENTS of the output SAS summary dataset is output to hardcopy
5 A PROC PRINT of the output summary dataset is provided at the end of the hardcopy
printout This printout may be quite large depending on the number and the types of stratifications that the user requests with the TYPELVLP parameter discussed in item number 4 in the ldquoChangesrdquo section below If the user does not wish to generate this printout then the global ldquoPRINTrdquo parameter in CONTROL_IQISAS code should be set to zero
Inpatient Quality Indicators (IQI) Software Instruction SAS
Inpatient Quality Indicators (IQI) 26 Version 43 (August 2011)
Changes 1 The ldquoFILENAME CONTROLrdquo statement at the beginning of the program must be
changed to reflect the location of the CONTROL_IQISAS code 2 In CONTROL_IQISAS specify the locations (paths) of the input and output SAS
files in the ldquoLIBNAME INP2rdquo and ldquoLIBNAME OUTP2rdquo statements
3 In CONTROL_IQISAS specify the names of the input and output files in the ldquoINFILE1rdquo and ldquoOUTFILP2rdquo statements The name that you specify with INFILE1 should be for the file that you created using the IQSAS1 program
4 In CONTROL_IQISAS specify the levels of aggregation for the observed rates This
step is done by specifying numbers between 0 and 31 in the ldquoLET TYPELVLP =rdquo statement Each number from 0 to 31 corresponds to a different level or combination of levels as shown in Table 6 The default values of 0 16 will provide an overall total and provider-level totals
If TYPELVLP includes the value 0 then the first observation in the output summary data file will contain the overall totals and observed rates for the entire database created with the IQSAS1 program
5 In CONTROL_IQISAS if you wish to create an ASCII (comma delimited) text file that you can import into a spreadsheet then set the TEXTP2 parameter to 1 Otherwise the default value of zero for TEXTP2 will skip around the code that would generate this file
6 In CONTROL_IQISAS if you wish to create an ASCII (comma delimited) text file
that you can import into a spreadsheet then specify the path (including the file name) for this ASCII text file in the FILENAME IQTEXTP2rdquo statement
Inpatient Quality Indicators (IQI) Software Instruction SAS
Inpatient Quality Indicators (IQI) 27 Version 43 (August 2011)
Table 6 IQSASP2 Aggregation Possibilities
TYPELVLP Stratification 0 Overall 1 Race 2 Payer 3 Payer Race 4 Sex 5 Sex Race 6 Sex Payer 7 Sex Payer Race 8 Age 9 Age Race 10 Age Payer 11 Age Payer Race 12 Age Sex 13 Age Sex Race 14 Age Sex Payer 15 Age Sex Payer Race 16 Provider 17 Provider Race 18 Provider Payer 19 Provider Payer Race 20 Provider Sex 21 Provider Sex Race 22 Provider Sex Payer 23 Provider Sex Payer Race 24 Provider Age 25 Provider Age Race 26 Provider Age Payer 27 Provider Age Payer Race 28 Provider Age Sex 29 Provider Age Sex Race 30 Provider Age Sex Payer 31 Provider Age Sex Payer Race
0 and 16 TYPELVLP (overall and provider) are default values for the level of computation in the software
For example if you are using a state inpatient hospital database you might specify the following TYPELVLP values
0 ndash provides overall rates for your entire state 8 ndash provides overall rates for your state broken down by age groups 16 ndash provides rates for providers within your state 24 ndash provides rates for age groups within these providers
85 Program 5 Run IQSASP3
The IQSASP3 program calculates risk-adjusted rates by patient age sex and APR-DRG if available for each IQI and then calculates smoothed rates The risk-adjusted and smoothed rates are not calculated for the Provider volume indicators IQI 01-07 just as observed rates were not calculated for these indicators
Inpatient Quality Indicators (IQI) Software Instruction SAS
Inpatient Quality Indicators (IQI) 28 Version 43 (August 2011)
The programs calculate risk-adjusted IQI rates regardless of the number of cases available However IQI rates based on only a few cases should be interpreted with caution
The output file has records summarized to the various combinations of stratifiers that were specified in the TYPELVLP parameter of the preceding IQSASP2 program See Table 6 on page 27 Input
1 SAS format library (FMTLIB) created from the IQFMT program 2 The discharge-level file that was created with the IQSAS1 program
3 The SAS dataset with summary records that was created with the IQSASP2 program 4 A text file containing regression coefficients from a regression that was run on a
reference SID dataset These coefficients will be used in the risk-adjustment process Two files are provided as part of the IQI module Gee_piqxx_RegressionAnalysisGeecsv contains the regression coefficients Prediction_PIQxxxml contains the input parameters for the executable AHRQexe
Users must create a directory ldquoCAHRQQI AHRQPredictionrdquo and copy the
executable AHRQexe to that directory (along with 5 other files) Users must also create a directory ldquoCAHRQQIIQIrdquo and copy the zip file IQI_GEE_Input_Fileszip to that directory Extract all of the files from IQI_GEE_Input_Fileszip into the directory ldquoCAHRQQIIQIrdquo (See version 43 introduction on page 1)
5 A text file containing three arrays for use in the smoothing process The arrays
contain noise estimates signal estimates and mean area rates for each IQI Specify file MSXIQP42TXT The text file does not need to be converted to a SAS file for use with the software
Output
1 A SAS dataset with an overall summary record and with provider-level summary records that contain the three types of indicator rates along with the components of the initial raw rates Specifically the file contains the observed rates (OPIQxx variables) the risk-adjusted rates (RPIQxx variables) the smoothed rates (SPIQxx variables) the expected rates (EPIQxx variables) the counts of outcomes that formed the numerators of the observed rates (TPIQxx variables) and the hospital discharge totals that formed the denominators of the observed rates (PPIQxx variables) When stratifications other than hospital are selected the RPIQxx variables and their confidence intervals are observedexpected ratios to avoid confounding with risk-adjustment variables
2 An optional ASCII (comma delimited) text file that the user can then import into a
spreadsheet This text file contains the same information as the SAS output dataset
Inpatient Quality Indicators (IQI) Software Instruction SAS
Inpatient Quality Indicators (IQI) 29 Version 43 (August 2011)
The text file will contain the OPIQxx observed rates and their TPIQxx and PPIQxx numerator and denominator components the RPIQxx risk-adjusted rates the SPIQxx smoothed rates and the EPIQxx expected rates Each record or row in the text file will correspond to a specification group
3 A PROC MEANS (with N NMISS MIN MAX MEAN and SUM) of the provider-
level summary records that shows statistics for the observed risk-adjusted and smoothed rates and statistics for the counts of outcomes that formed the numerators and denominators of the observed rates These means will only be generated if the user included a value of 16 for the TYPELVLP parameter of the preceding IQSASP2 program (see Table 6 on page 27)
4 A PROC CONTENTS of the output SAS summary dataset is output to hardcopy
5 A PROC PRINT of the output summary dataset is provided at the end of the hardcopy
printout This printout may be quite large depending on the number and the types of stratifications that the user requested with the TYPELVLP parameter of the preceding IQSASP2 program (see Table 6 on page 27) If the user does not wish to generate this printout then the global ldquoPRINTrdquo parameter in CONTROL_IQISAS code should be set to zero
Changes
1 The ldquoFILENAME CONTROLrdquo statement at the beginning of the program must be changed to reflect the location of the CONTROL_IQISAS code
2 In CONTROL_IQISAS specify the locations (paths) of the input and output SAS
files in the ldquoLIBNAME INP3rdquo and ldquoLIBNAME OUTP3rdquo statements
3 In CONTROL_IQISAS specify in the ldquoINFILE1rdquo statement the name of the discharge-level file that you created with the IQSAS1 program
4 In CONTROL_IQISAS specify in the ldquoFILENAME MSXPrdquo statement the path
(including the file name) for the ASCII text file that contains the estimates to smooth the indicator rates Specify file MSXIQP42TXT
5 In CONTROL_IQISAS specify in the ldquoINFILEP2rdquo statement the name of the
summary file that you created with the IQSASA2 program
6 In CONTROL_IQISAS specify in the ldquoOUTFILP3rdquo statement the name that you wish the output file to have
7 In CONTROL_IQISAS if you wish to create an ASCII (comma delimited) text file
that you can import into a spreadsheet then set the TEXTP3 parameter to 1 Otherwise the default value of zero for TEXTA3 will skip the code that would generate this file
Inpatient Quality Indicators (IQI) Software Instruction SAS
Inpatient Quality Indicators (IQI) 30 Version 43 (August 2011)
8 In CONTROL_IQISAS if you wish to create an ASCII (comma delimited) text file that you can import into a spreadsheet then specify the path (including the file name) for this ASCII text file in the ldquoFILENAME IQTEXTP3rdquo statement
86 Program 6 Run IQSASA2
The IQSASA2 program calculates the observed or raw rates for the area-level Inpatient Quality Indicators using the data derived in a previous step (IQSAS1) These observed rates can be stratified by combinations of area sex age and race categories The program first totals the four area indicator flags created by the IQSAS1 program and then for each of the desired stratifiers divides these totals by the pertinent residential population The population denominators are stored in variables with names that have a prefix of ldquoPrdquo (Pop) The Observed rates are stored in variables that have a prefix of ldquoOrdquo Input
1 The SAS dataset that was created in the IQSAS1 This dataset is a discharge-level file that contains inpatient records with input variables stratifiers and the four new flag indicators for the IQI Area-level outcomes of interest
2 A text file with Census area residential populations stratified by area age sex and
ethnicity categories The file POP95T11TXT is currently provided on the website as a separate download The user should set POPYEAR to the year that best matches the userrsquos discharge data file
Users do not need to convert the ASCII text file to a SAS dataset for use with the software
3 SAS format library (FMTLIB) created from the IQFMT program
Output
1 SAS dataset with summary records that contain observed rates (OAIQxx variables where xx refers to the indicator number) the counts of outcomes that formed the numerators of the rates (TAIQxx variables) and the residential population totals that formed the denominators of the observed rates (PAIQxx variables) The output file has records summarized to the various combinations of stratifiers specified in the TYPELVLA parameter that is described in item number 5 in the ldquoChangesrdquo section below
2 An optional ASCII (comma delimited) text file that the user can then import into a
spreadsheet This text file contains the same information as the SAS output dataset The text file will contain the OAIQxx observed rates the TAIQxx counts of outcomes that formed the numerators of the rates and the PAIQxx residential population totals The different recordsrows in the text file will correspond to the different TYPELVLA stratification combinations
Inpatient Quality Indicators (IQI) Software Instruction SAS
Inpatient Quality Indicators (IQI) 31 Version 43 (August 2011)
3 A PROC MEANS (with N NMISS MIN MAX MEAN and SUM) of the area-level summary records that shows statistics for the OAIQxx observed rates the TAIQxx counts of outcomes that formed the numerators of the rates and the PAIQxx residential populations totals These means will only be generated if the user included a value of 8 for the TYPELVLA parameter discussed in item number 5 in the ldquoChangesrdquo section below
4 A PROC CONTENTS of the output SAS summary dataset is output to hardcopy
5 A PROC PRINT of the output summary dataset is provided at the end of the hardcopy
printout This printout may be quite large depending on the number and the types of stratifications that the user requests with the TYPELVLA parameter discussed in item number 5 in the ldquoChangesrdquo section below If the user does not wish to generate this printout then the global ldquoPRINTrdquo parameter in CONTROL_IQISAS code should be set to zero
Changes
1 The ldquoFILENAME CONTROLrdquo statement at the beginning of the program must be changed to reflect the location of the CONTROL_IQISAS code
2 In CONTROL_IQISAS specify the locations (paths) of the input and output SAS
files in the ldquoLIBNAME INA2rdquo and ldquoLIBNAME OUTA2rdquo statements
3 In CONTROL_IQISAS specify the names of the input and output files in the ldquoINFILE1rdquo and ldquoOUTFILA2rdquo statements The name that you specify with INFILE1 should be for the file that you created using the IQSAS1 program
4 In CONTROL_IQISAS specify the path (including the file name) for the ASCII
population text file in the ldquoFILENAME POPFILE statement The file name will be POP95T11TXT The user should set POPYEAR to the year that best matches the userrsquos discharge data file
5 In CONTROL_IQISAS specify the levels of aggregation for the observed rates This
change is done by specifying numbers between 0 and 15 in the ldquoLET TYPELVLA =rdquo statement Each number from 0 to 15 corresponds to a different level or combination of levels as shown in
Inpatient Quality Indicators (IQI) Software Instruction SAS
Inpatient Quality Indicators (IQI) 32 Version 43 (August 2011)
6 Table 7 The default values of 0 (overall) and 8 (area) will provide an overall total and area-level totals
WARNING TYPELVLA must include the values 0 (overall) and 8 (area) if you wish to subsequently run program IQSASA3 for risk-adjusted and smoothed rates
If TYPELVLA includes the value 0 (overall) then the first observation in the output summary data file will contain the overall totals and observed rates for the entire database created with the IQSAS1 program
Table 7 IQSASA2 aggregation possibilities
TYPELVLA Stratification 0 Overall 1 Race 2 Sex 3 Sex Race 4 Age 5 Age Race 6 Age Sex 7 Age Sex Race 8 Area 9 Area Race 10 Area Sex 11 Area Sex Race 12 Area Age 13 Area Age Race 14 Area Age Sex 15 Area Age Sex Race
0 (overall) and 8 (are) TYPELVLA are default values for the level of computation in the software
For example if you are using a state inpatient hospital database you might specify the following TYPELVLA values
0 ndash provides overall rates for your entire state 4 ndash provides overall rates for your state broken down by age groups 8 ndash provides rates for areas within your state 12 ndash provides rates for age groups within these areas
7 In CONTROL_IQISAS if you wish to create an ASCII (comma delimited) text file
that you can import into a spreadsheet then set the TEXTA2 parameter to 1 Otherwise the default value of zero for TEXTA2 will skip the code that would generate this file
8 In CONTROL_IQISAS if you wish to create an ASCII (comma delimited) text file
that you can import into a spreadsheet then specify the path (including the file name) for this ASCII text file in the ldquoFILENAME IQTEXTA2rdquo statement
Inpatient Quality Indicators (IQI) Software Instruction SAS
Inpatient Quality Indicators (IQI) 33 Version 43 (August 2011)
87 Program 7 Run IQSASA3 The IQSASA3 program calculates age and sex risk-adjusted rates for each area-level IQI
(overall rates and rates by area) and then calculates smoothed rates Input
1 SAS format library (FMTLIB) created from the IQFMT program 2 The discharge-level file that was created with the IQSAS1 program
3 The SAS dataset with summary records that was created with the IQSASA2 program
4 A text file with Census area residential populations (stratified by area sex and
discrete age categories) One file is currently provided along with the IQI module software The file is POP95T11TXT The user should set POPYEAR to the year that best matches the userrsquos discharge data file The text file does not need to be converted to a SAS file for use with the software
5 A text file (COVIQA42TXT) containing regression coefficients from a regression
that was run on the reference SID dataset These coefficients will be used in the risk adjustment process This file is provided to you as part of the IQI module The text file does not need to be converted to a SAS file for use with the software
6 A text file (MSXIQA42TXT) containing two arrays for use in the smoothing process
The arrays contain noise estimates signal estimates and mean area rates for each IQI This file is provided to you as part of the IQI module The text file does not need to be converted to a SAS file for use with the software
Output
1 A SAS dataset with an overall summary record and with area-level summary records that contain the three types of indicator rates along with the components of the initial raw rates Specifically the file contains the observed rates (OAIQxx variables) the risk-adjusted rates (RAIQxx variables) the smoothed rates (SAIQxx variables) the counts of outcomes that formed the numerators of the observed rates (TAIQxx variables) and the residential population totals that formed the denominators of the observed rates (PAIQxx variables) When stratifications other than area are selected the RAIQxx variables and their confidence intervals are observedexpected ratios to avoid confounding with risk-adjustment variables
2 An optional ASCII (comma delimited) text file that the user can then import into a
spreadsheet This text file contains the same information as the SAS output dataset The text file will contain the OAIQxx observed rates and their TAIQxx and PAIQxx components the RAIQxx risk-adjusted rates and the SAIQxx smoothed rates Each record or row in the text file will correspond to a different area
Inpatient Quality Indicators (IQI) Software Instruction SAS
Inpatient Quality Indicators (IQI) 34 Version 43 (August 2011)
3 Outputs to hardcopy are PROC MEANS (with N NMISS MIN MAX MEAN and SUM) of risk-adjusted and smoothed rates in two intermediate work files and of all of the numeric variables in the final output data file The printout also contains a PROC CONTENTS of the output SAS dataset A PROC PRINT of the output dataset is provided only if the ldquoPRINTrdquo parameter in CONTROL_IQISAS code is set to one
6 A PROC MEANS (with N NMISS MIN MAX MEAN and SUM) of the area-level
summary records that shows statistics for the OAIQxx observed rates and their TAIQxx and PAIQxx components the RAIQxx risk-adjusted rates and the SAIQxx smoothed rates
7 A PROC CONTENTS of the output SAS summary dataset is output to hardcopy
8 A PROC PRINT of the output summary dataset is provided at the end of the hardcopy
printout If the user does not wish to generate this printout then the global ldquoPRINTrdquo parameter in CONTROL_IQISAS code should be set to zero
Changes
1 The ldquoFILENAME CONTROLrdquo statement at the beginning of the program must be changed to reflect the location of the CONTROL_IQISAS code
2 In CONTROL_IQISAS specify the locations (paths) of the input and output SAS
files in the ldquoLIBNAME INA3rdquo and ldquoLIBNAME OUTA3rdquo statements
3 In CONTROL_IQISAS specify in the ldquoINFILE1rdquo statement the name of the discharge-level file that you created with the IQSAS1 program
4 In CONTROL_IQISAS specify the path (including the file name) for the ASCII
population text file in the ldquoFILENAME POPFILE3rdquo statement The file name is POP95T11TXT These files are provided along with the software The file used should be the one that is closest to the year associated with your particular data These files contain Census residential estimates by area gender and discrete age categories
5 In CONTROL_IQISAS specify in the ldquoFILENAME COVARArdquo statement the path
(including the file name) for the ASCII text file that contains regression coefficients from a regression that was run on reference SID dataset The name of the file is COVIQA42TXT
6 In CONTROL_IQISAS specify in the ldquoFILENAME MSXArdquo statement the path
(including the file name) for the ASCII text file that contains the estimates to smooth the indicator rates The name of the file is MSXIQA42TXT
7 In CONTROL_IQISAS specify in the ldquoINFILEA2rdquo statement the name of the
summary file that you created with the IQSASA2 program
Inpatient Quality Indicators (IQI) Software Instruction SAS
Inpatient Quality Indicators (IQI) 35 Version 43 (August 2011)
8 In CONTROL_IQISAS specify in the ldquoOUTFILA3rdquo statement the name that you wish the output file to have
9 In CONTROL_IQISAS if you wish to create an ASCII (comma delimited) text file
that you can import into a spreadsheet then set the TEXTA3 parameter to 1 Otherwise the default value of zero for TEXTA3 will skip the code that would generate this file
10 In CONTROL_IQISAS if you wish to create an ASCII (comma delimited) text file
that you can import into a spreadsheet then specify the path (including the file name) for this ASCII text file in the ldquoFILENAME IQTEXTA3rdquo statement
Inpatient Quality Indicators (IQI) Software Instruction SAS
Inpatient Quality Indicators (IQI) 36 Version 43 (August 2011)
90 Reviewing the Printed Output This section contains tips for reviewing some of the printed output from the IQI module
These tips are oriented toward explaining the interrelationships between printout items from different programs and hopefully will help to reveal the nature and structure of the module outputs For guidance in interpreting the results see the Interpretations Guide
The final output of the IQI module is a PROC PRINT from IQSASP3 (for provider-level indicators) and IQSASA3 (for area-level indicators) All interim printouts are for checking and trouble-shooting However if you have elected to refrain from risk-adjusting and smoothing the data then the final outputs will be the PROC PRINT at the end of the IQSASP2 andor IQSASA2 programs
91 IQSAS1
The initial printout from the IQSAS1 program contains PROC MEANS for all of the numeric variables in the output discharge-level dataset It will contain information for the newly constructed TAIQxx and TPIQxx flag variables that will later form the numerators for the indicator rates For each TAIQxx and TPIQxx flag variable
bull The SUM will contain the total number of observations in the dataset that were found to have the particular outcome of interest
bull For the six Provider volume indicators (TPIQ01-TPIQ02 TPIQ04-TPIQ07) and the four Area indicators (TAIQ26-TAIQ29) the MEAN MINIMUM and MAXIMUM will usually be the value one since the flag variables have either been set to missing (lsquorsquo) or to a value of one The remainder of the Provider indicators (TPIQ08-TPIQ09 TPIQ11-TPIQ25 and TPIQ30-TPIQ34) have a value of one zero or missing (lsquorsquo) For these indicators a value of zero was assigned to the TPIQxx flag if a particular observation was part of the population at risk for a particular indicator but did not have the particular outcome of interest So for example TPIQ21 = 1 indicates a patient who had a Cesarean section while TPIQ21 = 0 identifies a patient who had a delivery but not a C-section
bull For the Provider indicators TPIQ08-TPIQ09 TPIQ11-TPIQ25 and TPIQ30-TPIQ34 the MEANs will contain a close approximation of the eventual overall observed indicator rates The values will change slightly after IQSASP2 has applied additional parts of the indicator definitions
bull N lists the number of observations in the dataset with non-missing values For the six provider-based volume indicators and the four area-level indicators N for TPIQxx or TAIQxx will be the same as the SUM For the other provider-based indicators N will contain the denominator for the observed indicator rate Note the Nrsquos or denominators for six of the mortality indicators (ie IQI 08-12 30 and 31) will be similar to the Ns and SUMs for the six volume indicators (TPIQ01-TPIQ02 TPIQ04-TPIQ07) but often they will not be exactly identical (eg the mortality indicators exclude discharges that were transferred to other hospitals)
Inpatient Quality Indicators (IQI) Software Instruction SAS
Inpatient Quality Indicators (IQI) 37 Version 43 (August 2011)
The IQSAS1 printout also contains a PROC CONTENTS that lists all of the variables in the output dataset including the character variables that are present and a PROC PRINT of the first 24 observations in the output dataset
92 IQSASP2 The purpose of this printout is to provide the observed rates for all provider-level indicators
The default printout shows results by provider but other levels of output (as shown in Table 6) can be specified as well Note that risk-adjusted and smoothed rates are shown in the output from the next program
The printout from the IQSASP2 program contains PROC MEANS on the provider-level summary records for all of the numeric variables in the output summary dataset It will contain information for the newly constructed OPIQxx rates the PPIQxx denominators and the TPIQxx numerators
bull The _TYPE_ variable described in the MEANS table identifies the stratification level for the records in the output data set The _TYPE_ variable corresponds to the TYPELVLP parameter values that were specified (see item number 4 in the ldquoChangesrdquo section for the IQSASP2 program on page 32) In this case _TYPE_ always assumes the value of 16 since only the provider-level records are selected
bull The N statistic for _TYPE_ contains the number of providers in the output summary data set A TPIQxx numerator variable with a value for N that is lower than the N value for _TYPE_ indicates that there were no outcomes of interest for some of the providers Similarly a PPIQxx denominator variable with a lower value for N than _TYPE_ indicates that for some providers there were no hospital discharges with the outcome of interest
bull The MINIMUM value for the TPIQ08-TPIQ25 TPIQ30 and TPIQ31 numerators will usually be zero since values of zero were assigned for observations that were part of the population for the rate denominator but did not have the particular outcome of interest to be included in the rate numerator For the volume indicators (TPIQ01-TPIQ07) the MINIMUM value will be one or higher
For the observed rates the User should NOT report the MEANS displayed here but instead should refer to the overall means in the output dataset that are also present in the subsequent PROC PRINT The MEANS given here are means of hospital means ie all hospitals are given equal weight regardless of the number of discharges in the different hospitals
bull The SUMs for the counter variables TPIQxx and PPIQxx will contain overall file totals for these data elements The SUMs for the observed rates have no intuitive meaning If the ldquoPRINTrdquo parameter in the CONTROL_IQISAS program is set to one the subsequent
PROC PRINT output contains a complete dump of the output summary file Listed for each record are the stratification values the PPIQxx population denominators for the 30 provider indicators the TPIQxx outcome numerators for the 30 provider indicators and the 30 OPIQxx observed rates
Inpatient Quality Indicators (IQI) Software Instruction SAS
Inpatient Quality Indicators (IQI) 38 Version 43 (August 2011)
93 IQSASP3 The PROC PRINT at the end of this program provides your final output (This printout appears if the ldquoPRINTrdquo parameter in the CONTROL_IQISAS program is set to one)
The following table lists the column headers shown on the printed output and describes each
Each indicator is reported in a separate section Values of ldquoxxrdquo correspond to the two-digit IQI number Table 8 Provider level printed output
Column Heading Description Obs Observation 1 (with HOSPID = ldquordquo) is the overall average for the entire dataset
(TYPELVLP = 0) The remaining observations are individual providers or hospitals (TYPELVLP = 16)
HOSPID Identifier for each provider in the dataset AGECAT Age stratification category ndash See Table 6 for TYPELVLP settings SEXCAT Gender stratification category ndash See Table 6 for TYPELVLP settings PAYCAT Payer stratification category ndash See Table 6 for TYPELVLP settings RACECAT Race stratification category ndash See Table 6 for TYPELVLP settings TPIQxx Number of cases in the numerator PPIQxx Number of cases in the denominator (population at risk) OPIQxx Observed (raw) rate ndash Numerator divided by Denominator EPIQxx Expected rate ndash Rates the provider would have if it performed the same as the
reference population given the providerrsquos actual case-mix (eg age gender modified DRG and comorbidities)
RPIQxx Risk-adjusted rate ndash Accounts for the difference between the case-mix of the reference population and the providerrsquos case-mix When stratifications other than hospital or area are selected the RPIQxx variables and their confidence intervals are observedexpected ratios to avoid confounding with risk adjustment variables
LPIQxx Lower limit of confidence interval of risk-adjusted rate UPIQxx Upper limit of confidence interval of risk-adjusted rate SPIQxx Smoothed rate ndash Rates with removal of fluxuation over time XPIQxx Standard error of smoothed rate
Observation 1 (with HOSPID = ) is the overall average for the entire dataset (TYPELVL =
0) The remaining observations are individual providers or hospitals (TYPELVL = 16) Data will appear under the column headers AGECAT SEXCAT PAYCAT and RACECAT if you specify these levels of aggregation (shown in Table 6)
You may wish to express the results in more understandable terms
bull Multiply the mortality rates by 100 to express them as a percentage (eg 00338 100 = 34 mortality for CABG)
bull Multiply the utilization rates by 100 to express them as a percentage (eg 02040 100 = 204 C-section rate)
Inpatient Quality Indicators (IQI) Software Instruction SAS
Inpatient Quality Indicators (IQI) 39 Version 43 (August 2011)
The MEANS table is generated from the permanent provider-based output file and is provided for trouble-shooting and understanding your data but not for reporting The means are provided just for the provider level summary records
bull The N for all but the TPIQxx counter variables should contain the number of providers in the userrsquos database
bull The MEANS MINIMUMs and MAXIMUMs have their normal meaning and provide comparisons among the different hospitals or providers in your database
For the (observed risk-adjusted or smoothed) rates the User should NOT report the MEANS displayed here but instead refer to the overall means in the output dataset in the PROC PRINT labeled ldquoFINAL OUTPUTrdquo The MEANS given here are means of hospital means ie all hospitals are given equal weight regardless of the number of discharges in the different hospitals
bull Note The denominators for six of the mortality indicators ( 8 ndash 12 30 and 31) will be similar to the totals for the six volume indicators (TPIQ01-TPIQ07) but often they will not be exactly identical (eg the mortality indicators exclude discharges that were transferred to other hospitals)
bull If the ldquoPRINTrdquo parameter in the CONTROL_IQISAS program is set to one at the end of the printout is a PROC PRINT on the final provider-based output file Listed for each level of stratification are the stratifiers the numerator and denominator totals for the observed rates and the observed risk-adjusted and smoothed rates
94 IQSASA2
The purpose of this printout is to provide the observed rates for all area-level indicators The default printout shows overall results and results by area but other levels of output (as shown in Table 6) can be specified as well Note that risk-adjusted and smoothed rates are shown in the output from the next program
The printout from the IQSASA2 program contains PROC MEANS for all of the numeric variables in the output summary dataset It will contain information for the newly constructed OAIQxx rates the PAIQxx denominators and the TAIQxx numerators
bull The _TYPE_ variable described in the first row of the MEANS table identifies the stratification level for the records in the output data set The _TYPE_ variable corresponds to the TYPELVLA parameter values that were specified (see item 5 in the ldquoChangesrdquo section for the IQSASA2 program on page 31) In this case _TYPE_ always assumes the value of 8 since only the area-level records are selected
bull The N statistic for _TYPE_ contains the number of areas in the output summary data set A TAIQxx numerator variable with a lower value for N than _TYPE_ indicates that there were no outcomes of interest for some of the areas
bull The MINIMUM value for the TAIQxx numerators will be one or higher
Inpatient Quality Indicators (IQI) Software Instruction SAS
Inpatient Quality Indicators (IQI) 40 Version 43 (August 2011)
For the observed rates the User should NOT report the MEANS displayed here but instead should refer to the overall means in the output dataset that are also present in the subsequent PROC PRINT The MEANS given here are means of the area means ie all areas are given equal weight regardless of the population in the different areas
bull The SUMs for the counter variables TAQIxx and PAIQXX will contain overall file totals for these data elements The SUMs for the observed rates have no intuitive meaning
If the ldquoPRINTrdquo parameter in the CONTROL_IQISAS program is set to one the subsequent
PROC PRINT output contains a complete dump of the output summary file Listed for each record are the stratification values the PAIQxx population denominators for the four indicators the TAIQxx outcome numerators for the four indicators and the four OAIQxx observed rates
95 IQSASA3 The PROC PRINT at the end of this program provides your final output (This printout appears if the ldquoPRINTrdquo parameter in the CONTROL_IQISAS program is set to one)
The following table lists the column headers shown on the printed output and describes each
Each indicator is reported in a separate section Values of ldquoxxrdquo correspond to the two-digit IQI number Table 9 Area level printed output
Column Heading Description
Obs Observation 1 is the overall average for the entire dataset (TYPELVLA = 0) The remaining observations are individual areas (TYPELVLA = 8)
Area Identifier in the dataset for area TAIQxx Number of cases in the numerator PAIQxx Number of cases in the denominator (population at risk) OAIQxx Observed (raw) rate ndash Numerator divided by Denominator RAIQxx Risk-adjusted rate ndash Accounts for the difference between the case-mix of the
reference population and the arearsquos case-mix When stratifications other than hospital or area are selected the RPIQxx variables and their confidence intervals are observedexpected ratios to avoid confounding with risk adjustment variables
SAIQxx Smoothed rate ndash Rates with removal of fluxuation over time
Observation 1 (with AREA = blank) is the overall average for the entire dataset (TYPELVL = 0) The remaining observations are individual areas (TYPELVL = 8)
You may wish to express the results in more understandable terms
bull Multiply the utilization rates by 100000 to express them as a rate per 100000 population (eg 0000494 100000 = 494 hysterectomies per 100000 population)
The MEANS table is generated from the permanent area-level output file The means are
provided just for the area-level summary records
Inpatient Quality Indicators (IQI) Software Instruction SAS
Inpatient Quality Indicators (IQI) 41 Version 43 (August 2011)
bull The N for all but the TAIQxx counter variables should contain the number of different areas (Metro Areas and counties) in your database
bull The MEANs MINIMUMs and MAXIMUMs have their normal meaning and provide comparisons among the different areas in your database Note that the MAXIMUMs for the counter variables (the TAIQxx and PAIQxx variables) are associated with specific areas and therefore these MAXIMUMs may not match those in the prior IQSAS2 printouts since that run typically will include a record for the entire database
For the (observed risk-adjusted or smoothed) rates the User should NOT report the MEANS displayed here but instead refer to the overall means in the output dataset that are also present in the subsequent PROC PRINT The MEANS given here are means of area means ie all areas are given equal weight regardless of the number of discharges in the different areas
bull The SUMs of the counter variables (the TAIQxx and PAIQxx variables) yield the overall database totals
Inpatient Quality Indicators (IQI) Software Instruction SAS
Inpatient Quality Indicators (IQI) 42 Version 43 (August 2011)
100 Benchmark Timings The benchmark runtimes given below are from runs made on a Windows XP workstation
with a Pentium 4 CPU 280 GHz processor 512 MB of RAM and an IDE hard drive The dataset used contained 757624 observations with 15 diagnosis fields and 15 procedure fields
Step Run time (in seconds) Run IQFMTS to create the format library 2 Run IQSAS1 157 Run IQSASP2 21 Run IQSASP3 86 Run IQSASA2 10 Run IQSASA3 185
101 User Support Technical assistance is available through an electronic user support system monitored by the
QI support team to support users in their application of the IQI software The same e-mail address may be used to communicate to AHRQ any suggestions for IQI enhancements general questions and any QI related comments you may have AHRQ welcomes your feedback
The Internet address for user support and feedback is supportqualityindicatorsahrqgov AHRQ also offers a listserv to keep you informed on the Quality Indicators (QIs) The
listserv is used to announce any QI changes or updates new tools and resources and to distribute other QI related information This is a free service Simply follow the process described below to begin receiving important QI information All you need is a computer Internet access and an E-mail address It works just like other electronic distribution lists
Herersquos how to register 1 Send an E-mail message to listservqualityindicatorsahrqgov 2 On the subject line type Subscribe For example Subscribe
3 In the body of the message type sub Quality_Indicators-L and your full name For example sub Quality_Indicators-L John Doe
4 You will receive a message confirming that you are signed up If you have any questions contact AHRQ QI Support at the e-mail noted above You should
receive an automatic response e-mail message confirming receipt of your e-mail If you do not receive a confirmation message call (888) 512-6090
Inpatient Quality Indicators (IQI) Software Instruction SAS
Inpatient Quality Indicators (IQI) 43 Version 43 (August 2011)
Appendix A Links The following links may be helpful to users of the AHRQ Inpatient Quality Indicators
Inpatient Quality Indicators Version 43 Documents and Software Available at httpwwwqualityindicatorsahrqgovmodulesiqi_resourcesaspx and httpwwwqualityindicatorsahrqgovsoftwaredefaultaspx
Title Description
IQI User Guide Individual Measures
The user guide provides a technical overview of the IQI individual measures including literature and empirical evidence
IQI User Guide Composite Measures
The user guide provides a technical overview of the IQI composite measures
IQI Technical Specifications
Provides detailed definitions of each IQI including all ICD-9-CM and DRG codes that are included in or excluded from the numerator and denominator Note that exclusions from the denominator are automatically applied to the numerator
IQI Comparative Data This document provides the average volume provider rate and population rate as appropriate for each indicator
Fiscal year 2011 Coding Changes
This document summarizes the changes to the indicator definitions resulting from FY 2011 changes to ICD-9-CM coding and DRG changes These changes will only affect data from FY 2011 (October 1 2011) or later
Log of Changes to IQI Documents and Software
The Change Log document provides a cumulative summary of all changes to the IQI software software documentation and other documents made since the release of version 21 of the software in March 2003 Changes to indicator specifications that were not a result of new ICD-9-CM and DRG codes are also described in the Change Log
IQI Risk Adjustment Coefficient Tables
Tables for each IQI provide the stratification and coefficients used to calculate the risk-adjusted rate for each strata
SASreg IQI Software Documentation
This software documentation provides detailed instructions on how to use the SAS reg version of the IQI software including data preparation calculation of the IQI rates and interpretation of output
SASreg IQI Software Requires the SASreg statistical program distributed by the SAS Institute Inc The company may be contacted directly regarding the licensing of its products httpwwwsascom
3Mreg APRreg DRG Limited License Grouper for SASreg
Creates APR-DRG variables for use with SAS version of IQI software Instructions for running the software are included in the Zip file
Version 43 Listserv announcement
This document announces the release of the Version 43 software and documentation provides a summary of changes and links to relevant pages
Inpatient Quality Indicators (IQI) Software Instruction SAS
Inpatient Quality Indicators (IQI) 44 Version 43 (August 2011)
AHRQ QI Windows Application The AHRQ QI Windows Application calculates rates for all of the AHRQ Quality Indicators modules and does not require SASreg It is available at
httpwwwqualityindicatorsahrqgovwinqi_downloadhtm Additional Documents The following documents are available within the Archive section of the AHRQ QI Web page
httpwwwqualityindicatorsahrqgovArchivedefaultaspxiqi
bull Refinement of the HCUP Quality Indicators (Technical Review) May 2001 bull Refinement of the HCUP Quality Indicators (Summary) May 2001
In addition these documents may be accessed at the AHRQ QI Modules Web page
httpwwwqualityindicatorsahrqgovmodulesDefaultaspx bull AHRQ QI Measure Development Implementation Maintenance and Retirement bull ICD-9-CM to ICD-10-CMPCS Conversion of AHRQ QI March 2011 bull AHRQ QI Empirical Methods May 2011 bull Guidance for Using the AHRQ Quality Indicators for Hospital-level Public Reporting
or Payment August 2004 bull AHRQ Summary Statement on Comparative Hospital Public Reporting December
2005 bull Appendix A Current Uses of AHRQ Quality Indicators and Considerations for
Hospital-level bull Comparison of Recommended Evaluation Criteria in Five Existing National
Frameworks bull List of AHRQ QI Endorsed by the National Quality Forum
The following documents can be viewed or downloaded from the AHRQ QI News Web page
httpwwwqualityindicatorsahrqgovnewsdefaultaspx and httpwwwqualityindicatorsahrqgovArchiveNewsaspx bull February 2007 Newsletter - Year highlights and future plans bull February 2006 Newsletter ndash Year highlights and future plans bull 2006 Area Level Indicator Changes bull Considerations in Public Reporting for the AHRQ QI bull June 2005 Newsletter - Contains the article Using Different Types of QI Rates
Inpatient Quality Indicators (IQI) Software Instruction SAS
Inpatient Quality Indicators (IQI) 45 Version 43 (August 2011)
Other Tools and Information
IQI rates can be calculated using the modified Federal Information Processing Standards (FIPS) Statecounty code A list of codes is available at
httpwwwcensusgovpopestgeographiccodes02pdf
AHRQ provides a free on-line query system based on HCUP data that provides access to health statistics and information on hospital stays at the national regional and State level It is available at
httphcupahrqgovHCUPnetasp
Information on the 3Mtrade APR-DRG system is available at
httpwww3mcomushealthcarehisproductscodingrefined_drgjhtml
Inpatient Quality Indicators (IQI) Software Instruction SAS
Inpatient Quality Indicators (IQI) 46 Version 43 (August 2011)
Appendix B Using Different Types of QI Rates When should you use the observed expected risk adjusted andor smoothed rates generated
by the AHRQ QI software Here are some guidelines If the userrsquos primary interest is to identify cases for further follow-up and quality
improvement then the observed rate would help to identify them The observed rate is the raw rate generated by the QI software from the data the user provided Areas for improvement can be identified by the magnitude of the observed rate compared to available benchmarks andor by the number of patients impacted
Additional breakdowns by the default patient characteristics used in stratified rates (eg age gender or payer) can further identify the target population Target populations can also be identified by user-defined patient characteristics supplemented to the casedischarge level flags Trend data can be used to measure change in the rate over time
Another approach to identify areas to focus on is to compare the observed and expected rates The expected rate is the rate the provider would have if it performed the same as the reference population given the providerrsquos actual case-mix (eg age gender DRG and comorbidity categories)
If the observed rate is higher than the expected rate (ie the ratio of observedexpected is greater than 10 or observed minus expected is positive) then the implication is that the provider performed worse than the reference population for that particular indicator Users may want to focus on these indicators for quality improvement
If the observed rate is lower than the expected rate (ie the ratio of observedexpected is less than 10 or observed minus expected is negative) then the implication is that the provider performed better than the reference population Users may want to focus on these indicators for identifying best practices
Users can also compare the expected rate to the reference population rate reported in the AHRQ QI software or Comparative Data document to determine how their case-mix compares to the reference population The population rate refers to the overall rate for the reference population The reference population is defined in the Comparative Data Document If the population rate is higher than the expected rate then the providerrsquos case-mix is less severe than the reference population If the population rate is lower than the expected rate then the providerrsquos case-mix is more severe than the reference population
We use this difference between the population rate and the expected rate to ldquoadjustrdquo the observed rate to account for the difference between the case-mix of the reference population and the providerrsquos case-mix which is the providerrsquos risk-adjusted rate
If the provider has a less severe case-mix then the adjustment is positive (population rate gt expected rate) and the risk-adjusted rate is higher than the observed rate If the provider has a more severe case-mix then the adjustment is negative (population rate lt expected rate) and the risk-adjusted rate is lower than the observed rate The risk-adjusted rate is the rate the provider would have if it had the same case-mix as the reference population given the providerrsquos actual performance
Finally users can compare the risk-adjusted rate to the smoothed or ldquoreliability-adjustedrdquo rate to determine whether this difference between the risk-adjusted rate and reference population rate is likely to remain in the next measurement period Smoothed rates are weighted averages of the population rate and the risk-adjusted rate where the weight reflects the reliability of the providerrsquos risk-adjusted rate
Inpatient Quality Indicators (IQI) Software Instruction SAS
Inpatient Quality Indicators (IQI) 47 Version 43 (August 2011)
A ratio of (smoothed rate - population rate) (risk-adjusted rate - population rate) greater than 080 suggests that the difference is likely to persist (whether the difference is positive or negative) A ratio less than 080 suggests that the difference may be due in part to random differences in patient characteristics (patient characteristics that are not observed and controlled for in the risk-adjustment model) In general users may want to focus on areas where the differences are more likely to persist
Inpatient Quality Indicators (IQI) Software Instruction SAS
Inpatient Quality Indicators (IQI) 48 Version 43 (August 2011)
Appendix C IQI Input Data Dictionary Variable name Description Format Value description Comments
KEY Sequence number Unique case identifier Numeric
User defined unique numeric identifier for each discharge record
Not used by the QI programs but should be present to facilitate possible exploration allows user to link the records from the IQSAS1SAS program output file back to the original input data file
AGE Age in years at admission Numeric Age in years
If this data element is missing the discharge record will be excluded from analysis
AGEDAY Age in days (coded only when the age in years is less than 1) Numeric Age in days
Not used in the IQI program If not present in the input data file it is not necessary to create a dummy variable for this module
RACE Race of patient Numeric 1 2 3 4 5 6
White Black Hispanic Asian or Pacific Island Native American Other
The values of 1-5 are used directly in the QI software All other ethnicity codes are mapped to an lsquootherrsquo category
SEX Sex of patient Numeric
1 2
Male Female
If this data element is missing the discharge record will be excluded from the analysis
PAY1 Expected primary payer
Numeric 1 2 3 4 5 6
Medicare Medicaid Private incl HMO Self-pay No charge Other
The values of 1 2 3 and 4 are used directly in the QI software All other payer codes are mapped to an lsquootherrsquo category This data element is used to stratify only the Provider-level IQI (IQI-01 toIQI-25 IQI-30 to IQI-34)
PAY2 (SAS Only)
Expected secondary payer
Numeric 1 2 3 4 5 6
Medicare Medicaid Private incl HMO Self-pay No charge Other
Use is optional but must be present in data (set to missing if data element not available)
PSTCO
Location of patient residence or hospital location (FIPSdagger Statecounty code)
Numeric ssccc
Modified Federal Information Processing Standards Statecounty code2
See Appendix A for link to most recent list of codes If this data element is missing the discharge record will be excluded from rate calculations
HOSPID Data Source hospital number Numeric Hospital
identification number Used to facilitate data exploration and possible trouble shooting
2 Federal Information Processing Standard as defined by the US Department of Commerce National Institute of Standards and Technology (formerly National Bureau of Standards) Note Certain independent cities (Baltimore City Carson City and St Louis City) and areas within Hawaii and Virginia are assigned to different area groupings in the Modified FIPS categories as compared to the US Census Bureau groupings The AHRQ QI software uses the Modified FIPS code assignment of these areas Failure to use the Modified FIPS codes assignment will result in the use of incorrect denominator estimates for area indicators A list is available at httpwwwcensusgovpopestgeographiccodes02pdf
Inpatient Quality Indicators (IQI) Software Instruction SAS
Inpatient Quality Indicators (IQI) 49 Version 43 (August 2011)
Variable name Description Format Value description Comments
DISP Disposition of patient
Numeric 1 2 3 4 5 6 7 20
Routine Short-term hospital Skilled nursing facility Intermediate care Another type of facility Home health care Against medical advice Died in the hospital
The values 2 and 20 are referenced by the QI code (to identify transfers to another short-term hospital and patients who died in the hospital)
MORT30 (SAS Only)
30-Day Mortality Indicator Numeric
0 ndash not died within 30-days from admission
Use is optional but must be present in data (set to missing if data element not available)
1 ndash died within 30-days from admission
DNR Do Not Resuscitate Indicator Numeric
0 ndash No ldquoDo Not Resuscitaterdquo Indicator
Use is optional but must be present in data (set to missing if data element not available)
1 ndash ldquoDo Not Resuscitaterdquo Indicator
ATYPE Admission Type Numeric 1 2 3 4 5 6
Emergency Urgent Elective Newborn Trauma Center3 Other
Not used by the IQI program If not present in the input data file it is not necessary to create a dummy variable
ASOURCE Admission Source
Numeric 1 2 3 4 5
ER Another hospital Another facility including LTC Courtlaw enforcement Routinebirthother
The value 2 is referenced by the QI code (to identify transfers from another short-term hospital)
LOS Length of Stay Numeric Number of days from admission to discharge
Not used by the IQI program If not present in the input data file it is not necessary to create a dummy variable
APR_DRG APR-DRG category Numeric APR-DRG from 3Mreg software
Although the IQI module will operate without these variables users should run APR-DRG software on their raw data to assign this variable to each case See Section 53 on page 15
APRDRG_ RISK_ MORTALITY
APR-DRG Mortality Score Numeric
APR-DRG Risk of Mortality Score from 3Mreg software
See Section 53 on page 15
XPRDRG_ RISK_ MORTALITY
APR-DRG Mortality Score with POA Numeric
APR-DRG Risk of Mortality Score from 3Mreg Software using
See Section 53 on page 15
3 The ATYPE value ldquo5rdquo was used to indicate delivery only in the 1988 to 1997 HCUP data files The UB standards currently use ldquo5rdquo to indicate Trauma Center
Inpatient Quality Indicators (IQI) Software Instruction SAS
Inpatient Quality Indicators (IQI) 50 Version 43 (August 2011)
Variable name Description Format Value description Comments
POA information
DRG Diagnosis Related Group Numeric DRG from federal (CMS) DRG Grouper
DRGVER Diagnosis Related Group Version Numeric
DRG Version of federal (CMS) DRG Grouper
eg Version 28 for FY2011
MDC Major Diagnostic Category Numeric MDC from federal (CMS) DRG grouper
DISCWT Weight to assign to discharge Numeric Format as nnnnn
Cases with missing values are assigned a value of 1 Assigning a weight of zero has the effect of removing the case from the analysis
DX1 ndash DX30
ICD-9-CM diagnosis codes DX1 is the principal diagnosis DX2-DX30 are secondary diagnoses
String 3 4 or 5
characters (do not include decimal point)
Diagnosis codes Users must specify the number of diagnoses in the parameter ampNDX in CONTROL_IQISAS program
DXPOA1- DXPOA30-
Present on admission indicator for each diagnosis code
String
1 = present at the time of inpatient admission
These data will be used in risk adjustment and smoothing if the alternative parameter files of risk-adjustment covariates and population rates is specified
(YWE1)
0 = not present at the time of inpatient admission
(NUrsquo0rsquo )
NDX Count of the number of diagnoses (DX) on the discharge record
Numeric
Count of diagnoses (principal and all secondary diagnoses)
Not used by the IQI SAS program If not present in the input data file it is not necessary to create a dummy variable Definition is If the 1st discharge record has 1 Pr and the 2nd has 2 NPR would be 1 for the 1st record and 2 for the 2nd
PR1 ndash PR30
ICD-9-CM procedure codes PR1 is the principal procedure PR2-PR30 are secondary procedures
String 3 or 4
characters (do not include decimal point)
Procedure code
Users with more or fewer secondary procedures should modify the parameter ampNPR in CONTROL_IQISAS to reflect the number of diagnoses
NPR Count of the number of procedures (PR) on the discharge record
Numeric
Count of procedures (principal and all secondary procedures)
Not used by the IQI SAS program If not present in the input data file it is not necessary to create a dummy variable Definition is If the 1st discharge record has 1 Pr and the 2nd has 2 NPR would be 1 for the 1st record and 2 for the 2nd
Inpatient Quality Indicators (IQI) Software Instruction SAS
Inpatient Quality Indicators (IQI) 51 Version 43 (August 2011)
Variable name Description Format Value description Comments
POINTOFORIGINUB04
Point of Origin Numeric 4 Transfer from a hospital 5 Transfer from a skilled Nursing Facility (SNF) or Intermediate Care Facility (ICF)
Only these values are used by the QI programs
6 Transfer from another health care facility
IF ATYPE = 4
5 Born inside this hospital
6 Born outside of this hospital
PRDAY1 ndash PRDAY30
Days from admission to procedure PR1 is the principal procedure PR2-PR30 are secondary procedures
Numeric Days from Admission to Procedure4
Not used by the IQI program If not present in the input data file it is not necessary to create a dummy variable for this module
YEAR
Year of discharge The patientrsquos year of discharge For example a patient discharged on July 7 2004 would have a discharge year of lsquo2004rsquo
Numeric
YYYY
Discharge year should be within the range of 1997 to 2011
DQTR Quarter of discharge The calendar quarter of the patientrsquos discharge For example a patient discharged on July 7 2004 would have a discharge quarter of lsquo3rsquo
Numeric 1 January-March 2 April-June 3 July-September 4 October-December
See httphcup-usahrqgovtoolssoftwarecomorbiditycomorbidityjsp
4 Variables PRDAY1 to PRDAY30 are defined as the number of days from date of admission to date of procedure for each procedure For example if the patient was admitted on June 15th and had two procedures - the principal procedure on June 15th and a second procedure on June 18th ndash then the value of PRDAY1 would be zero (0) and the value of PRDAY2 would be three (3) For more information consult the HCUP data documentation at httpwwwhcup-usahrqgovdbvarsprdaynnisnotejsp
Inpatient Quality Indicators (IQI) Software Instruction SAS
Inpatient Quality Indicators (IQI) 52 Version 43 (August 2011)
Appendix D SAS IQI Output Data Dictionary SAS IQI Provider Output Column Heading Description Format Comments
Obs Observation 1 (with HOSPID = ) is the overall average for the entire dataset (TYPELVLP = 0) The remaining observations are individual providers or hospitals (TYPELVLP = 16)
Numeric
HOSPID Identifier for each provider in the dataset
Text Up to 12 characters
AGECAT Age stratification category Numeric range
SEXCAT Gender stratification category Numeric 1 = male 2 = female PAYCAT Payer stratification category Numeric 1 = Medicare
2 = Medicaid 3 = Private incl HMO 4 = Self-pay 5 = No charge 6 = Other
RACECAT Race stratification category Numeric 1 = White 2 = Black 3 = Hispanic 4 = Asian or Pacific Island 5 = Native American 6 = Other
TPIQxx The number of discharge records included in the numerator (outcome of interest) as defined for the indicator
Numeric
PPIQxx The number of discharge records included in the denominator (population at risk) as defined for the indicator
Numeric
OPIQxx The rate (observed numerator observed denominator) as defined for the indicator
Numeric
EPIQxx Rate calculated by assuming an average performance for each patient group based on the reference population but with the providerlsquos actual case-mix
Numeric
RPIQxx The estimated rate calculated by adjusting to an average case-mix
Numeric When stratifications other than hospital or area are selected the RPIQxx variables and their confidence intervals are observedexpected ratios to avoid confounding with risk adjustment variables
LPIQxx The lower confidence bound of the risk adjusted rate
Numeric
UPIQxx The upper confidence bound of the risk adjusted rate
Numeric
Inpatient Quality Indicators (IQI) Software Instruction SAS
Inpatient Quality Indicators (IQI) 53 Version 43 (August 2011)
Column Heading Description Format Comments
SPIQxx The smoothed rate calculated using multivariate signal extraction (MSX)
Numeric
XPIQxx Standard error of smoothed rate Numeric VPIQxx Variance for respective indicators Numeric
SAS IQI Area Output Column Heading Description Format Comments
Obs Observation 1 (with HOSPID = ) is the overall average for the entire dataset (TYPELVLP = 0) The remaining observations are individual providers or hospitals (TYPELVLP = 16)
Numeric
AREA Identifier in the dataset for area Text TAIQxx The number of discharge records
included in the numerator (outcome of interest) as defined for the indicator
Numeric
PAIQxx The number of discharge records included in the denominator (population at risk) as defined for the indicator
Numeric
OAIQxx The rate (observed numerator observed denominator) as defined for the indicator
Numeric
RAIQxx The estimated rate calculated by adjusting to an average case-mix
Numeric When stratifications other than hospital or area are selected the RAIQxx variables and their confidence intervals are observedexpected ratios to avoid confounding with risk adjustment variables
SAIQxx The smoothed rate calculated using multivariate signal extraction (MSX)
Numeric

Inpatient Quality Indicators (IQI) Software Instruction SAS
Inpatient Quality Indicators (IQI) vi Version 43 (August 2011)
Appendix A Links 43
Appendix B Using Different Types of QI Rates 46
Appendix C IQI Input Data Dictionary 48
Appendix D SAS IQI Output Data Dictionary 52
List of Figures Figure 1 Processing steps for the inpatient quality provider indicators 6
Figure 2 Processing steps for the inpatient quality area indicators 7
List of Tables Table 1 Inpatient quality indicator (IQI) variables 8
Table 2 Prefixes for the inpatient quality indicator (IQI) variables 9
Table 3 Inpatient quality module contents 9
Table 4 Treatment of missing data elements 17
Table 5 How to set up IQI parameters and your data for using APR-DRG variables 24
Table 6 IQSASP2 Aggregation Possibilities 27
Table 7 IQSASA2 aggregation possibilities 32
Table 8 Provider level printed output 38
Table 9 Area level printed output 40
Inpatient Quality Indicators (IQI) Software Instruction SAS
Inpatient Quality Indicators (IQI) 1 Version 43 (August 2011)
10 Introduction This documentation describes the software for implementing the Inpatient Quality Indicator
(IQI) module of the AHRQ Quality Indicators Version 43 and highlights features of the analytic approach of particular interest to new users
The programs documented here were developed for use in Statistical Analysis System (SASreg)1 The SASreg version of the IQI software is designed as a PC-based single-user application It has been tested with SASreg version 92 on a 32-bit machine To use the SAS version of the QI software users must have access to the commercially-available SASreg statistical software package including but not limited to BASE SAS SASSTAT and SASACCESS For more information visit the SAS Institute website at httpwwwsascom
The IQI software consists of a series of computer programs that
bull Assign and calculate IQI from hospital discharge abstracts or UB (uniform billing) claims data
bull Print IQI results in SAS format or as an ASCII text file (comma delimited) that can be imported into word processing documents spreadsheets or graphics software at the users option
bull Provide four options for stratifying rates by geographic areas
bull Create smoothed (ie reliability-adjusted) rates that reduce fluctuations over time due to random variation
bull The reference population database used by the software was updated to HCUPrsquos Year 2008 State Inpatient Databases (SID) This database is used to create the regression coefficients applied in risk adjustment (see Section 74) and the shrinkage factors used to calculate smoothed rates (see Section 75)
bull The syntax now supports a data weighting variable (DISCWT) like those used in the Nationwide Inpatient Sample This numeric variable must be present in the input file (see Section 51) and should be set to 1 if weighting is not desired
bull Effective March 1 2007 the UB-04 data specification manual includes a Present on Admission indicator (httpwwwcdcgovnchsdataicd9icdguide09pdf ) For the IQI POA data may impact risk-adjusted rates by excluding secondary diagnoses coded as complications from the identification of covariates If the userrsquos input file does not include POA data an estimation procedure is used to adjust the prevalence of the covariates to account for the missing POA data You may include POA data for all your records some of your records or none of them Including records with and without POA data is also allowed the estimation procedure is applied to those records where POA data are missing and not to those records where POA data are not missing
bull Installation of Version 43 SAS syntax requires additional steps for the risk adjustment procedures to operate correctly Once completed for one AHRQ QI module (ie IQI PSI or
1 SAS is a statistical program distributed by the SAS Institute Inc (httpwwwsascom) The company may be contacted directly regarding the licensing of their products The SAS Institute Inc does not have any affiliation with AHRQ nor involvement in the development of the AHRQ QI
Inpatient Quality Indicators (IQI) Software Instruction SAS
Inpatient Quality Indicators (IQI) 2 Version 43 (August 2011)
PDI) the Prediction Module step does not need to be repeated for the other modules The steps are
bull Installing the Prediction Module software
bull Click ldquoPrediction Modulerdquo link at httpwwwqualityindicatorsahrqgovsoftwareSASaspx
bull Save the ldquoAHRQSetup 092190msirdquo file to a directory on local machine
bull Double-click ldquoAHRQSetup 092190msirdquo ndash this will install the Prediction Module executable and license files in ldquoCProgram FilesBattelleAHRQrdquo (6 files total)
bull Create a new folder ldquoCAHRQQIAHRQPredictionrdquo and copy all 6 installation files to that location (so they are located in both places)
bull Saving the required files to run the AHRQ QI SAS software
bull Create a sub-folder under ldquoCAHRQQIrdquo called ldquoIQIrdquo
bull The software package contains another zip file called ldquoIQI_GEE_Input_Filesziprdquo All of the files within this zip file need to be extracted to the sub-folder ldquoCAHRQQIIQIrdquo
bull The syntax will compute risk-adjusted rates and observed-to-expected ratios for the pre-defined set of stratification variables (eg age gender payer race) When stratifications other than hospital or area are selected the RPPSxx variables and their confidence intervals are observedexpected ratios to avoid confounding with risk adjustment variables
Version 43 of the IQI software includes the following changes
bull The IQI module Version 43 contains formats that incorporate ICD-9-CM and DRG coding through September 30 2011 A list of the coding changes made for the fiscal year and a Change Log for the IQI module may be found on the AHRQ QI website (IQI)
bull The 3Mreg APRreg DRG Limited License Grouper for SASreg software has been updated to FY2011 codes Beginning with Version 23 3M will update the APR-DRG every fiscal year The optional limited license grouper available with the AHRQ QI software is ldquomulti-versionrdquo (ie Versions 20 23 to 28) The software will apply the correct version based on the discharge year and quarter Users who have their own APR-DRG grouper can use either the applicable DRG version or the ICD-9-CM mapping to Version 20 See Section 53 for information on APR-DRG variables The Inpatient Quality Indicators Comparative Data document provides comparative values
including average volumes provider rates and population rates depending on the type of indicator The Inpatient Quality Indicators Technical Specifications document lists all ICD-9-CM and DRG codes included in and excluded from the numerator and denominator of each indicator
See Appendix A for links to these and other documents as well as Web sites that may be of interest to IQI users
See Appendix B ldquoUsing Different Types of QI Ratesrdquo for an explanation of observed expected risk adjusted and smoothed rates and for guidance in the use of these rates
This instruction includes
Inpatient Quality Indicators (IQI) Software Instruction SAS
Inpatient Quality Indicators (IQI) 3 Version 43 (August 2011)
bull A discussion of the data elements necessary to produce the AHRQ IQI and the uniform coding conventions recommended for those elements
bull Descriptions of the IQI processing steps in nontechnical language
bull Detailed descriptions of the functions of each IQI SAS program
Critical user information is highlighted with this symbol
Inpatient Quality Indicators (IQI) Software Instruction SAS
Inpatient Quality Indicators (IQI) 4 Version 43 (August 2011)
20 Components of the Inpatient Quality Indicators Module
As shown in Table 3 on page 9 the Inpatient Quality Indicators module consists of eight SAS programs and six ASCII text files that contain auxiliary data These programs and text files are described in the subsequent sections of this document
A note on the naming conventions for the Inpatient Quality Indicators (IQI) module programs Most programs use the naming format of IQSASi IQSASAi or IQSASPi The first two characters ldquoIQrdquo of the program name indicate an Inpatient Quality Indicators program to distinguish it from other modules that have been or will be released from AHRQ The next three characters of the program name are ldquoSASrdquo In the programs that are specific to either area-level or provider-level indicators the sixth character of the program name is either ldquoArdquo or ldquoPrdquo The sixth character is an ldquoArdquo if it is for the production of area-level indicator rates that use county or Office of Management and Budget (OMB) defined metropolitan or micropolitan area (Metro Area) populations as denominators The sixth character is a ldquoPrdquo if it is a program for the production of provider-level indicator rates that use subsets of the hospital discharge population The last character (i) of the variable name designates the number of the specific program
Inpatient Quality Indicators (IQI) Software Instruction SAS
Inpatient Quality Indicators (IQI) 5 Version 43 (August 2011)
30 Quick Reference The subsequent four pages are intended to serve as a quick reference to assist in reading this
documentation and in reviewing the Inpatient Quality Indicator (IQI) module outputs Processing steps are shown first (Figure 1 and Figure 2) followed by a listing of the module variables (Table 1) variable prefixes (Table 2) and module contents (Table 3) One suggestion is to print these pages in duplex mode on two sheets of paper so that they can then be easily referred to as the need arises
31 Processing Steps
Figure 1 shows processing steps for the Inpatient Quality provider-level Indicators while Figure 2 shows steps for the Inpatient Quality area-level Indicators
Inpatient Quality Indicators (IQI) Software Instruction SAS
Inpatient Quality Indicators (IQI) 6 Version 43 (August 2011)
Figure 1 Processing steps for the inpatient quality provider-level indicators
NOTE Each of the SAS Programs in Figure 1 incorporates the CONTROL_IQISAS program which contains code the user must modify in order to run the IQI software The modifications include such items as specifying the name and location of the input data set the population data set and the output data set
SIDyy(SAS dataset
conforming to HCUP coding conventions)
IQFMTSCreates IQI format library
that is used by most programs
IQSAS1Assigns 01 indicators for
IQI outcomesIQI format library
IQ1(inpatient data with 01
outcome indicators)
IQSASP2Calculates observed rates across stratifiers for the
provider volume utilization and mortality indicators
To the next page of the flow chart
To the next page of the flow chart
IQP2(observed rates for the provider IQIs across
stratifiers)PRDIQPlsaquoVERrsaquoTXT(file of parameters for
risk adjustment or prediction syntax file)
IQSASP3Creates risk-adjusted
smoothed and expected rates for the utilization
and mortality IQIs
IQP3(observed risk-adjusted smoothed and expected
utilization and mortality IQI rates and observed volumes
across stratifiers)MSXIQPlsaquoVERrsaquoTXT
(shrinkage factors from reference dataset)
LEGEND
SAS Data file Program Text file (supplied)
GEE_PIQ_Regression AnalysislsaquoQIrsaquoCSV
(regression coefficient from reference dataset)
Prediction_PIQ lsaquoQIrsaquoxml(input parameters for the
executable AHRQ Predictionexe)
Inpatient Quality Indicators (IQI) Software Instruction SAS
Inpatient Quality Indicators (IQI) 7 Version 43 (August 2011)
Figure 2 Processing steps for the inpatient quality area-level indicators
Inpatient Quality Indicators (IQI) Software Instruction SAS
Inpatient Quality Indicators (IQI) 8 Version 43 (August 2011)
32 Inpatient Quality Indicator Module Details The following tables list the module indicator variables (Table 1) variable prefixes (Table 2)
and module contents (Table 3)
Table 1 Inpatient quality indicator (IQI) variables IQI
number Indicator Age categories 18 to 39 40 to 64 65 +
Provider Volumes 1 Esophageal resection 2 Pancreatic resection 4 AAA repair 5 CABG No 6 PTCA No 7 Carotid endarterectomy
Provider Post-procedural Mortality Rates 8 Esophageal resection 9 Pancreatic resection 11 AAA repair 12 CABG No 30 PTCAa No 31 Carotid endarterectomya 13 Craniotomy 14 Hip replacement
Provider In-hospital Mortality Rates 15 AMI 32 AMI Without Transfer Cases 16 CHF 17 Stroke 18 GI hemorrhage 19 Hip fracture 20 Pneumonia
Provider Utilization Rates 21 Cesarean delivery 33 Primary Cesarean delivery 22 VBAC Uncomplicated 34 VBAC All 23 Laparoscopic Cholecystectomy 24 Incidental appendectomy among elderly No No 25 Bi-lateral cardiac catheterization
Area-level Utilization Rates 26 CABG No 27 PTCA No 28 Hysterectomy 29 Laminectomy
Inpatient Quality Indicators (IQI) Software Instruction SAS
Inpatient Quality Indicators (IQI) 9 Version 43 (August 2011)
Note AAA = Abdominal Aortic Aneurysm CABG = Coronary Artery Bypass Graph PTCA = percutaneous transluminal coronary angioplasty AMI = Acute Myocardial Infarction CHF = Chronic Heart Failure GI = Gastrointestinal VBAC = Vaginal Birth After Cesarean a PTCA and carotid endarterectomy mortality are not recommended as stand-alone indicators but are suggested as companion measures to the corresponding volume measures Table 2 Prefixes for the inpatient quality indicator (IQI) variables
Prefix Contents
EXAMPLES Provider
indicator 8 Esophageal resection
Area-level indicator 26
CABG utilization T Inpatient numerator (top) TPIQ08 TAIQ26
P Population denominator (pop) PPIQ08 PAIQ26
Q POA flag QPIQ08 NA
O Observed rate (not applicable to IQI 1-7) OPIQ08 OAIQ26
E Expected rate EPIQ08 NA
R Risk-adjusted Rate (not applicable to IQI 1-7) RPIQ08 RAIQ26
L Lower limit of confidence interval of risk-adjusted rate LPIQ08 NA
U Upper limit of confidence interval of risk-adjusted rate UPIQ08 NA
S Smoothed rate SPIQ08 NA
X Standard error of smoothed rate XPIQ08 NA Table 3 Inpatient quality module contents
SAS programs ASCII text files CONTROL_IQISAS POP95T11TXT IQFMTSSAS COVIQA43TXT IQSAS1SAS MSXIQP43TXT IQSASP2SAS IQSASP3SAS MSXIQA43TXT IQSASA2SAS gee_piqxx_RegressionAnalysisGeecsv IQSASA3SAS
Prediction_PIQxxxml PRDIQP43TXT
contained in PSI_GEE_Inputzip
The ASCII text files are data files provided with the Inpatient Quality module and are necessary for the programs to run There is no need to convert these files to SAS format for use with the software Note that POP95T11TXT is available on the website as a separate download
Inpatient Quality Indicators (IQI) Software Instruction SAS
Inpatient Quality Indicators (IQI) 10 Version 43 (August 2011)
40 Background The Inpatient Quality Indicator module contains 32 indicators that reflect the quality of care
inside hospitals The six volume measures are intended to be paired with the corresponding mortality indicators These indicators serve to highlight potential quality concerns identify areas that need further study and investigation and track changes over time The indicators include three groups of measures based on hospital stays
1 There are six Volume indicators for inpatient procedures for which there is evidence that a higher volume of procedures is associated with lower mortality A nontrivial number of these procedures are performed by institutions that do not meet recommended volume thresholds The volume indicators are measured as counts of admissions in which particular procedures were performed
2 There are 15 Inpatient Mortality indicators for medical conditions and surgical
procedures that have been shown to have mortality rates that vary substantially across institutions and for which evidence suggests that high mortality may be associated with deficiencies in the quality of care These indicators are measured as rates the number of deaths divided by the number of admissions for the procedure or condition
Eight of these mortality indicators are for procedures six of which are also measured by a
volume indicator The other seven mortality indicators are associated with medical conditions 3 There are eleven Utilization indicators for procedures for which there are questions of
overuse underuse or misuse The procedures being examined are ones whose use varies significantly across hospitals and areas and for which high or low rates by itself does not represent poor quality of care rather the information is intended to inform consumers about local practice patterns
4 Seven of the utilization indicators are rates based on the hospitalized population Four
other utilization indicators are rates based on an arearsquos residential population Two of these area-level utilization indicators (IQI 26 CABG and IQI 2 PTCA) have counterparts in the set of volume indicators
For the four area-level utilization indicators geographic areas are defined at the users option in one of four ways
bull County level with US Census FIPS1 bull County level with modified FIPS bull Metro Area with OMB 1999 definition bull Metro Area with OMB 2003 definition
1 Federal Information Processing Standard as defined by the US Department of Commerce National Institute of Standards and Technology (formerly National Bureau of Standards)
Inpatient Quality Indicators (IQI) Software Instruction SAS
Inpatient Quality Indicators (IQI) 11 Version 43 (August 2011)
The MSALEVL parameter has been renamed to MALEVL to reflect the change in OMB definitions for areas Refer to page 14 for information on these area definitions and MALEVL parameter settings
The indicators in the IQI module are listed in Table 1 on page 8 See also the Inpatient
Quality Indicators Technical Specifications for the detailed definition of each indicator See Appendix A for links to these and other documents
The data required for measuring these indicators come from hospital discharge abstracts or billing claims (administrative data) which are readily available within hospitals or from many state data organizations The residential population data for the four area-level utilization indicators are from the US Census Bureau
The software generates observed expected risk-adjusted and smoothed rates for all indicators excluding IQI 21-25 IQI 33-34 Observed rates are the raw rates Risk-adjusted and expected rates are derived from applying the average case mix of a reference population file that reflects a large proportion of the US hospitalized or residential population When stratifications other than hospital or area are selected the RPIQxx variables and their confidence intervals are observedexpected ratios to avoid confounding with risk adjustment variables Smoothed rates are estimates with removal of fluctuations over time due to random variation
Inpatient Quality Indicators (IQI) Software Instruction SAS
Inpatient Quality Indicators (IQI) 12 Version 43 (August 2011)
50 Data Elements and Coding Conventions See Appendix C for a detailed description of the input data elements and coding conventions used by the SAS QI software
51 Input for the AHRQ Quality Indicators The IQI software was written to process data from discharge data abstracts that contain
information about hospital stays The IQI module was tested on data from the AHRQ Healthcare Cost and Utilization Project (HCUP) HCUP is an ongoing Federal-State-private collaboration to build uniform databases from administrative hospital-based data collected by State data organizations and hospital associations
The input data files for the Inpatient Quality Indicators software must be in SAS
It is strongly recommended that users recode data elements in their input files to be consistent with the coding expected by the software This step will minimize the number of internal changes that will be necessary in the IQI software For example recoding the SEX data element in the input file to be consistent with the coding described in Appendix C (ie 1 for male and 2 for female) is easier than modifying all uses of the Sex data element in the IQI programs
Not every value for every data element is referenced by the IQI software For example only two of the discharge disposition (DISP) data element values are used in the software (DISP value ldquo2rdquo for short-term hospital and value ldquo20rdquo for died in the hospital) However the complete set of standardized values is included based on HCUP specifications (see Appendix A) to assist users of the uniform HCUP data files
To minimize internal changes to the software all required elements should be present in the input data file If a required element is not available a dummy element should be provided Failure to provide a dummy element will result in errors during the execution of the IQI programs
The data elements listed in Appendix C are those required for the input files of all the SAS QI modules When a variable is not required for the program the notation ldquoNot used by the IQI programrdquo will be present in the Comments column Standardizing the variables and data values in the input data file will be helpful for users who have access to both statistical software packages as well as users working to standardize their input file specifications for use with any of the AHRQ QI software modules
Appendix C has been standardized to represent the input data file specifications required for use with any of the three QI modules (IQI PQI or PSI) If a specific variable is not used by the PQI program it is not necessary to create a dummy variable in the input data file For example the variable APR-DRG is used only by the IQI software so it is not necessary to have this data element in the input data file or create a dummy variable for the PQI software program to run correctly
Inpatient Quality Indicators (IQI) Software Instruction SAS
Inpatient Quality Indicators (IQI) 13 Version 43 (August 2011)
The data element HOSPSTCO has been renamed to PSTCO to emphasize the importance of
calculating the area-level IQI by the location of the patient residence If the user wants to calculate the area-level IQI based on the population of the Metro Area or county associated with the patient residence the values for this variable should be the FIPS statecounty code associated with each individual patientrsquos place of residence If the patient information is not available or the user wants to calculate the IQI using the population associated with the hospital location as the denominator the values for this variable should be the individual hospital FIPS statecounty codes
If the hospital FIPS code is used in PSTCO users should be aware that rates may be biased for hospitals which serve as regional referral centers These hospitals are likely to treat patients from outside the Metro Area county or even the state in which the facility is located
Users no longer have to use the Modified FIPS codes assignment for area denominators However that option is still available In the modified FIPS codes certain independent cities (Baltimore City Carson City and St Louis City) and areas within Hawaii and Virginia are assigned to different area groupings in the Modified FIPS categories
Using the patient FIPS statecounty code for analysis may more accurately reflect the true population at risk Using the hospital FIPS statecounty code for analysis should be done with caution and at larger levels of geographic area (ie Metropolitan Area) to minimize the bias with patients that come from a different county than the hospital location
It is possible that some records in the input data file may be missing the patient FIPS code Users should be aware that any records with missing values (in the PSTCO data field) are excluded from the calculations of observed risk-adjusted and smoothed IQI area-level rates They will be included in the output from the first program (IQSAS1SAS)
The software will generate area-level IQI rates for each county included in the PSTCO data field If using the hospital FIPS statecounty code for analysis users are encouraged to limit cases in their input file to those patients discharged from the geographic area of interest For example if you are using data from the state of Wisconsin and are interested in generating a rate for Wisconsin you should remove the cases where the patientrsquos county of residence (FIPS code) is from another state Otherwise the total or overall rate will include the population at risk from the counties outside Wisconsin
The software provides the user with the option of producing output by Metro Area or by
county When Metro Area is selected urban areas are always defined by Metro Areas When
Inpatient Quality Indicators (IQI) Software Instruction SAS
Inpatient Quality Indicators (IQI) 14 Version 43 (August 2011)
county is selected urban areas will be defined by county Rural areas are always defined by county
In the software programs the MALEVL parameter should be set as follows 0-County level with US Census FIPS 1-County level with modified FIPS 2-Metro Area with OMB 1999 definition 3-Metro Area with OMB 2003 definition
The metropolitan area definitions are from three different sources 1) The ldquomodified FIPSrdquo
definition is from the Area Resource File The mapping is from county to modified FIPS county (eg Baltimore city to Baltimore county) 2) The ldquo1999 OMBrdquo definition is from the federal Office of Management and Budget (OMB) circular 99-04 (Last Revised May 6 2002) The mapping is from county to Metropolitan Statistical Area (MSA) except in New England where counties are assigned to New England County Metropolitan Area (NECMAs) OMB defines NECMAs as a county-based alternative to the city- and town-based New England MSAs and Consolidated MSAs (CMSAs) For example Hampden and Hampshire counties in Western Massachusetts are assigned to the Springfield MA NECMA even though Holland town in Hampden County is part of the Boston MSA and 3) The ldquo2003 OMBrdquo definition is from the federal OMB circular 03-04 (Last Revised December 4 2005) The mapping is from county to either Metropolitan Statistical Area or Micropolitan Statistical Area
52 Coding of Diagnoses Procedures and DRGs Diagnoses and procedures must be coded using the International Classification of Diseases 9th Revision Clinical Modification (ICD-9-CM)
Significant modifications to ICD-9-CM codes occurred in the early 1990s IQI definitions only reflect codes valid on and after October 1 1994 so they may not accurately analyze data collected before October 1994
bull Diagnosis and procedure codes should be in character strings
bull Diagnosis and procedure codes should not contain any decimal points
bull Diagnosis and procedure codes should be left justified Diagnosis codes with fewer than five digits should be padded with spaces (not zeros) on the right Procedure codes with fewer than four digits should be padded with spaces (not zeros) on the right
The IQI programs assume accurate and specific coding of ICD codes If an ICD code is specified using 5 digits the software recognizes only 5-digit versions of that code and not versions truncated at 3 or 4 digits Similarly if an ICD code is specified using 4 digits the software recognizes only 4 digit versions of that code and not versions truncated at 3 digits For example 4281 is the ICD-9-CM diagnosis code for left heart failure If your data are coded less specifically (ie 428 is used to designate ldquoheart
Inpatient Quality Indicators (IQI) Software Instruction SAS
Inpatient Quality Indicators (IQI) 15 Version 43 (August 2011)
failurerdquo) these less specific codes are not recognized by the software and will result in undercounting cases
bull Diagnosis-related groups (DRGs) are those derived from the Centers for Medicare amp Medicaid Services (previously Health Care Financing Administration) Medicare grouper The software expects that you will be using the DRG effective on the discharge date The software now refers to data elements DRG and MDC Your data should be coded accordingly The software may be modified at the userrsquos option to use other types of DRGs However the impact of using other types of DRGs should be evaluated carefully before making such a change
Version 43 of the software accounts for ICD-9-CM and DRG coding effective through FY2011 (through September 30 2011)
53 APR-DRG Variables
It is recommended that users either use their own 3Mreg APRreg DRG Grouper software or download and run the 3Mreg APRreg DRG Limited License Grouper for SASreg software on their patient data before running the IQI SAS programs The Limited License Grouper software is available on the AHRQ Inpatient Quality Indicators download page (see Appendix A for link)
The Grouper software creates APR-DRG categories and associated risk of mortality data elements These APR-DRG variables are used to enhance the risk-adjustment of selected IQI provider indicators
APR-DRG software must be downloaded and run separately
Users who wish to use APR-DRG results to risk-adjust the provider IQI rates should run the APR-DRG software on their patient data before running the IQI programs
The data elements in the AHRQ QI are based on the coding specifications used in the State
Inpatient Databases (SID) in the Healthcare Cost and Utilization Project (HCUP) The SID coding specifications are similar to the Uniform Bill (UB-04) but not identical For data elements used in the AHRQ QI crosswalks between the SID and UB-04 coding specifications are included in the SID documentation available at httphcup-usahrqgovdbstatesiddbdocumentationjsp
54 Missing Values
The IQI programs do not distinguish among different types of missing values
Cases that are missing data in fields used for indicator definitions or for risk adjustment (such as age and sex) will be excluded from analysis
Data files of hospital discharge abstract data may have numeric data elements coded using
special SAS missing ldquodotrdquo values For example besides the standard SAS value of ldquordquo For missing data there might also be present values of ldquoArdquo for invalid data ldquoBrdquo for data
Inpatient Quality Indicators (IQI) Software Instruction SAS
Inpatient Quality Indicators (IQI) 16 Version 43 (August 2011)
unavailable from a particular source ldquoCrdquo for inconsistent data However the IQI programs do not distinguish among the different types of missing codes Therefore all types of missing values in the input data to the IQI module must be represented by a single value ndash missing data () for numeric variables and blank (lsquo lsquo) for alphanumeric (or character) variables
55 Treatment of Missing Data The software is designed to handle missing data in a particular manner specifically the
software requires confirmation for the assignment of a poor outcome or negative event For instance in order to be assigned as a death each case must actually be coded as a death Missing data are considered neutral Missing data for some elements results in the exclusion of that case from the denominator For a few other elements the case is retained
Inpatient Quality Indicators (IQI) Software Instruction SAS
Inpatient Quality Indicators (IQI) 17 Version 43 (August 2011)
Table 4 lists the impact of missing data for each data element Table 4 Treatment of missing data elements
Variable Label D N E S Treatment of Missing Data
AGE Age In Years At Admission
X X X Case excluded from all analysis (eg dropped from the denominator of the discharge based indicators and from numerator of all population based measures)
ASOURCE Admission Source X Case excluded from denominator where used in specification (eg IQI- 32)
DISP Disposition Status X X Case excluded from denominator where used in specification (eg IQI-15)
DQTR Discharge Quarter X X X X Case excluded from all analysis (eg dropped from the denominator of the discharge based indicators and from numerator of all population based measures)
DX1 Principal Diagnosis Code
x x x x Record excluded from analysis
Sex Patient Gender X X X Case excluded from all analysis (eg dropped from the denominator of the discharge based indicators and from numerator of all population based measures)
PAY 1 Payer x Classified As ldquoOtherrdquo POINTOFORIGINUB04 Point of Origin x x Missing values of
POINTOFORIGINUB04 result in a case being excluded from the denominator for IQI 32 (along with ASOURCE)
PSTCO Location of Patient Residence or Hospital Location Modified FIPS StateCounty Code
X Dropped from denominator in rate calculations (stratified by county or Metro Area) case will appear in calculation of the overall rate
RACE Race X Classified As ldquoOtherrdquo YEAR Discharge Year X X X X Case excluded from all analysis (eg
dropped from the denominator of the discharge based indicators and from numerator of all population based measures)
Note D = Denominator N = Numerator E = Exclusion S = Stratification
Inpatient Quality Indicators (IQI) Software Instruction SAS
Inpatient Quality Indicators (IQI) 18 Version 43 (August 2011)
60 User Options The IQI software reflects the development and implementation of the software with
discharge data available to AHRQ through the HCUP program The goal was to develop the tools illustrate their use and then encourage others to adopt and use the tools for their own applications As a result users are encouraged to consider how AHRQ may modify or enhance the IQI software to better serve their measurement needs and interests
Modifications to the definitions of outcomes of interest (numerators) or populations at risk (denominators) are possible but not desirable Maintaining consistent definitions is important Once definitions are altered the ability to make comparisons of IQI based on original definitions is lost Users are encouraged to identify ways to improve the IQI methodology and to share their suggestions with AHRQ for future updates
AHRQ provides public access to HCUPnet (httphcupnetahrqgov)- an interactive tool for
identifying tracking analyzing and comparing statistics on hospital care HCUPnet queries generate statistics in a table format using data from the Nationwide Inpatient Sample (NIS) and State Inpatient Databases (SID) for those States that have agreed to participate HCUPnet includes statistics based on the AHRQ Quality Indicators (QIs) which have been applied to the HCUP NIS If users change definitions of the IQI it will not be possible to compare usersrsquo results to the national estimates in HCUPnet
Inpatient Quality Indicators (IQI) Software Instruction SAS
Inpatient Quality Indicators (IQI) 19 Version 43 (August 2011)
70 Producing Inpatient Quality Indicator Rates Processing Steps
Each Inpatient Quality Indicator (IQI) expressed as a rate is simply defined as
Outcome of interest Population at risk
[or]
Numerator Denominator
Conceptually five steps are necessary to produce the IQI rates The following describes the steps and how the software performs them
71 Step 1 Identify Outcomes in Inpatient Records Inpatient records are marked to indicate whether they contain the outcome of interest
(numerator or ldquoTrdquo for ldquotoprdquo) for each of the AHRQ IQI measures Records are marked by setting a series of flag variables each of which corresponds to the
numerator for a particular IQI For example if the inpatient record meets the conditions for inclusion in the outcome for IQI- 01 then the outcome indicator for IQI- 01 is set to one
This step requires one pass through the discharge-level data and outputs a discharge-level data file containing the flag indicator variables for the outcomes for each IQI This output file also contains the original input variables with the exception of the diagnosis and procedure variables which have been removed to reduce the size of the output file
The first six Inpatient Quality Indicators are volume measures and for these QIs this first step is all that is necessary The remaining steps two though five are relevant for the remaining indicators which are rates as opposed to total volume measures
72 Step 2 Identify Populations at Risk
For the Provider IQI the populations at risk (the denominators for calculating the IQI rates or ldquopoprdquo) are derived from the hospital discharge records
For the four Area-level IQI the populations at risk (the denominators for calculating the IQI rates) are derived from US Census population figures
73 Step 3 Calculate Observed (raw) Inpatient Quality Indicator rates
Using the output data from step 1 and either hospital discharge or US Census population
data from step 2 the IQI rates are calculated for user-specified combinations of stratifiers These stratifiers include hospitals age groups raceethnicity categories sex and payer categories for the Provider IQI and areas (Metro Areascounties) age groups raceethnicity categories and sex for the Area-level IQI
Inpatient Quality Indicators (IQI) Software Instruction SAS
Inpatient Quality Indicators (IQI) 20 Version 43 (August 2011)
The programs calculate observed IQI rates regardless of the number of cases available However IQI rates based on only a few cases should be interpreted with caution
In some performance measurement work it is often recommended that rates be suppressed
when there are fewer than 30 cases in the denominator This exclusion rule serves two purposes
bull It eliminates unstable estimates based on too few cases
bull It helps protect the identities of hospitals and patients
This step outputs the observed rates for user-specified categories alone or in combination For example Provider IQI observed rates could be output at the hospital level at the payer level or at the hospital level by payer
74 Step 4 Risk-adjust the Inpatient Quality Indicator Rates
Regression coefficients from a reference population database (reflecting a large proportion of the US population) are applied to the observed rates in the risk-adjustment process These reference population file regression coefficients are provided as part of the Generalized Estimating Equation GEE routines included with IQI module The risk-adjusted rates will then reflect the age and sex distribution (and the APR-DRG distribution for the provider indicators) of data in the reference population file rather than the distribution for the hospitals or areas present in the usersrsquo data This approach will allow risk-adjusted rates produced by various users to be compared directly to one another
The programs calculate risk-adjusted IQI rates regardless of the number of cases available (however a minimum of 3) However IQI rates based on only a few cases should be interpreted with caution
75 Step 5 Create MSX Smoothed Rates
Shrinkage factors are applied to the risk-adjusted rates for each IQI in a process called multivariate signal extraction (MSX) For each IQI the shrinkage estimate reflects a lsquoreliability adjustmentrsquo unique to each indicator The less reliable the IQI is over time and across hospitals or areas the more the estimate lsquoshrinksrsquo the IQI toward the overall area mean The resulting rate will appear ldquosmootherrdquo than the raw rate meaning the year-to-year fluctuations in performance are likely to be reduced The shrinkage factors are provided as part of the IQI software and do not need to be calculated by users
These five steps reflect the IQI module production in a nutshell The next section of this document describes the specifics of each software component of the IQI module software
Inpatient Quality Indicators (IQI) Software Instruction SAS
Inpatient Quality Indicators (IQI) 21 Version 43 (August 2011)
80 Program Descriptions This section describes the seven SAS programs that assign calculate and print the Inpatient
Quality Indicators For each program there is a description a list of input and output files and an explanation of
changes to the program that may be required The flow of data through the IQI module programs is shown in the flowcharts in Figure 1 and Figure 2 that begin on page 6
If you desire to create and examine observed IQI rates then the CONTROL_IQI IQFMTS and the IQSAS1 programs will need to be used followed by IQSASP2 (for Provider observed rates and volume indicators) andor IQSASA2 (for Area observed rates) If you also wish to create risk-adjusted and smoothed IQI rates then you will also need to run the IQSASP3 andor the IQSASA3 program
81 Program 1 Modify Statements in the CONTROL_IQISAS Code
The CONTROL_IQISAS code contains all of the SAS statements that you need to modify in order to run the remaining IQI module programs (with one exception noted below) This location is where you specify for example the path names or locations of all your input and output data sets There is also a TITLE line that the user can fill in The items that need to be changed in order to run the IQSAS1 IQSASP2 IQSASP3 IQSASA2 and IQSASA3 programs are described below each program
The CONTROL_IQISAS code is automatically inserted into the remaining programs when they are executed You do not need to run CONTROL_IQISAS as a separate program
All of the changes needed for the CONTROL_IQISAS code are listed in the following descriptions for programs 2 ndash 7 Each program description contains a section labeled ldquoChangesrdquo that enumerates the modifications for CONTROL_IQISAS that are associated with that particular program
Lines of code to be modified are identified by the phrase ldquolt===USER MUST modifyrdquo which means the user must make the change or by ldquolt===USER MAY modifyrdquo which means the modification is optional
In all of the remaining programs included with the IQI module there is one line of code near
the beginning of each program that needs to be modified This line of code starts with the phrase ldquoFILENAME CONTROLrdquo You must modify this line to point to the path name where you stored your modified copy of the CONTROL_IQISAS file Pathnames should not exceed 255 characters in length
CONTROL_IQISAS has a collection of parameters that allow you to read in data from different locations or pathnames and write out data to different locations or pathnames For example ldquoLIBNAME IN0rdquo points to the location of your input data set for program IQSAS1 and ldquoLIBNAME OUT1rdquo points to the location of the output data set created by the IQSAS1 program
Inpatient Quality Indicators (IQI) Software Instruction SAS
Inpatient Quality Indicators (IQI) 22 Version 43 (August 2011)
The parameters allow these locations to be different from one another However if you wish to read in and write out all of the data to the same location it is easiest to just make a global change in CONTROL_IQISAS changing ldquoCpathnamerdquo to the single directory location that you wish to use
There is a global PRINT parameter in CONTROL_IQISAS that as a default prints all of the output summary records at the end of the IQSASP2 IQSASP3 IQSASA2 and IQSASA3 programs These printouts may be quite large if you have a large database with a large number of hospitals and if you choose the results to be finely stratified If you wish to turn this feature off set PRINT to have a value of zero in CONTROL_IQISAS to turn this feature on set PRINT to have a value of 1
The global MALEVL parameter in CONTROL_IQISAS by default instructs all programs to define geographic areas by county for all areas in the input datasets Refer to Page 14 for a list of values for the MALEVL parameter
82 Program 2 Run IQFMTS
The IQFMTS program defines a format library which contains the diagnosis and procedure screens necessary for assigning the outcomes of interest This format library is used by most of the succeeding programs
The first few formats in this program are for the stratifiers (ie age sex raceethnicity and payer) These are followed by formats that are used for the identification of outcomes of interest in the IQSAS1 program and by formats that map FIPS county codes to Metro Areas in the IQSAS1 IQSASA2 and IQSASA3 programs At the end of the program are formats used to assign age categories for the risk adjustment process implemented in IQSASP3 and IQSASA3 and formats used with APR-DRG categories in IQSASP3 Input None Output Permanent SAS format library (FMTLIB) Changes
1 You must modify the ldquoFILENAME CONTROLrdquo statement at the beginning of the program to change the path so it points to your location of the CONTROL_IQISAS code
2 In CONTROL_IQISAS specify the location (path) of the format library in the
ldquoLIBNAME LIBRARYrdquo statement
83 Program 3 Run IQSAS1 The IQSAS1 program processes hospital discharge abstract data and flags inpatient records if
they contain outcomes of interest Outcome indicator names or numerators have prefix of ldquoTrdquo (Top) Stratifier variables are constructed at the beginning of the program
Inpatient Quality Indicators (IQI) Software Instruction SAS
Inpatient Quality Indicators (IQI) 23 Version 43 (August 2011)
This program assumes that the input data file (consisting of inpatient discharge abstract data) conforms to specific variable names attributes and coding conventions See Table 2 on page 9 for variable names and attributes for the input data file
Partial definitions of the Inpatient Quality Indicators are given in Table 1 on page 8 This table is presented to assist those individuals who desire to examine the software source code statements Complete definitions of the indicators are given in the document Inpatient Quality Indicators Technical Specifications (httpwwwqualityindicatorsahrqgovModulesiqi_overviewaspx) Input
1 User supplied SAS inpatient data set consisting of administrative hospital discharge abstract data This data set is a discharge level file with an array of diagnosis and procedure codes among other data elements
2 SAS format library (FMTLIB) created from the IQFMT program
Output
1 SAS dataset containing inpatient records with input variables stratifiers and flag indicators (TPIQxx and TAIQxx) for the outcomes of interest that will later form the numerators for the IQI rates
2 PROC MEANS (with N NMISS MIN MAX MEAN and SUM) of all of the
numeric variables in the output data file and a PROC CONTENTS of the output data file are output to hardcopy
3 A PROC PRINT of the first 24 observations in the output data file is output to
hardcopy Changes
1 The ldquoFILENAME CONTROLrdquo statement at the beginning of the program must be changed to reflect the location of the CONTROL_IQISAS code
2 In CONTROL_IQISAS specify the locations (paths) of the input and output files in
the ldquoLIBNAME IN0rdquo and ldquoLIBNAME OUT1rdquo statements
3 In CONTROL_IQISAS specify the names of the input and output files in the ldquoINFILE0rdquo and ldquoOUTFILE1rdquo statements
4 To define urban areas by Metro Area rather than by county change the MALEVL
parameter in CONTROL_IQISAS from 0 to 1 2 or 3 Rural areas will be defined by county no matter how MALEVL is specified Refer to page 14 for a list of values for the MALEVL parameter
5 The IQI module assumes that your starting SAS data set contains 30 diagnoses
and 30 procedures If these numbers are different in your input inpatient data then modify the NDX and NPR parameters in CONTROL_IQISAS
Inpatient Quality Indicators (IQI) Software Instruction SAS
Inpatient Quality Indicators (IQI) 24 Version 43 (August 2011)
If your variables are named differently from those used in the IQI software (see Table 1 on page 8) you MUST either rename those variables prior to running this program or modify IQSAS1 to include the renaming of your variables to match those expected by the software Similarly if your variables are not the same type ie character or numeric as those expected by the software (see Table 1) you MUST modify your variables prior to running this program
6 If you wish to use APR-DRG variables in the later IQSASP3 program to risk-adjust
the provider indicators then in CONTROL_IQISAS set the APRDRGFG flag parameter to one If you do not intend to run IQSASP3 to risk-adjust the provider indicators or if you do not have the APR-DRG variables available to you then set APRDRGFG to zero See Table 5 below
7 If you wish to risk-adjust the provider indicators by later running the IQSASP3
program then in CONTROL_IQISAS set the three APRDRG APRDRG_RISK_MORTALITY and XPRDRG_RISK_MORTALITY parameters to be the names of the DRG category variable and the mortality indicators created by APR-DRG software If you do not intend to use APR-DRG software then set the three APRDRG APRDRG_RISK_MORTALITY and XPRDRG_RISK_MORTALITY parameters to equal zero See Table 5 below
Table 5 How to set up IQI parameters and your data for using APR-DRG variables
If you do not intend to risk-
adjust the provider
indicators
If you are going to run IQSASP3 to risk adjust the provider indicators
If you have APR-DRG software available
If you do not have APR-DRG software
available
Preliminary data processing None
Run APR-DRG software to create APR-DRGs
and mortality indicators None
Setting the APRDRGFG parameter in
CONTROL_IQISAS Set to equal zero Set to equal one Set to equal zero
Setting the APR_DRG APRDRG_RISK_MORTAL
ITY and XPRDRG_RISK_MORTAL
ITY parameters in CONTROL_IQISAS
No action required
Set to equal the names of the variables output
from the APR-DRG software
Set to equal zero
84 Program 4 Run IQSASP2
For all but the volume indicators (IQI 01-07) the IQSASP2 program calculates the observed or raw rates for the provider-level Inpatient Quality Indicators using the data derived in a previous step (IQSAS1) These observed rates are stratified by combinations of providers sex age race and payer categories The program first totals the indicator flags created by the
Inpatient Quality Indicators (IQI) Software Instruction SAS
Inpatient Quality Indicators (IQI) 25 Version 43 (August 2011)
IQSAS1 program and then for each of the desired stratifiers divides these totals by the hospital discharges in the universe for the indicator The population denominators are stored in variables with names that have a prefix of ldquoPrdquo (Pop) The Observed rates are stored in variables that have a prefix of ldquoOrdquo Input
1 The SAS dataset that was created in the IQSAS1 This dataset is a discharge-level file that contains inpatient records with input variables stratifiers and the 30 flag indicators for the IQI Provider outcomes of interest
2 SAS format library (FMTLIB) created from the IQFMT program
Output
1 SAS dataset with summary records that contain observed rates (OPIQxx variables where lsquoxxrsquo refers to the indicator number) the counts of outcomes that formed the numerators of the rates (TPIQxx variables) and the hospital discharge totals that formed the denominators of the observed rates (PPIQxx variables) It also includes variables indentifying present on admission (POA) and conditions for provider based outcomes of interest (QPQIxx) The output file has records summarized to the various combinations of stratifiers specified in the TYPELVLP parameter that is described in item number 4 in the ldquoChangesrdquo section below Note that the observed rates and the denominator totals are not generated for the Provider volume indicators (IQI 01-07)
2 An optional ASCII (comma delimited) text file that the user can then import into a
spreadsheet This text file contains the same information as the SAS output dataset The text file will contain the OPIQxx observed rates the TPIQxx counts of outcomes that formed the numerators of the rates and the PPIQxx counts of outcomes that formed the denominators of the rates The different recordsrows in the text file will correspond to the different TYPELVLP stratification combinations
3 A PROC MEANS (with N NMISS MIN MAX MEAN and SUM) of the provider-
level summary records that shows statistics for the OPIQxx observed rates the TPIQxx counts of outcomes that formed the numerators of the rates and the PPIQxx counts of outcomes that formed the denominators of the rates These means will only be generated if the user included a value of 16 for the TYPELVLP parameter discussed in item 4 in the ldquoChangesrdquo section below
4 A PROC CONTENTS of the output SAS summary dataset is output to hardcopy
5 A PROC PRINT of the output summary dataset is provided at the end of the hardcopy
printout This printout may be quite large depending on the number and the types of stratifications that the user requests with the TYPELVLP parameter discussed in item number 4 in the ldquoChangesrdquo section below If the user does not wish to generate this printout then the global ldquoPRINTrdquo parameter in CONTROL_IQISAS code should be set to zero
Inpatient Quality Indicators (IQI) Software Instruction SAS
Inpatient Quality Indicators (IQI) 26 Version 43 (August 2011)
Changes 1 The ldquoFILENAME CONTROLrdquo statement at the beginning of the program must be
changed to reflect the location of the CONTROL_IQISAS code 2 In CONTROL_IQISAS specify the locations (paths) of the input and output SAS
files in the ldquoLIBNAME INP2rdquo and ldquoLIBNAME OUTP2rdquo statements
3 In CONTROL_IQISAS specify the names of the input and output files in the ldquoINFILE1rdquo and ldquoOUTFILP2rdquo statements The name that you specify with INFILE1 should be for the file that you created using the IQSAS1 program
4 In CONTROL_IQISAS specify the levels of aggregation for the observed rates This
step is done by specifying numbers between 0 and 31 in the ldquoLET TYPELVLP =rdquo statement Each number from 0 to 31 corresponds to a different level or combination of levels as shown in Table 6 The default values of 0 16 will provide an overall total and provider-level totals
If TYPELVLP includes the value 0 then the first observation in the output summary data file will contain the overall totals and observed rates for the entire database created with the IQSAS1 program
5 In CONTROL_IQISAS if you wish to create an ASCII (comma delimited) text file that you can import into a spreadsheet then set the TEXTP2 parameter to 1 Otherwise the default value of zero for TEXTP2 will skip around the code that would generate this file
6 In CONTROL_IQISAS if you wish to create an ASCII (comma delimited) text file
that you can import into a spreadsheet then specify the path (including the file name) for this ASCII text file in the FILENAME IQTEXTP2rdquo statement
Inpatient Quality Indicators (IQI) Software Instruction SAS
Inpatient Quality Indicators (IQI) 27 Version 43 (August 2011)
Table 6 IQSASP2 Aggregation Possibilities
TYPELVLP Stratification 0 Overall 1 Race 2 Payer 3 Payer Race 4 Sex 5 Sex Race 6 Sex Payer 7 Sex Payer Race 8 Age 9 Age Race 10 Age Payer 11 Age Payer Race 12 Age Sex 13 Age Sex Race 14 Age Sex Payer 15 Age Sex Payer Race 16 Provider 17 Provider Race 18 Provider Payer 19 Provider Payer Race 20 Provider Sex 21 Provider Sex Race 22 Provider Sex Payer 23 Provider Sex Payer Race 24 Provider Age 25 Provider Age Race 26 Provider Age Payer 27 Provider Age Payer Race 28 Provider Age Sex 29 Provider Age Sex Race 30 Provider Age Sex Payer 31 Provider Age Sex Payer Race
0 and 16 TYPELVLP (overall and provider) are default values for the level of computation in the software
For example if you are using a state inpatient hospital database you might specify the following TYPELVLP values
0 ndash provides overall rates for your entire state 8 ndash provides overall rates for your state broken down by age groups 16 ndash provides rates for providers within your state 24 ndash provides rates for age groups within these providers
85 Program 5 Run IQSASP3
The IQSASP3 program calculates risk-adjusted rates by patient age sex and APR-DRG if available for each IQI and then calculates smoothed rates The risk-adjusted and smoothed rates are not calculated for the Provider volume indicators IQI 01-07 just as observed rates were not calculated for these indicators
Inpatient Quality Indicators (IQI) Software Instruction SAS
Inpatient Quality Indicators (IQI) 28 Version 43 (August 2011)
The programs calculate risk-adjusted IQI rates regardless of the number of cases available However IQI rates based on only a few cases should be interpreted with caution
The output file has records summarized to the various combinations of stratifiers that were specified in the TYPELVLP parameter of the preceding IQSASP2 program See Table 6 on page 27 Input
1 SAS format library (FMTLIB) created from the IQFMT program 2 The discharge-level file that was created with the IQSAS1 program
3 The SAS dataset with summary records that was created with the IQSASP2 program 4 A text file containing regression coefficients from a regression that was run on a
reference SID dataset These coefficients will be used in the risk-adjustment process Two files are provided as part of the IQI module Gee_piqxx_RegressionAnalysisGeecsv contains the regression coefficients Prediction_PIQxxxml contains the input parameters for the executable AHRQexe
Users must create a directory ldquoCAHRQQI AHRQPredictionrdquo and copy the
executable AHRQexe to that directory (along with 5 other files) Users must also create a directory ldquoCAHRQQIIQIrdquo and copy the zip file IQI_GEE_Input_Fileszip to that directory Extract all of the files from IQI_GEE_Input_Fileszip into the directory ldquoCAHRQQIIQIrdquo (See version 43 introduction on page 1)
5 A text file containing three arrays for use in the smoothing process The arrays
contain noise estimates signal estimates and mean area rates for each IQI Specify file MSXIQP42TXT The text file does not need to be converted to a SAS file for use with the software
Output
1 A SAS dataset with an overall summary record and with provider-level summary records that contain the three types of indicator rates along with the components of the initial raw rates Specifically the file contains the observed rates (OPIQxx variables) the risk-adjusted rates (RPIQxx variables) the smoothed rates (SPIQxx variables) the expected rates (EPIQxx variables) the counts of outcomes that formed the numerators of the observed rates (TPIQxx variables) and the hospital discharge totals that formed the denominators of the observed rates (PPIQxx variables) When stratifications other than hospital are selected the RPIQxx variables and their confidence intervals are observedexpected ratios to avoid confounding with risk-adjustment variables
2 An optional ASCII (comma delimited) text file that the user can then import into a
spreadsheet This text file contains the same information as the SAS output dataset
Inpatient Quality Indicators (IQI) Software Instruction SAS
Inpatient Quality Indicators (IQI) 29 Version 43 (August 2011)
The text file will contain the OPIQxx observed rates and their TPIQxx and PPIQxx numerator and denominator components the RPIQxx risk-adjusted rates the SPIQxx smoothed rates and the EPIQxx expected rates Each record or row in the text file will correspond to a specification group
3 A PROC MEANS (with N NMISS MIN MAX MEAN and SUM) of the provider-
level summary records that shows statistics for the observed risk-adjusted and smoothed rates and statistics for the counts of outcomes that formed the numerators and denominators of the observed rates These means will only be generated if the user included a value of 16 for the TYPELVLP parameter of the preceding IQSASP2 program (see Table 6 on page 27)
4 A PROC CONTENTS of the output SAS summary dataset is output to hardcopy
5 A PROC PRINT of the output summary dataset is provided at the end of the hardcopy
printout This printout may be quite large depending on the number and the types of stratifications that the user requested with the TYPELVLP parameter of the preceding IQSASP2 program (see Table 6 on page 27) If the user does not wish to generate this printout then the global ldquoPRINTrdquo parameter in CONTROL_IQISAS code should be set to zero
Changes
1 The ldquoFILENAME CONTROLrdquo statement at the beginning of the program must be changed to reflect the location of the CONTROL_IQISAS code
2 In CONTROL_IQISAS specify the locations (paths) of the input and output SAS
files in the ldquoLIBNAME INP3rdquo and ldquoLIBNAME OUTP3rdquo statements
3 In CONTROL_IQISAS specify in the ldquoINFILE1rdquo statement the name of the discharge-level file that you created with the IQSAS1 program
4 In CONTROL_IQISAS specify in the ldquoFILENAME MSXPrdquo statement the path
(including the file name) for the ASCII text file that contains the estimates to smooth the indicator rates Specify file MSXIQP42TXT
5 In CONTROL_IQISAS specify in the ldquoINFILEP2rdquo statement the name of the
summary file that you created with the IQSASA2 program
6 In CONTROL_IQISAS specify in the ldquoOUTFILP3rdquo statement the name that you wish the output file to have
7 In CONTROL_IQISAS if you wish to create an ASCII (comma delimited) text file
that you can import into a spreadsheet then set the TEXTP3 parameter to 1 Otherwise the default value of zero for TEXTA3 will skip the code that would generate this file
Inpatient Quality Indicators (IQI) Software Instruction SAS
Inpatient Quality Indicators (IQI) 30 Version 43 (August 2011)
8 In CONTROL_IQISAS if you wish to create an ASCII (comma delimited) text file that you can import into a spreadsheet then specify the path (including the file name) for this ASCII text file in the ldquoFILENAME IQTEXTP3rdquo statement
86 Program 6 Run IQSASA2
The IQSASA2 program calculates the observed or raw rates for the area-level Inpatient Quality Indicators using the data derived in a previous step (IQSAS1) These observed rates can be stratified by combinations of area sex age and race categories The program first totals the four area indicator flags created by the IQSAS1 program and then for each of the desired stratifiers divides these totals by the pertinent residential population The population denominators are stored in variables with names that have a prefix of ldquoPrdquo (Pop) The Observed rates are stored in variables that have a prefix of ldquoOrdquo Input
1 The SAS dataset that was created in the IQSAS1 This dataset is a discharge-level file that contains inpatient records with input variables stratifiers and the four new flag indicators for the IQI Area-level outcomes of interest
2 A text file with Census area residential populations stratified by area age sex and
ethnicity categories The file POP95T11TXT is currently provided on the website as a separate download The user should set POPYEAR to the year that best matches the userrsquos discharge data file
Users do not need to convert the ASCII text file to a SAS dataset for use with the software
3 SAS format library (FMTLIB) created from the IQFMT program
Output
1 SAS dataset with summary records that contain observed rates (OAIQxx variables where xx refers to the indicator number) the counts of outcomes that formed the numerators of the rates (TAIQxx variables) and the residential population totals that formed the denominators of the observed rates (PAIQxx variables) The output file has records summarized to the various combinations of stratifiers specified in the TYPELVLA parameter that is described in item number 5 in the ldquoChangesrdquo section below
2 An optional ASCII (comma delimited) text file that the user can then import into a
spreadsheet This text file contains the same information as the SAS output dataset The text file will contain the OAIQxx observed rates the TAIQxx counts of outcomes that formed the numerators of the rates and the PAIQxx residential population totals The different recordsrows in the text file will correspond to the different TYPELVLA stratification combinations
Inpatient Quality Indicators (IQI) Software Instruction SAS
Inpatient Quality Indicators (IQI) 31 Version 43 (August 2011)
3 A PROC MEANS (with N NMISS MIN MAX MEAN and SUM) of the area-level summary records that shows statistics for the OAIQxx observed rates the TAIQxx counts of outcomes that formed the numerators of the rates and the PAIQxx residential populations totals These means will only be generated if the user included a value of 8 for the TYPELVLA parameter discussed in item number 5 in the ldquoChangesrdquo section below
4 A PROC CONTENTS of the output SAS summary dataset is output to hardcopy
5 A PROC PRINT of the output summary dataset is provided at the end of the hardcopy
printout This printout may be quite large depending on the number and the types of stratifications that the user requests with the TYPELVLA parameter discussed in item number 5 in the ldquoChangesrdquo section below If the user does not wish to generate this printout then the global ldquoPRINTrdquo parameter in CONTROL_IQISAS code should be set to zero
Changes
1 The ldquoFILENAME CONTROLrdquo statement at the beginning of the program must be changed to reflect the location of the CONTROL_IQISAS code
2 In CONTROL_IQISAS specify the locations (paths) of the input and output SAS
files in the ldquoLIBNAME INA2rdquo and ldquoLIBNAME OUTA2rdquo statements
3 In CONTROL_IQISAS specify the names of the input and output files in the ldquoINFILE1rdquo and ldquoOUTFILA2rdquo statements The name that you specify with INFILE1 should be for the file that you created using the IQSAS1 program
4 In CONTROL_IQISAS specify the path (including the file name) for the ASCII
population text file in the ldquoFILENAME POPFILE statement The file name will be POP95T11TXT The user should set POPYEAR to the year that best matches the userrsquos discharge data file
5 In CONTROL_IQISAS specify the levels of aggregation for the observed rates This
change is done by specifying numbers between 0 and 15 in the ldquoLET TYPELVLA =rdquo statement Each number from 0 to 15 corresponds to a different level or combination of levels as shown in
Inpatient Quality Indicators (IQI) Software Instruction SAS
Inpatient Quality Indicators (IQI) 32 Version 43 (August 2011)
6 Table 7 The default values of 0 (overall) and 8 (area) will provide an overall total and area-level totals
WARNING TYPELVLA must include the values 0 (overall) and 8 (area) if you wish to subsequently run program IQSASA3 for risk-adjusted and smoothed rates
If TYPELVLA includes the value 0 (overall) then the first observation in the output summary data file will contain the overall totals and observed rates for the entire database created with the IQSAS1 program
Table 7 IQSASA2 aggregation possibilities
TYPELVLA Stratification 0 Overall 1 Race 2 Sex 3 Sex Race 4 Age 5 Age Race 6 Age Sex 7 Age Sex Race 8 Area 9 Area Race 10 Area Sex 11 Area Sex Race 12 Area Age 13 Area Age Race 14 Area Age Sex 15 Area Age Sex Race
0 (overall) and 8 (are) TYPELVLA are default values for the level of computation in the software
For example if you are using a state inpatient hospital database you might specify the following TYPELVLA values
0 ndash provides overall rates for your entire state 4 ndash provides overall rates for your state broken down by age groups 8 ndash provides rates for areas within your state 12 ndash provides rates for age groups within these areas
7 In CONTROL_IQISAS if you wish to create an ASCII (comma delimited) text file
that you can import into a spreadsheet then set the TEXTA2 parameter to 1 Otherwise the default value of zero for TEXTA2 will skip the code that would generate this file
8 In CONTROL_IQISAS if you wish to create an ASCII (comma delimited) text file
that you can import into a spreadsheet then specify the path (including the file name) for this ASCII text file in the ldquoFILENAME IQTEXTA2rdquo statement
Inpatient Quality Indicators (IQI) Software Instruction SAS
Inpatient Quality Indicators (IQI) 33 Version 43 (August 2011)
87 Program 7 Run IQSASA3 The IQSASA3 program calculates age and sex risk-adjusted rates for each area-level IQI
(overall rates and rates by area) and then calculates smoothed rates Input
1 SAS format library (FMTLIB) created from the IQFMT program 2 The discharge-level file that was created with the IQSAS1 program
3 The SAS dataset with summary records that was created with the IQSASA2 program
4 A text file with Census area residential populations (stratified by area sex and
discrete age categories) One file is currently provided along with the IQI module software The file is POP95T11TXT The user should set POPYEAR to the year that best matches the userrsquos discharge data file The text file does not need to be converted to a SAS file for use with the software
5 A text file (COVIQA42TXT) containing regression coefficients from a regression
that was run on the reference SID dataset These coefficients will be used in the risk adjustment process This file is provided to you as part of the IQI module The text file does not need to be converted to a SAS file for use with the software
6 A text file (MSXIQA42TXT) containing two arrays for use in the smoothing process
The arrays contain noise estimates signal estimates and mean area rates for each IQI This file is provided to you as part of the IQI module The text file does not need to be converted to a SAS file for use with the software
Output
1 A SAS dataset with an overall summary record and with area-level summary records that contain the three types of indicator rates along with the components of the initial raw rates Specifically the file contains the observed rates (OAIQxx variables) the risk-adjusted rates (RAIQxx variables) the smoothed rates (SAIQxx variables) the counts of outcomes that formed the numerators of the observed rates (TAIQxx variables) and the residential population totals that formed the denominators of the observed rates (PAIQxx variables) When stratifications other than area are selected the RAIQxx variables and their confidence intervals are observedexpected ratios to avoid confounding with risk-adjustment variables
2 An optional ASCII (comma delimited) text file that the user can then import into a
spreadsheet This text file contains the same information as the SAS output dataset The text file will contain the OAIQxx observed rates and their TAIQxx and PAIQxx components the RAIQxx risk-adjusted rates and the SAIQxx smoothed rates Each record or row in the text file will correspond to a different area
Inpatient Quality Indicators (IQI) Software Instruction SAS
Inpatient Quality Indicators (IQI) 34 Version 43 (August 2011)
3 Outputs to hardcopy are PROC MEANS (with N NMISS MIN MAX MEAN and SUM) of risk-adjusted and smoothed rates in two intermediate work files and of all of the numeric variables in the final output data file The printout also contains a PROC CONTENTS of the output SAS dataset A PROC PRINT of the output dataset is provided only if the ldquoPRINTrdquo parameter in CONTROL_IQISAS code is set to one
6 A PROC MEANS (with N NMISS MIN MAX MEAN and SUM) of the area-level
summary records that shows statistics for the OAIQxx observed rates and their TAIQxx and PAIQxx components the RAIQxx risk-adjusted rates and the SAIQxx smoothed rates
7 A PROC CONTENTS of the output SAS summary dataset is output to hardcopy
8 A PROC PRINT of the output summary dataset is provided at the end of the hardcopy
printout If the user does not wish to generate this printout then the global ldquoPRINTrdquo parameter in CONTROL_IQISAS code should be set to zero
Changes
1 The ldquoFILENAME CONTROLrdquo statement at the beginning of the program must be changed to reflect the location of the CONTROL_IQISAS code
2 In CONTROL_IQISAS specify the locations (paths) of the input and output SAS
files in the ldquoLIBNAME INA3rdquo and ldquoLIBNAME OUTA3rdquo statements
3 In CONTROL_IQISAS specify in the ldquoINFILE1rdquo statement the name of the discharge-level file that you created with the IQSAS1 program
4 In CONTROL_IQISAS specify the path (including the file name) for the ASCII
population text file in the ldquoFILENAME POPFILE3rdquo statement The file name is POP95T11TXT These files are provided along with the software The file used should be the one that is closest to the year associated with your particular data These files contain Census residential estimates by area gender and discrete age categories
5 In CONTROL_IQISAS specify in the ldquoFILENAME COVARArdquo statement the path
(including the file name) for the ASCII text file that contains regression coefficients from a regression that was run on reference SID dataset The name of the file is COVIQA42TXT
6 In CONTROL_IQISAS specify in the ldquoFILENAME MSXArdquo statement the path
(including the file name) for the ASCII text file that contains the estimates to smooth the indicator rates The name of the file is MSXIQA42TXT
7 In CONTROL_IQISAS specify in the ldquoINFILEA2rdquo statement the name of the
summary file that you created with the IQSASA2 program
Inpatient Quality Indicators (IQI) Software Instruction SAS
Inpatient Quality Indicators (IQI) 35 Version 43 (August 2011)
8 In CONTROL_IQISAS specify in the ldquoOUTFILA3rdquo statement the name that you wish the output file to have
9 In CONTROL_IQISAS if you wish to create an ASCII (comma delimited) text file
that you can import into a spreadsheet then set the TEXTA3 parameter to 1 Otherwise the default value of zero for TEXTA3 will skip the code that would generate this file
10 In CONTROL_IQISAS if you wish to create an ASCII (comma delimited) text file
that you can import into a spreadsheet then specify the path (including the file name) for this ASCII text file in the ldquoFILENAME IQTEXTA3rdquo statement
Inpatient Quality Indicators (IQI) Software Instruction SAS
Inpatient Quality Indicators (IQI) 36 Version 43 (August 2011)
90 Reviewing the Printed Output This section contains tips for reviewing some of the printed output from the IQI module
These tips are oriented toward explaining the interrelationships between printout items from different programs and hopefully will help to reveal the nature and structure of the module outputs For guidance in interpreting the results see the Interpretations Guide
The final output of the IQI module is a PROC PRINT from IQSASP3 (for provider-level indicators) and IQSASA3 (for area-level indicators) All interim printouts are for checking and trouble-shooting However if you have elected to refrain from risk-adjusting and smoothing the data then the final outputs will be the PROC PRINT at the end of the IQSASP2 andor IQSASA2 programs
91 IQSAS1
The initial printout from the IQSAS1 program contains PROC MEANS for all of the numeric variables in the output discharge-level dataset It will contain information for the newly constructed TAIQxx and TPIQxx flag variables that will later form the numerators for the indicator rates For each TAIQxx and TPIQxx flag variable
bull The SUM will contain the total number of observations in the dataset that were found to have the particular outcome of interest
bull For the six Provider volume indicators (TPIQ01-TPIQ02 TPIQ04-TPIQ07) and the four Area indicators (TAIQ26-TAIQ29) the MEAN MINIMUM and MAXIMUM will usually be the value one since the flag variables have either been set to missing (lsquorsquo) or to a value of one The remainder of the Provider indicators (TPIQ08-TPIQ09 TPIQ11-TPIQ25 and TPIQ30-TPIQ34) have a value of one zero or missing (lsquorsquo) For these indicators a value of zero was assigned to the TPIQxx flag if a particular observation was part of the population at risk for a particular indicator but did not have the particular outcome of interest So for example TPIQ21 = 1 indicates a patient who had a Cesarean section while TPIQ21 = 0 identifies a patient who had a delivery but not a C-section
bull For the Provider indicators TPIQ08-TPIQ09 TPIQ11-TPIQ25 and TPIQ30-TPIQ34 the MEANs will contain a close approximation of the eventual overall observed indicator rates The values will change slightly after IQSASP2 has applied additional parts of the indicator definitions
bull N lists the number of observations in the dataset with non-missing values For the six provider-based volume indicators and the four area-level indicators N for TPIQxx or TAIQxx will be the same as the SUM For the other provider-based indicators N will contain the denominator for the observed indicator rate Note the Nrsquos or denominators for six of the mortality indicators (ie IQI 08-12 30 and 31) will be similar to the Ns and SUMs for the six volume indicators (TPIQ01-TPIQ02 TPIQ04-TPIQ07) but often they will not be exactly identical (eg the mortality indicators exclude discharges that were transferred to other hospitals)
Inpatient Quality Indicators (IQI) Software Instruction SAS
Inpatient Quality Indicators (IQI) 37 Version 43 (August 2011)
The IQSAS1 printout also contains a PROC CONTENTS that lists all of the variables in the output dataset including the character variables that are present and a PROC PRINT of the first 24 observations in the output dataset
92 IQSASP2 The purpose of this printout is to provide the observed rates for all provider-level indicators
The default printout shows results by provider but other levels of output (as shown in Table 6) can be specified as well Note that risk-adjusted and smoothed rates are shown in the output from the next program
The printout from the IQSASP2 program contains PROC MEANS on the provider-level summary records for all of the numeric variables in the output summary dataset It will contain information for the newly constructed OPIQxx rates the PPIQxx denominators and the TPIQxx numerators
bull The _TYPE_ variable described in the MEANS table identifies the stratification level for the records in the output data set The _TYPE_ variable corresponds to the TYPELVLP parameter values that were specified (see item number 4 in the ldquoChangesrdquo section for the IQSASP2 program on page 32) In this case _TYPE_ always assumes the value of 16 since only the provider-level records are selected
bull The N statistic for _TYPE_ contains the number of providers in the output summary data set A TPIQxx numerator variable with a value for N that is lower than the N value for _TYPE_ indicates that there were no outcomes of interest for some of the providers Similarly a PPIQxx denominator variable with a lower value for N than _TYPE_ indicates that for some providers there were no hospital discharges with the outcome of interest
bull The MINIMUM value for the TPIQ08-TPIQ25 TPIQ30 and TPIQ31 numerators will usually be zero since values of zero were assigned for observations that were part of the population for the rate denominator but did not have the particular outcome of interest to be included in the rate numerator For the volume indicators (TPIQ01-TPIQ07) the MINIMUM value will be one or higher
For the observed rates the User should NOT report the MEANS displayed here but instead should refer to the overall means in the output dataset that are also present in the subsequent PROC PRINT The MEANS given here are means of hospital means ie all hospitals are given equal weight regardless of the number of discharges in the different hospitals
bull The SUMs for the counter variables TPIQxx and PPIQxx will contain overall file totals for these data elements The SUMs for the observed rates have no intuitive meaning If the ldquoPRINTrdquo parameter in the CONTROL_IQISAS program is set to one the subsequent
PROC PRINT output contains a complete dump of the output summary file Listed for each record are the stratification values the PPIQxx population denominators for the 30 provider indicators the TPIQxx outcome numerators for the 30 provider indicators and the 30 OPIQxx observed rates
Inpatient Quality Indicators (IQI) Software Instruction SAS
Inpatient Quality Indicators (IQI) 38 Version 43 (August 2011)
93 IQSASP3 The PROC PRINT at the end of this program provides your final output (This printout appears if the ldquoPRINTrdquo parameter in the CONTROL_IQISAS program is set to one)
The following table lists the column headers shown on the printed output and describes each
Each indicator is reported in a separate section Values of ldquoxxrdquo correspond to the two-digit IQI number Table 8 Provider level printed output
Column Heading Description Obs Observation 1 (with HOSPID = ldquordquo) is the overall average for the entire dataset
(TYPELVLP = 0) The remaining observations are individual providers or hospitals (TYPELVLP = 16)
HOSPID Identifier for each provider in the dataset AGECAT Age stratification category ndash See Table 6 for TYPELVLP settings SEXCAT Gender stratification category ndash See Table 6 for TYPELVLP settings PAYCAT Payer stratification category ndash See Table 6 for TYPELVLP settings RACECAT Race stratification category ndash See Table 6 for TYPELVLP settings TPIQxx Number of cases in the numerator PPIQxx Number of cases in the denominator (population at risk) OPIQxx Observed (raw) rate ndash Numerator divided by Denominator EPIQxx Expected rate ndash Rates the provider would have if it performed the same as the
reference population given the providerrsquos actual case-mix (eg age gender modified DRG and comorbidities)
RPIQxx Risk-adjusted rate ndash Accounts for the difference between the case-mix of the reference population and the providerrsquos case-mix When stratifications other than hospital or area are selected the RPIQxx variables and their confidence intervals are observedexpected ratios to avoid confounding with risk adjustment variables
LPIQxx Lower limit of confidence interval of risk-adjusted rate UPIQxx Upper limit of confidence interval of risk-adjusted rate SPIQxx Smoothed rate ndash Rates with removal of fluxuation over time XPIQxx Standard error of smoothed rate
Observation 1 (with HOSPID = ) is the overall average for the entire dataset (TYPELVL =
0) The remaining observations are individual providers or hospitals (TYPELVL = 16) Data will appear under the column headers AGECAT SEXCAT PAYCAT and RACECAT if you specify these levels of aggregation (shown in Table 6)
You may wish to express the results in more understandable terms
bull Multiply the mortality rates by 100 to express them as a percentage (eg 00338 100 = 34 mortality for CABG)
bull Multiply the utilization rates by 100 to express them as a percentage (eg 02040 100 = 204 C-section rate)
Inpatient Quality Indicators (IQI) Software Instruction SAS
Inpatient Quality Indicators (IQI) 39 Version 43 (August 2011)
The MEANS table is generated from the permanent provider-based output file and is provided for trouble-shooting and understanding your data but not for reporting The means are provided just for the provider level summary records
bull The N for all but the TPIQxx counter variables should contain the number of providers in the userrsquos database
bull The MEANS MINIMUMs and MAXIMUMs have their normal meaning and provide comparisons among the different hospitals or providers in your database
For the (observed risk-adjusted or smoothed) rates the User should NOT report the MEANS displayed here but instead refer to the overall means in the output dataset in the PROC PRINT labeled ldquoFINAL OUTPUTrdquo The MEANS given here are means of hospital means ie all hospitals are given equal weight regardless of the number of discharges in the different hospitals
bull Note The denominators for six of the mortality indicators ( 8 ndash 12 30 and 31) will be similar to the totals for the six volume indicators (TPIQ01-TPIQ07) but often they will not be exactly identical (eg the mortality indicators exclude discharges that were transferred to other hospitals)
bull If the ldquoPRINTrdquo parameter in the CONTROL_IQISAS program is set to one at the end of the printout is a PROC PRINT on the final provider-based output file Listed for each level of stratification are the stratifiers the numerator and denominator totals for the observed rates and the observed risk-adjusted and smoothed rates
94 IQSASA2
The purpose of this printout is to provide the observed rates for all area-level indicators The default printout shows overall results and results by area but other levels of output (as shown in Table 6) can be specified as well Note that risk-adjusted and smoothed rates are shown in the output from the next program
The printout from the IQSASA2 program contains PROC MEANS for all of the numeric variables in the output summary dataset It will contain information for the newly constructed OAIQxx rates the PAIQxx denominators and the TAIQxx numerators
bull The _TYPE_ variable described in the first row of the MEANS table identifies the stratification level for the records in the output data set The _TYPE_ variable corresponds to the TYPELVLA parameter values that were specified (see item 5 in the ldquoChangesrdquo section for the IQSASA2 program on page 31) In this case _TYPE_ always assumes the value of 8 since only the area-level records are selected
bull The N statistic for _TYPE_ contains the number of areas in the output summary data set A TAIQxx numerator variable with a lower value for N than _TYPE_ indicates that there were no outcomes of interest for some of the areas
bull The MINIMUM value for the TAIQxx numerators will be one or higher
Inpatient Quality Indicators (IQI) Software Instruction SAS
Inpatient Quality Indicators (IQI) 40 Version 43 (August 2011)
For the observed rates the User should NOT report the MEANS displayed here but instead should refer to the overall means in the output dataset that are also present in the subsequent PROC PRINT The MEANS given here are means of the area means ie all areas are given equal weight regardless of the population in the different areas
bull The SUMs for the counter variables TAQIxx and PAIQXX will contain overall file totals for these data elements The SUMs for the observed rates have no intuitive meaning
If the ldquoPRINTrdquo parameter in the CONTROL_IQISAS program is set to one the subsequent
PROC PRINT output contains a complete dump of the output summary file Listed for each record are the stratification values the PAIQxx population denominators for the four indicators the TAIQxx outcome numerators for the four indicators and the four OAIQxx observed rates
95 IQSASA3 The PROC PRINT at the end of this program provides your final output (This printout appears if the ldquoPRINTrdquo parameter in the CONTROL_IQISAS program is set to one)
The following table lists the column headers shown on the printed output and describes each
Each indicator is reported in a separate section Values of ldquoxxrdquo correspond to the two-digit IQI number Table 9 Area level printed output
Column Heading Description
Obs Observation 1 is the overall average for the entire dataset (TYPELVLA = 0) The remaining observations are individual areas (TYPELVLA = 8)
Area Identifier in the dataset for area TAIQxx Number of cases in the numerator PAIQxx Number of cases in the denominator (population at risk) OAIQxx Observed (raw) rate ndash Numerator divided by Denominator RAIQxx Risk-adjusted rate ndash Accounts for the difference between the case-mix of the
reference population and the arearsquos case-mix When stratifications other than hospital or area are selected the RPIQxx variables and their confidence intervals are observedexpected ratios to avoid confounding with risk adjustment variables
SAIQxx Smoothed rate ndash Rates with removal of fluxuation over time
Observation 1 (with AREA = blank) is the overall average for the entire dataset (TYPELVL = 0) The remaining observations are individual areas (TYPELVL = 8)
You may wish to express the results in more understandable terms
bull Multiply the utilization rates by 100000 to express them as a rate per 100000 population (eg 0000494 100000 = 494 hysterectomies per 100000 population)
The MEANS table is generated from the permanent area-level output file The means are
provided just for the area-level summary records
Inpatient Quality Indicators (IQI) Software Instruction SAS
Inpatient Quality Indicators (IQI) 41 Version 43 (August 2011)
bull The N for all but the TAIQxx counter variables should contain the number of different areas (Metro Areas and counties) in your database
bull The MEANs MINIMUMs and MAXIMUMs have their normal meaning and provide comparisons among the different areas in your database Note that the MAXIMUMs for the counter variables (the TAIQxx and PAIQxx variables) are associated with specific areas and therefore these MAXIMUMs may not match those in the prior IQSAS2 printouts since that run typically will include a record for the entire database
For the (observed risk-adjusted or smoothed) rates the User should NOT report the MEANS displayed here but instead refer to the overall means in the output dataset that are also present in the subsequent PROC PRINT The MEANS given here are means of area means ie all areas are given equal weight regardless of the number of discharges in the different areas
bull The SUMs of the counter variables (the TAIQxx and PAIQxx variables) yield the overall database totals
Inpatient Quality Indicators (IQI) Software Instruction SAS
Inpatient Quality Indicators (IQI) 42 Version 43 (August 2011)
100 Benchmark Timings The benchmark runtimes given below are from runs made on a Windows XP workstation
with a Pentium 4 CPU 280 GHz processor 512 MB of RAM and an IDE hard drive The dataset used contained 757624 observations with 15 diagnosis fields and 15 procedure fields
Step Run time (in seconds) Run IQFMTS to create the format library 2 Run IQSAS1 157 Run IQSASP2 21 Run IQSASP3 86 Run IQSASA2 10 Run IQSASA3 185
101 User Support Technical assistance is available through an electronic user support system monitored by the
QI support team to support users in their application of the IQI software The same e-mail address may be used to communicate to AHRQ any suggestions for IQI enhancements general questions and any QI related comments you may have AHRQ welcomes your feedback
The Internet address for user support and feedback is supportqualityindicatorsahrqgov AHRQ also offers a listserv to keep you informed on the Quality Indicators (QIs) The
listserv is used to announce any QI changes or updates new tools and resources and to distribute other QI related information This is a free service Simply follow the process described below to begin receiving important QI information All you need is a computer Internet access and an E-mail address It works just like other electronic distribution lists
Herersquos how to register 1 Send an E-mail message to listservqualityindicatorsahrqgov 2 On the subject line type Subscribe For example Subscribe
3 In the body of the message type sub Quality_Indicators-L and your full name For example sub Quality_Indicators-L John Doe
4 You will receive a message confirming that you are signed up If you have any questions contact AHRQ QI Support at the e-mail noted above You should
receive an automatic response e-mail message confirming receipt of your e-mail If you do not receive a confirmation message call (888) 512-6090
Inpatient Quality Indicators (IQI) Software Instruction SAS
Inpatient Quality Indicators (IQI) 43 Version 43 (August 2011)
Appendix A Links The following links may be helpful to users of the AHRQ Inpatient Quality Indicators
Inpatient Quality Indicators Version 43 Documents and Software Available at httpwwwqualityindicatorsahrqgovmodulesiqi_resourcesaspx and httpwwwqualityindicatorsahrqgovsoftwaredefaultaspx
Title Description
IQI User Guide Individual Measures
The user guide provides a technical overview of the IQI individual measures including literature and empirical evidence
IQI User Guide Composite Measures
The user guide provides a technical overview of the IQI composite measures
IQI Technical Specifications
Provides detailed definitions of each IQI including all ICD-9-CM and DRG codes that are included in or excluded from the numerator and denominator Note that exclusions from the denominator are automatically applied to the numerator
IQI Comparative Data This document provides the average volume provider rate and population rate as appropriate for each indicator
Fiscal year 2011 Coding Changes
This document summarizes the changes to the indicator definitions resulting from FY 2011 changes to ICD-9-CM coding and DRG changes These changes will only affect data from FY 2011 (October 1 2011) or later
Log of Changes to IQI Documents and Software
The Change Log document provides a cumulative summary of all changes to the IQI software software documentation and other documents made since the release of version 21 of the software in March 2003 Changes to indicator specifications that were not a result of new ICD-9-CM and DRG codes are also described in the Change Log
IQI Risk Adjustment Coefficient Tables
Tables for each IQI provide the stratification and coefficients used to calculate the risk-adjusted rate for each strata
SASreg IQI Software Documentation
This software documentation provides detailed instructions on how to use the SAS reg version of the IQI software including data preparation calculation of the IQI rates and interpretation of output
SASreg IQI Software Requires the SASreg statistical program distributed by the SAS Institute Inc The company may be contacted directly regarding the licensing of its products httpwwwsascom
3Mreg APRreg DRG Limited License Grouper for SASreg
Creates APR-DRG variables for use with SAS version of IQI software Instructions for running the software are included in the Zip file
Version 43 Listserv announcement
This document announces the release of the Version 43 software and documentation provides a summary of changes and links to relevant pages
Inpatient Quality Indicators (IQI) Software Instruction SAS
Inpatient Quality Indicators (IQI) 44 Version 43 (August 2011)
AHRQ QI Windows Application The AHRQ QI Windows Application calculates rates for all of the AHRQ Quality Indicators modules and does not require SASreg It is available at
httpwwwqualityindicatorsahrqgovwinqi_downloadhtm Additional Documents The following documents are available within the Archive section of the AHRQ QI Web page
httpwwwqualityindicatorsahrqgovArchivedefaultaspxiqi
bull Refinement of the HCUP Quality Indicators (Technical Review) May 2001 bull Refinement of the HCUP Quality Indicators (Summary) May 2001
In addition these documents may be accessed at the AHRQ QI Modules Web page
httpwwwqualityindicatorsahrqgovmodulesDefaultaspx bull AHRQ QI Measure Development Implementation Maintenance and Retirement bull ICD-9-CM to ICD-10-CMPCS Conversion of AHRQ QI March 2011 bull AHRQ QI Empirical Methods May 2011 bull Guidance for Using the AHRQ Quality Indicators for Hospital-level Public Reporting
or Payment August 2004 bull AHRQ Summary Statement on Comparative Hospital Public Reporting December
2005 bull Appendix A Current Uses of AHRQ Quality Indicators and Considerations for
Hospital-level bull Comparison of Recommended Evaluation Criteria in Five Existing National
Frameworks bull List of AHRQ QI Endorsed by the National Quality Forum
The following documents can be viewed or downloaded from the AHRQ QI News Web page
httpwwwqualityindicatorsahrqgovnewsdefaultaspx and httpwwwqualityindicatorsahrqgovArchiveNewsaspx bull February 2007 Newsletter - Year highlights and future plans bull February 2006 Newsletter ndash Year highlights and future plans bull 2006 Area Level Indicator Changes bull Considerations in Public Reporting for the AHRQ QI bull June 2005 Newsletter - Contains the article Using Different Types of QI Rates
Inpatient Quality Indicators (IQI) Software Instruction SAS
Inpatient Quality Indicators (IQI) 45 Version 43 (August 2011)
Other Tools and Information
IQI rates can be calculated using the modified Federal Information Processing Standards (FIPS) Statecounty code A list of codes is available at
httpwwwcensusgovpopestgeographiccodes02pdf
AHRQ provides a free on-line query system based on HCUP data that provides access to health statistics and information on hospital stays at the national regional and State level It is available at
httphcupahrqgovHCUPnetasp
Information on the 3Mtrade APR-DRG system is available at
httpwww3mcomushealthcarehisproductscodingrefined_drgjhtml
Inpatient Quality Indicators (IQI) Software Instruction SAS
Inpatient Quality Indicators (IQI) 46 Version 43 (August 2011)
Appendix B Using Different Types of QI Rates When should you use the observed expected risk adjusted andor smoothed rates generated
by the AHRQ QI software Here are some guidelines If the userrsquos primary interest is to identify cases for further follow-up and quality
improvement then the observed rate would help to identify them The observed rate is the raw rate generated by the QI software from the data the user provided Areas for improvement can be identified by the magnitude of the observed rate compared to available benchmarks andor by the number of patients impacted
Additional breakdowns by the default patient characteristics used in stratified rates (eg age gender or payer) can further identify the target population Target populations can also be identified by user-defined patient characteristics supplemented to the casedischarge level flags Trend data can be used to measure change in the rate over time
Another approach to identify areas to focus on is to compare the observed and expected rates The expected rate is the rate the provider would have if it performed the same as the reference population given the providerrsquos actual case-mix (eg age gender DRG and comorbidity categories)
If the observed rate is higher than the expected rate (ie the ratio of observedexpected is greater than 10 or observed minus expected is positive) then the implication is that the provider performed worse than the reference population for that particular indicator Users may want to focus on these indicators for quality improvement
If the observed rate is lower than the expected rate (ie the ratio of observedexpected is less than 10 or observed minus expected is negative) then the implication is that the provider performed better than the reference population Users may want to focus on these indicators for identifying best practices
Users can also compare the expected rate to the reference population rate reported in the AHRQ QI software or Comparative Data document to determine how their case-mix compares to the reference population The population rate refers to the overall rate for the reference population The reference population is defined in the Comparative Data Document If the population rate is higher than the expected rate then the providerrsquos case-mix is less severe than the reference population If the population rate is lower than the expected rate then the providerrsquos case-mix is more severe than the reference population
We use this difference between the population rate and the expected rate to ldquoadjustrdquo the observed rate to account for the difference between the case-mix of the reference population and the providerrsquos case-mix which is the providerrsquos risk-adjusted rate
If the provider has a less severe case-mix then the adjustment is positive (population rate gt expected rate) and the risk-adjusted rate is higher than the observed rate If the provider has a more severe case-mix then the adjustment is negative (population rate lt expected rate) and the risk-adjusted rate is lower than the observed rate The risk-adjusted rate is the rate the provider would have if it had the same case-mix as the reference population given the providerrsquos actual performance
Finally users can compare the risk-adjusted rate to the smoothed or ldquoreliability-adjustedrdquo rate to determine whether this difference between the risk-adjusted rate and reference population rate is likely to remain in the next measurement period Smoothed rates are weighted averages of the population rate and the risk-adjusted rate where the weight reflects the reliability of the providerrsquos risk-adjusted rate
Inpatient Quality Indicators (IQI) Software Instruction SAS
Inpatient Quality Indicators (IQI) 47 Version 43 (August 2011)
A ratio of (smoothed rate - population rate) (risk-adjusted rate - population rate) greater than 080 suggests that the difference is likely to persist (whether the difference is positive or negative) A ratio less than 080 suggests that the difference may be due in part to random differences in patient characteristics (patient characteristics that are not observed and controlled for in the risk-adjustment model) In general users may want to focus on areas where the differences are more likely to persist
Inpatient Quality Indicators (IQI) Software Instruction SAS
Inpatient Quality Indicators (IQI) 48 Version 43 (August 2011)
Appendix C IQI Input Data Dictionary Variable name Description Format Value description Comments
KEY Sequence number Unique case identifier Numeric
User defined unique numeric identifier for each discharge record
Not used by the QI programs but should be present to facilitate possible exploration allows user to link the records from the IQSAS1SAS program output file back to the original input data file
AGE Age in years at admission Numeric Age in years
If this data element is missing the discharge record will be excluded from analysis
AGEDAY Age in days (coded only when the age in years is less than 1) Numeric Age in days
Not used in the IQI program If not present in the input data file it is not necessary to create a dummy variable for this module
RACE Race of patient Numeric 1 2 3 4 5 6
White Black Hispanic Asian or Pacific Island Native American Other
The values of 1-5 are used directly in the QI software All other ethnicity codes are mapped to an lsquootherrsquo category
SEX Sex of patient Numeric
1 2
Male Female
If this data element is missing the discharge record will be excluded from the analysis
PAY1 Expected primary payer
Numeric 1 2 3 4 5 6
Medicare Medicaid Private incl HMO Self-pay No charge Other
The values of 1 2 3 and 4 are used directly in the QI software All other payer codes are mapped to an lsquootherrsquo category This data element is used to stratify only the Provider-level IQI (IQI-01 toIQI-25 IQI-30 to IQI-34)
PAY2 (SAS Only)
Expected secondary payer
Numeric 1 2 3 4 5 6
Medicare Medicaid Private incl HMO Self-pay No charge Other
Use is optional but must be present in data (set to missing if data element not available)
PSTCO
Location of patient residence or hospital location (FIPSdagger Statecounty code)
Numeric ssccc
Modified Federal Information Processing Standards Statecounty code2
See Appendix A for link to most recent list of codes If this data element is missing the discharge record will be excluded from rate calculations
HOSPID Data Source hospital number Numeric Hospital
identification number Used to facilitate data exploration and possible trouble shooting
2 Federal Information Processing Standard as defined by the US Department of Commerce National Institute of Standards and Technology (formerly National Bureau of Standards) Note Certain independent cities (Baltimore City Carson City and St Louis City) and areas within Hawaii and Virginia are assigned to different area groupings in the Modified FIPS categories as compared to the US Census Bureau groupings The AHRQ QI software uses the Modified FIPS code assignment of these areas Failure to use the Modified FIPS codes assignment will result in the use of incorrect denominator estimates for area indicators A list is available at httpwwwcensusgovpopestgeographiccodes02pdf
Inpatient Quality Indicators (IQI) Software Instruction SAS
Inpatient Quality Indicators (IQI) 49 Version 43 (August 2011)
Variable name Description Format Value description Comments
DISP Disposition of patient
Numeric 1 2 3 4 5 6 7 20
Routine Short-term hospital Skilled nursing facility Intermediate care Another type of facility Home health care Against medical advice Died in the hospital
The values 2 and 20 are referenced by the QI code (to identify transfers to another short-term hospital and patients who died in the hospital)
MORT30 (SAS Only)
30-Day Mortality Indicator Numeric
0 ndash not died within 30-days from admission
Use is optional but must be present in data (set to missing if data element not available)
1 ndash died within 30-days from admission
DNR Do Not Resuscitate Indicator Numeric
0 ndash No ldquoDo Not Resuscitaterdquo Indicator
Use is optional but must be present in data (set to missing if data element not available)
1 ndash ldquoDo Not Resuscitaterdquo Indicator
ATYPE Admission Type Numeric 1 2 3 4 5 6
Emergency Urgent Elective Newborn Trauma Center3 Other
Not used by the IQI program If not present in the input data file it is not necessary to create a dummy variable
ASOURCE Admission Source
Numeric 1 2 3 4 5
ER Another hospital Another facility including LTC Courtlaw enforcement Routinebirthother
The value 2 is referenced by the QI code (to identify transfers from another short-term hospital)
LOS Length of Stay Numeric Number of days from admission to discharge
Not used by the IQI program If not present in the input data file it is not necessary to create a dummy variable
APR_DRG APR-DRG category Numeric APR-DRG from 3Mreg software
Although the IQI module will operate without these variables users should run APR-DRG software on their raw data to assign this variable to each case See Section 53 on page 15
APRDRG_ RISK_ MORTALITY
APR-DRG Mortality Score Numeric
APR-DRG Risk of Mortality Score from 3Mreg software
See Section 53 on page 15
XPRDRG_ RISK_ MORTALITY
APR-DRG Mortality Score with POA Numeric
APR-DRG Risk of Mortality Score from 3Mreg Software using
See Section 53 on page 15
3 The ATYPE value ldquo5rdquo was used to indicate delivery only in the 1988 to 1997 HCUP data files The UB standards currently use ldquo5rdquo to indicate Trauma Center
Inpatient Quality Indicators (IQI) Software Instruction SAS
Inpatient Quality Indicators (IQI) 50 Version 43 (August 2011)
Variable name Description Format Value description Comments
POA information
DRG Diagnosis Related Group Numeric DRG from federal (CMS) DRG Grouper
DRGVER Diagnosis Related Group Version Numeric
DRG Version of federal (CMS) DRG Grouper
eg Version 28 for FY2011
MDC Major Diagnostic Category Numeric MDC from federal (CMS) DRG grouper
DISCWT Weight to assign to discharge Numeric Format as nnnnn
Cases with missing values are assigned a value of 1 Assigning a weight of zero has the effect of removing the case from the analysis
DX1 ndash DX30
ICD-9-CM diagnosis codes DX1 is the principal diagnosis DX2-DX30 are secondary diagnoses
String 3 4 or 5
characters (do not include decimal point)
Diagnosis codes Users must specify the number of diagnoses in the parameter ampNDX in CONTROL_IQISAS program
DXPOA1- DXPOA30-
Present on admission indicator for each diagnosis code
String
1 = present at the time of inpatient admission
These data will be used in risk adjustment and smoothing if the alternative parameter files of risk-adjustment covariates and population rates is specified
(YWE1)
0 = not present at the time of inpatient admission
(NUrsquo0rsquo )
NDX Count of the number of diagnoses (DX) on the discharge record
Numeric
Count of diagnoses (principal and all secondary diagnoses)
Not used by the IQI SAS program If not present in the input data file it is not necessary to create a dummy variable Definition is If the 1st discharge record has 1 Pr and the 2nd has 2 NPR would be 1 for the 1st record and 2 for the 2nd
PR1 ndash PR30
ICD-9-CM procedure codes PR1 is the principal procedure PR2-PR30 are secondary procedures
String 3 or 4
characters (do not include decimal point)
Procedure code
Users with more or fewer secondary procedures should modify the parameter ampNPR in CONTROL_IQISAS to reflect the number of diagnoses
NPR Count of the number of procedures (PR) on the discharge record
Numeric
Count of procedures (principal and all secondary procedures)
Not used by the IQI SAS program If not present in the input data file it is not necessary to create a dummy variable Definition is If the 1st discharge record has 1 Pr and the 2nd has 2 NPR would be 1 for the 1st record and 2 for the 2nd
Inpatient Quality Indicators (IQI) Software Instruction SAS
Inpatient Quality Indicators (IQI) 51 Version 43 (August 2011)
Variable name Description Format Value description Comments
POINTOFORIGINUB04
Point of Origin Numeric 4 Transfer from a hospital 5 Transfer from a skilled Nursing Facility (SNF) or Intermediate Care Facility (ICF)
Only these values are used by the QI programs
6 Transfer from another health care facility
IF ATYPE = 4
5 Born inside this hospital
6 Born outside of this hospital
PRDAY1 ndash PRDAY30
Days from admission to procedure PR1 is the principal procedure PR2-PR30 are secondary procedures
Numeric Days from Admission to Procedure4
Not used by the IQI program If not present in the input data file it is not necessary to create a dummy variable for this module
YEAR
Year of discharge The patientrsquos year of discharge For example a patient discharged on July 7 2004 would have a discharge year of lsquo2004rsquo
Numeric
YYYY
Discharge year should be within the range of 1997 to 2011
DQTR Quarter of discharge The calendar quarter of the patientrsquos discharge For example a patient discharged on July 7 2004 would have a discharge quarter of lsquo3rsquo
Numeric 1 January-March 2 April-June 3 July-September 4 October-December
See httphcup-usahrqgovtoolssoftwarecomorbiditycomorbidityjsp
4 Variables PRDAY1 to PRDAY30 are defined as the number of days from date of admission to date of procedure for each procedure For example if the patient was admitted on June 15th and had two procedures - the principal procedure on June 15th and a second procedure on June 18th ndash then the value of PRDAY1 would be zero (0) and the value of PRDAY2 would be three (3) For more information consult the HCUP data documentation at httpwwwhcup-usahrqgovdbvarsprdaynnisnotejsp
Inpatient Quality Indicators (IQI) Software Instruction SAS
Inpatient Quality Indicators (IQI) 52 Version 43 (August 2011)
Appendix D SAS IQI Output Data Dictionary SAS IQI Provider Output Column Heading Description Format Comments
Obs Observation 1 (with HOSPID = ) is the overall average for the entire dataset (TYPELVLP = 0) The remaining observations are individual providers or hospitals (TYPELVLP = 16)
Numeric
HOSPID Identifier for each provider in the dataset
Text Up to 12 characters
AGECAT Age stratification category Numeric range
SEXCAT Gender stratification category Numeric 1 = male 2 = female PAYCAT Payer stratification category Numeric 1 = Medicare
2 = Medicaid 3 = Private incl HMO 4 = Self-pay 5 = No charge 6 = Other
RACECAT Race stratification category Numeric 1 = White 2 = Black 3 = Hispanic 4 = Asian or Pacific Island 5 = Native American 6 = Other
TPIQxx The number of discharge records included in the numerator (outcome of interest) as defined for the indicator
Numeric
PPIQxx The number of discharge records included in the denominator (population at risk) as defined for the indicator
Numeric
OPIQxx The rate (observed numerator observed denominator) as defined for the indicator
Numeric
EPIQxx Rate calculated by assuming an average performance for each patient group based on the reference population but with the providerlsquos actual case-mix
Numeric
RPIQxx The estimated rate calculated by adjusting to an average case-mix
Numeric When stratifications other than hospital or area are selected the RPIQxx variables and their confidence intervals are observedexpected ratios to avoid confounding with risk adjustment variables
LPIQxx The lower confidence bound of the risk adjusted rate
Numeric
UPIQxx The upper confidence bound of the risk adjusted rate
Numeric
Inpatient Quality Indicators (IQI) Software Instruction SAS
Inpatient Quality Indicators (IQI) 53 Version 43 (August 2011)
Column Heading Description Format Comments
SPIQxx The smoothed rate calculated using multivariate signal extraction (MSX)
Numeric
XPIQxx Standard error of smoothed rate Numeric VPIQxx Variance for respective indicators Numeric
SAS IQI Area Output Column Heading Description Format Comments
Obs Observation 1 (with HOSPID = ) is the overall average for the entire dataset (TYPELVLP = 0) The remaining observations are individual providers or hospitals (TYPELVLP = 16)
Numeric
AREA Identifier in the dataset for area Text TAIQxx The number of discharge records
included in the numerator (outcome of interest) as defined for the indicator
Numeric
PAIQxx The number of discharge records included in the denominator (population at risk) as defined for the indicator
Numeric
OAIQxx The rate (observed numerator observed denominator) as defined for the indicator
Numeric
RAIQxx The estimated rate calculated by adjusting to an average case-mix
Numeric When stratifications other than hospital or area are selected the RAIQxx variables and their confidence intervals are observedexpected ratios to avoid confounding with risk adjustment variables
SAIQxx The smoothed rate calculated using multivariate signal extraction (MSX)
Numeric
Inpatient Quality Indicators (IQI) Software Instruction SAS
Inpatient Quality Indicators (IQI) 1 Version 43 (August 2011)
10 Introduction This documentation describes the software for implementing the Inpatient Quality Indicator
(IQI) module of the AHRQ Quality Indicators Version 43 and highlights features of the analytic approach of particular interest to new users
The programs documented here were developed for use in Statistical Analysis System (SASreg)1 The SASreg version of the IQI software is designed as a PC-based single-user application It has been tested with SASreg version 92 on a 32-bit machine To use the SAS version of the QI software users must have access to the commercially-available SASreg statistical software package including but not limited to BASE SAS SASSTAT and SASACCESS For more information visit the SAS Institute website at httpwwwsascom
The IQI software consists of a series of computer programs that
bull Assign and calculate IQI from hospital discharge abstracts or UB (uniform billing) claims data
bull Print IQI results in SAS format or as an ASCII text file (comma delimited) that can be imported into word processing documents spreadsheets or graphics software at the users option
bull Provide four options for stratifying rates by geographic areas
bull Create smoothed (ie reliability-adjusted) rates that reduce fluctuations over time due to random variation
bull The reference population database used by the software was updated to HCUPrsquos Year 2008 State Inpatient Databases (SID) This database is used to create the regression coefficients applied in risk adjustment (see Section 74) and the shrinkage factors used to calculate smoothed rates (see Section 75)
bull The syntax now supports a data weighting variable (DISCWT) like those used in the Nationwide Inpatient Sample This numeric variable must be present in the input file (see Section 51) and should be set to 1 if weighting is not desired
bull Effective March 1 2007 the UB-04 data specification manual includes a Present on Admission indicator (httpwwwcdcgovnchsdataicd9icdguide09pdf ) For the IQI POA data may impact risk-adjusted rates by excluding secondary diagnoses coded as complications from the identification of covariates If the userrsquos input file does not include POA data an estimation procedure is used to adjust the prevalence of the covariates to account for the missing POA data You may include POA data for all your records some of your records or none of them Including records with and without POA data is also allowed the estimation procedure is applied to those records where POA data are missing and not to those records where POA data are not missing
bull Installation of Version 43 SAS syntax requires additional steps for the risk adjustment procedures to operate correctly Once completed for one AHRQ QI module (ie IQI PSI or
1 SAS is a statistical program distributed by the SAS Institute Inc (httpwwwsascom) The company may be contacted directly regarding the licensing of their products The SAS Institute Inc does not have any affiliation with AHRQ nor involvement in the development of the AHRQ QI
Inpatient Quality Indicators (IQI) Software Instruction SAS
Inpatient Quality Indicators (IQI) 2 Version 43 (August 2011)
PDI) the Prediction Module step does not need to be repeated for the other modules The steps are
bull Installing the Prediction Module software
bull Click ldquoPrediction Modulerdquo link at httpwwwqualityindicatorsahrqgovsoftwareSASaspx
bull Save the ldquoAHRQSetup 092190msirdquo file to a directory on local machine
bull Double-click ldquoAHRQSetup 092190msirdquo ndash this will install the Prediction Module executable and license files in ldquoCProgram FilesBattelleAHRQrdquo (6 files total)
bull Create a new folder ldquoCAHRQQIAHRQPredictionrdquo and copy all 6 installation files to that location (so they are located in both places)
bull Saving the required files to run the AHRQ QI SAS software
bull Create a sub-folder under ldquoCAHRQQIrdquo called ldquoIQIrdquo
bull The software package contains another zip file called ldquoIQI_GEE_Input_Filesziprdquo All of the files within this zip file need to be extracted to the sub-folder ldquoCAHRQQIIQIrdquo
bull The syntax will compute risk-adjusted rates and observed-to-expected ratios for the pre-defined set of stratification variables (eg age gender payer race) When stratifications other than hospital or area are selected the RPPSxx variables and their confidence intervals are observedexpected ratios to avoid confounding with risk adjustment variables
Version 43 of the IQI software includes the following changes
bull The IQI module Version 43 contains formats that incorporate ICD-9-CM and DRG coding through September 30 2011 A list of the coding changes made for the fiscal year and a Change Log for the IQI module may be found on the AHRQ QI website (IQI)
bull The 3Mreg APRreg DRG Limited License Grouper for SASreg software has been updated to FY2011 codes Beginning with Version 23 3M will update the APR-DRG every fiscal year The optional limited license grouper available with the AHRQ QI software is ldquomulti-versionrdquo (ie Versions 20 23 to 28) The software will apply the correct version based on the discharge year and quarter Users who have their own APR-DRG grouper can use either the applicable DRG version or the ICD-9-CM mapping to Version 20 See Section 53 for information on APR-DRG variables The Inpatient Quality Indicators Comparative Data document provides comparative values
including average volumes provider rates and population rates depending on the type of indicator The Inpatient Quality Indicators Technical Specifications document lists all ICD-9-CM and DRG codes included in and excluded from the numerator and denominator of each indicator
See Appendix A for links to these and other documents as well as Web sites that may be of interest to IQI users
See Appendix B ldquoUsing Different Types of QI Ratesrdquo for an explanation of observed expected risk adjusted and smoothed rates and for guidance in the use of these rates
This instruction includes
Inpatient Quality Indicators (IQI) Software Instruction SAS
Inpatient Quality Indicators (IQI) 3 Version 43 (August 2011)
bull A discussion of the data elements necessary to produce the AHRQ IQI and the uniform coding conventions recommended for those elements
bull Descriptions of the IQI processing steps in nontechnical language
bull Detailed descriptions of the functions of each IQI SAS program
Critical user information is highlighted with this symbol
Inpatient Quality Indicators (IQI) Software Instruction SAS
Inpatient Quality Indicators (IQI) 4 Version 43 (August 2011)
20 Components of the Inpatient Quality Indicators Module
As shown in Table 3 on page 9 the Inpatient Quality Indicators module consists of eight SAS programs and six ASCII text files that contain auxiliary data These programs and text files are described in the subsequent sections of this document
A note on the naming conventions for the Inpatient Quality Indicators (IQI) module programs Most programs use the naming format of IQSASi IQSASAi or IQSASPi The first two characters ldquoIQrdquo of the program name indicate an Inpatient Quality Indicators program to distinguish it from other modules that have been or will be released from AHRQ The next three characters of the program name are ldquoSASrdquo In the programs that are specific to either area-level or provider-level indicators the sixth character of the program name is either ldquoArdquo or ldquoPrdquo The sixth character is an ldquoArdquo if it is for the production of area-level indicator rates that use county or Office of Management and Budget (OMB) defined metropolitan or micropolitan area (Metro Area) populations as denominators The sixth character is a ldquoPrdquo if it is a program for the production of provider-level indicator rates that use subsets of the hospital discharge population The last character (i) of the variable name designates the number of the specific program
Inpatient Quality Indicators (IQI) Software Instruction SAS
Inpatient Quality Indicators (IQI) 5 Version 43 (August 2011)
30 Quick Reference The subsequent four pages are intended to serve as a quick reference to assist in reading this
documentation and in reviewing the Inpatient Quality Indicator (IQI) module outputs Processing steps are shown first (Figure 1 and Figure 2) followed by a listing of the module variables (Table 1) variable prefixes (Table 2) and module contents (Table 3) One suggestion is to print these pages in duplex mode on two sheets of paper so that they can then be easily referred to as the need arises
31 Processing Steps
Figure 1 shows processing steps for the Inpatient Quality provider-level Indicators while Figure 2 shows steps for the Inpatient Quality area-level Indicators
Inpatient Quality Indicators (IQI) Software Instruction SAS
Inpatient Quality Indicators (IQI) 6 Version 43 (August 2011)
Figure 1 Processing steps for the inpatient quality provider-level indicators
NOTE Each of the SAS Programs in Figure 1 incorporates the CONTROL_IQISAS program which contains code the user must modify in order to run the IQI software The modifications include such items as specifying the name and location of the input data set the population data set and the output data set
SIDyy(SAS dataset
conforming to HCUP coding conventions)
IQFMTSCreates IQI format library
that is used by most programs
IQSAS1Assigns 01 indicators for
IQI outcomesIQI format library
IQ1(inpatient data with 01
outcome indicators)
IQSASP2Calculates observed rates across stratifiers for the
provider volume utilization and mortality indicators
To the next page of the flow chart
To the next page of the flow chart
IQP2(observed rates for the provider IQIs across
stratifiers)PRDIQPlsaquoVERrsaquoTXT(file of parameters for
risk adjustment or prediction syntax file)
IQSASP3Creates risk-adjusted
smoothed and expected rates for the utilization
and mortality IQIs
IQP3(observed risk-adjusted smoothed and expected
utilization and mortality IQI rates and observed volumes
across stratifiers)MSXIQPlsaquoVERrsaquoTXT
(shrinkage factors from reference dataset)
LEGEND
SAS Data file Program Text file (supplied)
GEE_PIQ_Regression AnalysislsaquoQIrsaquoCSV
(regression coefficient from reference dataset)
Prediction_PIQ lsaquoQIrsaquoxml(input parameters for the
executable AHRQ Predictionexe)
Inpatient Quality Indicators (IQI) Software Instruction SAS
Inpatient Quality Indicators (IQI) 7 Version 43 (August 2011)
Figure 2 Processing steps for the inpatient quality area-level indicators
Inpatient Quality Indicators (IQI) Software Instruction SAS
Inpatient Quality Indicators (IQI) 8 Version 43 (August 2011)
32 Inpatient Quality Indicator Module Details The following tables list the module indicator variables (Table 1) variable prefixes (Table 2)
and module contents (Table 3)
Table 1 Inpatient quality indicator (IQI) variables IQI
number Indicator Age categories 18 to 39 40 to 64 65 +
Provider Volumes 1 Esophageal resection 2 Pancreatic resection 4 AAA repair 5 CABG No 6 PTCA No 7 Carotid endarterectomy
Provider Post-procedural Mortality Rates 8 Esophageal resection 9 Pancreatic resection 11 AAA repair 12 CABG No 30 PTCAa No 31 Carotid endarterectomya 13 Craniotomy 14 Hip replacement
Provider In-hospital Mortality Rates 15 AMI 32 AMI Without Transfer Cases 16 CHF 17 Stroke 18 GI hemorrhage 19 Hip fracture 20 Pneumonia
Provider Utilization Rates 21 Cesarean delivery 33 Primary Cesarean delivery 22 VBAC Uncomplicated 34 VBAC All 23 Laparoscopic Cholecystectomy 24 Incidental appendectomy among elderly No No 25 Bi-lateral cardiac catheterization
Area-level Utilization Rates 26 CABG No 27 PTCA No 28 Hysterectomy 29 Laminectomy
Inpatient Quality Indicators (IQI) Software Instruction SAS
Inpatient Quality Indicators (IQI) 9 Version 43 (August 2011)
Note AAA = Abdominal Aortic Aneurysm CABG = Coronary Artery Bypass Graph PTCA = percutaneous transluminal coronary angioplasty AMI = Acute Myocardial Infarction CHF = Chronic Heart Failure GI = Gastrointestinal VBAC = Vaginal Birth After Cesarean a PTCA and carotid endarterectomy mortality are not recommended as stand-alone indicators but are suggested as companion measures to the corresponding volume measures Table 2 Prefixes for the inpatient quality indicator (IQI) variables
Prefix Contents
EXAMPLES Provider
indicator 8 Esophageal resection
Area-level indicator 26
CABG utilization T Inpatient numerator (top) TPIQ08 TAIQ26
P Population denominator (pop) PPIQ08 PAIQ26
Q POA flag QPIQ08 NA
O Observed rate (not applicable to IQI 1-7) OPIQ08 OAIQ26
E Expected rate EPIQ08 NA
R Risk-adjusted Rate (not applicable to IQI 1-7) RPIQ08 RAIQ26
L Lower limit of confidence interval of risk-adjusted rate LPIQ08 NA
U Upper limit of confidence interval of risk-adjusted rate UPIQ08 NA
S Smoothed rate SPIQ08 NA
X Standard error of smoothed rate XPIQ08 NA Table 3 Inpatient quality module contents
SAS programs ASCII text files CONTROL_IQISAS POP95T11TXT IQFMTSSAS COVIQA43TXT IQSAS1SAS MSXIQP43TXT IQSASP2SAS IQSASP3SAS MSXIQA43TXT IQSASA2SAS gee_piqxx_RegressionAnalysisGeecsv IQSASA3SAS
Prediction_PIQxxxml PRDIQP43TXT
contained in PSI_GEE_Inputzip
The ASCII text files are data files provided with the Inpatient Quality module and are necessary for the programs to run There is no need to convert these files to SAS format for use with the software Note that POP95T11TXT is available on the website as a separate download
Inpatient Quality Indicators (IQI) Software Instruction SAS
Inpatient Quality Indicators (IQI) 10 Version 43 (August 2011)
40 Background The Inpatient Quality Indicator module contains 32 indicators that reflect the quality of care
inside hospitals The six volume measures are intended to be paired with the corresponding mortality indicators These indicators serve to highlight potential quality concerns identify areas that need further study and investigation and track changes over time The indicators include three groups of measures based on hospital stays
1 There are six Volume indicators for inpatient procedures for which there is evidence that a higher volume of procedures is associated with lower mortality A nontrivial number of these procedures are performed by institutions that do not meet recommended volume thresholds The volume indicators are measured as counts of admissions in which particular procedures were performed
2 There are 15 Inpatient Mortality indicators for medical conditions and surgical
procedures that have been shown to have mortality rates that vary substantially across institutions and for which evidence suggests that high mortality may be associated with deficiencies in the quality of care These indicators are measured as rates the number of deaths divided by the number of admissions for the procedure or condition
Eight of these mortality indicators are for procedures six of which are also measured by a
volume indicator The other seven mortality indicators are associated with medical conditions 3 There are eleven Utilization indicators for procedures for which there are questions of
overuse underuse or misuse The procedures being examined are ones whose use varies significantly across hospitals and areas and for which high or low rates by itself does not represent poor quality of care rather the information is intended to inform consumers about local practice patterns
4 Seven of the utilization indicators are rates based on the hospitalized population Four
other utilization indicators are rates based on an arearsquos residential population Two of these area-level utilization indicators (IQI 26 CABG and IQI 2 PTCA) have counterparts in the set of volume indicators
For the four area-level utilization indicators geographic areas are defined at the users option in one of four ways
bull County level with US Census FIPS1 bull County level with modified FIPS bull Metro Area with OMB 1999 definition bull Metro Area with OMB 2003 definition
1 Federal Information Processing Standard as defined by the US Department of Commerce National Institute of Standards and Technology (formerly National Bureau of Standards)
Inpatient Quality Indicators (IQI) Software Instruction SAS
Inpatient Quality Indicators (IQI) 11 Version 43 (August 2011)
The MSALEVL parameter has been renamed to MALEVL to reflect the change in OMB definitions for areas Refer to page 14 for information on these area definitions and MALEVL parameter settings
The indicators in the IQI module are listed in Table 1 on page 8 See also the Inpatient
Quality Indicators Technical Specifications for the detailed definition of each indicator See Appendix A for links to these and other documents
The data required for measuring these indicators come from hospital discharge abstracts or billing claims (administrative data) which are readily available within hospitals or from many state data organizations The residential population data for the four area-level utilization indicators are from the US Census Bureau
The software generates observed expected risk-adjusted and smoothed rates for all indicators excluding IQI 21-25 IQI 33-34 Observed rates are the raw rates Risk-adjusted and expected rates are derived from applying the average case mix of a reference population file that reflects a large proportion of the US hospitalized or residential population When stratifications other than hospital or area are selected the RPIQxx variables and their confidence intervals are observedexpected ratios to avoid confounding with risk adjustment variables Smoothed rates are estimates with removal of fluctuations over time due to random variation
Inpatient Quality Indicators (IQI) Software Instruction SAS
Inpatient Quality Indicators (IQI) 12 Version 43 (August 2011)
50 Data Elements and Coding Conventions See Appendix C for a detailed description of the input data elements and coding conventions used by the SAS QI software
51 Input for the AHRQ Quality Indicators The IQI software was written to process data from discharge data abstracts that contain
information about hospital stays The IQI module was tested on data from the AHRQ Healthcare Cost and Utilization Project (HCUP) HCUP is an ongoing Federal-State-private collaboration to build uniform databases from administrative hospital-based data collected by State data organizations and hospital associations
The input data files for the Inpatient Quality Indicators software must be in SAS
It is strongly recommended that users recode data elements in their input files to be consistent with the coding expected by the software This step will minimize the number of internal changes that will be necessary in the IQI software For example recoding the SEX data element in the input file to be consistent with the coding described in Appendix C (ie 1 for male and 2 for female) is easier than modifying all uses of the Sex data element in the IQI programs
Not every value for every data element is referenced by the IQI software For example only two of the discharge disposition (DISP) data element values are used in the software (DISP value ldquo2rdquo for short-term hospital and value ldquo20rdquo for died in the hospital) However the complete set of standardized values is included based on HCUP specifications (see Appendix A) to assist users of the uniform HCUP data files
To minimize internal changes to the software all required elements should be present in the input data file If a required element is not available a dummy element should be provided Failure to provide a dummy element will result in errors during the execution of the IQI programs
The data elements listed in Appendix C are those required for the input files of all the SAS QI modules When a variable is not required for the program the notation ldquoNot used by the IQI programrdquo will be present in the Comments column Standardizing the variables and data values in the input data file will be helpful for users who have access to both statistical software packages as well as users working to standardize their input file specifications for use with any of the AHRQ QI software modules
Appendix C has been standardized to represent the input data file specifications required for use with any of the three QI modules (IQI PQI or PSI) If a specific variable is not used by the PQI program it is not necessary to create a dummy variable in the input data file For example the variable APR-DRG is used only by the IQI software so it is not necessary to have this data element in the input data file or create a dummy variable for the PQI software program to run correctly
Inpatient Quality Indicators (IQI) Software Instruction SAS
Inpatient Quality Indicators (IQI) 13 Version 43 (August 2011)
The data element HOSPSTCO has been renamed to PSTCO to emphasize the importance of
calculating the area-level IQI by the location of the patient residence If the user wants to calculate the area-level IQI based on the population of the Metro Area or county associated with the patient residence the values for this variable should be the FIPS statecounty code associated with each individual patientrsquos place of residence If the patient information is not available or the user wants to calculate the IQI using the population associated with the hospital location as the denominator the values for this variable should be the individual hospital FIPS statecounty codes
If the hospital FIPS code is used in PSTCO users should be aware that rates may be biased for hospitals which serve as regional referral centers These hospitals are likely to treat patients from outside the Metro Area county or even the state in which the facility is located
Users no longer have to use the Modified FIPS codes assignment for area denominators However that option is still available In the modified FIPS codes certain independent cities (Baltimore City Carson City and St Louis City) and areas within Hawaii and Virginia are assigned to different area groupings in the Modified FIPS categories
Using the patient FIPS statecounty code for analysis may more accurately reflect the true population at risk Using the hospital FIPS statecounty code for analysis should be done with caution and at larger levels of geographic area (ie Metropolitan Area) to minimize the bias with patients that come from a different county than the hospital location
It is possible that some records in the input data file may be missing the patient FIPS code Users should be aware that any records with missing values (in the PSTCO data field) are excluded from the calculations of observed risk-adjusted and smoothed IQI area-level rates They will be included in the output from the first program (IQSAS1SAS)
The software will generate area-level IQI rates for each county included in the PSTCO data field If using the hospital FIPS statecounty code for analysis users are encouraged to limit cases in their input file to those patients discharged from the geographic area of interest For example if you are using data from the state of Wisconsin and are interested in generating a rate for Wisconsin you should remove the cases where the patientrsquos county of residence (FIPS code) is from another state Otherwise the total or overall rate will include the population at risk from the counties outside Wisconsin
The software provides the user with the option of producing output by Metro Area or by
county When Metro Area is selected urban areas are always defined by Metro Areas When
Inpatient Quality Indicators (IQI) Software Instruction SAS
Inpatient Quality Indicators (IQI) 14 Version 43 (August 2011)
county is selected urban areas will be defined by county Rural areas are always defined by county
In the software programs the MALEVL parameter should be set as follows 0-County level with US Census FIPS 1-County level with modified FIPS 2-Metro Area with OMB 1999 definition 3-Metro Area with OMB 2003 definition
The metropolitan area definitions are from three different sources 1) The ldquomodified FIPSrdquo
definition is from the Area Resource File The mapping is from county to modified FIPS county (eg Baltimore city to Baltimore county) 2) The ldquo1999 OMBrdquo definition is from the federal Office of Management and Budget (OMB) circular 99-04 (Last Revised May 6 2002) The mapping is from county to Metropolitan Statistical Area (MSA) except in New England where counties are assigned to New England County Metropolitan Area (NECMAs) OMB defines NECMAs as a county-based alternative to the city- and town-based New England MSAs and Consolidated MSAs (CMSAs) For example Hampden and Hampshire counties in Western Massachusetts are assigned to the Springfield MA NECMA even though Holland town in Hampden County is part of the Boston MSA and 3) The ldquo2003 OMBrdquo definition is from the federal OMB circular 03-04 (Last Revised December 4 2005) The mapping is from county to either Metropolitan Statistical Area or Micropolitan Statistical Area
52 Coding of Diagnoses Procedures and DRGs Diagnoses and procedures must be coded using the International Classification of Diseases 9th Revision Clinical Modification (ICD-9-CM)
Significant modifications to ICD-9-CM codes occurred in the early 1990s IQI definitions only reflect codes valid on and after October 1 1994 so they may not accurately analyze data collected before October 1994
bull Diagnosis and procedure codes should be in character strings
bull Diagnosis and procedure codes should not contain any decimal points
bull Diagnosis and procedure codes should be left justified Diagnosis codes with fewer than five digits should be padded with spaces (not zeros) on the right Procedure codes with fewer than four digits should be padded with spaces (not zeros) on the right
The IQI programs assume accurate and specific coding of ICD codes If an ICD code is specified using 5 digits the software recognizes only 5-digit versions of that code and not versions truncated at 3 or 4 digits Similarly if an ICD code is specified using 4 digits the software recognizes only 4 digit versions of that code and not versions truncated at 3 digits For example 4281 is the ICD-9-CM diagnosis code for left heart failure If your data are coded less specifically (ie 428 is used to designate ldquoheart
Inpatient Quality Indicators (IQI) Software Instruction SAS
Inpatient Quality Indicators (IQI) 15 Version 43 (August 2011)
failurerdquo) these less specific codes are not recognized by the software and will result in undercounting cases
bull Diagnosis-related groups (DRGs) are those derived from the Centers for Medicare amp Medicaid Services (previously Health Care Financing Administration) Medicare grouper The software expects that you will be using the DRG effective on the discharge date The software now refers to data elements DRG and MDC Your data should be coded accordingly The software may be modified at the userrsquos option to use other types of DRGs However the impact of using other types of DRGs should be evaluated carefully before making such a change
Version 43 of the software accounts for ICD-9-CM and DRG coding effective through FY2011 (through September 30 2011)
53 APR-DRG Variables
It is recommended that users either use their own 3Mreg APRreg DRG Grouper software or download and run the 3Mreg APRreg DRG Limited License Grouper for SASreg software on their patient data before running the IQI SAS programs The Limited License Grouper software is available on the AHRQ Inpatient Quality Indicators download page (see Appendix A for link)
The Grouper software creates APR-DRG categories and associated risk of mortality data elements These APR-DRG variables are used to enhance the risk-adjustment of selected IQI provider indicators
APR-DRG software must be downloaded and run separately
Users who wish to use APR-DRG results to risk-adjust the provider IQI rates should run the APR-DRG software on their patient data before running the IQI programs
The data elements in the AHRQ QI are based on the coding specifications used in the State
Inpatient Databases (SID) in the Healthcare Cost and Utilization Project (HCUP) The SID coding specifications are similar to the Uniform Bill (UB-04) but not identical For data elements used in the AHRQ QI crosswalks between the SID and UB-04 coding specifications are included in the SID documentation available at httphcup-usahrqgovdbstatesiddbdocumentationjsp
54 Missing Values
The IQI programs do not distinguish among different types of missing values
Cases that are missing data in fields used for indicator definitions or for risk adjustment (such as age and sex) will be excluded from analysis
Data files of hospital discharge abstract data may have numeric data elements coded using
special SAS missing ldquodotrdquo values For example besides the standard SAS value of ldquordquo For missing data there might also be present values of ldquoArdquo for invalid data ldquoBrdquo for data
Inpatient Quality Indicators (IQI) Software Instruction SAS
Inpatient Quality Indicators (IQI) 16 Version 43 (August 2011)
unavailable from a particular source ldquoCrdquo for inconsistent data However the IQI programs do not distinguish among the different types of missing codes Therefore all types of missing values in the input data to the IQI module must be represented by a single value ndash missing data () for numeric variables and blank (lsquo lsquo) for alphanumeric (or character) variables
55 Treatment of Missing Data The software is designed to handle missing data in a particular manner specifically the
software requires confirmation for the assignment of a poor outcome or negative event For instance in order to be assigned as a death each case must actually be coded as a death Missing data are considered neutral Missing data for some elements results in the exclusion of that case from the denominator For a few other elements the case is retained
Inpatient Quality Indicators (IQI) Software Instruction SAS
Inpatient Quality Indicators (IQI) 17 Version 43 (August 2011)
Table 4 lists the impact of missing data for each data element Table 4 Treatment of missing data elements
Variable Label D N E S Treatment of Missing Data
AGE Age In Years At Admission
X X X Case excluded from all analysis (eg dropped from the denominator of the discharge based indicators and from numerator of all population based measures)
ASOURCE Admission Source X Case excluded from denominator where used in specification (eg IQI- 32)
DISP Disposition Status X X Case excluded from denominator where used in specification (eg IQI-15)
DQTR Discharge Quarter X X X X Case excluded from all analysis (eg dropped from the denominator of the discharge based indicators and from numerator of all population based measures)
DX1 Principal Diagnosis Code
x x x x Record excluded from analysis
Sex Patient Gender X X X Case excluded from all analysis (eg dropped from the denominator of the discharge based indicators and from numerator of all population based measures)
PAY 1 Payer x Classified As ldquoOtherrdquo POINTOFORIGINUB04 Point of Origin x x Missing values of
POINTOFORIGINUB04 result in a case being excluded from the denominator for IQI 32 (along with ASOURCE)
PSTCO Location of Patient Residence or Hospital Location Modified FIPS StateCounty Code
X Dropped from denominator in rate calculations (stratified by county or Metro Area) case will appear in calculation of the overall rate
RACE Race X Classified As ldquoOtherrdquo YEAR Discharge Year X X X X Case excluded from all analysis (eg
dropped from the denominator of the discharge based indicators and from numerator of all population based measures)
Note D = Denominator N = Numerator E = Exclusion S = Stratification
Inpatient Quality Indicators (IQI) Software Instruction SAS
Inpatient Quality Indicators (IQI) 18 Version 43 (August 2011)
60 User Options The IQI software reflects the development and implementation of the software with
discharge data available to AHRQ through the HCUP program The goal was to develop the tools illustrate their use and then encourage others to adopt and use the tools for their own applications As a result users are encouraged to consider how AHRQ may modify or enhance the IQI software to better serve their measurement needs and interests
Modifications to the definitions of outcomes of interest (numerators) or populations at risk (denominators) are possible but not desirable Maintaining consistent definitions is important Once definitions are altered the ability to make comparisons of IQI based on original definitions is lost Users are encouraged to identify ways to improve the IQI methodology and to share their suggestions with AHRQ for future updates
AHRQ provides public access to HCUPnet (httphcupnetahrqgov)- an interactive tool for
identifying tracking analyzing and comparing statistics on hospital care HCUPnet queries generate statistics in a table format using data from the Nationwide Inpatient Sample (NIS) and State Inpatient Databases (SID) for those States that have agreed to participate HCUPnet includes statistics based on the AHRQ Quality Indicators (QIs) which have been applied to the HCUP NIS If users change definitions of the IQI it will not be possible to compare usersrsquo results to the national estimates in HCUPnet
Inpatient Quality Indicators (IQI) Software Instruction SAS
Inpatient Quality Indicators (IQI) 19 Version 43 (August 2011)
70 Producing Inpatient Quality Indicator Rates Processing Steps
Each Inpatient Quality Indicator (IQI) expressed as a rate is simply defined as
Outcome of interest Population at risk
[or]
Numerator Denominator
Conceptually five steps are necessary to produce the IQI rates The following describes the steps and how the software performs them
71 Step 1 Identify Outcomes in Inpatient Records Inpatient records are marked to indicate whether they contain the outcome of interest
(numerator or ldquoTrdquo for ldquotoprdquo) for each of the AHRQ IQI measures Records are marked by setting a series of flag variables each of which corresponds to the
numerator for a particular IQI For example if the inpatient record meets the conditions for inclusion in the outcome for IQI- 01 then the outcome indicator for IQI- 01 is set to one
This step requires one pass through the discharge-level data and outputs a discharge-level data file containing the flag indicator variables for the outcomes for each IQI This output file also contains the original input variables with the exception of the diagnosis and procedure variables which have been removed to reduce the size of the output file
The first six Inpatient Quality Indicators are volume measures and for these QIs this first step is all that is necessary The remaining steps two though five are relevant for the remaining indicators which are rates as opposed to total volume measures
72 Step 2 Identify Populations at Risk
For the Provider IQI the populations at risk (the denominators for calculating the IQI rates or ldquopoprdquo) are derived from the hospital discharge records
For the four Area-level IQI the populations at risk (the denominators for calculating the IQI rates) are derived from US Census population figures
73 Step 3 Calculate Observed (raw) Inpatient Quality Indicator rates
Using the output data from step 1 and either hospital discharge or US Census population
data from step 2 the IQI rates are calculated for user-specified combinations of stratifiers These stratifiers include hospitals age groups raceethnicity categories sex and payer categories for the Provider IQI and areas (Metro Areascounties) age groups raceethnicity categories and sex for the Area-level IQI
Inpatient Quality Indicators (IQI) Software Instruction SAS
Inpatient Quality Indicators (IQI) 20 Version 43 (August 2011)
The programs calculate observed IQI rates regardless of the number of cases available However IQI rates based on only a few cases should be interpreted with caution
In some performance measurement work it is often recommended that rates be suppressed
when there are fewer than 30 cases in the denominator This exclusion rule serves two purposes
bull It eliminates unstable estimates based on too few cases
bull It helps protect the identities of hospitals and patients
This step outputs the observed rates for user-specified categories alone or in combination For example Provider IQI observed rates could be output at the hospital level at the payer level or at the hospital level by payer
74 Step 4 Risk-adjust the Inpatient Quality Indicator Rates
Regression coefficients from a reference population database (reflecting a large proportion of the US population) are applied to the observed rates in the risk-adjustment process These reference population file regression coefficients are provided as part of the Generalized Estimating Equation GEE routines included with IQI module The risk-adjusted rates will then reflect the age and sex distribution (and the APR-DRG distribution for the provider indicators) of data in the reference population file rather than the distribution for the hospitals or areas present in the usersrsquo data This approach will allow risk-adjusted rates produced by various users to be compared directly to one another
The programs calculate risk-adjusted IQI rates regardless of the number of cases available (however a minimum of 3) However IQI rates based on only a few cases should be interpreted with caution
75 Step 5 Create MSX Smoothed Rates
Shrinkage factors are applied to the risk-adjusted rates for each IQI in a process called multivariate signal extraction (MSX) For each IQI the shrinkage estimate reflects a lsquoreliability adjustmentrsquo unique to each indicator The less reliable the IQI is over time and across hospitals or areas the more the estimate lsquoshrinksrsquo the IQI toward the overall area mean The resulting rate will appear ldquosmootherrdquo than the raw rate meaning the year-to-year fluctuations in performance are likely to be reduced The shrinkage factors are provided as part of the IQI software and do not need to be calculated by users
These five steps reflect the IQI module production in a nutshell The next section of this document describes the specifics of each software component of the IQI module software
Inpatient Quality Indicators (IQI) Software Instruction SAS
Inpatient Quality Indicators (IQI) 21 Version 43 (August 2011)
80 Program Descriptions This section describes the seven SAS programs that assign calculate and print the Inpatient
Quality Indicators For each program there is a description a list of input and output files and an explanation of
changes to the program that may be required The flow of data through the IQI module programs is shown in the flowcharts in Figure 1 and Figure 2 that begin on page 6
If you desire to create and examine observed IQI rates then the CONTROL_IQI IQFMTS and the IQSAS1 programs will need to be used followed by IQSASP2 (for Provider observed rates and volume indicators) andor IQSASA2 (for Area observed rates) If you also wish to create risk-adjusted and smoothed IQI rates then you will also need to run the IQSASP3 andor the IQSASA3 program
81 Program 1 Modify Statements in the CONTROL_IQISAS Code
The CONTROL_IQISAS code contains all of the SAS statements that you need to modify in order to run the remaining IQI module programs (with one exception noted below) This location is where you specify for example the path names or locations of all your input and output data sets There is also a TITLE line that the user can fill in The items that need to be changed in order to run the IQSAS1 IQSASP2 IQSASP3 IQSASA2 and IQSASA3 programs are described below each program
The CONTROL_IQISAS code is automatically inserted into the remaining programs when they are executed You do not need to run CONTROL_IQISAS as a separate program
All of the changes needed for the CONTROL_IQISAS code are listed in the following descriptions for programs 2 ndash 7 Each program description contains a section labeled ldquoChangesrdquo that enumerates the modifications for CONTROL_IQISAS that are associated with that particular program
Lines of code to be modified are identified by the phrase ldquolt===USER MUST modifyrdquo which means the user must make the change or by ldquolt===USER MAY modifyrdquo which means the modification is optional
In all of the remaining programs included with the IQI module there is one line of code near
the beginning of each program that needs to be modified This line of code starts with the phrase ldquoFILENAME CONTROLrdquo You must modify this line to point to the path name where you stored your modified copy of the CONTROL_IQISAS file Pathnames should not exceed 255 characters in length
CONTROL_IQISAS has a collection of parameters that allow you to read in data from different locations or pathnames and write out data to different locations or pathnames For example ldquoLIBNAME IN0rdquo points to the location of your input data set for program IQSAS1 and ldquoLIBNAME OUT1rdquo points to the location of the output data set created by the IQSAS1 program
Inpatient Quality Indicators (IQI) Software Instruction SAS
Inpatient Quality Indicators (IQI) 22 Version 43 (August 2011)
The parameters allow these locations to be different from one another However if you wish to read in and write out all of the data to the same location it is easiest to just make a global change in CONTROL_IQISAS changing ldquoCpathnamerdquo to the single directory location that you wish to use
There is a global PRINT parameter in CONTROL_IQISAS that as a default prints all of the output summary records at the end of the IQSASP2 IQSASP3 IQSASA2 and IQSASA3 programs These printouts may be quite large if you have a large database with a large number of hospitals and if you choose the results to be finely stratified If you wish to turn this feature off set PRINT to have a value of zero in CONTROL_IQISAS to turn this feature on set PRINT to have a value of 1
The global MALEVL parameter in CONTROL_IQISAS by default instructs all programs to define geographic areas by county for all areas in the input datasets Refer to Page 14 for a list of values for the MALEVL parameter
82 Program 2 Run IQFMTS
The IQFMTS program defines a format library which contains the diagnosis and procedure screens necessary for assigning the outcomes of interest This format library is used by most of the succeeding programs
The first few formats in this program are for the stratifiers (ie age sex raceethnicity and payer) These are followed by formats that are used for the identification of outcomes of interest in the IQSAS1 program and by formats that map FIPS county codes to Metro Areas in the IQSAS1 IQSASA2 and IQSASA3 programs At the end of the program are formats used to assign age categories for the risk adjustment process implemented in IQSASP3 and IQSASA3 and formats used with APR-DRG categories in IQSASP3 Input None Output Permanent SAS format library (FMTLIB) Changes
1 You must modify the ldquoFILENAME CONTROLrdquo statement at the beginning of the program to change the path so it points to your location of the CONTROL_IQISAS code
2 In CONTROL_IQISAS specify the location (path) of the format library in the
ldquoLIBNAME LIBRARYrdquo statement
83 Program 3 Run IQSAS1 The IQSAS1 program processes hospital discharge abstract data and flags inpatient records if
they contain outcomes of interest Outcome indicator names or numerators have prefix of ldquoTrdquo (Top) Stratifier variables are constructed at the beginning of the program
Inpatient Quality Indicators (IQI) Software Instruction SAS
Inpatient Quality Indicators (IQI) 23 Version 43 (August 2011)
This program assumes that the input data file (consisting of inpatient discharge abstract data) conforms to specific variable names attributes and coding conventions See Table 2 on page 9 for variable names and attributes for the input data file
Partial definitions of the Inpatient Quality Indicators are given in Table 1 on page 8 This table is presented to assist those individuals who desire to examine the software source code statements Complete definitions of the indicators are given in the document Inpatient Quality Indicators Technical Specifications (httpwwwqualityindicatorsahrqgovModulesiqi_overviewaspx) Input
1 User supplied SAS inpatient data set consisting of administrative hospital discharge abstract data This data set is a discharge level file with an array of diagnosis and procedure codes among other data elements
2 SAS format library (FMTLIB) created from the IQFMT program
Output
1 SAS dataset containing inpatient records with input variables stratifiers and flag indicators (TPIQxx and TAIQxx) for the outcomes of interest that will later form the numerators for the IQI rates
2 PROC MEANS (with N NMISS MIN MAX MEAN and SUM) of all of the
numeric variables in the output data file and a PROC CONTENTS of the output data file are output to hardcopy
3 A PROC PRINT of the first 24 observations in the output data file is output to
hardcopy Changes
1 The ldquoFILENAME CONTROLrdquo statement at the beginning of the program must be changed to reflect the location of the CONTROL_IQISAS code
2 In CONTROL_IQISAS specify the locations (paths) of the input and output files in
the ldquoLIBNAME IN0rdquo and ldquoLIBNAME OUT1rdquo statements
3 In CONTROL_IQISAS specify the names of the input and output files in the ldquoINFILE0rdquo and ldquoOUTFILE1rdquo statements
4 To define urban areas by Metro Area rather than by county change the MALEVL
parameter in CONTROL_IQISAS from 0 to 1 2 or 3 Rural areas will be defined by county no matter how MALEVL is specified Refer to page 14 for a list of values for the MALEVL parameter
5 The IQI module assumes that your starting SAS data set contains 30 diagnoses
and 30 procedures If these numbers are different in your input inpatient data then modify the NDX and NPR parameters in CONTROL_IQISAS
Inpatient Quality Indicators (IQI) Software Instruction SAS
Inpatient Quality Indicators (IQI) 24 Version 43 (August 2011)
If your variables are named differently from those used in the IQI software (see Table 1 on page 8) you MUST either rename those variables prior to running this program or modify IQSAS1 to include the renaming of your variables to match those expected by the software Similarly if your variables are not the same type ie character or numeric as those expected by the software (see Table 1) you MUST modify your variables prior to running this program
6 If you wish to use APR-DRG variables in the later IQSASP3 program to risk-adjust
the provider indicators then in CONTROL_IQISAS set the APRDRGFG flag parameter to one If you do not intend to run IQSASP3 to risk-adjust the provider indicators or if you do not have the APR-DRG variables available to you then set APRDRGFG to zero See Table 5 below
7 If you wish to risk-adjust the provider indicators by later running the IQSASP3
program then in CONTROL_IQISAS set the three APRDRG APRDRG_RISK_MORTALITY and XPRDRG_RISK_MORTALITY parameters to be the names of the DRG category variable and the mortality indicators created by APR-DRG software If you do not intend to use APR-DRG software then set the three APRDRG APRDRG_RISK_MORTALITY and XPRDRG_RISK_MORTALITY parameters to equal zero See Table 5 below
Table 5 How to set up IQI parameters and your data for using APR-DRG variables
If you do not intend to risk-
adjust the provider
indicators
If you are going to run IQSASP3 to risk adjust the provider indicators
If you have APR-DRG software available
If you do not have APR-DRG software
available
Preliminary data processing None
Run APR-DRG software to create APR-DRGs
and mortality indicators None
Setting the APRDRGFG parameter in
CONTROL_IQISAS Set to equal zero Set to equal one Set to equal zero
Setting the APR_DRG APRDRG_RISK_MORTAL
ITY and XPRDRG_RISK_MORTAL
ITY parameters in CONTROL_IQISAS
No action required
Set to equal the names of the variables output
from the APR-DRG software
Set to equal zero
84 Program 4 Run IQSASP2
For all but the volume indicators (IQI 01-07) the IQSASP2 program calculates the observed or raw rates for the provider-level Inpatient Quality Indicators using the data derived in a previous step (IQSAS1) These observed rates are stratified by combinations of providers sex age race and payer categories The program first totals the indicator flags created by the
Inpatient Quality Indicators (IQI) Software Instruction SAS
Inpatient Quality Indicators (IQI) 25 Version 43 (August 2011)
IQSAS1 program and then for each of the desired stratifiers divides these totals by the hospital discharges in the universe for the indicator The population denominators are stored in variables with names that have a prefix of ldquoPrdquo (Pop) The Observed rates are stored in variables that have a prefix of ldquoOrdquo Input
1 The SAS dataset that was created in the IQSAS1 This dataset is a discharge-level file that contains inpatient records with input variables stratifiers and the 30 flag indicators for the IQI Provider outcomes of interest
2 SAS format library (FMTLIB) created from the IQFMT program
Output
1 SAS dataset with summary records that contain observed rates (OPIQxx variables where lsquoxxrsquo refers to the indicator number) the counts of outcomes that formed the numerators of the rates (TPIQxx variables) and the hospital discharge totals that formed the denominators of the observed rates (PPIQxx variables) It also includes variables indentifying present on admission (POA) and conditions for provider based outcomes of interest (QPQIxx) The output file has records summarized to the various combinations of stratifiers specified in the TYPELVLP parameter that is described in item number 4 in the ldquoChangesrdquo section below Note that the observed rates and the denominator totals are not generated for the Provider volume indicators (IQI 01-07)
2 An optional ASCII (comma delimited) text file that the user can then import into a
spreadsheet This text file contains the same information as the SAS output dataset The text file will contain the OPIQxx observed rates the TPIQxx counts of outcomes that formed the numerators of the rates and the PPIQxx counts of outcomes that formed the denominators of the rates The different recordsrows in the text file will correspond to the different TYPELVLP stratification combinations
3 A PROC MEANS (with N NMISS MIN MAX MEAN and SUM) of the provider-
level summary records that shows statistics for the OPIQxx observed rates the TPIQxx counts of outcomes that formed the numerators of the rates and the PPIQxx counts of outcomes that formed the denominators of the rates These means will only be generated if the user included a value of 16 for the TYPELVLP parameter discussed in item 4 in the ldquoChangesrdquo section below
4 A PROC CONTENTS of the output SAS summary dataset is output to hardcopy
5 A PROC PRINT of the output summary dataset is provided at the end of the hardcopy
printout This printout may be quite large depending on the number and the types of stratifications that the user requests with the TYPELVLP parameter discussed in item number 4 in the ldquoChangesrdquo section below If the user does not wish to generate this printout then the global ldquoPRINTrdquo parameter in CONTROL_IQISAS code should be set to zero
Inpatient Quality Indicators (IQI) Software Instruction SAS
Inpatient Quality Indicators (IQI) 26 Version 43 (August 2011)
Changes 1 The ldquoFILENAME CONTROLrdquo statement at the beginning of the program must be
changed to reflect the location of the CONTROL_IQISAS code 2 In CONTROL_IQISAS specify the locations (paths) of the input and output SAS
files in the ldquoLIBNAME INP2rdquo and ldquoLIBNAME OUTP2rdquo statements
3 In CONTROL_IQISAS specify the names of the input and output files in the ldquoINFILE1rdquo and ldquoOUTFILP2rdquo statements The name that you specify with INFILE1 should be for the file that you created using the IQSAS1 program
4 In CONTROL_IQISAS specify the levels of aggregation for the observed rates This
step is done by specifying numbers between 0 and 31 in the ldquoLET TYPELVLP =rdquo statement Each number from 0 to 31 corresponds to a different level or combination of levels as shown in Table 6 The default values of 0 16 will provide an overall total and provider-level totals
If TYPELVLP includes the value 0 then the first observation in the output summary data file will contain the overall totals and observed rates for the entire database created with the IQSAS1 program
5 In CONTROL_IQISAS if you wish to create an ASCII (comma delimited) text file that you can import into a spreadsheet then set the TEXTP2 parameter to 1 Otherwise the default value of zero for TEXTP2 will skip around the code that would generate this file
6 In CONTROL_IQISAS if you wish to create an ASCII (comma delimited) text file
that you can import into a spreadsheet then specify the path (including the file name) for this ASCII text file in the FILENAME IQTEXTP2rdquo statement
Inpatient Quality Indicators (IQI) Software Instruction SAS
Inpatient Quality Indicators (IQI) 27 Version 43 (August 2011)
Table 6 IQSASP2 Aggregation Possibilities
TYPELVLP Stratification 0 Overall 1 Race 2 Payer 3 Payer Race 4 Sex 5 Sex Race 6 Sex Payer 7 Sex Payer Race 8 Age 9 Age Race 10 Age Payer 11 Age Payer Race 12 Age Sex 13 Age Sex Race 14 Age Sex Payer 15 Age Sex Payer Race 16 Provider 17 Provider Race 18 Provider Payer 19 Provider Payer Race 20 Provider Sex 21 Provider Sex Race 22 Provider Sex Payer 23 Provider Sex Payer Race 24 Provider Age 25 Provider Age Race 26 Provider Age Payer 27 Provider Age Payer Race 28 Provider Age Sex 29 Provider Age Sex Race 30 Provider Age Sex Payer 31 Provider Age Sex Payer Race
0 and 16 TYPELVLP (overall and provider) are default values for the level of computation in the software
For example if you are using a state inpatient hospital database you might specify the following TYPELVLP values
0 ndash provides overall rates for your entire state 8 ndash provides overall rates for your state broken down by age groups 16 ndash provides rates for providers within your state 24 ndash provides rates for age groups within these providers
85 Program 5 Run IQSASP3
The IQSASP3 program calculates risk-adjusted rates by patient age sex and APR-DRG if available for each IQI and then calculates smoothed rates The risk-adjusted and smoothed rates are not calculated for the Provider volume indicators IQI 01-07 just as observed rates were not calculated for these indicators
Inpatient Quality Indicators (IQI) Software Instruction SAS
Inpatient Quality Indicators (IQI) 28 Version 43 (August 2011)
The programs calculate risk-adjusted IQI rates regardless of the number of cases available However IQI rates based on only a few cases should be interpreted with caution
The output file has records summarized to the various combinations of stratifiers that were specified in the TYPELVLP parameter of the preceding IQSASP2 program See Table 6 on page 27 Input
1 SAS format library (FMTLIB) created from the IQFMT program 2 The discharge-level file that was created with the IQSAS1 program
3 The SAS dataset with summary records that was created with the IQSASP2 program 4 A text file containing regression coefficients from a regression that was run on a
reference SID dataset These coefficients will be used in the risk-adjustment process Two files are provided as part of the IQI module Gee_piqxx_RegressionAnalysisGeecsv contains the regression coefficients Prediction_PIQxxxml contains the input parameters for the executable AHRQexe
Users must create a directory ldquoCAHRQQI AHRQPredictionrdquo and copy the
executable AHRQexe to that directory (along with 5 other files) Users must also create a directory ldquoCAHRQQIIQIrdquo and copy the zip file IQI_GEE_Input_Fileszip to that directory Extract all of the files from IQI_GEE_Input_Fileszip into the directory ldquoCAHRQQIIQIrdquo (See version 43 introduction on page 1)
5 A text file containing three arrays for use in the smoothing process The arrays
contain noise estimates signal estimates and mean area rates for each IQI Specify file MSXIQP42TXT The text file does not need to be converted to a SAS file for use with the software
Output
1 A SAS dataset with an overall summary record and with provider-level summary records that contain the three types of indicator rates along with the components of the initial raw rates Specifically the file contains the observed rates (OPIQxx variables) the risk-adjusted rates (RPIQxx variables) the smoothed rates (SPIQxx variables) the expected rates (EPIQxx variables) the counts of outcomes that formed the numerators of the observed rates (TPIQxx variables) and the hospital discharge totals that formed the denominators of the observed rates (PPIQxx variables) When stratifications other than hospital are selected the RPIQxx variables and their confidence intervals are observedexpected ratios to avoid confounding with risk-adjustment variables
2 An optional ASCII (comma delimited) text file that the user can then import into a
spreadsheet This text file contains the same information as the SAS output dataset
Inpatient Quality Indicators (IQI) Software Instruction SAS
Inpatient Quality Indicators (IQI) 29 Version 43 (August 2011)
The text file will contain the OPIQxx observed rates and their TPIQxx and PPIQxx numerator and denominator components the RPIQxx risk-adjusted rates the SPIQxx smoothed rates and the EPIQxx expected rates Each record or row in the text file will correspond to a specification group
3 A PROC MEANS (with N NMISS MIN MAX MEAN and SUM) of the provider-
level summary records that shows statistics for the observed risk-adjusted and smoothed rates and statistics for the counts of outcomes that formed the numerators and denominators of the observed rates These means will only be generated if the user included a value of 16 for the TYPELVLP parameter of the preceding IQSASP2 program (see Table 6 on page 27)
4 A PROC CONTENTS of the output SAS summary dataset is output to hardcopy
5 A PROC PRINT of the output summary dataset is provided at the end of the hardcopy
printout This printout may be quite large depending on the number and the types of stratifications that the user requested with the TYPELVLP parameter of the preceding IQSASP2 program (see Table 6 on page 27) If the user does not wish to generate this printout then the global ldquoPRINTrdquo parameter in CONTROL_IQISAS code should be set to zero
Changes
1 The ldquoFILENAME CONTROLrdquo statement at the beginning of the program must be changed to reflect the location of the CONTROL_IQISAS code
2 In CONTROL_IQISAS specify the locations (paths) of the input and output SAS
files in the ldquoLIBNAME INP3rdquo and ldquoLIBNAME OUTP3rdquo statements
3 In CONTROL_IQISAS specify in the ldquoINFILE1rdquo statement the name of the discharge-level file that you created with the IQSAS1 program
4 In CONTROL_IQISAS specify in the ldquoFILENAME MSXPrdquo statement the path
(including the file name) for the ASCII text file that contains the estimates to smooth the indicator rates Specify file MSXIQP42TXT
5 In CONTROL_IQISAS specify in the ldquoINFILEP2rdquo statement the name of the
summary file that you created with the IQSASA2 program
6 In CONTROL_IQISAS specify in the ldquoOUTFILP3rdquo statement the name that you wish the output file to have
7 In CONTROL_IQISAS if you wish to create an ASCII (comma delimited) text file
that you can import into a spreadsheet then set the TEXTP3 parameter to 1 Otherwise the default value of zero for TEXTA3 will skip the code that would generate this file
Inpatient Quality Indicators (IQI) Software Instruction SAS
Inpatient Quality Indicators (IQI) 30 Version 43 (August 2011)
8 In CONTROL_IQISAS if you wish to create an ASCII (comma delimited) text file that you can import into a spreadsheet then specify the path (including the file name) for this ASCII text file in the ldquoFILENAME IQTEXTP3rdquo statement
86 Program 6 Run IQSASA2
The IQSASA2 program calculates the observed or raw rates for the area-level Inpatient Quality Indicators using the data derived in a previous step (IQSAS1) These observed rates can be stratified by combinations of area sex age and race categories The program first totals the four area indicator flags created by the IQSAS1 program and then for each of the desired stratifiers divides these totals by the pertinent residential population The population denominators are stored in variables with names that have a prefix of ldquoPrdquo (Pop) The Observed rates are stored in variables that have a prefix of ldquoOrdquo Input
1 The SAS dataset that was created in the IQSAS1 This dataset is a discharge-level file that contains inpatient records with input variables stratifiers and the four new flag indicators for the IQI Area-level outcomes of interest
2 A text file with Census area residential populations stratified by area age sex and
ethnicity categories The file POP95T11TXT is currently provided on the website as a separate download The user should set POPYEAR to the year that best matches the userrsquos discharge data file
Users do not need to convert the ASCII text file to a SAS dataset for use with the software
3 SAS format library (FMTLIB) created from the IQFMT program
Output
1 SAS dataset with summary records that contain observed rates (OAIQxx variables where xx refers to the indicator number) the counts of outcomes that formed the numerators of the rates (TAIQxx variables) and the residential population totals that formed the denominators of the observed rates (PAIQxx variables) The output file has records summarized to the various combinations of stratifiers specified in the TYPELVLA parameter that is described in item number 5 in the ldquoChangesrdquo section below
2 An optional ASCII (comma delimited) text file that the user can then import into a
spreadsheet This text file contains the same information as the SAS output dataset The text file will contain the OAIQxx observed rates the TAIQxx counts of outcomes that formed the numerators of the rates and the PAIQxx residential population totals The different recordsrows in the text file will correspond to the different TYPELVLA stratification combinations
Inpatient Quality Indicators (IQI) Software Instruction SAS
Inpatient Quality Indicators (IQI) 31 Version 43 (August 2011)
3 A PROC MEANS (with N NMISS MIN MAX MEAN and SUM) of the area-level summary records that shows statistics for the OAIQxx observed rates the TAIQxx counts of outcomes that formed the numerators of the rates and the PAIQxx residential populations totals These means will only be generated if the user included a value of 8 for the TYPELVLA parameter discussed in item number 5 in the ldquoChangesrdquo section below
4 A PROC CONTENTS of the output SAS summary dataset is output to hardcopy
5 A PROC PRINT of the output summary dataset is provided at the end of the hardcopy
printout This printout may be quite large depending on the number and the types of stratifications that the user requests with the TYPELVLA parameter discussed in item number 5 in the ldquoChangesrdquo section below If the user does not wish to generate this printout then the global ldquoPRINTrdquo parameter in CONTROL_IQISAS code should be set to zero
Changes
1 The ldquoFILENAME CONTROLrdquo statement at the beginning of the program must be changed to reflect the location of the CONTROL_IQISAS code
2 In CONTROL_IQISAS specify the locations (paths) of the input and output SAS
files in the ldquoLIBNAME INA2rdquo and ldquoLIBNAME OUTA2rdquo statements
3 In CONTROL_IQISAS specify the names of the input and output files in the ldquoINFILE1rdquo and ldquoOUTFILA2rdquo statements The name that you specify with INFILE1 should be for the file that you created using the IQSAS1 program
4 In CONTROL_IQISAS specify the path (including the file name) for the ASCII
population text file in the ldquoFILENAME POPFILE statement The file name will be POP95T11TXT The user should set POPYEAR to the year that best matches the userrsquos discharge data file
5 In CONTROL_IQISAS specify the levels of aggregation for the observed rates This
change is done by specifying numbers between 0 and 15 in the ldquoLET TYPELVLA =rdquo statement Each number from 0 to 15 corresponds to a different level or combination of levels as shown in
Inpatient Quality Indicators (IQI) Software Instruction SAS
Inpatient Quality Indicators (IQI) 32 Version 43 (August 2011)
6 Table 7 The default values of 0 (overall) and 8 (area) will provide an overall total and area-level totals
WARNING TYPELVLA must include the values 0 (overall) and 8 (area) if you wish to subsequently run program IQSASA3 for risk-adjusted and smoothed rates
If TYPELVLA includes the value 0 (overall) then the first observation in the output summary data file will contain the overall totals and observed rates for the entire database created with the IQSAS1 program
Table 7 IQSASA2 aggregation possibilities
TYPELVLA Stratification 0 Overall 1 Race 2 Sex 3 Sex Race 4 Age 5 Age Race 6 Age Sex 7 Age Sex Race 8 Area 9 Area Race 10 Area Sex 11 Area Sex Race 12 Area Age 13 Area Age Race 14 Area Age Sex 15 Area Age Sex Race
0 (overall) and 8 (are) TYPELVLA are default values for the level of computation in the software
For example if you are using a state inpatient hospital database you might specify the following TYPELVLA values
0 ndash provides overall rates for your entire state 4 ndash provides overall rates for your state broken down by age groups 8 ndash provides rates for areas within your state 12 ndash provides rates for age groups within these areas
7 In CONTROL_IQISAS if you wish to create an ASCII (comma delimited) text file
that you can import into a spreadsheet then set the TEXTA2 parameter to 1 Otherwise the default value of zero for TEXTA2 will skip the code that would generate this file
8 In CONTROL_IQISAS if you wish to create an ASCII (comma delimited) text file
that you can import into a spreadsheet then specify the path (including the file name) for this ASCII text file in the ldquoFILENAME IQTEXTA2rdquo statement
Inpatient Quality Indicators (IQI) Software Instruction SAS
Inpatient Quality Indicators (IQI) 33 Version 43 (August 2011)
87 Program 7 Run IQSASA3 The IQSASA3 program calculates age and sex risk-adjusted rates for each area-level IQI
(overall rates and rates by area) and then calculates smoothed rates Input
1 SAS format library (FMTLIB) created from the IQFMT program 2 The discharge-level file that was created with the IQSAS1 program
3 The SAS dataset with summary records that was created with the IQSASA2 program
4 A text file with Census area residential populations (stratified by area sex and
discrete age categories) One file is currently provided along with the IQI module software The file is POP95T11TXT The user should set POPYEAR to the year that best matches the userrsquos discharge data file The text file does not need to be converted to a SAS file for use with the software
5 A text file (COVIQA42TXT) containing regression coefficients from a regression
that was run on the reference SID dataset These coefficients will be used in the risk adjustment process This file is provided to you as part of the IQI module The text file does not need to be converted to a SAS file for use with the software
6 A text file (MSXIQA42TXT) containing two arrays for use in the smoothing process
The arrays contain noise estimates signal estimates and mean area rates for each IQI This file is provided to you as part of the IQI module The text file does not need to be converted to a SAS file for use with the software
Output
1 A SAS dataset with an overall summary record and with area-level summary records that contain the three types of indicator rates along with the components of the initial raw rates Specifically the file contains the observed rates (OAIQxx variables) the risk-adjusted rates (RAIQxx variables) the smoothed rates (SAIQxx variables) the counts of outcomes that formed the numerators of the observed rates (TAIQxx variables) and the residential population totals that formed the denominators of the observed rates (PAIQxx variables) When stratifications other than area are selected the RAIQxx variables and their confidence intervals are observedexpected ratios to avoid confounding with risk-adjustment variables
2 An optional ASCII (comma delimited) text file that the user can then import into a
spreadsheet This text file contains the same information as the SAS output dataset The text file will contain the OAIQxx observed rates and their TAIQxx and PAIQxx components the RAIQxx risk-adjusted rates and the SAIQxx smoothed rates Each record or row in the text file will correspond to a different area
Inpatient Quality Indicators (IQI) Software Instruction SAS
Inpatient Quality Indicators (IQI) 34 Version 43 (August 2011)
3 Outputs to hardcopy are PROC MEANS (with N NMISS MIN MAX MEAN and SUM) of risk-adjusted and smoothed rates in two intermediate work files and of all of the numeric variables in the final output data file The printout also contains a PROC CONTENTS of the output SAS dataset A PROC PRINT of the output dataset is provided only if the ldquoPRINTrdquo parameter in CONTROL_IQISAS code is set to one
6 A PROC MEANS (with N NMISS MIN MAX MEAN and SUM) of the area-level
summary records that shows statistics for the OAIQxx observed rates and their TAIQxx and PAIQxx components the RAIQxx risk-adjusted rates and the SAIQxx smoothed rates
7 A PROC CONTENTS of the output SAS summary dataset is output to hardcopy
8 A PROC PRINT of the output summary dataset is provided at the end of the hardcopy
printout If the user does not wish to generate this printout then the global ldquoPRINTrdquo parameter in CONTROL_IQISAS code should be set to zero
Changes
1 The ldquoFILENAME CONTROLrdquo statement at the beginning of the program must be changed to reflect the location of the CONTROL_IQISAS code
2 In CONTROL_IQISAS specify the locations (paths) of the input and output SAS
files in the ldquoLIBNAME INA3rdquo and ldquoLIBNAME OUTA3rdquo statements
3 In CONTROL_IQISAS specify in the ldquoINFILE1rdquo statement the name of the discharge-level file that you created with the IQSAS1 program
4 In CONTROL_IQISAS specify the path (including the file name) for the ASCII
population text file in the ldquoFILENAME POPFILE3rdquo statement The file name is POP95T11TXT These files are provided along with the software The file used should be the one that is closest to the year associated with your particular data These files contain Census residential estimates by area gender and discrete age categories
5 In CONTROL_IQISAS specify in the ldquoFILENAME COVARArdquo statement the path
(including the file name) for the ASCII text file that contains regression coefficients from a regression that was run on reference SID dataset The name of the file is COVIQA42TXT
6 In CONTROL_IQISAS specify in the ldquoFILENAME MSXArdquo statement the path
(including the file name) for the ASCII text file that contains the estimates to smooth the indicator rates The name of the file is MSXIQA42TXT
7 In CONTROL_IQISAS specify in the ldquoINFILEA2rdquo statement the name of the
summary file that you created with the IQSASA2 program
Inpatient Quality Indicators (IQI) Software Instruction SAS
Inpatient Quality Indicators (IQI) 35 Version 43 (August 2011)
8 In CONTROL_IQISAS specify in the ldquoOUTFILA3rdquo statement the name that you wish the output file to have
9 In CONTROL_IQISAS if you wish to create an ASCII (comma delimited) text file
that you can import into a spreadsheet then set the TEXTA3 parameter to 1 Otherwise the default value of zero for TEXTA3 will skip the code that would generate this file
10 In CONTROL_IQISAS if you wish to create an ASCII (comma delimited) text file
that you can import into a spreadsheet then specify the path (including the file name) for this ASCII text file in the ldquoFILENAME IQTEXTA3rdquo statement
Inpatient Quality Indicators (IQI) Software Instruction SAS
Inpatient Quality Indicators (IQI) 36 Version 43 (August 2011)
90 Reviewing the Printed Output This section contains tips for reviewing some of the printed output from the IQI module
These tips are oriented toward explaining the interrelationships between printout items from different programs and hopefully will help to reveal the nature and structure of the module outputs For guidance in interpreting the results see the Interpretations Guide
The final output of the IQI module is a PROC PRINT from IQSASP3 (for provider-level indicators) and IQSASA3 (for area-level indicators) All interim printouts are for checking and trouble-shooting However if you have elected to refrain from risk-adjusting and smoothing the data then the final outputs will be the PROC PRINT at the end of the IQSASP2 andor IQSASA2 programs
91 IQSAS1
The initial printout from the IQSAS1 program contains PROC MEANS for all of the numeric variables in the output discharge-level dataset It will contain information for the newly constructed TAIQxx and TPIQxx flag variables that will later form the numerators for the indicator rates For each TAIQxx and TPIQxx flag variable
bull The SUM will contain the total number of observations in the dataset that were found to have the particular outcome of interest
bull For the six Provider volume indicators (TPIQ01-TPIQ02 TPIQ04-TPIQ07) and the four Area indicators (TAIQ26-TAIQ29) the MEAN MINIMUM and MAXIMUM will usually be the value one since the flag variables have either been set to missing (lsquorsquo) or to a value of one The remainder of the Provider indicators (TPIQ08-TPIQ09 TPIQ11-TPIQ25 and TPIQ30-TPIQ34) have a value of one zero or missing (lsquorsquo) For these indicators a value of zero was assigned to the TPIQxx flag if a particular observation was part of the population at risk for a particular indicator but did not have the particular outcome of interest So for example TPIQ21 = 1 indicates a patient who had a Cesarean section while TPIQ21 = 0 identifies a patient who had a delivery but not a C-section
bull For the Provider indicators TPIQ08-TPIQ09 TPIQ11-TPIQ25 and TPIQ30-TPIQ34 the MEANs will contain a close approximation of the eventual overall observed indicator rates The values will change slightly after IQSASP2 has applied additional parts of the indicator definitions
bull N lists the number of observations in the dataset with non-missing values For the six provider-based volume indicators and the four area-level indicators N for TPIQxx or TAIQxx will be the same as the SUM For the other provider-based indicators N will contain the denominator for the observed indicator rate Note the Nrsquos or denominators for six of the mortality indicators (ie IQI 08-12 30 and 31) will be similar to the Ns and SUMs for the six volume indicators (TPIQ01-TPIQ02 TPIQ04-TPIQ07) but often they will not be exactly identical (eg the mortality indicators exclude discharges that were transferred to other hospitals)
Inpatient Quality Indicators (IQI) Software Instruction SAS
Inpatient Quality Indicators (IQI) 37 Version 43 (August 2011)
The IQSAS1 printout also contains a PROC CONTENTS that lists all of the variables in the output dataset including the character variables that are present and a PROC PRINT of the first 24 observations in the output dataset
92 IQSASP2 The purpose of this printout is to provide the observed rates for all provider-level indicators
The default printout shows results by provider but other levels of output (as shown in Table 6) can be specified as well Note that risk-adjusted and smoothed rates are shown in the output from the next program
The printout from the IQSASP2 program contains PROC MEANS on the provider-level summary records for all of the numeric variables in the output summary dataset It will contain information for the newly constructed OPIQxx rates the PPIQxx denominators and the TPIQxx numerators
bull The _TYPE_ variable described in the MEANS table identifies the stratification level for the records in the output data set The _TYPE_ variable corresponds to the TYPELVLP parameter values that were specified (see item number 4 in the ldquoChangesrdquo section for the IQSASP2 program on page 32) In this case _TYPE_ always assumes the value of 16 since only the provider-level records are selected
bull The N statistic for _TYPE_ contains the number of providers in the output summary data set A TPIQxx numerator variable with a value for N that is lower than the N value for _TYPE_ indicates that there were no outcomes of interest for some of the providers Similarly a PPIQxx denominator variable with a lower value for N than _TYPE_ indicates that for some providers there were no hospital discharges with the outcome of interest
bull The MINIMUM value for the TPIQ08-TPIQ25 TPIQ30 and TPIQ31 numerators will usually be zero since values of zero were assigned for observations that were part of the population for the rate denominator but did not have the particular outcome of interest to be included in the rate numerator For the volume indicators (TPIQ01-TPIQ07) the MINIMUM value will be one or higher
For the observed rates the User should NOT report the MEANS displayed here but instead should refer to the overall means in the output dataset that are also present in the subsequent PROC PRINT The MEANS given here are means of hospital means ie all hospitals are given equal weight regardless of the number of discharges in the different hospitals
bull The SUMs for the counter variables TPIQxx and PPIQxx will contain overall file totals for these data elements The SUMs for the observed rates have no intuitive meaning If the ldquoPRINTrdquo parameter in the CONTROL_IQISAS program is set to one the subsequent
PROC PRINT output contains a complete dump of the output summary file Listed for each record are the stratification values the PPIQxx population denominators for the 30 provider indicators the TPIQxx outcome numerators for the 30 provider indicators and the 30 OPIQxx observed rates
Inpatient Quality Indicators (IQI) Software Instruction SAS
Inpatient Quality Indicators (IQI) 38 Version 43 (August 2011)
93 IQSASP3 The PROC PRINT at the end of this program provides your final output (This printout appears if the ldquoPRINTrdquo parameter in the CONTROL_IQISAS program is set to one)
The following table lists the column headers shown on the printed output and describes each
Each indicator is reported in a separate section Values of ldquoxxrdquo correspond to the two-digit IQI number Table 8 Provider level printed output
Column Heading Description Obs Observation 1 (with HOSPID = ldquordquo) is the overall average for the entire dataset
(TYPELVLP = 0) The remaining observations are individual providers or hospitals (TYPELVLP = 16)
HOSPID Identifier for each provider in the dataset AGECAT Age stratification category ndash See Table 6 for TYPELVLP settings SEXCAT Gender stratification category ndash See Table 6 for TYPELVLP settings PAYCAT Payer stratification category ndash See Table 6 for TYPELVLP settings RACECAT Race stratification category ndash See Table 6 for TYPELVLP settings TPIQxx Number of cases in the numerator PPIQxx Number of cases in the denominator (population at risk) OPIQxx Observed (raw) rate ndash Numerator divided by Denominator EPIQxx Expected rate ndash Rates the provider would have if it performed the same as the
reference population given the providerrsquos actual case-mix (eg age gender modified DRG and comorbidities)
RPIQxx Risk-adjusted rate ndash Accounts for the difference between the case-mix of the reference population and the providerrsquos case-mix When stratifications other than hospital or area are selected the RPIQxx variables and their confidence intervals are observedexpected ratios to avoid confounding with risk adjustment variables
LPIQxx Lower limit of confidence interval of risk-adjusted rate UPIQxx Upper limit of confidence interval of risk-adjusted rate SPIQxx Smoothed rate ndash Rates with removal of fluxuation over time XPIQxx Standard error of smoothed rate
Observation 1 (with HOSPID = ) is the overall average for the entire dataset (TYPELVL =
0) The remaining observations are individual providers or hospitals (TYPELVL = 16) Data will appear under the column headers AGECAT SEXCAT PAYCAT and RACECAT if you specify these levels of aggregation (shown in Table 6)
You may wish to express the results in more understandable terms
bull Multiply the mortality rates by 100 to express them as a percentage (eg 00338 100 = 34 mortality for CABG)
bull Multiply the utilization rates by 100 to express them as a percentage (eg 02040 100 = 204 C-section rate)
Inpatient Quality Indicators (IQI) Software Instruction SAS
Inpatient Quality Indicators (IQI) 39 Version 43 (August 2011)
The MEANS table is generated from the permanent provider-based output file and is provided for trouble-shooting and understanding your data but not for reporting The means are provided just for the provider level summary records
bull The N for all but the TPIQxx counter variables should contain the number of providers in the userrsquos database
bull The MEANS MINIMUMs and MAXIMUMs have their normal meaning and provide comparisons among the different hospitals or providers in your database
For the (observed risk-adjusted or smoothed) rates the User should NOT report the MEANS displayed here but instead refer to the overall means in the output dataset in the PROC PRINT labeled ldquoFINAL OUTPUTrdquo The MEANS given here are means of hospital means ie all hospitals are given equal weight regardless of the number of discharges in the different hospitals
bull Note The denominators for six of the mortality indicators ( 8 ndash 12 30 and 31) will be similar to the totals for the six volume indicators (TPIQ01-TPIQ07) but often they will not be exactly identical (eg the mortality indicators exclude discharges that were transferred to other hospitals)
bull If the ldquoPRINTrdquo parameter in the CONTROL_IQISAS program is set to one at the end of the printout is a PROC PRINT on the final provider-based output file Listed for each level of stratification are the stratifiers the numerator and denominator totals for the observed rates and the observed risk-adjusted and smoothed rates
94 IQSASA2
The purpose of this printout is to provide the observed rates for all area-level indicators The default printout shows overall results and results by area but other levels of output (as shown in Table 6) can be specified as well Note that risk-adjusted and smoothed rates are shown in the output from the next program
The printout from the IQSASA2 program contains PROC MEANS for all of the numeric variables in the output summary dataset It will contain information for the newly constructed OAIQxx rates the PAIQxx denominators and the TAIQxx numerators
bull The _TYPE_ variable described in the first row of the MEANS table identifies the stratification level for the records in the output data set The _TYPE_ variable corresponds to the TYPELVLA parameter values that were specified (see item 5 in the ldquoChangesrdquo section for the IQSASA2 program on page 31) In this case _TYPE_ always assumes the value of 8 since only the area-level records are selected
bull The N statistic for _TYPE_ contains the number of areas in the output summary data set A TAIQxx numerator variable with a lower value for N than _TYPE_ indicates that there were no outcomes of interest for some of the areas
bull The MINIMUM value for the TAIQxx numerators will be one or higher
Inpatient Quality Indicators (IQI) Software Instruction SAS
Inpatient Quality Indicators (IQI) 40 Version 43 (August 2011)
For the observed rates the User should NOT report the MEANS displayed here but instead should refer to the overall means in the output dataset that are also present in the subsequent PROC PRINT The MEANS given here are means of the area means ie all areas are given equal weight regardless of the population in the different areas
bull The SUMs for the counter variables TAQIxx and PAIQXX will contain overall file totals for these data elements The SUMs for the observed rates have no intuitive meaning
If the ldquoPRINTrdquo parameter in the CONTROL_IQISAS program is set to one the subsequent
PROC PRINT output contains a complete dump of the output summary file Listed for each record are the stratification values the PAIQxx population denominators for the four indicators the TAIQxx outcome numerators for the four indicators and the four OAIQxx observed rates
95 IQSASA3 The PROC PRINT at the end of this program provides your final output (This printout appears if the ldquoPRINTrdquo parameter in the CONTROL_IQISAS program is set to one)
The following table lists the column headers shown on the printed output and describes each
Each indicator is reported in a separate section Values of ldquoxxrdquo correspond to the two-digit IQI number Table 9 Area level printed output
Column Heading Description
Obs Observation 1 is the overall average for the entire dataset (TYPELVLA = 0) The remaining observations are individual areas (TYPELVLA = 8)
Area Identifier in the dataset for area TAIQxx Number of cases in the numerator PAIQxx Number of cases in the denominator (population at risk) OAIQxx Observed (raw) rate ndash Numerator divided by Denominator RAIQxx Risk-adjusted rate ndash Accounts for the difference between the case-mix of the
reference population and the arearsquos case-mix When stratifications other than hospital or area are selected the RPIQxx variables and their confidence intervals are observedexpected ratios to avoid confounding with risk adjustment variables
SAIQxx Smoothed rate ndash Rates with removal of fluxuation over time
Observation 1 (with AREA = blank) is the overall average for the entire dataset (TYPELVL = 0) The remaining observations are individual areas (TYPELVL = 8)
You may wish to express the results in more understandable terms
bull Multiply the utilization rates by 100000 to express them as a rate per 100000 population (eg 0000494 100000 = 494 hysterectomies per 100000 population)
The MEANS table is generated from the permanent area-level output file The means are
provided just for the area-level summary records
Inpatient Quality Indicators (IQI) Software Instruction SAS
Inpatient Quality Indicators (IQI) 41 Version 43 (August 2011)
bull The N for all but the TAIQxx counter variables should contain the number of different areas (Metro Areas and counties) in your database
bull The MEANs MINIMUMs and MAXIMUMs have their normal meaning and provide comparisons among the different areas in your database Note that the MAXIMUMs for the counter variables (the TAIQxx and PAIQxx variables) are associated with specific areas and therefore these MAXIMUMs may not match those in the prior IQSAS2 printouts since that run typically will include a record for the entire database
For the (observed risk-adjusted or smoothed) rates the User should NOT report the MEANS displayed here but instead refer to the overall means in the output dataset that are also present in the subsequent PROC PRINT The MEANS given here are means of area means ie all areas are given equal weight regardless of the number of discharges in the different areas
bull The SUMs of the counter variables (the TAIQxx and PAIQxx variables) yield the overall database totals
Inpatient Quality Indicators (IQI) Software Instruction SAS
Inpatient Quality Indicators (IQI) 42 Version 43 (August 2011)
100 Benchmark Timings The benchmark runtimes given below are from runs made on a Windows XP workstation
with a Pentium 4 CPU 280 GHz processor 512 MB of RAM and an IDE hard drive The dataset used contained 757624 observations with 15 diagnosis fields and 15 procedure fields
Step Run time (in seconds) Run IQFMTS to create the format library 2 Run IQSAS1 157 Run IQSASP2 21 Run IQSASP3 86 Run IQSASA2 10 Run IQSASA3 185
101 User Support Technical assistance is available through an electronic user support system monitored by the
QI support team to support users in their application of the IQI software The same e-mail address may be used to communicate to AHRQ any suggestions for IQI enhancements general questions and any QI related comments you may have AHRQ welcomes your feedback
The Internet address for user support and feedback is supportqualityindicatorsahrqgov AHRQ also offers a listserv to keep you informed on the Quality Indicators (QIs) The
listserv is used to announce any QI changes or updates new tools and resources and to distribute other QI related information This is a free service Simply follow the process described below to begin receiving important QI information All you need is a computer Internet access and an E-mail address It works just like other electronic distribution lists
Herersquos how to register 1 Send an E-mail message to listservqualityindicatorsahrqgov 2 On the subject line type Subscribe For example Subscribe
3 In the body of the message type sub Quality_Indicators-L and your full name For example sub Quality_Indicators-L John Doe
4 You will receive a message confirming that you are signed up If you have any questions contact AHRQ QI Support at the e-mail noted above You should
receive an automatic response e-mail message confirming receipt of your e-mail If you do not receive a confirmation message call (888) 512-6090
Inpatient Quality Indicators (IQI) Software Instruction SAS
Inpatient Quality Indicators (IQI) 43 Version 43 (August 2011)
Appendix A Links The following links may be helpful to users of the AHRQ Inpatient Quality Indicators
Inpatient Quality Indicators Version 43 Documents and Software Available at httpwwwqualityindicatorsahrqgovmodulesiqi_resourcesaspx and httpwwwqualityindicatorsahrqgovsoftwaredefaultaspx
Title Description
IQI User Guide Individual Measures
The user guide provides a technical overview of the IQI individual measures including literature and empirical evidence
IQI User Guide Composite Measures
The user guide provides a technical overview of the IQI composite measures
IQI Technical Specifications
Provides detailed definitions of each IQI including all ICD-9-CM and DRG codes that are included in or excluded from the numerator and denominator Note that exclusions from the denominator are automatically applied to the numerator
IQI Comparative Data This document provides the average volume provider rate and population rate as appropriate for each indicator
Fiscal year 2011 Coding Changes
This document summarizes the changes to the indicator definitions resulting from FY 2011 changes to ICD-9-CM coding and DRG changes These changes will only affect data from FY 2011 (October 1 2011) or later
Log of Changes to IQI Documents and Software
The Change Log document provides a cumulative summary of all changes to the IQI software software documentation and other documents made since the release of version 21 of the software in March 2003 Changes to indicator specifications that were not a result of new ICD-9-CM and DRG codes are also described in the Change Log
IQI Risk Adjustment Coefficient Tables
Tables for each IQI provide the stratification and coefficients used to calculate the risk-adjusted rate for each strata
SASreg IQI Software Documentation
This software documentation provides detailed instructions on how to use the SAS reg version of the IQI software including data preparation calculation of the IQI rates and interpretation of output
SASreg IQI Software Requires the SASreg statistical program distributed by the SAS Institute Inc The company may be contacted directly regarding the licensing of its products httpwwwsascom
3Mreg APRreg DRG Limited License Grouper for SASreg
Creates APR-DRG variables for use with SAS version of IQI software Instructions for running the software are included in the Zip file
Version 43 Listserv announcement
This document announces the release of the Version 43 software and documentation provides a summary of changes and links to relevant pages
Inpatient Quality Indicators (IQI) Software Instruction SAS
Inpatient Quality Indicators (IQI) 44 Version 43 (August 2011)
AHRQ QI Windows Application The AHRQ QI Windows Application calculates rates for all of the AHRQ Quality Indicators modules and does not require SASreg It is available at
httpwwwqualityindicatorsahrqgovwinqi_downloadhtm Additional Documents The following documents are available within the Archive section of the AHRQ QI Web page
httpwwwqualityindicatorsahrqgovArchivedefaultaspxiqi
bull Refinement of the HCUP Quality Indicators (Technical Review) May 2001 bull Refinement of the HCUP Quality Indicators (Summary) May 2001
In addition these documents may be accessed at the AHRQ QI Modules Web page
httpwwwqualityindicatorsahrqgovmodulesDefaultaspx bull AHRQ QI Measure Development Implementation Maintenance and Retirement bull ICD-9-CM to ICD-10-CMPCS Conversion of AHRQ QI March 2011 bull AHRQ QI Empirical Methods May 2011 bull Guidance for Using the AHRQ Quality Indicators for Hospital-level Public Reporting
or Payment August 2004 bull AHRQ Summary Statement on Comparative Hospital Public Reporting December
2005 bull Appendix A Current Uses of AHRQ Quality Indicators and Considerations for
Hospital-level bull Comparison of Recommended Evaluation Criteria in Five Existing National
Frameworks bull List of AHRQ QI Endorsed by the National Quality Forum
The following documents can be viewed or downloaded from the AHRQ QI News Web page
httpwwwqualityindicatorsahrqgovnewsdefaultaspx and httpwwwqualityindicatorsahrqgovArchiveNewsaspx bull February 2007 Newsletter - Year highlights and future plans bull February 2006 Newsletter ndash Year highlights and future plans bull 2006 Area Level Indicator Changes bull Considerations in Public Reporting for the AHRQ QI bull June 2005 Newsletter - Contains the article Using Different Types of QI Rates
Inpatient Quality Indicators (IQI) Software Instruction SAS
Inpatient Quality Indicators (IQI) 45 Version 43 (August 2011)
Other Tools and Information
IQI rates can be calculated using the modified Federal Information Processing Standards (FIPS) Statecounty code A list of codes is available at
httpwwwcensusgovpopestgeographiccodes02pdf
AHRQ provides a free on-line query system based on HCUP data that provides access to health statistics and information on hospital stays at the national regional and State level It is available at
httphcupahrqgovHCUPnetasp
Information on the 3Mtrade APR-DRG system is available at
httpwww3mcomushealthcarehisproductscodingrefined_drgjhtml
Inpatient Quality Indicators (IQI) Software Instruction SAS
Inpatient Quality Indicators (IQI) 46 Version 43 (August 2011)
Appendix B Using Different Types of QI Rates When should you use the observed expected risk adjusted andor smoothed rates generated
by the AHRQ QI software Here are some guidelines If the userrsquos primary interest is to identify cases for further follow-up and quality
improvement then the observed rate would help to identify them The observed rate is the raw rate generated by the QI software from the data the user provided Areas for improvement can be identified by the magnitude of the observed rate compared to available benchmarks andor by the number of patients impacted
Additional breakdowns by the default patient characteristics used in stratified rates (eg age gender or payer) can further identify the target population Target populations can also be identified by user-defined patient characteristics supplemented to the casedischarge level flags Trend data can be used to measure change in the rate over time
Another approach to identify areas to focus on is to compare the observed and expected rates The expected rate is the rate the provider would have if it performed the same as the reference population given the providerrsquos actual case-mix (eg age gender DRG and comorbidity categories)
If the observed rate is higher than the expected rate (ie the ratio of observedexpected is greater than 10 or observed minus expected is positive) then the implication is that the provider performed worse than the reference population for that particular indicator Users may want to focus on these indicators for quality improvement
If the observed rate is lower than the expected rate (ie the ratio of observedexpected is less than 10 or observed minus expected is negative) then the implication is that the provider performed better than the reference population Users may want to focus on these indicators for identifying best practices
Users can also compare the expected rate to the reference population rate reported in the AHRQ QI software or Comparative Data document to determine how their case-mix compares to the reference population The population rate refers to the overall rate for the reference population The reference population is defined in the Comparative Data Document If the population rate is higher than the expected rate then the providerrsquos case-mix is less severe than the reference population If the population rate is lower than the expected rate then the providerrsquos case-mix is more severe than the reference population
We use this difference between the population rate and the expected rate to ldquoadjustrdquo the observed rate to account for the difference between the case-mix of the reference population and the providerrsquos case-mix which is the providerrsquos risk-adjusted rate
If the provider has a less severe case-mix then the adjustment is positive (population rate gt expected rate) and the risk-adjusted rate is higher than the observed rate If the provider has a more severe case-mix then the adjustment is negative (population rate lt expected rate) and the risk-adjusted rate is lower than the observed rate The risk-adjusted rate is the rate the provider would have if it had the same case-mix as the reference population given the providerrsquos actual performance
Finally users can compare the risk-adjusted rate to the smoothed or ldquoreliability-adjustedrdquo rate to determine whether this difference between the risk-adjusted rate and reference population rate is likely to remain in the next measurement period Smoothed rates are weighted averages of the population rate and the risk-adjusted rate where the weight reflects the reliability of the providerrsquos risk-adjusted rate
Inpatient Quality Indicators (IQI) Software Instruction SAS
Inpatient Quality Indicators (IQI) 47 Version 43 (August 2011)
A ratio of (smoothed rate - population rate) (risk-adjusted rate - population rate) greater than 080 suggests that the difference is likely to persist (whether the difference is positive or negative) A ratio less than 080 suggests that the difference may be due in part to random differences in patient characteristics (patient characteristics that are not observed and controlled for in the risk-adjustment model) In general users may want to focus on areas where the differences are more likely to persist
Inpatient Quality Indicators (IQI) Software Instruction SAS
Inpatient Quality Indicators (IQI) 48 Version 43 (August 2011)
Appendix C IQI Input Data Dictionary Variable name Description Format Value description Comments
KEY Sequence number Unique case identifier Numeric
User defined unique numeric identifier for each discharge record
Not used by the QI programs but should be present to facilitate possible exploration allows user to link the records from the IQSAS1SAS program output file back to the original input data file
AGE Age in years at admission Numeric Age in years
If this data element is missing the discharge record will be excluded from analysis
AGEDAY Age in days (coded only when the age in years is less than 1) Numeric Age in days
Not used in the IQI program If not present in the input data file it is not necessary to create a dummy variable for this module
RACE Race of patient Numeric 1 2 3 4 5 6
White Black Hispanic Asian or Pacific Island Native American Other
The values of 1-5 are used directly in the QI software All other ethnicity codes are mapped to an lsquootherrsquo category
SEX Sex of patient Numeric
1 2
Male Female
If this data element is missing the discharge record will be excluded from the analysis
PAY1 Expected primary payer
Numeric 1 2 3 4 5 6
Medicare Medicaid Private incl HMO Self-pay No charge Other
The values of 1 2 3 and 4 are used directly in the QI software All other payer codes are mapped to an lsquootherrsquo category This data element is used to stratify only the Provider-level IQI (IQI-01 toIQI-25 IQI-30 to IQI-34)
PAY2 (SAS Only)
Expected secondary payer
Numeric 1 2 3 4 5 6
Medicare Medicaid Private incl HMO Self-pay No charge Other
Use is optional but must be present in data (set to missing if data element not available)
PSTCO
Location of patient residence or hospital location (FIPSdagger Statecounty code)
Numeric ssccc
Modified Federal Information Processing Standards Statecounty code2
See Appendix A for link to most recent list of codes If this data element is missing the discharge record will be excluded from rate calculations
HOSPID Data Source hospital number Numeric Hospital
identification number Used to facilitate data exploration and possible trouble shooting
2 Federal Information Processing Standard as defined by the US Department of Commerce National Institute of Standards and Technology (formerly National Bureau of Standards) Note Certain independent cities (Baltimore City Carson City and St Louis City) and areas within Hawaii and Virginia are assigned to different area groupings in the Modified FIPS categories as compared to the US Census Bureau groupings The AHRQ QI software uses the Modified FIPS code assignment of these areas Failure to use the Modified FIPS codes assignment will result in the use of incorrect denominator estimates for area indicators A list is available at httpwwwcensusgovpopestgeographiccodes02pdf
Inpatient Quality Indicators (IQI) Software Instruction SAS
Inpatient Quality Indicators (IQI) 49 Version 43 (August 2011)
Variable name Description Format Value description Comments
DISP Disposition of patient
Numeric 1 2 3 4 5 6 7 20
Routine Short-term hospital Skilled nursing facility Intermediate care Another type of facility Home health care Against medical advice Died in the hospital
The values 2 and 20 are referenced by the QI code (to identify transfers to another short-term hospital and patients who died in the hospital)
MORT30 (SAS Only)
30-Day Mortality Indicator Numeric
0 ndash not died within 30-days from admission
Use is optional but must be present in data (set to missing if data element not available)
1 ndash died within 30-days from admission
DNR Do Not Resuscitate Indicator Numeric
0 ndash No ldquoDo Not Resuscitaterdquo Indicator
Use is optional but must be present in data (set to missing if data element not available)
1 ndash ldquoDo Not Resuscitaterdquo Indicator
ATYPE Admission Type Numeric 1 2 3 4 5 6
Emergency Urgent Elective Newborn Trauma Center3 Other
Not used by the IQI program If not present in the input data file it is not necessary to create a dummy variable
ASOURCE Admission Source
Numeric 1 2 3 4 5
ER Another hospital Another facility including LTC Courtlaw enforcement Routinebirthother
The value 2 is referenced by the QI code (to identify transfers from another short-term hospital)
LOS Length of Stay Numeric Number of days from admission to discharge
Not used by the IQI program If not present in the input data file it is not necessary to create a dummy variable
APR_DRG APR-DRG category Numeric APR-DRG from 3Mreg software
Although the IQI module will operate without these variables users should run APR-DRG software on their raw data to assign this variable to each case See Section 53 on page 15
APRDRG_ RISK_ MORTALITY
APR-DRG Mortality Score Numeric
APR-DRG Risk of Mortality Score from 3Mreg software
See Section 53 on page 15
XPRDRG_ RISK_ MORTALITY
APR-DRG Mortality Score with POA Numeric
APR-DRG Risk of Mortality Score from 3Mreg Software using
See Section 53 on page 15
3 The ATYPE value ldquo5rdquo was used to indicate delivery only in the 1988 to 1997 HCUP data files The UB standards currently use ldquo5rdquo to indicate Trauma Center
Inpatient Quality Indicators (IQI) Software Instruction SAS
Inpatient Quality Indicators (IQI) 50 Version 43 (August 2011)
Variable name Description Format Value description Comments
POA information
DRG Diagnosis Related Group Numeric DRG from federal (CMS) DRG Grouper
DRGVER Diagnosis Related Group Version Numeric
DRG Version of federal (CMS) DRG Grouper
eg Version 28 for FY2011
MDC Major Diagnostic Category Numeric MDC from federal (CMS) DRG grouper
DISCWT Weight to assign to discharge Numeric Format as nnnnn
Cases with missing values are assigned a value of 1 Assigning a weight of zero has the effect of removing the case from the analysis
DX1 ndash DX30
ICD-9-CM diagnosis codes DX1 is the principal diagnosis DX2-DX30 are secondary diagnoses
String 3 4 or 5
characters (do not include decimal point)
Diagnosis codes Users must specify the number of diagnoses in the parameter ampNDX in CONTROL_IQISAS program
DXPOA1- DXPOA30-
Present on admission indicator for each diagnosis code
String
1 = present at the time of inpatient admission
These data will be used in risk adjustment and smoothing if the alternative parameter files of risk-adjustment covariates and population rates is specified
(YWE1)
0 = not present at the time of inpatient admission
(NUrsquo0rsquo )
NDX Count of the number of diagnoses (DX) on the discharge record
Numeric
Count of diagnoses (principal and all secondary diagnoses)
Not used by the IQI SAS program If not present in the input data file it is not necessary to create a dummy variable Definition is If the 1st discharge record has 1 Pr and the 2nd has 2 NPR would be 1 for the 1st record and 2 for the 2nd
PR1 ndash PR30
ICD-9-CM procedure codes PR1 is the principal procedure PR2-PR30 are secondary procedures
String 3 or 4
characters (do not include decimal point)
Procedure code
Users with more or fewer secondary procedures should modify the parameter ampNPR in CONTROL_IQISAS to reflect the number of diagnoses
NPR Count of the number of procedures (PR) on the discharge record
Numeric
Count of procedures (principal and all secondary procedures)
Not used by the IQI SAS program If not present in the input data file it is not necessary to create a dummy variable Definition is If the 1st discharge record has 1 Pr and the 2nd has 2 NPR would be 1 for the 1st record and 2 for the 2nd
Inpatient Quality Indicators (IQI) Software Instruction SAS
Inpatient Quality Indicators (IQI) 51 Version 43 (August 2011)
Variable name Description Format Value description Comments
POINTOFORIGINUB04
Point of Origin Numeric 4 Transfer from a hospital 5 Transfer from a skilled Nursing Facility (SNF) or Intermediate Care Facility (ICF)
Only these values are used by the QI programs
6 Transfer from another health care facility
IF ATYPE = 4
5 Born inside this hospital
6 Born outside of this hospital
PRDAY1 ndash PRDAY30
Days from admission to procedure PR1 is the principal procedure PR2-PR30 are secondary procedures
Numeric Days from Admission to Procedure4
Not used by the IQI program If not present in the input data file it is not necessary to create a dummy variable for this module
YEAR
Year of discharge The patientrsquos year of discharge For example a patient discharged on July 7 2004 would have a discharge year of lsquo2004rsquo
Numeric
YYYY
Discharge year should be within the range of 1997 to 2011
DQTR Quarter of discharge The calendar quarter of the patientrsquos discharge For example a patient discharged on July 7 2004 would have a discharge quarter of lsquo3rsquo
Numeric 1 January-March 2 April-June 3 July-September 4 October-December
See httphcup-usahrqgovtoolssoftwarecomorbiditycomorbidityjsp
4 Variables PRDAY1 to PRDAY30 are defined as the number of days from date of admission to date of procedure for each procedure For example if the patient was admitted on June 15th and had two procedures - the principal procedure on June 15th and a second procedure on June 18th ndash then the value of PRDAY1 would be zero (0) and the value of PRDAY2 would be three (3) For more information consult the HCUP data documentation at httpwwwhcup-usahrqgovdbvarsprdaynnisnotejsp
Inpatient Quality Indicators (IQI) Software Instruction SAS
Inpatient Quality Indicators (IQI) 52 Version 43 (August 2011)
Appendix D SAS IQI Output Data Dictionary SAS IQI Provider Output Column Heading Description Format Comments
Obs Observation 1 (with HOSPID = ) is the overall average for the entire dataset (TYPELVLP = 0) The remaining observations are individual providers or hospitals (TYPELVLP = 16)
Numeric
HOSPID Identifier for each provider in the dataset
Text Up to 12 characters
AGECAT Age stratification category Numeric range
SEXCAT Gender stratification category Numeric 1 = male 2 = female PAYCAT Payer stratification category Numeric 1 = Medicare
2 = Medicaid 3 = Private incl HMO 4 = Self-pay 5 = No charge 6 = Other
RACECAT Race stratification category Numeric 1 = White 2 = Black 3 = Hispanic 4 = Asian or Pacific Island 5 = Native American 6 = Other
TPIQxx The number of discharge records included in the numerator (outcome of interest) as defined for the indicator
Numeric
PPIQxx The number of discharge records included in the denominator (population at risk) as defined for the indicator
Numeric
OPIQxx The rate (observed numerator observed denominator) as defined for the indicator
Numeric
EPIQxx Rate calculated by assuming an average performance for each patient group based on the reference population but with the providerlsquos actual case-mix
Numeric
RPIQxx The estimated rate calculated by adjusting to an average case-mix
Numeric When stratifications other than hospital or area are selected the RPIQxx variables and their confidence intervals are observedexpected ratios to avoid confounding with risk adjustment variables
LPIQxx The lower confidence bound of the risk adjusted rate
Numeric
UPIQxx The upper confidence bound of the risk adjusted rate
Numeric
Inpatient Quality Indicators (IQI) Software Instruction SAS
Inpatient Quality Indicators (IQI) 53 Version 43 (August 2011)
Column Heading Description Format Comments
SPIQxx The smoothed rate calculated using multivariate signal extraction (MSX)
Numeric
XPIQxx Standard error of smoothed rate Numeric VPIQxx Variance for respective indicators Numeric
SAS IQI Area Output Column Heading Description Format Comments
Obs Observation 1 (with HOSPID = ) is the overall average for the entire dataset (TYPELVLP = 0) The remaining observations are individual providers or hospitals (TYPELVLP = 16)
Numeric
AREA Identifier in the dataset for area Text TAIQxx The number of discharge records
included in the numerator (outcome of interest) as defined for the indicator
Numeric
PAIQxx The number of discharge records included in the denominator (population at risk) as defined for the indicator
Numeric
OAIQxx The rate (observed numerator observed denominator) as defined for the indicator
Numeric
RAIQxx The estimated rate calculated by adjusting to an average case-mix
Numeric When stratifications other than hospital or area are selected the RAIQxx variables and their confidence intervals are observedexpected ratios to avoid confounding with risk adjustment variables
SAIQxx The smoothed rate calculated using multivariate signal extraction (MSX)
Numeric

Inpatient Quality Indicators (IQI) Software Instruction SAS
Inpatient Quality Indicators (IQI) 16 Version 43 (August 2011)
unavailable from a particular source ldquoCrdquo for inconsistent data However the IQI programs do not distinguish among the different types of missing codes Therefore all types of missing values in the input data to the IQI module must be represented by a single value ndash missing data () for numeric variables and blank (lsquo lsquo) for alphanumeric (or character) variables
55 Treatment of Missing Data The software is designed to handle missing data in a particular manner specifically the
software requires confirmation for the assignment of a poor outcome or negative event For instance in order to be assigned as a death each case must actually be coded as a death Missing data are considered neutral Missing data for some elements results in the exclusion of that case from the denominator For a few other elements the case is retained
Inpatient Quality Indicators (IQI) Software Instruction SAS
Inpatient Quality Indicators (IQI) 17 Version 43 (August 2011)
Table 4 lists the impact of missing data for each data element Table 4 Treatment of missing data elements
Variable Label D N E S Treatment of Missing Data
AGE Age In Years At Admission
X X X Case excluded from all analysis (eg dropped from the denominator of the discharge based indicators and from numerator of all population based measures)
ASOURCE Admission Source X Case excluded from denominator where used in specification (eg IQI- 32)
DISP Disposition Status X X Case excluded from denominator where used in specification (eg IQI-15)
DQTR Discharge Quarter X X X X Case excluded from all analysis (eg dropped from the denominator of the discharge based indicators and from numerator of all population based measures)
DX1 Principal Diagnosis Code
x x x x Record excluded from analysis
Sex Patient Gender X X X Case excluded from all analysis (eg dropped from the denominator of the discharge based indicators and from numerator of all population based measures)
PAY 1 Payer x Classified As ldquoOtherrdquo POINTOFORIGINUB04 Point of Origin x x Missing values of
POINTOFORIGINUB04 result in a case being excluded from the denominator for IQI 32 (along with ASOURCE)
PSTCO Location of Patient Residence or Hospital Location Modified FIPS StateCounty Code
X Dropped from denominator in rate calculations (stratified by county or Metro Area) case will appear in calculation of the overall rate
RACE Race X Classified As ldquoOtherrdquo YEAR Discharge Year X X X X Case excluded from all analysis (eg
dropped from the denominator of the discharge based indicators and from numerator of all population based measures)
Note D = Denominator N = Numerator E = Exclusion S = Stratification
Inpatient Quality Indicators (IQI) Software Instruction SAS
Inpatient Quality Indicators (IQI) 18 Version 43 (August 2011)
60 User Options The IQI software reflects the development and implementation of the software with
discharge data available to AHRQ through the HCUP program The goal was to develop the tools illustrate their use and then encourage others to adopt and use the tools for their own applications As a result users are encouraged to consider how AHRQ may modify or enhance the IQI software to better serve their measurement needs and interests
Modifications to the definitions of outcomes of interest (numerators) or populations at risk (denominators) are possible but not desirable Maintaining consistent definitions is important Once definitions are altered the ability to make comparisons of IQI based on original definitions is lost Users are encouraged to identify ways to improve the IQI methodology and to share their suggestions with AHRQ for future updates
AHRQ provides public access to HCUPnet (httphcupnetahrqgov)- an interactive tool for
identifying tracking analyzing and comparing statistics on hospital care HCUPnet queries generate statistics in a table format using data from the Nationwide Inpatient Sample (NIS) and State Inpatient Databases (SID) for those States that have agreed to participate HCUPnet includes statistics based on the AHRQ Quality Indicators (QIs) which have been applied to the HCUP NIS If users change definitions of the IQI it will not be possible to compare usersrsquo results to the national estimates in HCUPnet
Inpatient Quality Indicators (IQI) Software Instruction SAS
Inpatient Quality Indicators (IQI) 19 Version 43 (August 2011)
70 Producing Inpatient Quality Indicator Rates Processing Steps
Each Inpatient Quality Indicator (IQI) expressed as a rate is simply defined as
Outcome of interest Population at risk
[or]
Numerator Denominator
Conceptually five steps are necessary to produce the IQI rates The following describes the steps and how the software performs them
71 Step 1 Identify Outcomes in Inpatient Records Inpatient records are marked to indicate whether they contain the outcome of interest
(numerator or ldquoTrdquo for ldquotoprdquo) for each of the AHRQ IQI measures Records are marked by setting a series of flag variables each of which corresponds to the
numerator for a particular IQI For example if the inpatient record meets the conditions for inclusion in the outcome for IQI- 01 then the outcome indicator for IQI- 01 is set to one
This step requires one pass through the discharge-level data and outputs a discharge-level data file containing the flag indicator variables for the outcomes for each IQI This output file also contains the original input variables with the exception of the diagnosis and procedure variables which have been removed to reduce the size of the output file
The first six Inpatient Quality Indicators are volume measures and for these QIs this first step is all that is necessary The remaining steps two though five are relevant for the remaining indicators which are rates as opposed to total volume measures
72 Step 2 Identify Populations at Risk
For the Provider IQI the populations at risk (the denominators for calculating the IQI rates or ldquopoprdquo) are derived from the hospital discharge records
For the four Area-level IQI the populations at risk (the denominators for calculating the IQI rates) are derived from US Census population figures
73 Step 3 Calculate Observed (raw) Inpatient Quality Indicator rates
Using the output data from step 1 and either hospital discharge or US Census population
data from step 2 the IQI rates are calculated for user-specified combinations of stratifiers These stratifiers include hospitals age groups raceethnicity categories sex and payer categories for the Provider IQI and areas (Metro Areascounties) age groups raceethnicity categories and sex for the Area-level IQI
Inpatient Quality Indicators (IQI) Software Instruction SAS
Inpatient Quality Indicators (IQI) 20 Version 43 (August 2011)
The programs calculate observed IQI rates regardless of the number of cases available However IQI rates based on only a few cases should be interpreted with caution
In some performance measurement work it is often recommended that rates be suppressed
when there are fewer than 30 cases in the denominator This exclusion rule serves two purposes
bull It eliminates unstable estimates based on too few cases
bull It helps protect the identities of hospitals and patients
This step outputs the observed rates for user-specified categories alone or in combination For example Provider IQI observed rates could be output at the hospital level at the payer level or at the hospital level by payer
74 Step 4 Risk-adjust the Inpatient Quality Indicator Rates
Regression coefficients from a reference population database (reflecting a large proportion of the US population) are applied to the observed rates in the risk-adjustment process These reference population file regression coefficients are provided as part of the Generalized Estimating Equation GEE routines included with IQI module The risk-adjusted rates will then reflect the age and sex distribution (and the APR-DRG distribution for the provider indicators) of data in the reference population file rather than the distribution for the hospitals or areas present in the usersrsquo data This approach will allow risk-adjusted rates produced by various users to be compared directly to one another
The programs calculate risk-adjusted IQI rates regardless of the number of cases available (however a minimum of 3) However IQI rates based on only a few cases should be interpreted with caution
75 Step 5 Create MSX Smoothed Rates
Shrinkage factors are applied to the risk-adjusted rates for each IQI in a process called multivariate signal extraction (MSX) For each IQI the shrinkage estimate reflects a lsquoreliability adjustmentrsquo unique to each indicator The less reliable the IQI is over time and across hospitals or areas the more the estimate lsquoshrinksrsquo the IQI toward the overall area mean The resulting rate will appear ldquosmootherrdquo than the raw rate meaning the year-to-year fluctuations in performance are likely to be reduced The shrinkage factors are provided as part of the IQI software and do not need to be calculated by users
These five steps reflect the IQI module production in a nutshell The next section of this document describes the specifics of each software component of the IQI module software
Inpatient Quality Indicators (IQI) Software Instruction SAS
Inpatient Quality Indicators (IQI) 21 Version 43 (August 2011)
80 Program Descriptions This section describes the seven SAS programs that assign calculate and print the Inpatient
Quality Indicators For each program there is a description a list of input and output files and an explanation of
changes to the program that may be required The flow of data through the IQI module programs is shown in the flowcharts in Figure 1 and Figure 2 that begin on page 6
If you desire to create and examine observed IQI rates then the CONTROL_IQI IQFMTS and the IQSAS1 programs will need to be used followed by IQSASP2 (for Provider observed rates and volume indicators) andor IQSASA2 (for Area observed rates) If you also wish to create risk-adjusted and smoothed IQI rates then you will also need to run the IQSASP3 andor the IQSASA3 program
81 Program 1 Modify Statements in the CONTROL_IQISAS Code
The CONTROL_IQISAS code contains all of the SAS statements that you need to modify in order to run the remaining IQI module programs (with one exception noted below) This location is where you specify for example the path names or locations of all your input and output data sets There is also a TITLE line that the user can fill in The items that need to be changed in order to run the IQSAS1 IQSASP2 IQSASP3 IQSASA2 and IQSASA3 programs are described below each program
The CONTROL_IQISAS code is automatically inserted into the remaining programs when they are executed You do not need to run CONTROL_IQISAS as a separate program
All of the changes needed for the CONTROL_IQISAS code are listed in the following descriptions for programs 2 ndash 7 Each program description contains a section labeled ldquoChangesrdquo that enumerates the modifications for CONTROL_IQISAS that are associated with that particular program
Lines of code to be modified are identified by the phrase ldquolt===USER MUST modifyrdquo which means the user must make the change or by ldquolt===USER MAY modifyrdquo which means the modification is optional
In all of the remaining programs included with the IQI module there is one line of code near
the beginning of each program that needs to be modified This line of code starts with the phrase ldquoFILENAME CONTROLrdquo You must modify this line to point to the path name where you stored your modified copy of the CONTROL_IQISAS file Pathnames should not exceed 255 characters in length
CONTROL_IQISAS has a collection of parameters that allow you to read in data from different locations or pathnames and write out data to different locations or pathnames For example ldquoLIBNAME IN0rdquo points to the location of your input data set for program IQSAS1 and ldquoLIBNAME OUT1rdquo points to the location of the output data set created by the IQSAS1 program
Inpatient Quality Indicators (IQI) Software Instruction SAS
Inpatient Quality Indicators (IQI) 22 Version 43 (August 2011)
The parameters allow these locations to be different from one another However if you wish to read in and write out all of the data to the same location it is easiest to just make a global change in CONTROL_IQISAS changing ldquoCpathnamerdquo to the single directory location that you wish to use
There is a global PRINT parameter in CONTROL_IQISAS that as a default prints all of the output summary records at the end of the IQSASP2 IQSASP3 IQSASA2 and IQSASA3 programs These printouts may be quite large if you have a large database with a large number of hospitals and if you choose the results to be finely stratified If you wish to turn this feature off set PRINT to have a value of zero in CONTROL_IQISAS to turn this feature on set PRINT to have a value of 1
The global MALEVL parameter in CONTROL_IQISAS by default instructs all programs to define geographic areas by county for all areas in the input datasets Refer to Page 14 for a list of values for the MALEVL parameter
82 Program 2 Run IQFMTS
The IQFMTS program defines a format library which contains the diagnosis and procedure screens necessary for assigning the outcomes of interest This format library is used by most of the succeeding programs
The first few formats in this program are for the stratifiers (ie age sex raceethnicity and payer) These are followed by formats that are used for the identification of outcomes of interest in the IQSAS1 program and by formats that map FIPS county codes to Metro Areas in the IQSAS1 IQSASA2 and IQSASA3 programs At the end of the program are formats used to assign age categories for the risk adjustment process implemented in IQSASP3 and IQSASA3 and formats used with APR-DRG categories in IQSASP3 Input None Output Permanent SAS format library (FMTLIB) Changes
1 You must modify the ldquoFILENAME CONTROLrdquo statement at the beginning of the program to change the path so it points to your location of the CONTROL_IQISAS code
2 In CONTROL_IQISAS specify the location (path) of the format library in the
ldquoLIBNAME LIBRARYrdquo statement
83 Program 3 Run IQSAS1 The IQSAS1 program processes hospital discharge abstract data and flags inpatient records if
they contain outcomes of interest Outcome indicator names or numerators have prefix of ldquoTrdquo (Top) Stratifier variables are constructed at the beginning of the program
Inpatient Quality Indicators (IQI) Software Instruction SAS
Inpatient Quality Indicators (IQI) 23 Version 43 (August 2011)
This program assumes that the input data file (consisting of inpatient discharge abstract data) conforms to specific variable names attributes and coding conventions See Table 2 on page 9 for variable names and attributes for the input data file
Partial definitions of the Inpatient Quality Indicators are given in Table 1 on page 8 This table is presented to assist those individuals who desire to examine the software source code statements Complete definitions of the indicators are given in the document Inpatient Quality Indicators Technical Specifications (httpwwwqualityindicatorsahrqgovModulesiqi_overviewaspx) Input
1 User supplied SAS inpatient data set consisting of administrative hospital discharge abstract data This data set is a discharge level file with an array of diagnosis and procedure codes among other data elements
2 SAS format library (FMTLIB) created from the IQFMT program
Output
1 SAS dataset containing inpatient records with input variables stratifiers and flag indicators (TPIQxx and TAIQxx) for the outcomes of interest that will later form the numerators for the IQI rates
2 PROC MEANS (with N NMISS MIN MAX MEAN and SUM) of all of the
numeric variables in the output data file and a PROC CONTENTS of the output data file are output to hardcopy
3 A PROC PRINT of the first 24 observations in the output data file is output to
hardcopy Changes
1 The ldquoFILENAME CONTROLrdquo statement at the beginning of the program must be changed to reflect the location of the CONTROL_IQISAS code
2 In CONTROL_IQISAS specify the locations (paths) of the input and output files in
the ldquoLIBNAME IN0rdquo and ldquoLIBNAME OUT1rdquo statements
3 In CONTROL_IQISAS specify the names of the input and output files in the ldquoINFILE0rdquo and ldquoOUTFILE1rdquo statements
4 To define urban areas by Metro Area rather than by county change the MALEVL
parameter in CONTROL_IQISAS from 0 to 1 2 or 3 Rural areas will be defined by county no matter how MALEVL is specified Refer to page 14 for a list of values for the MALEVL parameter
5 The IQI module assumes that your starting SAS data set contains 30 diagnoses
and 30 procedures If these numbers are different in your input inpatient data then modify the NDX and NPR parameters in CONTROL_IQISAS
Inpatient Quality Indicators (IQI) Software Instruction SAS
Inpatient Quality Indicators (IQI) 24 Version 43 (August 2011)
If your variables are named differently from those used in the IQI software (see Table 1 on page 8) you MUST either rename those variables prior to running this program or modify IQSAS1 to include the renaming of your variables to match those expected by the software Similarly if your variables are not the same type ie character or numeric as those expected by the software (see Table 1) you MUST modify your variables prior to running this program
6 If you wish to use APR-DRG variables in the later IQSASP3 program to risk-adjust
the provider indicators then in CONTROL_IQISAS set the APRDRGFG flag parameter to one If you do not intend to run IQSASP3 to risk-adjust the provider indicators or if you do not have the APR-DRG variables available to you then set APRDRGFG to zero See Table 5 below
7 If you wish to risk-adjust the provider indicators by later running the IQSASP3
program then in CONTROL_IQISAS set the three APRDRG APRDRG_RISK_MORTALITY and XPRDRG_RISK_MORTALITY parameters to be the names of the DRG category variable and the mortality indicators created by APR-DRG software If you do not intend to use APR-DRG software then set the three APRDRG APRDRG_RISK_MORTALITY and XPRDRG_RISK_MORTALITY parameters to equal zero See Table 5 below
Table 5 How to set up IQI parameters and your data for using APR-DRG variables
If you do not intend to risk-
adjust the provider
indicators
If you are going to run IQSASP3 to risk adjust the provider indicators
If you have APR-DRG software available
If you do not have APR-DRG software
available
Preliminary data processing None
Run APR-DRG software to create APR-DRGs
and mortality indicators None
Setting the APRDRGFG parameter in
CONTROL_IQISAS Set to equal zero Set to equal one Set to equal zero
Setting the APR_DRG APRDRG_RISK_MORTAL
ITY and XPRDRG_RISK_MORTAL
ITY parameters in CONTROL_IQISAS
No action required
Set to equal the names of the variables output
from the APR-DRG software
Set to equal zero
84 Program 4 Run IQSASP2
For all but the volume indicators (IQI 01-07) the IQSASP2 program calculates the observed or raw rates for the provider-level Inpatient Quality Indicators using the data derived in a previous step (IQSAS1) These observed rates are stratified by combinations of providers sex age race and payer categories The program first totals the indicator flags created by the
Inpatient Quality Indicators (IQI) Software Instruction SAS
Inpatient Quality Indicators (IQI) 25 Version 43 (August 2011)
IQSAS1 program and then for each of the desired stratifiers divides these totals by the hospital discharges in the universe for the indicator The population denominators are stored in variables with names that have a prefix of ldquoPrdquo (Pop) The Observed rates are stored in variables that have a prefix of ldquoOrdquo Input
1 The SAS dataset that was created in the IQSAS1 This dataset is a discharge-level file that contains inpatient records with input variables stratifiers and the 30 flag indicators for the IQI Provider outcomes of interest
2 SAS format library (FMTLIB) created from the IQFMT program
Output
1 SAS dataset with summary records that contain observed rates (OPIQxx variables where lsquoxxrsquo refers to the indicator number) the counts of outcomes that formed the numerators of the rates (TPIQxx variables) and the hospital discharge totals that formed the denominators of the observed rates (PPIQxx variables) It also includes variables indentifying present on admission (POA) and conditions for provider based outcomes of interest (QPQIxx) The output file has records summarized to the various combinations of stratifiers specified in the TYPELVLP parameter that is described in item number 4 in the ldquoChangesrdquo section below Note that the observed rates and the denominator totals are not generated for the Provider volume indicators (IQI 01-07)
2 An optional ASCII (comma delimited) text file that the user can then import into a
spreadsheet This text file contains the same information as the SAS output dataset The text file will contain the OPIQxx observed rates the TPIQxx counts of outcomes that formed the numerators of the rates and the PPIQxx counts of outcomes that formed the denominators of the rates The different recordsrows in the text file will correspond to the different TYPELVLP stratification combinations
3 A PROC MEANS (with N NMISS MIN MAX MEAN and SUM) of the provider-
level summary records that shows statistics for the OPIQxx observed rates the TPIQxx counts of outcomes that formed the numerators of the rates and the PPIQxx counts of outcomes that formed the denominators of the rates These means will only be generated if the user included a value of 16 for the TYPELVLP parameter discussed in item 4 in the ldquoChangesrdquo section below
4 A PROC CONTENTS of the output SAS summary dataset is output to hardcopy
5 A PROC PRINT of the output summary dataset is provided at the end of the hardcopy
printout This printout may be quite large depending on the number and the types of stratifications that the user requests with the TYPELVLP parameter discussed in item number 4 in the ldquoChangesrdquo section below If the user does not wish to generate this printout then the global ldquoPRINTrdquo parameter in CONTROL_IQISAS code should be set to zero
Inpatient Quality Indicators (IQI) Software Instruction SAS
Inpatient Quality Indicators (IQI) 26 Version 43 (August 2011)
Changes 1 The ldquoFILENAME CONTROLrdquo statement at the beginning of the program must be
changed to reflect the location of the CONTROL_IQISAS code 2 In CONTROL_IQISAS specify the locations (paths) of the input and output SAS
files in the ldquoLIBNAME INP2rdquo and ldquoLIBNAME OUTP2rdquo statements
3 In CONTROL_IQISAS specify the names of the input and output files in the ldquoINFILE1rdquo and ldquoOUTFILP2rdquo statements The name that you specify with INFILE1 should be for the file that you created using the IQSAS1 program
4 In CONTROL_IQISAS specify the levels of aggregation for the observed rates This
step is done by specifying numbers between 0 and 31 in the ldquoLET TYPELVLP =rdquo statement Each number from 0 to 31 corresponds to a different level or combination of levels as shown in Table 6 The default values of 0 16 will provide an overall total and provider-level totals
If TYPELVLP includes the value 0 then the first observation in the output summary data file will contain the overall totals and observed rates for the entire database created with the IQSAS1 program
5 In CONTROL_IQISAS if you wish to create an ASCII (comma delimited) text file that you can import into a spreadsheet then set the TEXTP2 parameter to 1 Otherwise the default value of zero for TEXTP2 will skip around the code that would generate this file
6 In CONTROL_IQISAS if you wish to create an ASCII (comma delimited) text file
that you can import into a spreadsheet then specify the path (including the file name) for this ASCII text file in the FILENAME IQTEXTP2rdquo statement
Inpatient Quality Indicators (IQI) Software Instruction SAS
Inpatient Quality Indicators (IQI) 27 Version 43 (August 2011)
Table 6 IQSASP2 Aggregation Possibilities
TYPELVLP Stratification 0 Overall 1 Race 2 Payer 3 Payer Race 4 Sex 5 Sex Race 6 Sex Payer 7 Sex Payer Race 8 Age 9 Age Race 10 Age Payer 11 Age Payer Race 12 Age Sex 13 Age Sex Race 14 Age Sex Payer 15 Age Sex Payer Race 16 Provider 17 Provider Race 18 Provider Payer 19 Provider Payer Race 20 Provider Sex 21 Provider Sex Race 22 Provider Sex Payer 23 Provider Sex Payer Race 24 Provider Age 25 Provider Age Race 26 Provider Age Payer 27 Provider Age Payer Race 28 Provider Age Sex 29 Provider Age Sex Race 30 Provider Age Sex Payer 31 Provider Age Sex Payer Race
0 and 16 TYPELVLP (overall and provider) are default values for the level of computation in the software
For example if you are using a state inpatient hospital database you might specify the following TYPELVLP values
0 ndash provides overall rates for your entire state 8 ndash provides overall rates for your state broken down by age groups 16 ndash provides rates for providers within your state 24 ndash provides rates for age groups within these providers
85 Program 5 Run IQSASP3
The IQSASP3 program calculates risk-adjusted rates by patient age sex and APR-DRG if available for each IQI and then calculates smoothed rates The risk-adjusted and smoothed rates are not calculated for the Provider volume indicators IQI 01-07 just as observed rates were not calculated for these indicators
Inpatient Quality Indicators (IQI) Software Instruction SAS
Inpatient Quality Indicators (IQI) 28 Version 43 (August 2011)
The programs calculate risk-adjusted IQI rates regardless of the number of cases available However IQI rates based on only a few cases should be interpreted with caution
The output file has records summarized to the various combinations of stratifiers that were specified in the TYPELVLP parameter of the preceding IQSASP2 program See Table 6 on page 27 Input
1 SAS format library (FMTLIB) created from the IQFMT program 2 The discharge-level file that was created with the IQSAS1 program
3 The SAS dataset with summary records that was created with the IQSASP2 program 4 A text file containing regression coefficients from a regression that was run on a
reference SID dataset These coefficients will be used in the risk-adjustment process Two files are provided as part of the IQI module Gee_piqxx_RegressionAnalysisGeecsv contains the regression coefficients Prediction_PIQxxxml contains the input parameters for the executable AHRQexe
Users must create a directory ldquoCAHRQQI AHRQPredictionrdquo and copy the
executable AHRQexe to that directory (along with 5 other files) Users must also create a directory ldquoCAHRQQIIQIrdquo and copy the zip file IQI_GEE_Input_Fileszip to that directory Extract all of the files from IQI_GEE_Input_Fileszip into the directory ldquoCAHRQQIIQIrdquo (See version 43 introduction on page 1)
5 A text file containing three arrays for use in the smoothing process The arrays
contain noise estimates signal estimates and mean area rates for each IQI Specify file MSXIQP42TXT The text file does not need to be converted to a SAS file for use with the software
Output
1 A SAS dataset with an overall summary record and with provider-level summary records that contain the three types of indicator rates along with the components of the initial raw rates Specifically the file contains the observed rates (OPIQxx variables) the risk-adjusted rates (RPIQxx variables) the smoothed rates (SPIQxx variables) the expected rates (EPIQxx variables) the counts of outcomes that formed the numerators of the observed rates (TPIQxx variables) and the hospital discharge totals that formed the denominators of the observed rates (PPIQxx variables) When stratifications other than hospital are selected the RPIQxx variables and their confidence intervals are observedexpected ratios to avoid confounding with risk-adjustment variables
2 An optional ASCII (comma delimited) text file that the user can then import into a
spreadsheet This text file contains the same information as the SAS output dataset
Inpatient Quality Indicators (IQI) Software Instruction SAS
Inpatient Quality Indicators (IQI) 29 Version 43 (August 2011)
The text file will contain the OPIQxx observed rates and their TPIQxx and PPIQxx numerator and denominator components the RPIQxx risk-adjusted rates the SPIQxx smoothed rates and the EPIQxx expected rates Each record or row in the text file will correspond to a specification group
3 A PROC MEANS (with N NMISS MIN MAX MEAN and SUM) of the provider-
level summary records that shows statistics for the observed risk-adjusted and smoothed rates and statistics for the counts of outcomes that formed the numerators and denominators of the observed rates These means will only be generated if the user included a value of 16 for the TYPELVLP parameter of the preceding IQSASP2 program (see Table 6 on page 27)
4 A PROC CONTENTS of the output SAS summary dataset is output to hardcopy
5 A PROC PRINT of the output summary dataset is provided at the end of the hardcopy
printout This printout may be quite large depending on the number and the types of stratifications that the user requested with the TYPELVLP parameter of the preceding IQSASP2 program (see Table 6 on page 27) If the user does not wish to generate this printout then the global ldquoPRINTrdquo parameter in CONTROL_IQISAS code should be set to zero
Changes
1 The ldquoFILENAME CONTROLrdquo statement at the beginning of the program must be changed to reflect the location of the CONTROL_IQISAS code
2 In CONTROL_IQISAS specify the locations (paths) of the input and output SAS
files in the ldquoLIBNAME INP3rdquo and ldquoLIBNAME OUTP3rdquo statements
3 In CONTROL_IQISAS specify in the ldquoINFILE1rdquo statement the name of the discharge-level file that you created with the IQSAS1 program
4 In CONTROL_IQISAS specify in the ldquoFILENAME MSXPrdquo statement the path
(including the file name) for the ASCII text file that contains the estimates to smooth the indicator rates Specify file MSXIQP42TXT
5 In CONTROL_IQISAS specify in the ldquoINFILEP2rdquo statement the name of the
summary file that you created with the IQSASA2 program
6 In CONTROL_IQISAS specify in the ldquoOUTFILP3rdquo statement the name that you wish the output file to have
7 In CONTROL_IQISAS if you wish to create an ASCII (comma delimited) text file
that you can import into a spreadsheet then set the TEXTP3 parameter to 1 Otherwise the default value of zero for TEXTA3 will skip the code that would generate this file
Inpatient Quality Indicators (IQI) Software Instruction SAS
Inpatient Quality Indicators (IQI) 30 Version 43 (August 2011)
8 In CONTROL_IQISAS if you wish to create an ASCII (comma delimited) text file that you can import into a spreadsheet then specify the path (including the file name) for this ASCII text file in the ldquoFILENAME IQTEXTP3rdquo statement
86 Program 6 Run IQSASA2
The IQSASA2 program calculates the observed or raw rates for the area-level Inpatient Quality Indicators using the data derived in a previous step (IQSAS1) These observed rates can be stratified by combinations of area sex age and race categories The program first totals the four area indicator flags created by the IQSAS1 program and then for each of the desired stratifiers divides these totals by the pertinent residential population The population denominators are stored in variables with names that have a prefix of ldquoPrdquo (Pop) The Observed rates are stored in variables that have a prefix of ldquoOrdquo Input
1 The SAS dataset that was created in the IQSAS1 This dataset is a discharge-level file that contains inpatient records with input variables stratifiers and the four new flag indicators for the IQI Area-level outcomes of interest
2 A text file with Census area residential populations stratified by area age sex and
ethnicity categories The file POP95T11TXT is currently provided on the website as a separate download The user should set POPYEAR to the year that best matches the userrsquos discharge data file
Users do not need to convert the ASCII text file to a SAS dataset for use with the software
3 SAS format library (FMTLIB) created from the IQFMT program
Output
1 SAS dataset with summary records that contain observed rates (OAIQxx variables where xx refers to the indicator number) the counts of outcomes that formed the numerators of the rates (TAIQxx variables) and the residential population totals that formed the denominators of the observed rates (PAIQxx variables) The output file has records summarized to the various combinations of stratifiers specified in the TYPELVLA parameter that is described in item number 5 in the ldquoChangesrdquo section below
2 An optional ASCII (comma delimited) text file that the user can then import into a
spreadsheet This text file contains the same information as the SAS output dataset The text file will contain the OAIQxx observed rates the TAIQxx counts of outcomes that formed the numerators of the rates and the PAIQxx residential population totals The different recordsrows in the text file will correspond to the different TYPELVLA stratification combinations
Inpatient Quality Indicators (IQI) Software Instruction SAS
Inpatient Quality Indicators (IQI) 31 Version 43 (August 2011)
3 A PROC MEANS (with N NMISS MIN MAX MEAN and SUM) of the area-level summary records that shows statistics for the OAIQxx observed rates the TAIQxx counts of outcomes that formed the numerators of the rates and the PAIQxx residential populations totals These means will only be generated if the user included a value of 8 for the TYPELVLA parameter discussed in item number 5 in the ldquoChangesrdquo section below
4 A PROC CONTENTS of the output SAS summary dataset is output to hardcopy
5 A PROC PRINT of the output summary dataset is provided at the end of the hardcopy
printout This printout may be quite large depending on the number and the types of stratifications that the user requests with the TYPELVLA parameter discussed in item number 5 in the ldquoChangesrdquo section below If the user does not wish to generate this printout then the global ldquoPRINTrdquo parameter in CONTROL_IQISAS code should be set to zero
Changes
1 The ldquoFILENAME CONTROLrdquo statement at the beginning of the program must be changed to reflect the location of the CONTROL_IQISAS code
2 In CONTROL_IQISAS specify the locations (paths) of the input and output SAS
files in the ldquoLIBNAME INA2rdquo and ldquoLIBNAME OUTA2rdquo statements
3 In CONTROL_IQISAS specify the names of the input and output files in the ldquoINFILE1rdquo and ldquoOUTFILA2rdquo statements The name that you specify with INFILE1 should be for the file that you created using the IQSAS1 program
4 In CONTROL_IQISAS specify the path (including the file name) for the ASCII
population text file in the ldquoFILENAME POPFILE statement The file name will be POP95T11TXT The user should set POPYEAR to the year that best matches the userrsquos discharge data file
5 In CONTROL_IQISAS specify the levels of aggregation for the observed rates This
change is done by specifying numbers between 0 and 15 in the ldquoLET TYPELVLA =rdquo statement Each number from 0 to 15 corresponds to a different level or combination of levels as shown in
Inpatient Quality Indicators (IQI) Software Instruction SAS
Inpatient Quality Indicators (IQI) 32 Version 43 (August 2011)
6 Table 7 The default values of 0 (overall) and 8 (area) will provide an overall total and area-level totals
WARNING TYPELVLA must include the values 0 (overall) and 8 (area) if you wish to subsequently run program IQSASA3 for risk-adjusted and smoothed rates
If TYPELVLA includes the value 0 (overall) then the first observation in the output summary data file will contain the overall totals and observed rates for the entire database created with the IQSAS1 program
Table 7 IQSASA2 aggregation possibilities
TYPELVLA Stratification 0 Overall 1 Race 2 Sex 3 Sex Race 4 Age 5 Age Race 6 Age Sex 7 Age Sex Race 8 Area 9 Area Race 10 Area Sex 11 Area Sex Race 12 Area Age 13 Area Age Race 14 Area Age Sex 15 Area Age Sex Race
0 (overall) and 8 (are) TYPELVLA are default values for the level of computation in the software
For example if you are using a state inpatient hospital database you might specify the following TYPELVLA values
0 ndash provides overall rates for your entire state 4 ndash provides overall rates for your state broken down by age groups 8 ndash provides rates for areas within your state 12 ndash provides rates for age groups within these areas
7 In CONTROL_IQISAS if you wish to create an ASCII (comma delimited) text file
that you can import into a spreadsheet then set the TEXTA2 parameter to 1 Otherwise the default value of zero for TEXTA2 will skip the code that would generate this file
8 In CONTROL_IQISAS if you wish to create an ASCII (comma delimited) text file
that you can import into a spreadsheet then specify the path (including the file name) for this ASCII text file in the ldquoFILENAME IQTEXTA2rdquo statement
Inpatient Quality Indicators (IQI) Software Instruction SAS
Inpatient Quality Indicators (IQI) 33 Version 43 (August 2011)
87 Program 7 Run IQSASA3 The IQSASA3 program calculates age and sex risk-adjusted rates for each area-level IQI
(overall rates and rates by area) and then calculates smoothed rates Input
1 SAS format library (FMTLIB) created from the IQFMT program 2 The discharge-level file that was created with the IQSAS1 program
3 The SAS dataset with summary records that was created with the IQSASA2 program
4 A text file with Census area residential populations (stratified by area sex and
discrete age categories) One file is currently provided along with the IQI module software The file is POP95T11TXT The user should set POPYEAR to the year that best matches the userrsquos discharge data file The text file does not need to be converted to a SAS file for use with the software
5 A text file (COVIQA42TXT) containing regression coefficients from a regression
that was run on the reference SID dataset These coefficients will be used in the risk adjustment process This file is provided to you as part of the IQI module The text file does not need to be converted to a SAS file for use with the software
6 A text file (MSXIQA42TXT) containing two arrays for use in the smoothing process
The arrays contain noise estimates signal estimates and mean area rates for each IQI This file is provided to you as part of the IQI module The text file does not need to be converted to a SAS file for use with the software
Output
1 A SAS dataset with an overall summary record and with area-level summary records that contain the three types of indicator rates along with the components of the initial raw rates Specifically the file contains the observed rates (OAIQxx variables) the risk-adjusted rates (RAIQxx variables) the smoothed rates (SAIQxx variables) the counts of outcomes that formed the numerators of the observed rates (TAIQxx variables) and the residential population totals that formed the denominators of the observed rates (PAIQxx variables) When stratifications other than area are selected the RAIQxx variables and their confidence intervals are observedexpected ratios to avoid confounding with risk-adjustment variables
2 An optional ASCII (comma delimited) text file that the user can then import into a
spreadsheet This text file contains the same information as the SAS output dataset The text file will contain the OAIQxx observed rates and their TAIQxx and PAIQxx components the RAIQxx risk-adjusted rates and the SAIQxx smoothed rates Each record or row in the text file will correspond to a different area
Inpatient Quality Indicators (IQI) Software Instruction SAS
Inpatient Quality Indicators (IQI) 34 Version 43 (August 2011)
3 Outputs to hardcopy are PROC MEANS (with N NMISS MIN MAX MEAN and SUM) of risk-adjusted and smoothed rates in two intermediate work files and of all of the numeric variables in the final output data file The printout also contains a PROC CONTENTS of the output SAS dataset A PROC PRINT of the output dataset is provided only if the ldquoPRINTrdquo parameter in CONTROL_IQISAS code is set to one
6 A PROC MEANS (with N NMISS MIN MAX MEAN and SUM) of the area-level
summary records that shows statistics for the OAIQxx observed rates and their TAIQxx and PAIQxx components the RAIQxx risk-adjusted rates and the SAIQxx smoothed rates
7 A PROC CONTENTS of the output SAS summary dataset is output to hardcopy
8 A PROC PRINT of the output summary dataset is provided at the end of the hardcopy
printout If the user does not wish to generate this printout then the global ldquoPRINTrdquo parameter in CONTROL_IQISAS code should be set to zero
Changes
1 The ldquoFILENAME CONTROLrdquo statement at the beginning of the program must be changed to reflect the location of the CONTROL_IQISAS code
2 In CONTROL_IQISAS specify the locations (paths) of the input and output SAS
files in the ldquoLIBNAME INA3rdquo and ldquoLIBNAME OUTA3rdquo statements
3 In CONTROL_IQISAS specify in the ldquoINFILE1rdquo statement the name of the discharge-level file that you created with the IQSAS1 program
4 In CONTROL_IQISAS specify the path (including the file name) for the ASCII
population text file in the ldquoFILENAME POPFILE3rdquo statement The file name is POP95T11TXT These files are provided along with the software The file used should be the one that is closest to the year associated with your particular data These files contain Census residential estimates by area gender and discrete age categories
5 In CONTROL_IQISAS specify in the ldquoFILENAME COVARArdquo statement the path
(including the file name) for the ASCII text file that contains regression coefficients from a regression that was run on reference SID dataset The name of the file is COVIQA42TXT
6 In CONTROL_IQISAS specify in the ldquoFILENAME MSXArdquo statement the path
(including the file name) for the ASCII text file that contains the estimates to smooth the indicator rates The name of the file is MSXIQA42TXT
7 In CONTROL_IQISAS specify in the ldquoINFILEA2rdquo statement the name of the
summary file that you created with the IQSASA2 program
Inpatient Quality Indicators (IQI) Software Instruction SAS
Inpatient Quality Indicators (IQI) 35 Version 43 (August 2011)
8 In CONTROL_IQISAS specify in the ldquoOUTFILA3rdquo statement the name that you wish the output file to have
9 In CONTROL_IQISAS if you wish to create an ASCII (comma delimited) text file
that you can import into a spreadsheet then set the TEXTA3 parameter to 1 Otherwise the default value of zero for TEXTA3 will skip the code that would generate this file
10 In CONTROL_IQISAS if you wish to create an ASCII (comma delimited) text file
that you can import into a spreadsheet then specify the path (including the file name) for this ASCII text file in the ldquoFILENAME IQTEXTA3rdquo statement
Inpatient Quality Indicators (IQI) Software Instruction SAS
Inpatient Quality Indicators (IQI) 36 Version 43 (August 2011)
90 Reviewing the Printed Output This section contains tips for reviewing some of the printed output from the IQI module
These tips are oriented toward explaining the interrelationships between printout items from different programs and hopefully will help to reveal the nature and structure of the module outputs For guidance in interpreting the results see the Interpretations Guide
The final output of the IQI module is a PROC PRINT from IQSASP3 (for provider-level indicators) and IQSASA3 (for area-level indicators) All interim printouts are for checking and trouble-shooting However if you have elected to refrain from risk-adjusting and smoothing the data then the final outputs will be the PROC PRINT at the end of the IQSASP2 andor IQSASA2 programs
91 IQSAS1
The initial printout from the IQSAS1 program contains PROC MEANS for all of the numeric variables in the output discharge-level dataset It will contain information for the newly constructed TAIQxx and TPIQxx flag variables that will later form the numerators for the indicator rates For each TAIQxx and TPIQxx flag variable
bull The SUM will contain the total number of observations in the dataset that were found to have the particular outcome of interest
bull For the six Provider volume indicators (TPIQ01-TPIQ02 TPIQ04-TPIQ07) and the four Area indicators (TAIQ26-TAIQ29) the MEAN MINIMUM and MAXIMUM will usually be the value one since the flag variables have either been set to missing (lsquorsquo) or to a value of one The remainder of the Provider indicators (TPIQ08-TPIQ09 TPIQ11-TPIQ25 and TPIQ30-TPIQ34) have a value of one zero or missing (lsquorsquo) For these indicators a value of zero was assigned to the TPIQxx flag if a particular observation was part of the population at risk for a particular indicator but did not have the particular outcome of interest So for example TPIQ21 = 1 indicates a patient who had a Cesarean section while TPIQ21 = 0 identifies a patient who had a delivery but not a C-section
bull For the Provider indicators TPIQ08-TPIQ09 TPIQ11-TPIQ25 and TPIQ30-TPIQ34 the MEANs will contain a close approximation of the eventual overall observed indicator rates The values will change slightly after IQSASP2 has applied additional parts of the indicator definitions
bull N lists the number of observations in the dataset with non-missing values For the six provider-based volume indicators and the four area-level indicators N for TPIQxx or TAIQxx will be the same as the SUM For the other provider-based indicators N will contain the denominator for the observed indicator rate Note the Nrsquos or denominators for six of the mortality indicators (ie IQI 08-12 30 and 31) will be similar to the Ns and SUMs for the six volume indicators (TPIQ01-TPIQ02 TPIQ04-TPIQ07) but often they will not be exactly identical (eg the mortality indicators exclude discharges that were transferred to other hospitals)
Inpatient Quality Indicators (IQI) Software Instruction SAS
Inpatient Quality Indicators (IQI) 37 Version 43 (August 2011)
The IQSAS1 printout also contains a PROC CONTENTS that lists all of the variables in the output dataset including the character variables that are present and a PROC PRINT of the first 24 observations in the output dataset
92 IQSASP2 The purpose of this printout is to provide the observed rates for all provider-level indicators
The default printout shows results by provider but other levels of output (as shown in Table 6) can be specified as well Note that risk-adjusted and smoothed rates are shown in the output from the next program
The printout from the IQSASP2 program contains PROC MEANS on the provider-level summary records for all of the numeric variables in the output summary dataset It will contain information for the newly constructed OPIQxx rates the PPIQxx denominators and the TPIQxx numerators
bull The _TYPE_ variable described in the MEANS table identifies the stratification level for the records in the output data set The _TYPE_ variable corresponds to the TYPELVLP parameter values that were specified (see item number 4 in the ldquoChangesrdquo section for the IQSASP2 program on page 32) In this case _TYPE_ always assumes the value of 16 since only the provider-level records are selected
bull The N statistic for _TYPE_ contains the number of providers in the output summary data set A TPIQxx numerator variable with a value for N that is lower than the N value for _TYPE_ indicates that there were no outcomes of interest for some of the providers Similarly a PPIQxx denominator variable with a lower value for N than _TYPE_ indicates that for some providers there were no hospital discharges with the outcome of interest
bull The MINIMUM value for the TPIQ08-TPIQ25 TPIQ30 and TPIQ31 numerators will usually be zero since values of zero were assigned for observations that were part of the population for the rate denominator but did not have the particular outcome of interest to be included in the rate numerator For the volume indicators (TPIQ01-TPIQ07) the MINIMUM value will be one or higher
For the observed rates the User should NOT report the MEANS displayed here but instead should refer to the overall means in the output dataset that are also present in the subsequent PROC PRINT The MEANS given here are means of hospital means ie all hospitals are given equal weight regardless of the number of discharges in the different hospitals
bull The SUMs for the counter variables TPIQxx and PPIQxx will contain overall file totals for these data elements The SUMs for the observed rates have no intuitive meaning If the ldquoPRINTrdquo parameter in the CONTROL_IQISAS program is set to one the subsequent
PROC PRINT output contains a complete dump of the output summary file Listed for each record are the stratification values the PPIQxx population denominators for the 30 provider indicators the TPIQxx outcome numerators for the 30 provider indicators and the 30 OPIQxx observed rates
Inpatient Quality Indicators (IQI) Software Instruction SAS
Inpatient Quality Indicators (IQI) 38 Version 43 (August 2011)
93 IQSASP3 The PROC PRINT at the end of this program provides your final output (This printout appears if the ldquoPRINTrdquo parameter in the CONTROL_IQISAS program is set to one)
The following table lists the column headers shown on the printed output and describes each
Each indicator is reported in a separate section Values of ldquoxxrdquo correspond to the two-digit IQI number Table 8 Provider level printed output
Column Heading Description Obs Observation 1 (with HOSPID = ldquordquo) is the overall average for the entire dataset
(TYPELVLP = 0) The remaining observations are individual providers or hospitals (TYPELVLP = 16)
HOSPID Identifier for each provider in the dataset AGECAT Age stratification category ndash See Table 6 for TYPELVLP settings SEXCAT Gender stratification category ndash See Table 6 for TYPELVLP settings PAYCAT Payer stratification category ndash See Table 6 for TYPELVLP settings RACECAT Race stratification category ndash See Table 6 for TYPELVLP settings TPIQxx Number of cases in the numerator PPIQxx Number of cases in the denominator (population at risk) OPIQxx Observed (raw) rate ndash Numerator divided by Denominator EPIQxx Expected rate ndash Rates the provider would have if it performed the same as the
reference population given the providerrsquos actual case-mix (eg age gender modified DRG and comorbidities)
RPIQxx Risk-adjusted rate ndash Accounts for the difference between the case-mix of the reference population and the providerrsquos case-mix When stratifications other than hospital or area are selected the RPIQxx variables and their confidence intervals are observedexpected ratios to avoid confounding with risk adjustment variables
LPIQxx Lower limit of confidence interval of risk-adjusted rate UPIQxx Upper limit of confidence interval of risk-adjusted rate SPIQxx Smoothed rate ndash Rates with removal of fluxuation over time XPIQxx Standard error of smoothed rate
Observation 1 (with HOSPID = ) is the overall average for the entire dataset (TYPELVL =
0) The remaining observations are individual providers or hospitals (TYPELVL = 16) Data will appear under the column headers AGECAT SEXCAT PAYCAT and RACECAT if you specify these levels of aggregation (shown in Table 6)
You may wish to express the results in more understandable terms
bull Multiply the mortality rates by 100 to express them as a percentage (eg 00338 100 = 34 mortality for CABG)
bull Multiply the utilization rates by 100 to express them as a percentage (eg 02040 100 = 204 C-section rate)
Inpatient Quality Indicators (IQI) Software Instruction SAS
Inpatient Quality Indicators (IQI) 39 Version 43 (August 2011)
The MEANS table is generated from the permanent provider-based output file and is provided for trouble-shooting and understanding your data but not for reporting The means are provided just for the provider level summary records
bull The N for all but the TPIQxx counter variables should contain the number of providers in the userrsquos database
bull The MEANS MINIMUMs and MAXIMUMs have their normal meaning and provide comparisons among the different hospitals or providers in your database
For the (observed risk-adjusted or smoothed) rates the User should NOT report the MEANS displayed here but instead refer to the overall means in the output dataset in the PROC PRINT labeled ldquoFINAL OUTPUTrdquo The MEANS given here are means of hospital means ie all hospitals are given equal weight regardless of the number of discharges in the different hospitals
bull Note The denominators for six of the mortality indicators ( 8 ndash 12 30 and 31) will be similar to the totals for the six volume indicators (TPIQ01-TPIQ07) but often they will not be exactly identical (eg the mortality indicators exclude discharges that were transferred to other hospitals)
bull If the ldquoPRINTrdquo parameter in the CONTROL_IQISAS program is set to one at the end of the printout is a PROC PRINT on the final provider-based output file Listed for each level of stratification are the stratifiers the numerator and denominator totals for the observed rates and the observed risk-adjusted and smoothed rates
94 IQSASA2
The purpose of this printout is to provide the observed rates for all area-level indicators The default printout shows overall results and results by area but other levels of output (as shown in Table 6) can be specified as well Note that risk-adjusted and smoothed rates are shown in the output from the next program
The printout from the IQSASA2 program contains PROC MEANS for all of the numeric variables in the output summary dataset It will contain information for the newly constructed OAIQxx rates the PAIQxx denominators and the TAIQxx numerators
bull The _TYPE_ variable described in the first row of the MEANS table identifies the stratification level for the records in the output data set The _TYPE_ variable corresponds to the TYPELVLA parameter values that were specified (see item 5 in the ldquoChangesrdquo section for the IQSASA2 program on page 31) In this case _TYPE_ always assumes the value of 8 since only the area-level records are selected
bull The N statistic for _TYPE_ contains the number of areas in the output summary data set A TAIQxx numerator variable with a lower value for N than _TYPE_ indicates that there were no outcomes of interest for some of the areas
bull The MINIMUM value for the TAIQxx numerators will be one or higher
Inpatient Quality Indicators (IQI) Software Instruction SAS
Inpatient Quality Indicators (IQI) 40 Version 43 (August 2011)
For the observed rates the User should NOT report the MEANS displayed here but instead should refer to the overall means in the output dataset that are also present in the subsequent PROC PRINT The MEANS given here are means of the area means ie all areas are given equal weight regardless of the population in the different areas
bull The SUMs for the counter variables TAQIxx and PAIQXX will contain overall file totals for these data elements The SUMs for the observed rates have no intuitive meaning
If the ldquoPRINTrdquo parameter in the CONTROL_IQISAS program is set to one the subsequent
PROC PRINT output contains a complete dump of the output summary file Listed for each record are the stratification values the PAIQxx population denominators for the four indicators the TAIQxx outcome numerators for the four indicators and the four OAIQxx observed rates
95 IQSASA3 The PROC PRINT at the end of this program provides your final output (This printout appears if the ldquoPRINTrdquo parameter in the CONTROL_IQISAS program is set to one)
The following table lists the column headers shown on the printed output and describes each
Each indicator is reported in a separate section Values of ldquoxxrdquo correspond to the two-digit IQI number Table 9 Area level printed output
Column Heading Description
Obs Observation 1 is the overall average for the entire dataset (TYPELVLA = 0) The remaining observations are individual areas (TYPELVLA = 8)
Area Identifier in the dataset for area TAIQxx Number of cases in the numerator PAIQxx Number of cases in the denominator (population at risk) OAIQxx Observed (raw) rate ndash Numerator divided by Denominator RAIQxx Risk-adjusted rate ndash Accounts for the difference between the case-mix of the
reference population and the arearsquos case-mix When stratifications other than hospital or area are selected the RPIQxx variables and their confidence intervals are observedexpected ratios to avoid confounding with risk adjustment variables
SAIQxx Smoothed rate ndash Rates with removal of fluxuation over time
Observation 1 (with AREA = blank) is the overall average for the entire dataset (TYPELVL = 0) The remaining observations are individual areas (TYPELVL = 8)
You may wish to express the results in more understandable terms
bull Multiply the utilization rates by 100000 to express them as a rate per 100000 population (eg 0000494 100000 = 494 hysterectomies per 100000 population)
The MEANS table is generated from the permanent area-level output file The means are
provided just for the area-level summary records
Inpatient Quality Indicators (IQI) Software Instruction SAS
Inpatient Quality Indicators (IQI) 41 Version 43 (August 2011)
bull The N for all but the TAIQxx counter variables should contain the number of different areas (Metro Areas and counties) in your database
bull The MEANs MINIMUMs and MAXIMUMs have their normal meaning and provide comparisons among the different areas in your database Note that the MAXIMUMs for the counter variables (the TAIQxx and PAIQxx variables) are associated with specific areas and therefore these MAXIMUMs may not match those in the prior IQSAS2 printouts since that run typically will include a record for the entire database
For the (observed risk-adjusted or smoothed) rates the User should NOT report the MEANS displayed here but instead refer to the overall means in the output dataset that are also present in the subsequent PROC PRINT The MEANS given here are means of area means ie all areas are given equal weight regardless of the number of discharges in the different areas
bull The SUMs of the counter variables (the TAIQxx and PAIQxx variables) yield the overall database totals
Inpatient Quality Indicators (IQI) Software Instruction SAS
Inpatient Quality Indicators (IQI) 42 Version 43 (August 2011)
100 Benchmark Timings The benchmark runtimes given below are from runs made on a Windows XP workstation
with a Pentium 4 CPU 280 GHz processor 512 MB of RAM and an IDE hard drive The dataset used contained 757624 observations with 15 diagnosis fields and 15 procedure fields
Step Run time (in seconds) Run IQFMTS to create the format library 2 Run IQSAS1 157 Run IQSASP2 21 Run IQSASP3 86 Run IQSASA2 10 Run IQSASA3 185
101 User Support Technical assistance is available through an electronic user support system monitored by the
QI support team to support users in their application of the IQI software The same e-mail address may be used to communicate to AHRQ any suggestions for IQI enhancements general questions and any QI related comments you may have AHRQ welcomes your feedback
The Internet address for user support and feedback is supportqualityindicatorsahrqgov AHRQ also offers a listserv to keep you informed on the Quality Indicators (QIs) The
listserv is used to announce any QI changes or updates new tools and resources and to distribute other QI related information This is a free service Simply follow the process described below to begin receiving important QI information All you need is a computer Internet access and an E-mail address It works just like other electronic distribution lists
Herersquos how to register 1 Send an E-mail message to listservqualityindicatorsahrqgov 2 On the subject line type Subscribe For example Subscribe
3 In the body of the message type sub Quality_Indicators-L and your full name For example sub Quality_Indicators-L John Doe
4 You will receive a message confirming that you are signed up If you have any questions contact AHRQ QI Support at the e-mail noted above You should
receive an automatic response e-mail message confirming receipt of your e-mail If you do not receive a confirmation message call (888) 512-6090
Inpatient Quality Indicators (IQI) Software Instruction SAS
Inpatient Quality Indicators (IQI) 43 Version 43 (August 2011)
Appendix A Links The following links may be helpful to users of the AHRQ Inpatient Quality Indicators
Inpatient Quality Indicators Version 43 Documents and Software Available at httpwwwqualityindicatorsahrqgovmodulesiqi_resourcesaspx and httpwwwqualityindicatorsahrqgovsoftwaredefaultaspx
Title Description
IQI User Guide Individual Measures
The user guide provides a technical overview of the IQI individual measures including literature and empirical evidence
IQI User Guide Composite Measures
The user guide provides a technical overview of the IQI composite measures
IQI Technical Specifications
Provides detailed definitions of each IQI including all ICD-9-CM and DRG codes that are included in or excluded from the numerator and denominator Note that exclusions from the denominator are automatically applied to the numerator
IQI Comparative Data This document provides the average volume provider rate and population rate as appropriate for each indicator
Fiscal year 2011 Coding Changes
This document summarizes the changes to the indicator definitions resulting from FY 2011 changes to ICD-9-CM coding and DRG changes These changes will only affect data from FY 2011 (October 1 2011) or later
Log of Changes to IQI Documents and Software
The Change Log document provides a cumulative summary of all changes to the IQI software software documentation and other documents made since the release of version 21 of the software in March 2003 Changes to indicator specifications that were not a result of new ICD-9-CM and DRG codes are also described in the Change Log
IQI Risk Adjustment Coefficient Tables
Tables for each IQI provide the stratification and coefficients used to calculate the risk-adjusted rate for each strata
SASreg IQI Software Documentation
This software documentation provides detailed instructions on how to use the SAS reg version of the IQI software including data preparation calculation of the IQI rates and interpretation of output
SASreg IQI Software Requires the SASreg statistical program distributed by the SAS Institute Inc The company may be contacted directly regarding the licensing of its products httpwwwsascom
3Mreg APRreg DRG Limited License Grouper for SASreg
Creates APR-DRG variables for use with SAS version of IQI software Instructions for running the software are included in the Zip file
Version 43 Listserv announcement
This document announces the release of the Version 43 software and documentation provides a summary of changes and links to relevant pages
Inpatient Quality Indicators (IQI) Software Instruction SAS
Inpatient Quality Indicators (IQI) 44 Version 43 (August 2011)
AHRQ QI Windows Application The AHRQ QI Windows Application calculates rates for all of the AHRQ Quality Indicators modules and does not require SASreg It is available at
httpwwwqualityindicatorsahrqgovwinqi_downloadhtm Additional Documents The following documents are available within the Archive section of the AHRQ QI Web page
httpwwwqualityindicatorsahrqgovArchivedefaultaspxiqi
bull Refinement of the HCUP Quality Indicators (Technical Review) May 2001 bull Refinement of the HCUP Quality Indicators (Summary) May 2001
In addition these documents may be accessed at the AHRQ QI Modules Web page
httpwwwqualityindicatorsahrqgovmodulesDefaultaspx bull AHRQ QI Measure Development Implementation Maintenance and Retirement bull ICD-9-CM to ICD-10-CMPCS Conversion of AHRQ QI March 2011 bull AHRQ QI Empirical Methods May 2011 bull Guidance for Using the AHRQ Quality Indicators for Hospital-level Public Reporting
or Payment August 2004 bull AHRQ Summary Statement on Comparative Hospital Public Reporting December
2005 bull Appendix A Current Uses of AHRQ Quality Indicators and Considerations for
Hospital-level bull Comparison of Recommended Evaluation Criteria in Five Existing National
Frameworks bull List of AHRQ QI Endorsed by the National Quality Forum
The following documents can be viewed or downloaded from the AHRQ QI News Web page
httpwwwqualityindicatorsahrqgovnewsdefaultaspx and httpwwwqualityindicatorsahrqgovArchiveNewsaspx bull February 2007 Newsletter - Year highlights and future plans bull February 2006 Newsletter ndash Year highlights and future plans bull 2006 Area Level Indicator Changes bull Considerations in Public Reporting for the AHRQ QI bull June 2005 Newsletter - Contains the article Using Different Types of QI Rates
Inpatient Quality Indicators (IQI) Software Instruction SAS
Inpatient Quality Indicators (IQI) 45 Version 43 (August 2011)
Other Tools and Information
IQI rates can be calculated using the modified Federal Information Processing Standards (FIPS) Statecounty code A list of codes is available at
httpwwwcensusgovpopestgeographiccodes02pdf
AHRQ provides a free on-line query system based on HCUP data that provides access to health statistics and information on hospital stays at the national regional and State level It is available at
httphcupahrqgovHCUPnetasp
Information on the 3Mtrade APR-DRG system is available at
httpwww3mcomushealthcarehisproductscodingrefined_drgjhtml
Inpatient Quality Indicators (IQI) Software Instruction SAS
Inpatient Quality Indicators (IQI) 46 Version 43 (August 2011)
Appendix B Using Different Types of QI Rates When should you use the observed expected risk adjusted andor smoothed rates generated
by the AHRQ QI software Here are some guidelines If the userrsquos primary interest is to identify cases for further follow-up and quality
improvement then the observed rate would help to identify them The observed rate is the raw rate generated by the QI software from the data the user provided Areas for improvement can be identified by the magnitude of the observed rate compared to available benchmarks andor by the number of patients impacted
Additional breakdowns by the default patient characteristics used in stratified rates (eg age gender or payer) can further identify the target population Target populations can also be identified by user-defined patient characteristics supplemented to the casedischarge level flags Trend data can be used to measure change in the rate over time
Another approach to identify areas to focus on is to compare the observed and expected rates The expected rate is the rate the provider would have if it performed the same as the reference population given the providerrsquos actual case-mix (eg age gender DRG and comorbidity categories)
If the observed rate is higher than the expected rate (ie the ratio of observedexpected is greater than 10 or observed minus expected is positive) then the implication is that the provider performed worse than the reference population for that particular indicator Users may want to focus on these indicators for quality improvement
If the observed rate is lower than the expected rate (ie the ratio of observedexpected is less than 10 or observed minus expected is negative) then the implication is that the provider performed better than the reference population Users may want to focus on these indicators for identifying best practices
Users can also compare the expected rate to the reference population rate reported in the AHRQ QI software or Comparative Data document to determine how their case-mix compares to the reference population The population rate refers to the overall rate for the reference population The reference population is defined in the Comparative Data Document If the population rate is higher than the expected rate then the providerrsquos case-mix is less severe than the reference population If the population rate is lower than the expected rate then the providerrsquos case-mix is more severe than the reference population
We use this difference between the population rate and the expected rate to ldquoadjustrdquo the observed rate to account for the difference between the case-mix of the reference population and the providerrsquos case-mix which is the providerrsquos risk-adjusted rate
If the provider has a less severe case-mix then the adjustment is positive (population rate gt expected rate) and the risk-adjusted rate is higher than the observed rate If the provider has a more severe case-mix then the adjustment is negative (population rate lt expected rate) and the risk-adjusted rate is lower than the observed rate The risk-adjusted rate is the rate the provider would have if it had the same case-mix as the reference population given the providerrsquos actual performance
Finally users can compare the risk-adjusted rate to the smoothed or ldquoreliability-adjustedrdquo rate to determine whether this difference between the risk-adjusted rate and reference population rate is likely to remain in the next measurement period Smoothed rates are weighted averages of the population rate and the risk-adjusted rate where the weight reflects the reliability of the providerrsquos risk-adjusted rate
Inpatient Quality Indicators (IQI) Software Instruction SAS
Inpatient Quality Indicators (IQI) 47 Version 43 (August 2011)
A ratio of (smoothed rate - population rate) (risk-adjusted rate - population rate) greater than 080 suggests that the difference is likely to persist (whether the difference is positive or negative) A ratio less than 080 suggests that the difference may be due in part to random differences in patient characteristics (patient characteristics that are not observed and controlled for in the risk-adjustment model) In general users may want to focus on areas where the differences are more likely to persist
Inpatient Quality Indicators (IQI) Software Instruction SAS
Inpatient Quality Indicators (IQI) 48 Version 43 (August 2011)
Appendix C IQI Input Data Dictionary Variable name Description Format Value description Comments
KEY Sequence number Unique case identifier Numeric
User defined unique numeric identifier for each discharge record
Not used by the QI programs but should be present to facilitate possible exploration allows user to link the records from the IQSAS1SAS program output file back to the original input data file
AGE Age in years at admission Numeric Age in years
If this data element is missing the discharge record will be excluded from analysis
AGEDAY Age in days (coded only when the age in years is less than 1) Numeric Age in days
Not used in the IQI program If not present in the input data file it is not necessary to create a dummy variable for this module
RACE Race of patient Numeric 1 2 3 4 5 6
White Black Hispanic Asian or Pacific Island Native American Other
The values of 1-5 are used directly in the QI software All other ethnicity codes are mapped to an lsquootherrsquo category
SEX Sex of patient Numeric
1 2
Male Female
If this data element is missing the discharge record will be excluded from the analysis
PAY1 Expected primary payer
Numeric 1 2 3 4 5 6
Medicare Medicaid Private incl HMO Self-pay No charge Other
The values of 1 2 3 and 4 are used directly in the QI software All other payer codes are mapped to an lsquootherrsquo category This data element is used to stratify only the Provider-level IQI (IQI-01 toIQI-25 IQI-30 to IQI-34)
PAY2 (SAS Only)
Expected secondary payer
Numeric 1 2 3 4 5 6
Medicare Medicaid Private incl HMO Self-pay No charge Other
Use is optional but must be present in data (set to missing if data element not available)
PSTCO
Location of patient residence or hospital location (FIPSdagger Statecounty code)
Numeric ssccc
Modified Federal Information Processing Standards Statecounty code2
See Appendix A for link to most recent list of codes If this data element is missing the discharge record will be excluded from rate calculations
HOSPID Data Source hospital number Numeric Hospital
identification number Used to facilitate data exploration and possible trouble shooting
2 Federal Information Processing Standard as defined by the US Department of Commerce National Institute of Standards and Technology (formerly National Bureau of Standards) Note Certain independent cities (Baltimore City Carson City and St Louis City) and areas within Hawaii and Virginia are assigned to different area groupings in the Modified FIPS categories as compared to the US Census Bureau groupings The AHRQ QI software uses the Modified FIPS code assignment of these areas Failure to use the Modified FIPS codes assignment will result in the use of incorrect denominator estimates for area indicators A list is available at httpwwwcensusgovpopestgeographiccodes02pdf
Inpatient Quality Indicators (IQI) Software Instruction SAS
Inpatient Quality Indicators (IQI) 49 Version 43 (August 2011)
Variable name Description Format Value description Comments
DISP Disposition of patient
Numeric 1 2 3 4 5 6 7 20
Routine Short-term hospital Skilled nursing facility Intermediate care Another type of facility Home health care Against medical advice Died in the hospital
The values 2 and 20 are referenced by the QI code (to identify transfers to another short-term hospital and patients who died in the hospital)
MORT30 (SAS Only)
30-Day Mortality Indicator Numeric
0 ndash not died within 30-days from admission
Use is optional but must be present in data (set to missing if data element not available)
1 ndash died within 30-days from admission
DNR Do Not Resuscitate Indicator Numeric
0 ndash No ldquoDo Not Resuscitaterdquo Indicator
Use is optional but must be present in data (set to missing if data element not available)
1 ndash ldquoDo Not Resuscitaterdquo Indicator
ATYPE Admission Type Numeric 1 2 3 4 5 6
Emergency Urgent Elective Newborn Trauma Center3 Other
Not used by the IQI program If not present in the input data file it is not necessary to create a dummy variable
ASOURCE Admission Source
Numeric 1 2 3 4 5
ER Another hospital Another facility including LTC Courtlaw enforcement Routinebirthother
The value 2 is referenced by the QI code (to identify transfers from another short-term hospital)
LOS Length of Stay Numeric Number of days from admission to discharge
Not used by the IQI program If not present in the input data file it is not necessary to create a dummy variable
APR_DRG APR-DRG category Numeric APR-DRG from 3Mreg software
Although the IQI module will operate without these variables users should run APR-DRG software on their raw data to assign this variable to each case See Section 53 on page 15
APRDRG_ RISK_ MORTALITY
APR-DRG Mortality Score Numeric
APR-DRG Risk of Mortality Score from 3Mreg software
See Section 53 on page 15
XPRDRG_ RISK_ MORTALITY
APR-DRG Mortality Score with POA Numeric
APR-DRG Risk of Mortality Score from 3Mreg Software using
See Section 53 on page 15
3 The ATYPE value ldquo5rdquo was used to indicate delivery only in the 1988 to 1997 HCUP data files The UB standards currently use ldquo5rdquo to indicate Trauma Center
Inpatient Quality Indicators (IQI) Software Instruction SAS
Inpatient Quality Indicators (IQI) 50 Version 43 (August 2011)
Variable name Description Format Value description Comments
POA information
DRG Diagnosis Related Group Numeric DRG from federal (CMS) DRG Grouper
DRGVER Diagnosis Related Group Version Numeric
DRG Version of federal (CMS) DRG Grouper
eg Version 28 for FY2011
MDC Major Diagnostic Category Numeric MDC from federal (CMS) DRG grouper
DISCWT Weight to assign to discharge Numeric Format as nnnnn
Cases with missing values are assigned a value of 1 Assigning a weight of zero has the effect of removing the case from the analysis
DX1 ndash DX30
ICD-9-CM diagnosis codes DX1 is the principal diagnosis DX2-DX30 are secondary diagnoses
String 3 4 or 5
characters (do not include decimal point)
Diagnosis codes Users must specify the number of diagnoses in the parameter ampNDX in CONTROL_IQISAS program
DXPOA1- DXPOA30-
Present on admission indicator for each diagnosis code
String
1 = present at the time of inpatient admission
These data will be used in risk adjustment and smoothing if the alternative parameter files of risk-adjustment covariates and population rates is specified
(YWE1)
0 = not present at the time of inpatient admission
(NUrsquo0rsquo )
NDX Count of the number of diagnoses (DX) on the discharge record
Numeric
Count of diagnoses (principal and all secondary diagnoses)
Not used by the IQI SAS program If not present in the input data file it is not necessary to create a dummy variable Definition is If the 1st discharge record has 1 Pr and the 2nd has 2 NPR would be 1 for the 1st record and 2 for the 2nd
PR1 ndash PR30
ICD-9-CM procedure codes PR1 is the principal procedure PR2-PR30 are secondary procedures
String 3 or 4
characters (do not include decimal point)
Procedure code
Users with more or fewer secondary procedures should modify the parameter ampNPR in CONTROL_IQISAS to reflect the number of diagnoses
NPR Count of the number of procedures (PR) on the discharge record
Numeric
Count of procedures (principal and all secondary procedures)
Not used by the IQI SAS program If not present in the input data file it is not necessary to create a dummy variable Definition is If the 1st discharge record has 1 Pr and the 2nd has 2 NPR would be 1 for the 1st record and 2 for the 2nd
Inpatient Quality Indicators (IQI) Software Instruction SAS
Inpatient Quality Indicators (IQI) 51 Version 43 (August 2011)
Variable name Description Format Value description Comments
POINTOFORIGINUB04
Point of Origin Numeric 4 Transfer from a hospital 5 Transfer from a skilled Nursing Facility (SNF) or Intermediate Care Facility (ICF)
Only these values are used by the QI programs
6 Transfer from another health care facility
IF ATYPE = 4
5 Born inside this hospital
6 Born outside of this hospital
PRDAY1 ndash PRDAY30
Days from admission to procedure PR1 is the principal procedure PR2-PR30 are secondary procedures
Numeric Days from Admission to Procedure4
Not used by the IQI program If not present in the input data file it is not necessary to create a dummy variable for this module
YEAR
Year of discharge The patientrsquos year of discharge For example a patient discharged on July 7 2004 would have a discharge year of lsquo2004rsquo
Numeric
YYYY
Discharge year should be within the range of 1997 to 2011
DQTR Quarter of discharge The calendar quarter of the patientrsquos discharge For example a patient discharged on July 7 2004 would have a discharge quarter of lsquo3rsquo
Numeric 1 January-March 2 April-June 3 July-September 4 October-December
See httphcup-usahrqgovtoolssoftwarecomorbiditycomorbidityjsp
4 Variables PRDAY1 to PRDAY30 are defined as the number of days from date of admission to date of procedure for each procedure For example if the patient was admitted on June 15th and had two procedures - the principal procedure on June 15th and a second procedure on June 18th ndash then the value of PRDAY1 would be zero (0) and the value of PRDAY2 would be three (3) For more information consult the HCUP data documentation at httpwwwhcup-usahrqgovdbvarsprdaynnisnotejsp
Inpatient Quality Indicators (IQI) Software Instruction SAS
Inpatient Quality Indicators (IQI) 52 Version 43 (August 2011)
Appendix D SAS IQI Output Data Dictionary SAS IQI Provider Output Column Heading Description Format Comments
Obs Observation 1 (with HOSPID = ) is the overall average for the entire dataset (TYPELVLP = 0) The remaining observations are individual providers or hospitals (TYPELVLP = 16)
Numeric
HOSPID Identifier for each provider in the dataset
Text Up to 12 characters
AGECAT Age stratification category Numeric range
SEXCAT Gender stratification category Numeric 1 = male 2 = female PAYCAT Payer stratification category Numeric 1 = Medicare
2 = Medicaid 3 = Private incl HMO 4 = Self-pay 5 = No charge 6 = Other
RACECAT Race stratification category Numeric 1 = White 2 = Black 3 = Hispanic 4 = Asian or Pacific Island 5 = Native American 6 = Other
TPIQxx The number of discharge records included in the numerator (outcome of interest) as defined for the indicator
Numeric
PPIQxx The number of discharge records included in the denominator (population at risk) as defined for the indicator
Numeric
OPIQxx The rate (observed numerator observed denominator) as defined for the indicator
Numeric
EPIQxx Rate calculated by assuming an average performance for each patient group based on the reference population but with the providerlsquos actual case-mix
Numeric
RPIQxx The estimated rate calculated by adjusting to an average case-mix
Numeric When stratifications other than hospital or area are selected the RPIQxx variables and their confidence intervals are observedexpected ratios to avoid confounding with risk adjustment variables
LPIQxx The lower confidence bound of the risk adjusted rate
Numeric
UPIQxx The upper confidence bound of the risk adjusted rate
Numeric
Inpatient Quality Indicators (IQI) Software Instruction SAS
Inpatient Quality Indicators (IQI) 53 Version 43 (August 2011)
Column Heading Description Format Comments
SPIQxx The smoothed rate calculated using multivariate signal extraction (MSX)
Numeric
XPIQxx Standard error of smoothed rate Numeric VPIQxx Variance for respective indicators Numeric
SAS IQI Area Output Column Heading Description Format Comments
Obs Observation 1 (with HOSPID = ) is the overall average for the entire dataset (TYPELVLP = 0) The remaining observations are individual providers or hospitals (TYPELVLP = 16)
Numeric
AREA Identifier in the dataset for area Text TAIQxx The number of discharge records
included in the numerator (outcome of interest) as defined for the indicator
Numeric
PAIQxx The number of discharge records included in the denominator (population at risk) as defined for the indicator
Numeric
OAIQxx The rate (observed numerator observed denominator) as defined for the indicator
Numeric
RAIQxx The estimated rate calculated by adjusting to an average case-mix
Numeric When stratifications other than hospital or area are selected the RAIQxx variables and their confidence intervals are observedexpected ratios to avoid confounding with risk adjustment variables
SAIQxx The smoothed rate calculated using multivariate signal extraction (MSX)
Numeric
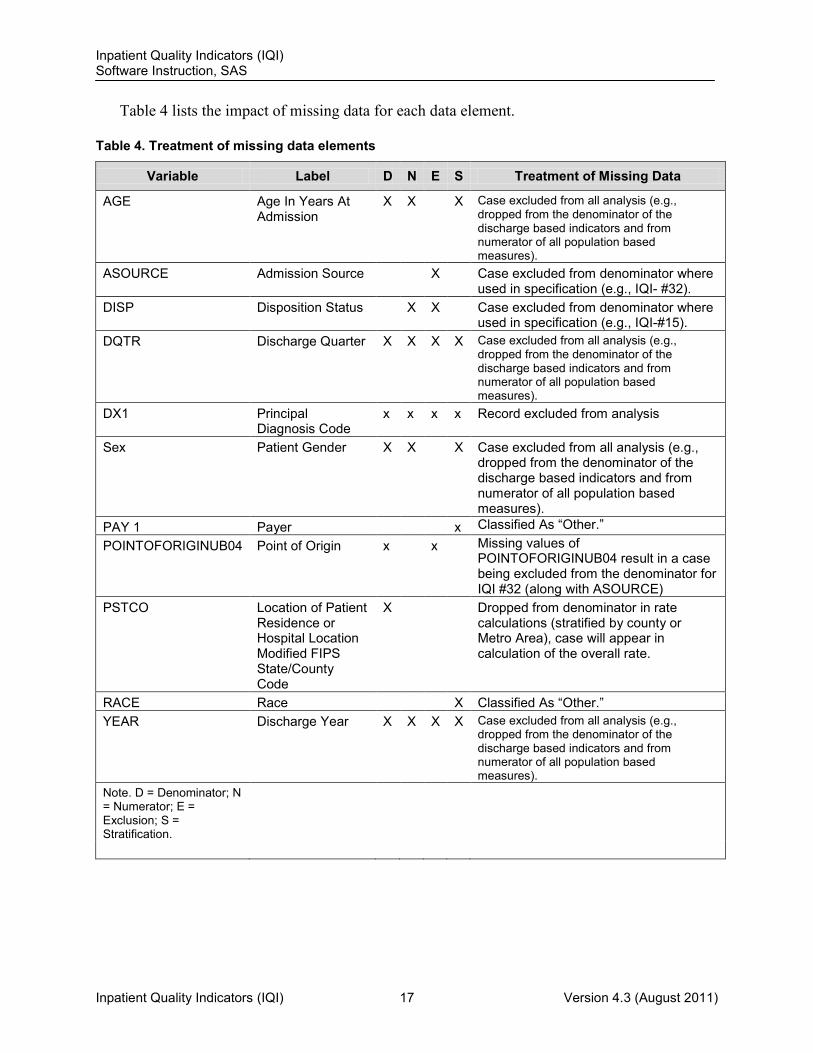
Inpatient Quality Indicators (IQI) Software Instruction SAS
Inpatient Quality Indicators (IQI) 22 Version 43 (August 2011)
The parameters allow these locations to be different from one another However if you wish to read in and write out all of the data to the same location it is easiest to just make a global change in CONTROL_IQISAS changing ldquoCpathnamerdquo to the single directory location that you wish to use
There is a global PRINT parameter in CONTROL_IQISAS that as a default prints all of the output summary records at the end of the IQSASP2 IQSASP3 IQSASA2 and IQSASA3 programs These printouts may be quite large if you have a large database with a large number of hospitals and if you choose the results to be finely stratified If you wish to turn this feature off set PRINT to have a value of zero in CONTROL_IQISAS to turn this feature on set PRINT to have a value of 1
The global MALEVL parameter in CONTROL_IQISAS by default instructs all programs to define geographic areas by county for all areas in the input datasets Refer to Page 14 for a list of values for the MALEVL parameter
82 Program 2 Run IQFMTS
The IQFMTS program defines a format library which contains the diagnosis and procedure screens necessary for assigning the outcomes of interest This format library is used by most of the succeeding programs
The first few formats in this program are for the stratifiers (ie age sex raceethnicity and payer) These are followed by formats that are used for the identification of outcomes of interest in the IQSAS1 program and by formats that map FIPS county codes to Metro Areas in the IQSAS1 IQSASA2 and IQSASA3 programs At the end of the program are formats used to assign age categories for the risk adjustment process implemented in IQSASP3 and IQSASA3 and formats used with APR-DRG categories in IQSASP3 Input None Output Permanent SAS format library (FMTLIB) Changes
1 You must modify the ldquoFILENAME CONTROLrdquo statement at the beginning of the program to change the path so it points to your location of the CONTROL_IQISAS code
2 In CONTROL_IQISAS specify the location (path) of the format library in the
ldquoLIBNAME LIBRARYrdquo statement
83 Program 3 Run IQSAS1 The IQSAS1 program processes hospital discharge abstract data and flags inpatient records if
they contain outcomes of interest Outcome indicator names or numerators have prefix of ldquoTrdquo (Top) Stratifier variables are constructed at the beginning of the program
Inpatient Quality Indicators (IQI) Software Instruction SAS
Inpatient Quality Indicators (IQI) 23 Version 43 (August 2011)
This program assumes that the input data file (consisting of inpatient discharge abstract data) conforms to specific variable names attributes and coding conventions See Table 2 on page 9 for variable names and attributes for the input data file
Partial definitions of the Inpatient Quality Indicators are given in Table 1 on page 8 This table is presented to assist those individuals who desire to examine the software source code statements Complete definitions of the indicators are given in the document Inpatient Quality Indicators Technical Specifications (httpwwwqualityindicatorsahrqgovModulesiqi_overviewaspx) Input
1 User supplied SAS inpatient data set consisting of administrative hospital discharge abstract data This data set is a discharge level file with an array of diagnosis and procedure codes among other data elements
2 SAS format library (FMTLIB) created from the IQFMT program
Output
1 SAS dataset containing inpatient records with input variables stratifiers and flag indicators (TPIQxx and TAIQxx) for the outcomes of interest that will later form the numerators for the IQI rates
2 PROC MEANS (with N NMISS MIN MAX MEAN and SUM) of all of the
numeric variables in the output data file and a PROC CONTENTS of the output data file are output to hardcopy
3 A PROC PRINT of the first 24 observations in the output data file is output to
hardcopy Changes
1 The ldquoFILENAME CONTROLrdquo statement at the beginning of the program must be changed to reflect the location of the CONTROL_IQISAS code
2 In CONTROL_IQISAS specify the locations (paths) of the input and output files in
the ldquoLIBNAME IN0rdquo and ldquoLIBNAME OUT1rdquo statements
3 In CONTROL_IQISAS specify the names of the input and output files in the ldquoINFILE0rdquo and ldquoOUTFILE1rdquo statements
4 To define urban areas by Metro Area rather than by county change the MALEVL
parameter in CONTROL_IQISAS from 0 to 1 2 or 3 Rural areas will be defined by county no matter how MALEVL is specified Refer to page 14 for a list of values for the MALEVL parameter
5 The IQI module assumes that your starting SAS data set contains 30 diagnoses
and 30 procedures If these numbers are different in your input inpatient data then modify the NDX and NPR parameters in CONTROL_IQISAS
Inpatient Quality Indicators (IQI) Software Instruction SAS
Inpatient Quality Indicators (IQI) 24 Version 43 (August 2011)
If your variables are named differently from those used in the IQI software (see Table 1 on page 8) you MUST either rename those variables prior to running this program or modify IQSAS1 to include the renaming of your variables to match those expected by the software Similarly if your variables are not the same type ie character or numeric as those expected by the software (see Table 1) you MUST modify your variables prior to running this program
6 If you wish to use APR-DRG variables in the later IQSASP3 program to risk-adjust
the provider indicators then in CONTROL_IQISAS set the APRDRGFG flag parameter to one If you do not intend to run IQSASP3 to risk-adjust the provider indicators or if you do not have the APR-DRG variables available to you then set APRDRGFG to zero See Table 5 below
7 If you wish to risk-adjust the provider indicators by later running the IQSASP3
program then in CONTROL_IQISAS set the three APRDRG APRDRG_RISK_MORTALITY and XPRDRG_RISK_MORTALITY parameters to be the names of the DRG category variable and the mortality indicators created by APR-DRG software If you do not intend to use APR-DRG software then set the three APRDRG APRDRG_RISK_MORTALITY and XPRDRG_RISK_MORTALITY parameters to equal zero See Table 5 below
Table 5 How to set up IQI parameters and your data for using APR-DRG variables
If you do not intend to risk-
adjust the provider
indicators
If you are going to run IQSASP3 to risk adjust the provider indicators
If you have APR-DRG software available
If you do not have APR-DRG software
available
Preliminary data processing None
Run APR-DRG software to create APR-DRGs
and mortality indicators None
Setting the APRDRGFG parameter in
CONTROL_IQISAS Set to equal zero Set to equal one Set to equal zero
Setting the APR_DRG APRDRG_RISK_MORTAL
ITY and XPRDRG_RISK_MORTAL
ITY parameters in CONTROL_IQISAS
No action required
Set to equal the names of the variables output
from the APR-DRG software
Set to equal zero
84 Program 4 Run IQSASP2
For all but the volume indicators (IQI 01-07) the IQSASP2 program calculates the observed or raw rates for the provider-level Inpatient Quality Indicators using the data derived in a previous step (IQSAS1) These observed rates are stratified by combinations of providers sex age race and payer categories The program first totals the indicator flags created by the
Inpatient Quality Indicators (IQI) Software Instruction SAS
Inpatient Quality Indicators (IQI) 25 Version 43 (August 2011)
IQSAS1 program and then for each of the desired stratifiers divides these totals by the hospital discharges in the universe for the indicator The population denominators are stored in variables with names that have a prefix of ldquoPrdquo (Pop) The Observed rates are stored in variables that have a prefix of ldquoOrdquo Input
1 The SAS dataset that was created in the IQSAS1 This dataset is a discharge-level file that contains inpatient records with input variables stratifiers and the 30 flag indicators for the IQI Provider outcomes of interest
2 SAS format library (FMTLIB) created from the IQFMT program
Output
1 SAS dataset with summary records that contain observed rates (OPIQxx variables where lsquoxxrsquo refers to the indicator number) the counts of outcomes that formed the numerators of the rates (TPIQxx variables) and the hospital discharge totals that formed the denominators of the observed rates (PPIQxx variables) It also includes variables indentifying present on admission (POA) and conditions for provider based outcomes of interest (QPQIxx) The output file has records summarized to the various combinations of stratifiers specified in the TYPELVLP parameter that is described in item number 4 in the ldquoChangesrdquo section below Note that the observed rates and the denominator totals are not generated for the Provider volume indicators (IQI 01-07)
2 An optional ASCII (comma delimited) text file that the user can then import into a
spreadsheet This text file contains the same information as the SAS output dataset The text file will contain the OPIQxx observed rates the TPIQxx counts of outcomes that formed the numerators of the rates and the PPIQxx counts of outcomes that formed the denominators of the rates The different recordsrows in the text file will correspond to the different TYPELVLP stratification combinations
3 A PROC MEANS (with N NMISS MIN MAX MEAN and SUM) of the provider-
level summary records that shows statistics for the OPIQxx observed rates the TPIQxx counts of outcomes that formed the numerators of the rates and the PPIQxx counts of outcomes that formed the denominators of the rates These means will only be generated if the user included a value of 16 for the TYPELVLP parameter discussed in item 4 in the ldquoChangesrdquo section below
4 A PROC CONTENTS of the output SAS summary dataset is output to hardcopy
5 A PROC PRINT of the output summary dataset is provided at the end of the hardcopy
printout This printout may be quite large depending on the number and the types of stratifications that the user requests with the TYPELVLP parameter discussed in item number 4 in the ldquoChangesrdquo section below If the user does not wish to generate this printout then the global ldquoPRINTrdquo parameter in CONTROL_IQISAS code should be set to zero
Inpatient Quality Indicators (IQI) Software Instruction SAS
Inpatient Quality Indicators (IQI) 26 Version 43 (August 2011)
Changes 1 The ldquoFILENAME CONTROLrdquo statement at the beginning of the program must be
changed to reflect the location of the CONTROL_IQISAS code 2 In CONTROL_IQISAS specify the locations (paths) of the input and output SAS
files in the ldquoLIBNAME INP2rdquo and ldquoLIBNAME OUTP2rdquo statements
3 In CONTROL_IQISAS specify the names of the input and output files in the ldquoINFILE1rdquo and ldquoOUTFILP2rdquo statements The name that you specify with INFILE1 should be for the file that you created using the IQSAS1 program
4 In CONTROL_IQISAS specify the levels of aggregation for the observed rates This
step is done by specifying numbers between 0 and 31 in the ldquoLET TYPELVLP =rdquo statement Each number from 0 to 31 corresponds to a different level or combination of levels as shown in Table 6 The default values of 0 16 will provide an overall total and provider-level totals
If TYPELVLP includes the value 0 then the first observation in the output summary data file will contain the overall totals and observed rates for the entire database created with the IQSAS1 program
5 In CONTROL_IQISAS if you wish to create an ASCII (comma delimited) text file that you can import into a spreadsheet then set the TEXTP2 parameter to 1 Otherwise the default value of zero for TEXTP2 will skip around the code that would generate this file
6 In CONTROL_IQISAS if you wish to create an ASCII (comma delimited) text file
that you can import into a spreadsheet then specify the path (including the file name) for this ASCII text file in the FILENAME IQTEXTP2rdquo statement
Inpatient Quality Indicators (IQI) Software Instruction SAS
Inpatient Quality Indicators (IQI) 27 Version 43 (August 2011)
Table 6 IQSASP2 Aggregation Possibilities
TYPELVLP Stratification 0 Overall 1 Race 2 Payer 3 Payer Race 4 Sex 5 Sex Race 6 Sex Payer 7 Sex Payer Race 8 Age 9 Age Race 10 Age Payer 11 Age Payer Race 12 Age Sex 13 Age Sex Race 14 Age Sex Payer 15 Age Sex Payer Race 16 Provider 17 Provider Race 18 Provider Payer 19 Provider Payer Race 20 Provider Sex 21 Provider Sex Race 22 Provider Sex Payer 23 Provider Sex Payer Race 24 Provider Age 25 Provider Age Race 26 Provider Age Payer 27 Provider Age Payer Race 28 Provider Age Sex 29 Provider Age Sex Race 30 Provider Age Sex Payer 31 Provider Age Sex Payer Race
0 and 16 TYPELVLP (overall and provider) are default values for the level of computation in the software
For example if you are using a state inpatient hospital database you might specify the following TYPELVLP values
0 ndash provides overall rates for your entire state 8 ndash provides overall rates for your state broken down by age groups 16 ndash provides rates for providers within your state 24 ndash provides rates for age groups within these providers
85 Program 5 Run IQSASP3
The IQSASP3 program calculates risk-adjusted rates by patient age sex and APR-DRG if available for each IQI and then calculates smoothed rates The risk-adjusted and smoothed rates are not calculated for the Provider volume indicators IQI 01-07 just as observed rates were not calculated for these indicators
Inpatient Quality Indicators (IQI) Software Instruction SAS
Inpatient Quality Indicators (IQI) 28 Version 43 (August 2011)
The programs calculate risk-adjusted IQI rates regardless of the number of cases available However IQI rates based on only a few cases should be interpreted with caution
The output file has records summarized to the various combinations of stratifiers that were specified in the TYPELVLP parameter of the preceding IQSASP2 program See Table 6 on page 27 Input
1 SAS format library (FMTLIB) created from the IQFMT program 2 The discharge-level file that was created with the IQSAS1 program
3 The SAS dataset with summary records that was created with the IQSASP2 program 4 A text file containing regression coefficients from a regression that was run on a
reference SID dataset These coefficients will be used in the risk-adjustment process Two files are provided as part of the IQI module Gee_piqxx_RegressionAnalysisGeecsv contains the regression coefficients Prediction_PIQxxxml contains the input parameters for the executable AHRQexe
Users must create a directory ldquoCAHRQQI AHRQPredictionrdquo and copy the
executable AHRQexe to that directory (along with 5 other files) Users must also create a directory ldquoCAHRQQIIQIrdquo and copy the zip file IQI_GEE_Input_Fileszip to that directory Extract all of the files from IQI_GEE_Input_Fileszip into the directory ldquoCAHRQQIIQIrdquo (See version 43 introduction on page 1)
5 A text file containing three arrays for use in the smoothing process The arrays
contain noise estimates signal estimates and mean area rates for each IQI Specify file MSXIQP42TXT The text file does not need to be converted to a SAS file for use with the software
Output
1 A SAS dataset with an overall summary record and with provider-level summary records that contain the three types of indicator rates along with the components of the initial raw rates Specifically the file contains the observed rates (OPIQxx variables) the risk-adjusted rates (RPIQxx variables) the smoothed rates (SPIQxx variables) the expected rates (EPIQxx variables) the counts of outcomes that formed the numerators of the observed rates (TPIQxx variables) and the hospital discharge totals that formed the denominators of the observed rates (PPIQxx variables) When stratifications other than hospital are selected the RPIQxx variables and their confidence intervals are observedexpected ratios to avoid confounding with risk-adjustment variables
2 An optional ASCII (comma delimited) text file that the user can then import into a
spreadsheet This text file contains the same information as the SAS output dataset
Inpatient Quality Indicators (IQI) Software Instruction SAS
Inpatient Quality Indicators (IQI) 29 Version 43 (August 2011)
The text file will contain the OPIQxx observed rates and their TPIQxx and PPIQxx numerator and denominator components the RPIQxx risk-adjusted rates the SPIQxx smoothed rates and the EPIQxx expected rates Each record or row in the text file will correspond to a specification group
3 A PROC MEANS (with N NMISS MIN MAX MEAN and SUM) of the provider-
level summary records that shows statistics for the observed risk-adjusted and smoothed rates and statistics for the counts of outcomes that formed the numerators and denominators of the observed rates These means will only be generated if the user included a value of 16 for the TYPELVLP parameter of the preceding IQSASP2 program (see Table 6 on page 27)
4 A PROC CONTENTS of the output SAS summary dataset is output to hardcopy
5 A PROC PRINT of the output summary dataset is provided at the end of the hardcopy
printout This printout may be quite large depending on the number and the types of stratifications that the user requested with the TYPELVLP parameter of the preceding IQSASP2 program (see Table 6 on page 27) If the user does not wish to generate this printout then the global ldquoPRINTrdquo parameter in CONTROL_IQISAS code should be set to zero
Changes
1 The ldquoFILENAME CONTROLrdquo statement at the beginning of the program must be changed to reflect the location of the CONTROL_IQISAS code
2 In CONTROL_IQISAS specify the locations (paths) of the input and output SAS
files in the ldquoLIBNAME INP3rdquo and ldquoLIBNAME OUTP3rdquo statements
3 In CONTROL_IQISAS specify in the ldquoINFILE1rdquo statement the name of the discharge-level file that you created with the IQSAS1 program
4 In CONTROL_IQISAS specify in the ldquoFILENAME MSXPrdquo statement the path
(including the file name) for the ASCII text file that contains the estimates to smooth the indicator rates Specify file MSXIQP42TXT
5 In CONTROL_IQISAS specify in the ldquoINFILEP2rdquo statement the name of the
summary file that you created with the IQSASA2 program
6 In CONTROL_IQISAS specify in the ldquoOUTFILP3rdquo statement the name that you wish the output file to have
7 In CONTROL_IQISAS if you wish to create an ASCII (comma delimited) text file
that you can import into a spreadsheet then set the TEXTP3 parameter to 1 Otherwise the default value of zero for TEXTA3 will skip the code that would generate this file
Inpatient Quality Indicators (IQI) Software Instruction SAS
Inpatient Quality Indicators (IQI) 30 Version 43 (August 2011)
8 In CONTROL_IQISAS if you wish to create an ASCII (comma delimited) text file that you can import into a spreadsheet then specify the path (including the file name) for this ASCII text file in the ldquoFILENAME IQTEXTP3rdquo statement
86 Program 6 Run IQSASA2
The IQSASA2 program calculates the observed or raw rates for the area-level Inpatient Quality Indicators using the data derived in a previous step (IQSAS1) These observed rates can be stratified by combinations of area sex age and race categories The program first totals the four area indicator flags created by the IQSAS1 program and then for each of the desired stratifiers divides these totals by the pertinent residential population The population denominators are stored in variables with names that have a prefix of ldquoPrdquo (Pop) The Observed rates are stored in variables that have a prefix of ldquoOrdquo Input
1 The SAS dataset that was created in the IQSAS1 This dataset is a discharge-level file that contains inpatient records with input variables stratifiers and the four new flag indicators for the IQI Area-level outcomes of interest
2 A text file with Census area residential populations stratified by area age sex and
ethnicity categories The file POP95T11TXT is currently provided on the website as a separate download The user should set POPYEAR to the year that best matches the userrsquos discharge data file
Users do not need to convert the ASCII text file to a SAS dataset for use with the software
3 SAS format library (FMTLIB) created from the IQFMT program
Output
1 SAS dataset with summary records that contain observed rates (OAIQxx variables where xx refers to the indicator number) the counts of outcomes that formed the numerators of the rates (TAIQxx variables) and the residential population totals that formed the denominators of the observed rates (PAIQxx variables) The output file has records summarized to the various combinations of stratifiers specified in the TYPELVLA parameter that is described in item number 5 in the ldquoChangesrdquo section below
2 An optional ASCII (comma delimited) text file that the user can then import into a
spreadsheet This text file contains the same information as the SAS output dataset The text file will contain the OAIQxx observed rates the TAIQxx counts of outcomes that formed the numerators of the rates and the PAIQxx residential population totals The different recordsrows in the text file will correspond to the different TYPELVLA stratification combinations
Inpatient Quality Indicators (IQI) Software Instruction SAS
Inpatient Quality Indicators (IQI) 31 Version 43 (August 2011)
3 A PROC MEANS (with N NMISS MIN MAX MEAN and SUM) of the area-level summary records that shows statistics for the OAIQxx observed rates the TAIQxx counts of outcomes that formed the numerators of the rates and the PAIQxx residential populations totals These means will only be generated if the user included a value of 8 for the TYPELVLA parameter discussed in item number 5 in the ldquoChangesrdquo section below
4 A PROC CONTENTS of the output SAS summary dataset is output to hardcopy
5 A PROC PRINT of the output summary dataset is provided at the end of the hardcopy
printout This printout may be quite large depending on the number and the types of stratifications that the user requests with the TYPELVLA parameter discussed in item number 5 in the ldquoChangesrdquo section below If the user does not wish to generate this printout then the global ldquoPRINTrdquo parameter in CONTROL_IQISAS code should be set to zero
Changes
1 The ldquoFILENAME CONTROLrdquo statement at the beginning of the program must be changed to reflect the location of the CONTROL_IQISAS code
2 In CONTROL_IQISAS specify the locations (paths) of the input and output SAS
files in the ldquoLIBNAME INA2rdquo and ldquoLIBNAME OUTA2rdquo statements
3 In CONTROL_IQISAS specify the names of the input and output files in the ldquoINFILE1rdquo and ldquoOUTFILA2rdquo statements The name that you specify with INFILE1 should be for the file that you created using the IQSAS1 program
4 In CONTROL_IQISAS specify the path (including the file name) for the ASCII
population text file in the ldquoFILENAME POPFILE statement The file name will be POP95T11TXT The user should set POPYEAR to the year that best matches the userrsquos discharge data file
5 In CONTROL_IQISAS specify the levels of aggregation for the observed rates This
change is done by specifying numbers between 0 and 15 in the ldquoLET TYPELVLA =rdquo statement Each number from 0 to 15 corresponds to a different level or combination of levels as shown in
Inpatient Quality Indicators (IQI) Software Instruction SAS
Inpatient Quality Indicators (IQI) 32 Version 43 (August 2011)
6 Table 7 The default values of 0 (overall) and 8 (area) will provide an overall total and area-level totals
WARNING TYPELVLA must include the values 0 (overall) and 8 (area) if you wish to subsequently run program IQSASA3 for risk-adjusted and smoothed rates
If TYPELVLA includes the value 0 (overall) then the first observation in the output summary data file will contain the overall totals and observed rates for the entire database created with the IQSAS1 program
Table 7 IQSASA2 aggregation possibilities
TYPELVLA Stratification 0 Overall 1 Race 2 Sex 3 Sex Race 4 Age 5 Age Race 6 Age Sex 7 Age Sex Race 8 Area 9 Area Race 10 Area Sex 11 Area Sex Race 12 Area Age 13 Area Age Race 14 Area Age Sex 15 Area Age Sex Race
0 (overall) and 8 (are) TYPELVLA are default values for the level of computation in the software
For example if you are using a state inpatient hospital database you might specify the following TYPELVLA values
0 ndash provides overall rates for your entire state 4 ndash provides overall rates for your state broken down by age groups 8 ndash provides rates for areas within your state 12 ndash provides rates for age groups within these areas
7 In CONTROL_IQISAS if you wish to create an ASCII (comma delimited) text file
that you can import into a spreadsheet then set the TEXTA2 parameter to 1 Otherwise the default value of zero for TEXTA2 will skip the code that would generate this file
8 In CONTROL_IQISAS if you wish to create an ASCII (comma delimited) text file
that you can import into a spreadsheet then specify the path (including the file name) for this ASCII text file in the ldquoFILENAME IQTEXTA2rdquo statement
Inpatient Quality Indicators (IQI) Software Instruction SAS
Inpatient Quality Indicators (IQI) 33 Version 43 (August 2011)
87 Program 7 Run IQSASA3 The IQSASA3 program calculates age and sex risk-adjusted rates for each area-level IQI
(overall rates and rates by area) and then calculates smoothed rates Input
1 SAS format library (FMTLIB) created from the IQFMT program 2 The discharge-level file that was created with the IQSAS1 program
3 The SAS dataset with summary records that was created with the IQSASA2 program
4 A text file with Census area residential populations (stratified by area sex and
discrete age categories) One file is currently provided along with the IQI module software The file is POP95T11TXT The user should set POPYEAR to the year that best matches the userrsquos discharge data file The text file does not need to be converted to a SAS file for use with the software
5 A text file (COVIQA42TXT) containing regression coefficients from a regression
that was run on the reference SID dataset These coefficients will be used in the risk adjustment process This file is provided to you as part of the IQI module The text file does not need to be converted to a SAS file for use with the software
6 A text file (MSXIQA42TXT) containing two arrays for use in the smoothing process
The arrays contain noise estimates signal estimates and mean area rates for each IQI This file is provided to you as part of the IQI module The text file does not need to be converted to a SAS file for use with the software
Output
1 A SAS dataset with an overall summary record and with area-level summary records that contain the three types of indicator rates along with the components of the initial raw rates Specifically the file contains the observed rates (OAIQxx variables) the risk-adjusted rates (RAIQxx variables) the smoothed rates (SAIQxx variables) the counts of outcomes that formed the numerators of the observed rates (TAIQxx variables) and the residential population totals that formed the denominators of the observed rates (PAIQxx variables) When stratifications other than area are selected the RAIQxx variables and their confidence intervals are observedexpected ratios to avoid confounding with risk-adjustment variables
2 An optional ASCII (comma delimited) text file that the user can then import into a
spreadsheet This text file contains the same information as the SAS output dataset The text file will contain the OAIQxx observed rates and their TAIQxx and PAIQxx components the RAIQxx risk-adjusted rates and the SAIQxx smoothed rates Each record or row in the text file will correspond to a different area
Inpatient Quality Indicators (IQI) Software Instruction SAS
Inpatient Quality Indicators (IQI) 34 Version 43 (August 2011)
3 Outputs to hardcopy are PROC MEANS (with N NMISS MIN MAX MEAN and SUM) of risk-adjusted and smoothed rates in two intermediate work files and of all of the numeric variables in the final output data file The printout also contains a PROC CONTENTS of the output SAS dataset A PROC PRINT of the output dataset is provided only if the ldquoPRINTrdquo parameter in CONTROL_IQISAS code is set to one
6 A PROC MEANS (with N NMISS MIN MAX MEAN and SUM) of the area-level
summary records that shows statistics for the OAIQxx observed rates and their TAIQxx and PAIQxx components the RAIQxx risk-adjusted rates and the SAIQxx smoothed rates
7 A PROC CONTENTS of the output SAS summary dataset is output to hardcopy
8 A PROC PRINT of the output summary dataset is provided at the end of the hardcopy
printout If the user does not wish to generate this printout then the global ldquoPRINTrdquo parameter in CONTROL_IQISAS code should be set to zero
Changes
1 The ldquoFILENAME CONTROLrdquo statement at the beginning of the program must be changed to reflect the location of the CONTROL_IQISAS code
2 In CONTROL_IQISAS specify the locations (paths) of the input and output SAS
files in the ldquoLIBNAME INA3rdquo and ldquoLIBNAME OUTA3rdquo statements
3 In CONTROL_IQISAS specify in the ldquoINFILE1rdquo statement the name of the discharge-level file that you created with the IQSAS1 program
4 In CONTROL_IQISAS specify the path (including the file name) for the ASCII
population text file in the ldquoFILENAME POPFILE3rdquo statement The file name is POP95T11TXT These files are provided along with the software The file used should be the one that is closest to the year associated with your particular data These files contain Census residential estimates by area gender and discrete age categories
5 In CONTROL_IQISAS specify in the ldquoFILENAME COVARArdquo statement the path
(including the file name) for the ASCII text file that contains regression coefficients from a regression that was run on reference SID dataset The name of the file is COVIQA42TXT
6 In CONTROL_IQISAS specify in the ldquoFILENAME MSXArdquo statement the path
(including the file name) for the ASCII text file that contains the estimates to smooth the indicator rates The name of the file is MSXIQA42TXT
7 In CONTROL_IQISAS specify in the ldquoINFILEA2rdquo statement the name of the
summary file that you created with the IQSASA2 program
Inpatient Quality Indicators (IQI) Software Instruction SAS
Inpatient Quality Indicators (IQI) 35 Version 43 (August 2011)
8 In CONTROL_IQISAS specify in the ldquoOUTFILA3rdquo statement the name that you wish the output file to have
9 In CONTROL_IQISAS if you wish to create an ASCII (comma delimited) text file
that you can import into a spreadsheet then set the TEXTA3 parameter to 1 Otherwise the default value of zero for TEXTA3 will skip the code that would generate this file
10 In CONTROL_IQISAS if you wish to create an ASCII (comma delimited) text file
that you can import into a spreadsheet then specify the path (including the file name) for this ASCII text file in the ldquoFILENAME IQTEXTA3rdquo statement
Inpatient Quality Indicators (IQI) Software Instruction SAS
Inpatient Quality Indicators (IQI) 36 Version 43 (August 2011)
90 Reviewing the Printed Output This section contains tips for reviewing some of the printed output from the IQI module
These tips are oriented toward explaining the interrelationships between printout items from different programs and hopefully will help to reveal the nature and structure of the module outputs For guidance in interpreting the results see the Interpretations Guide
The final output of the IQI module is a PROC PRINT from IQSASP3 (for provider-level indicators) and IQSASA3 (for area-level indicators) All interim printouts are for checking and trouble-shooting However if you have elected to refrain from risk-adjusting and smoothing the data then the final outputs will be the PROC PRINT at the end of the IQSASP2 andor IQSASA2 programs
91 IQSAS1
The initial printout from the IQSAS1 program contains PROC MEANS for all of the numeric variables in the output discharge-level dataset It will contain information for the newly constructed TAIQxx and TPIQxx flag variables that will later form the numerators for the indicator rates For each TAIQxx and TPIQxx flag variable
bull The SUM will contain the total number of observations in the dataset that were found to have the particular outcome of interest
bull For the six Provider volume indicators (TPIQ01-TPIQ02 TPIQ04-TPIQ07) and the four Area indicators (TAIQ26-TAIQ29) the MEAN MINIMUM and MAXIMUM will usually be the value one since the flag variables have either been set to missing (lsquorsquo) or to a value of one The remainder of the Provider indicators (TPIQ08-TPIQ09 TPIQ11-TPIQ25 and TPIQ30-TPIQ34) have a value of one zero or missing (lsquorsquo) For these indicators a value of zero was assigned to the TPIQxx flag if a particular observation was part of the population at risk for a particular indicator but did not have the particular outcome of interest So for example TPIQ21 = 1 indicates a patient who had a Cesarean section while TPIQ21 = 0 identifies a patient who had a delivery but not a C-section
bull For the Provider indicators TPIQ08-TPIQ09 TPIQ11-TPIQ25 and TPIQ30-TPIQ34 the MEANs will contain a close approximation of the eventual overall observed indicator rates The values will change slightly after IQSASP2 has applied additional parts of the indicator definitions
bull N lists the number of observations in the dataset with non-missing values For the six provider-based volume indicators and the four area-level indicators N for TPIQxx or TAIQxx will be the same as the SUM For the other provider-based indicators N will contain the denominator for the observed indicator rate Note the Nrsquos or denominators for six of the mortality indicators (ie IQI 08-12 30 and 31) will be similar to the Ns and SUMs for the six volume indicators (TPIQ01-TPIQ02 TPIQ04-TPIQ07) but often they will not be exactly identical (eg the mortality indicators exclude discharges that were transferred to other hospitals)
Inpatient Quality Indicators (IQI) Software Instruction SAS
Inpatient Quality Indicators (IQI) 37 Version 43 (August 2011)
The IQSAS1 printout also contains a PROC CONTENTS that lists all of the variables in the output dataset including the character variables that are present and a PROC PRINT of the first 24 observations in the output dataset
92 IQSASP2 The purpose of this printout is to provide the observed rates for all provider-level indicators
The default printout shows results by provider but other levels of output (as shown in Table 6) can be specified as well Note that risk-adjusted and smoothed rates are shown in the output from the next program
The printout from the IQSASP2 program contains PROC MEANS on the provider-level summary records for all of the numeric variables in the output summary dataset It will contain information for the newly constructed OPIQxx rates the PPIQxx denominators and the TPIQxx numerators
bull The _TYPE_ variable described in the MEANS table identifies the stratification level for the records in the output data set The _TYPE_ variable corresponds to the TYPELVLP parameter values that were specified (see item number 4 in the ldquoChangesrdquo section for the IQSASP2 program on page 32) In this case _TYPE_ always assumes the value of 16 since only the provider-level records are selected
bull The N statistic for _TYPE_ contains the number of providers in the output summary data set A TPIQxx numerator variable with a value for N that is lower than the N value for _TYPE_ indicates that there were no outcomes of interest for some of the providers Similarly a PPIQxx denominator variable with a lower value for N than _TYPE_ indicates that for some providers there were no hospital discharges with the outcome of interest
bull The MINIMUM value for the TPIQ08-TPIQ25 TPIQ30 and TPIQ31 numerators will usually be zero since values of zero were assigned for observations that were part of the population for the rate denominator but did not have the particular outcome of interest to be included in the rate numerator For the volume indicators (TPIQ01-TPIQ07) the MINIMUM value will be one or higher
For the observed rates the User should NOT report the MEANS displayed here but instead should refer to the overall means in the output dataset that are also present in the subsequent PROC PRINT The MEANS given here are means of hospital means ie all hospitals are given equal weight regardless of the number of discharges in the different hospitals
bull The SUMs for the counter variables TPIQxx and PPIQxx will contain overall file totals for these data elements The SUMs for the observed rates have no intuitive meaning If the ldquoPRINTrdquo parameter in the CONTROL_IQISAS program is set to one the subsequent
PROC PRINT output contains a complete dump of the output summary file Listed for each record are the stratification values the PPIQxx population denominators for the 30 provider indicators the TPIQxx outcome numerators for the 30 provider indicators and the 30 OPIQxx observed rates
Inpatient Quality Indicators (IQI) Software Instruction SAS
Inpatient Quality Indicators (IQI) 38 Version 43 (August 2011)
93 IQSASP3 The PROC PRINT at the end of this program provides your final output (This printout appears if the ldquoPRINTrdquo parameter in the CONTROL_IQISAS program is set to one)
The following table lists the column headers shown on the printed output and describes each
Each indicator is reported in a separate section Values of ldquoxxrdquo correspond to the two-digit IQI number Table 8 Provider level printed output
Column Heading Description Obs Observation 1 (with HOSPID = ldquordquo) is the overall average for the entire dataset
(TYPELVLP = 0) The remaining observations are individual providers or hospitals (TYPELVLP = 16)
HOSPID Identifier for each provider in the dataset AGECAT Age stratification category ndash See Table 6 for TYPELVLP settings SEXCAT Gender stratification category ndash See Table 6 for TYPELVLP settings PAYCAT Payer stratification category ndash See Table 6 for TYPELVLP settings RACECAT Race stratification category ndash See Table 6 for TYPELVLP settings TPIQxx Number of cases in the numerator PPIQxx Number of cases in the denominator (population at risk) OPIQxx Observed (raw) rate ndash Numerator divided by Denominator EPIQxx Expected rate ndash Rates the provider would have if it performed the same as the
reference population given the providerrsquos actual case-mix (eg age gender modified DRG and comorbidities)
RPIQxx Risk-adjusted rate ndash Accounts for the difference between the case-mix of the reference population and the providerrsquos case-mix When stratifications other than hospital or area are selected the RPIQxx variables and their confidence intervals are observedexpected ratios to avoid confounding with risk adjustment variables
LPIQxx Lower limit of confidence interval of risk-adjusted rate UPIQxx Upper limit of confidence interval of risk-adjusted rate SPIQxx Smoothed rate ndash Rates with removal of fluxuation over time XPIQxx Standard error of smoothed rate
Observation 1 (with HOSPID = ) is the overall average for the entire dataset (TYPELVL =
0) The remaining observations are individual providers or hospitals (TYPELVL = 16) Data will appear under the column headers AGECAT SEXCAT PAYCAT and RACECAT if you specify these levels of aggregation (shown in Table 6)
You may wish to express the results in more understandable terms
bull Multiply the mortality rates by 100 to express them as a percentage (eg 00338 100 = 34 mortality for CABG)
bull Multiply the utilization rates by 100 to express them as a percentage (eg 02040 100 = 204 C-section rate)
Inpatient Quality Indicators (IQI) Software Instruction SAS
Inpatient Quality Indicators (IQI) 39 Version 43 (August 2011)
The MEANS table is generated from the permanent provider-based output file and is provided for trouble-shooting and understanding your data but not for reporting The means are provided just for the provider level summary records
bull The N for all but the TPIQxx counter variables should contain the number of providers in the userrsquos database
bull The MEANS MINIMUMs and MAXIMUMs have their normal meaning and provide comparisons among the different hospitals or providers in your database
For the (observed risk-adjusted or smoothed) rates the User should NOT report the MEANS displayed here but instead refer to the overall means in the output dataset in the PROC PRINT labeled ldquoFINAL OUTPUTrdquo The MEANS given here are means of hospital means ie all hospitals are given equal weight regardless of the number of discharges in the different hospitals
bull Note The denominators for six of the mortality indicators ( 8 ndash 12 30 and 31) will be similar to the totals for the six volume indicators (TPIQ01-TPIQ07) but often they will not be exactly identical (eg the mortality indicators exclude discharges that were transferred to other hospitals)
bull If the ldquoPRINTrdquo parameter in the CONTROL_IQISAS program is set to one at the end of the printout is a PROC PRINT on the final provider-based output file Listed for each level of stratification are the stratifiers the numerator and denominator totals for the observed rates and the observed risk-adjusted and smoothed rates
94 IQSASA2
The purpose of this printout is to provide the observed rates for all area-level indicators The default printout shows overall results and results by area but other levels of output (as shown in Table 6) can be specified as well Note that risk-adjusted and smoothed rates are shown in the output from the next program
The printout from the IQSASA2 program contains PROC MEANS for all of the numeric variables in the output summary dataset It will contain information for the newly constructed OAIQxx rates the PAIQxx denominators and the TAIQxx numerators
bull The _TYPE_ variable described in the first row of the MEANS table identifies the stratification level for the records in the output data set The _TYPE_ variable corresponds to the TYPELVLA parameter values that were specified (see item 5 in the ldquoChangesrdquo section for the IQSASA2 program on page 31) In this case _TYPE_ always assumes the value of 8 since only the area-level records are selected
bull The N statistic for _TYPE_ contains the number of areas in the output summary data set A TAIQxx numerator variable with a lower value for N than _TYPE_ indicates that there were no outcomes of interest for some of the areas
bull The MINIMUM value for the TAIQxx numerators will be one or higher
Inpatient Quality Indicators (IQI) Software Instruction SAS
Inpatient Quality Indicators (IQI) 40 Version 43 (August 2011)
For the observed rates the User should NOT report the MEANS displayed here but instead should refer to the overall means in the output dataset that are also present in the subsequent PROC PRINT The MEANS given here are means of the area means ie all areas are given equal weight regardless of the population in the different areas
bull The SUMs for the counter variables TAQIxx and PAIQXX will contain overall file totals for these data elements The SUMs for the observed rates have no intuitive meaning
If the ldquoPRINTrdquo parameter in the CONTROL_IQISAS program is set to one the subsequent
PROC PRINT output contains a complete dump of the output summary file Listed for each record are the stratification values the PAIQxx population denominators for the four indicators the TAIQxx outcome numerators for the four indicators and the four OAIQxx observed rates
95 IQSASA3 The PROC PRINT at the end of this program provides your final output (This printout appears if the ldquoPRINTrdquo parameter in the CONTROL_IQISAS program is set to one)
The following table lists the column headers shown on the printed output and describes each
Each indicator is reported in a separate section Values of ldquoxxrdquo correspond to the two-digit IQI number Table 9 Area level printed output
Column Heading Description
Obs Observation 1 is the overall average for the entire dataset (TYPELVLA = 0) The remaining observations are individual areas (TYPELVLA = 8)
Area Identifier in the dataset for area TAIQxx Number of cases in the numerator PAIQxx Number of cases in the denominator (population at risk) OAIQxx Observed (raw) rate ndash Numerator divided by Denominator RAIQxx Risk-adjusted rate ndash Accounts for the difference between the case-mix of the
reference population and the arearsquos case-mix When stratifications other than hospital or area are selected the RPIQxx variables and their confidence intervals are observedexpected ratios to avoid confounding with risk adjustment variables
SAIQxx Smoothed rate ndash Rates with removal of fluxuation over time
Observation 1 (with AREA = blank) is the overall average for the entire dataset (TYPELVL = 0) The remaining observations are individual areas (TYPELVL = 8)
You may wish to express the results in more understandable terms
bull Multiply the utilization rates by 100000 to express them as a rate per 100000 population (eg 0000494 100000 = 494 hysterectomies per 100000 population)
The MEANS table is generated from the permanent area-level output file The means are
provided just for the area-level summary records
Inpatient Quality Indicators (IQI) Software Instruction SAS
Inpatient Quality Indicators (IQI) 41 Version 43 (August 2011)
bull The N for all but the TAIQxx counter variables should contain the number of different areas (Metro Areas and counties) in your database
bull The MEANs MINIMUMs and MAXIMUMs have their normal meaning and provide comparisons among the different areas in your database Note that the MAXIMUMs for the counter variables (the TAIQxx and PAIQxx variables) are associated with specific areas and therefore these MAXIMUMs may not match those in the prior IQSAS2 printouts since that run typically will include a record for the entire database
For the (observed risk-adjusted or smoothed) rates the User should NOT report the MEANS displayed here but instead refer to the overall means in the output dataset that are also present in the subsequent PROC PRINT The MEANS given here are means of area means ie all areas are given equal weight regardless of the number of discharges in the different areas
bull The SUMs of the counter variables (the TAIQxx and PAIQxx variables) yield the overall database totals
Inpatient Quality Indicators (IQI) Software Instruction SAS
Inpatient Quality Indicators (IQI) 42 Version 43 (August 2011)
100 Benchmark Timings The benchmark runtimes given below are from runs made on a Windows XP workstation
with a Pentium 4 CPU 280 GHz processor 512 MB of RAM and an IDE hard drive The dataset used contained 757624 observations with 15 diagnosis fields and 15 procedure fields
Step Run time (in seconds) Run IQFMTS to create the format library 2 Run IQSAS1 157 Run IQSASP2 21 Run IQSASP3 86 Run IQSASA2 10 Run IQSASA3 185
101 User Support Technical assistance is available through an electronic user support system monitored by the
QI support team to support users in their application of the IQI software The same e-mail address may be used to communicate to AHRQ any suggestions for IQI enhancements general questions and any QI related comments you may have AHRQ welcomes your feedback
The Internet address for user support and feedback is supportqualityindicatorsahrqgov AHRQ also offers a listserv to keep you informed on the Quality Indicators (QIs) The
listserv is used to announce any QI changes or updates new tools and resources and to distribute other QI related information This is a free service Simply follow the process described below to begin receiving important QI information All you need is a computer Internet access and an E-mail address It works just like other electronic distribution lists
Herersquos how to register 1 Send an E-mail message to listservqualityindicatorsahrqgov 2 On the subject line type Subscribe For example Subscribe
3 In the body of the message type sub Quality_Indicators-L and your full name For example sub Quality_Indicators-L John Doe
4 You will receive a message confirming that you are signed up If you have any questions contact AHRQ QI Support at the e-mail noted above You should
receive an automatic response e-mail message confirming receipt of your e-mail If you do not receive a confirmation message call (888) 512-6090
Inpatient Quality Indicators (IQI) Software Instruction SAS
Inpatient Quality Indicators (IQI) 43 Version 43 (August 2011)
Appendix A Links The following links may be helpful to users of the AHRQ Inpatient Quality Indicators
Inpatient Quality Indicators Version 43 Documents and Software Available at httpwwwqualityindicatorsahrqgovmodulesiqi_resourcesaspx and httpwwwqualityindicatorsahrqgovsoftwaredefaultaspx
Title Description
IQI User Guide Individual Measures
The user guide provides a technical overview of the IQI individual measures including literature and empirical evidence
IQI User Guide Composite Measures
The user guide provides a technical overview of the IQI composite measures
IQI Technical Specifications
Provides detailed definitions of each IQI including all ICD-9-CM and DRG codes that are included in or excluded from the numerator and denominator Note that exclusions from the denominator are automatically applied to the numerator
IQI Comparative Data This document provides the average volume provider rate and population rate as appropriate for each indicator
Fiscal year 2011 Coding Changes
This document summarizes the changes to the indicator definitions resulting from FY 2011 changes to ICD-9-CM coding and DRG changes These changes will only affect data from FY 2011 (October 1 2011) or later
Log of Changes to IQI Documents and Software
The Change Log document provides a cumulative summary of all changes to the IQI software software documentation and other documents made since the release of version 21 of the software in March 2003 Changes to indicator specifications that were not a result of new ICD-9-CM and DRG codes are also described in the Change Log
IQI Risk Adjustment Coefficient Tables
Tables for each IQI provide the stratification and coefficients used to calculate the risk-adjusted rate for each strata
SASreg IQI Software Documentation
This software documentation provides detailed instructions on how to use the SAS reg version of the IQI software including data preparation calculation of the IQI rates and interpretation of output
SASreg IQI Software Requires the SASreg statistical program distributed by the SAS Institute Inc The company may be contacted directly regarding the licensing of its products httpwwwsascom
3Mreg APRreg DRG Limited License Grouper for SASreg
Creates APR-DRG variables for use with SAS version of IQI software Instructions for running the software are included in the Zip file
Version 43 Listserv announcement
This document announces the release of the Version 43 software and documentation provides a summary of changes and links to relevant pages
Inpatient Quality Indicators (IQI) Software Instruction SAS
Inpatient Quality Indicators (IQI) 44 Version 43 (August 2011)
AHRQ QI Windows Application The AHRQ QI Windows Application calculates rates for all of the AHRQ Quality Indicators modules and does not require SASreg It is available at
httpwwwqualityindicatorsahrqgovwinqi_downloadhtm Additional Documents The following documents are available within the Archive section of the AHRQ QI Web page
httpwwwqualityindicatorsahrqgovArchivedefaultaspxiqi
bull Refinement of the HCUP Quality Indicators (Technical Review) May 2001 bull Refinement of the HCUP Quality Indicators (Summary) May 2001
In addition these documents may be accessed at the AHRQ QI Modules Web page
httpwwwqualityindicatorsahrqgovmodulesDefaultaspx bull AHRQ QI Measure Development Implementation Maintenance and Retirement bull ICD-9-CM to ICD-10-CMPCS Conversion of AHRQ QI March 2011 bull AHRQ QI Empirical Methods May 2011 bull Guidance for Using the AHRQ Quality Indicators for Hospital-level Public Reporting
or Payment August 2004 bull AHRQ Summary Statement on Comparative Hospital Public Reporting December
2005 bull Appendix A Current Uses of AHRQ Quality Indicators and Considerations for
Hospital-level bull Comparison of Recommended Evaluation Criteria in Five Existing National
Frameworks bull List of AHRQ QI Endorsed by the National Quality Forum
The following documents can be viewed or downloaded from the AHRQ QI News Web page
httpwwwqualityindicatorsahrqgovnewsdefaultaspx and httpwwwqualityindicatorsahrqgovArchiveNewsaspx bull February 2007 Newsletter - Year highlights and future plans bull February 2006 Newsletter ndash Year highlights and future plans bull 2006 Area Level Indicator Changes bull Considerations in Public Reporting for the AHRQ QI bull June 2005 Newsletter - Contains the article Using Different Types of QI Rates
Inpatient Quality Indicators (IQI) Software Instruction SAS
Inpatient Quality Indicators (IQI) 45 Version 43 (August 2011)
Other Tools and Information
IQI rates can be calculated using the modified Federal Information Processing Standards (FIPS) Statecounty code A list of codes is available at
httpwwwcensusgovpopestgeographiccodes02pdf
AHRQ provides a free on-line query system based on HCUP data that provides access to health statistics and information on hospital stays at the national regional and State level It is available at
httphcupahrqgovHCUPnetasp
Information on the 3Mtrade APR-DRG system is available at
httpwww3mcomushealthcarehisproductscodingrefined_drgjhtml
Inpatient Quality Indicators (IQI) Software Instruction SAS
Inpatient Quality Indicators (IQI) 46 Version 43 (August 2011)
Appendix B Using Different Types of QI Rates When should you use the observed expected risk adjusted andor smoothed rates generated
by the AHRQ QI software Here are some guidelines If the userrsquos primary interest is to identify cases for further follow-up and quality
improvement then the observed rate would help to identify them The observed rate is the raw rate generated by the QI software from the data the user provided Areas for improvement can be identified by the magnitude of the observed rate compared to available benchmarks andor by the number of patients impacted
Additional breakdowns by the default patient characteristics used in stratified rates (eg age gender or payer) can further identify the target population Target populations can also be identified by user-defined patient characteristics supplemented to the casedischarge level flags Trend data can be used to measure change in the rate over time
Another approach to identify areas to focus on is to compare the observed and expected rates The expected rate is the rate the provider would have if it performed the same as the reference population given the providerrsquos actual case-mix (eg age gender DRG and comorbidity categories)
If the observed rate is higher than the expected rate (ie the ratio of observedexpected is greater than 10 or observed minus expected is positive) then the implication is that the provider performed worse than the reference population for that particular indicator Users may want to focus on these indicators for quality improvement
If the observed rate is lower than the expected rate (ie the ratio of observedexpected is less than 10 or observed minus expected is negative) then the implication is that the provider performed better than the reference population Users may want to focus on these indicators for identifying best practices
Users can also compare the expected rate to the reference population rate reported in the AHRQ QI software or Comparative Data document to determine how their case-mix compares to the reference population The population rate refers to the overall rate for the reference population The reference population is defined in the Comparative Data Document If the population rate is higher than the expected rate then the providerrsquos case-mix is less severe than the reference population If the population rate is lower than the expected rate then the providerrsquos case-mix is more severe than the reference population
We use this difference between the population rate and the expected rate to ldquoadjustrdquo the observed rate to account for the difference between the case-mix of the reference population and the providerrsquos case-mix which is the providerrsquos risk-adjusted rate
If the provider has a less severe case-mix then the adjustment is positive (population rate gt expected rate) and the risk-adjusted rate is higher than the observed rate If the provider has a more severe case-mix then the adjustment is negative (population rate lt expected rate) and the risk-adjusted rate is lower than the observed rate The risk-adjusted rate is the rate the provider would have if it had the same case-mix as the reference population given the providerrsquos actual performance
Finally users can compare the risk-adjusted rate to the smoothed or ldquoreliability-adjustedrdquo rate to determine whether this difference between the risk-adjusted rate and reference population rate is likely to remain in the next measurement period Smoothed rates are weighted averages of the population rate and the risk-adjusted rate where the weight reflects the reliability of the providerrsquos risk-adjusted rate
Inpatient Quality Indicators (IQI) Software Instruction SAS
Inpatient Quality Indicators (IQI) 47 Version 43 (August 2011)
A ratio of (smoothed rate - population rate) (risk-adjusted rate - population rate) greater than 080 suggests that the difference is likely to persist (whether the difference is positive or negative) A ratio less than 080 suggests that the difference may be due in part to random differences in patient characteristics (patient characteristics that are not observed and controlled for in the risk-adjustment model) In general users may want to focus on areas where the differences are more likely to persist
Inpatient Quality Indicators (IQI) Software Instruction SAS
Inpatient Quality Indicators (IQI) 48 Version 43 (August 2011)
Appendix C IQI Input Data Dictionary Variable name Description Format Value description Comments
KEY Sequence number Unique case identifier Numeric
User defined unique numeric identifier for each discharge record
Not used by the QI programs but should be present to facilitate possible exploration allows user to link the records from the IQSAS1SAS program output file back to the original input data file
AGE Age in years at admission Numeric Age in years
If this data element is missing the discharge record will be excluded from analysis
AGEDAY Age in days (coded only when the age in years is less than 1) Numeric Age in days
Not used in the IQI program If not present in the input data file it is not necessary to create a dummy variable for this module
RACE Race of patient Numeric 1 2 3 4 5 6
White Black Hispanic Asian or Pacific Island Native American Other
The values of 1-5 are used directly in the QI software All other ethnicity codes are mapped to an lsquootherrsquo category
SEX Sex of patient Numeric
1 2
Male Female
If this data element is missing the discharge record will be excluded from the analysis
PAY1 Expected primary payer
Numeric 1 2 3 4 5 6
Medicare Medicaid Private incl HMO Self-pay No charge Other
The values of 1 2 3 and 4 are used directly in the QI software All other payer codes are mapped to an lsquootherrsquo category This data element is used to stratify only the Provider-level IQI (IQI-01 toIQI-25 IQI-30 to IQI-34)
PAY2 (SAS Only)
Expected secondary payer
Numeric 1 2 3 4 5 6
Medicare Medicaid Private incl HMO Self-pay No charge Other
Use is optional but must be present in data (set to missing if data element not available)
PSTCO
Location of patient residence or hospital location (FIPSdagger Statecounty code)
Numeric ssccc
Modified Federal Information Processing Standards Statecounty code2
See Appendix A for link to most recent list of codes If this data element is missing the discharge record will be excluded from rate calculations
HOSPID Data Source hospital number Numeric Hospital
identification number Used to facilitate data exploration and possible trouble shooting
2 Federal Information Processing Standard as defined by the US Department of Commerce National Institute of Standards and Technology (formerly National Bureau of Standards) Note Certain independent cities (Baltimore City Carson City and St Louis City) and areas within Hawaii and Virginia are assigned to different area groupings in the Modified FIPS categories as compared to the US Census Bureau groupings The AHRQ QI software uses the Modified FIPS code assignment of these areas Failure to use the Modified FIPS codes assignment will result in the use of incorrect denominator estimates for area indicators A list is available at httpwwwcensusgovpopestgeographiccodes02pdf
Inpatient Quality Indicators (IQI) Software Instruction SAS
Inpatient Quality Indicators (IQI) 49 Version 43 (August 2011)
Variable name Description Format Value description Comments
DISP Disposition of patient
Numeric 1 2 3 4 5 6 7 20
Routine Short-term hospital Skilled nursing facility Intermediate care Another type of facility Home health care Against medical advice Died in the hospital
The values 2 and 20 are referenced by the QI code (to identify transfers to another short-term hospital and patients who died in the hospital)
MORT30 (SAS Only)
30-Day Mortality Indicator Numeric
0 ndash not died within 30-days from admission
Use is optional but must be present in data (set to missing if data element not available)
1 ndash died within 30-days from admission
DNR Do Not Resuscitate Indicator Numeric
0 ndash No ldquoDo Not Resuscitaterdquo Indicator
Use is optional but must be present in data (set to missing if data element not available)
1 ndash ldquoDo Not Resuscitaterdquo Indicator
ATYPE Admission Type Numeric 1 2 3 4 5 6
Emergency Urgent Elective Newborn Trauma Center3 Other
Not used by the IQI program If not present in the input data file it is not necessary to create a dummy variable
ASOURCE Admission Source
Numeric 1 2 3 4 5
ER Another hospital Another facility including LTC Courtlaw enforcement Routinebirthother
The value 2 is referenced by the QI code (to identify transfers from another short-term hospital)
LOS Length of Stay Numeric Number of days from admission to discharge
Not used by the IQI program If not present in the input data file it is not necessary to create a dummy variable
APR_DRG APR-DRG category Numeric APR-DRG from 3Mreg software
Although the IQI module will operate without these variables users should run APR-DRG software on their raw data to assign this variable to each case See Section 53 on page 15
APRDRG_ RISK_ MORTALITY
APR-DRG Mortality Score Numeric
APR-DRG Risk of Mortality Score from 3Mreg software
See Section 53 on page 15
XPRDRG_ RISK_ MORTALITY
APR-DRG Mortality Score with POA Numeric
APR-DRG Risk of Mortality Score from 3Mreg Software using
See Section 53 on page 15
3 The ATYPE value ldquo5rdquo was used to indicate delivery only in the 1988 to 1997 HCUP data files The UB standards currently use ldquo5rdquo to indicate Trauma Center
Inpatient Quality Indicators (IQI) Software Instruction SAS
Inpatient Quality Indicators (IQI) 50 Version 43 (August 2011)
Variable name Description Format Value description Comments
POA information
DRG Diagnosis Related Group Numeric DRG from federal (CMS) DRG Grouper
DRGVER Diagnosis Related Group Version Numeric
DRG Version of federal (CMS) DRG Grouper
eg Version 28 for FY2011
MDC Major Diagnostic Category Numeric MDC from federal (CMS) DRG grouper
DISCWT Weight to assign to discharge Numeric Format as nnnnn
Cases with missing values are assigned a value of 1 Assigning a weight of zero has the effect of removing the case from the analysis
DX1 ndash DX30
ICD-9-CM diagnosis codes DX1 is the principal diagnosis DX2-DX30 are secondary diagnoses
String 3 4 or 5
characters (do not include decimal point)
Diagnosis codes Users must specify the number of diagnoses in the parameter ampNDX in CONTROL_IQISAS program
DXPOA1- DXPOA30-
Present on admission indicator for each diagnosis code
String
1 = present at the time of inpatient admission
These data will be used in risk adjustment and smoothing if the alternative parameter files of risk-adjustment covariates and population rates is specified
(YWE1)
0 = not present at the time of inpatient admission
(NUrsquo0rsquo )
NDX Count of the number of diagnoses (DX) on the discharge record
Numeric
Count of diagnoses (principal and all secondary diagnoses)
Not used by the IQI SAS program If not present in the input data file it is not necessary to create a dummy variable Definition is If the 1st discharge record has 1 Pr and the 2nd has 2 NPR would be 1 for the 1st record and 2 for the 2nd
PR1 ndash PR30
ICD-9-CM procedure codes PR1 is the principal procedure PR2-PR30 are secondary procedures
String 3 or 4
characters (do not include decimal point)
Procedure code
Users with more or fewer secondary procedures should modify the parameter ampNPR in CONTROL_IQISAS to reflect the number of diagnoses
NPR Count of the number of procedures (PR) on the discharge record
Numeric
Count of procedures (principal and all secondary procedures)
Not used by the IQI SAS program If not present in the input data file it is not necessary to create a dummy variable Definition is If the 1st discharge record has 1 Pr and the 2nd has 2 NPR would be 1 for the 1st record and 2 for the 2nd
Inpatient Quality Indicators (IQI) Software Instruction SAS
Inpatient Quality Indicators (IQI) 51 Version 43 (August 2011)
Variable name Description Format Value description Comments
POINTOFORIGINUB04
Point of Origin Numeric 4 Transfer from a hospital 5 Transfer from a skilled Nursing Facility (SNF) or Intermediate Care Facility (ICF)
Only these values are used by the QI programs
6 Transfer from another health care facility
IF ATYPE = 4
5 Born inside this hospital
6 Born outside of this hospital
PRDAY1 ndash PRDAY30
Days from admission to procedure PR1 is the principal procedure PR2-PR30 are secondary procedures
Numeric Days from Admission to Procedure4
Not used by the IQI program If not present in the input data file it is not necessary to create a dummy variable for this module
YEAR
Year of discharge The patientrsquos year of discharge For example a patient discharged on July 7 2004 would have a discharge year of lsquo2004rsquo
Numeric
YYYY
Discharge year should be within the range of 1997 to 2011
DQTR Quarter of discharge The calendar quarter of the patientrsquos discharge For example a patient discharged on July 7 2004 would have a discharge quarter of lsquo3rsquo
Numeric 1 January-March 2 April-June 3 July-September 4 October-December
See httphcup-usahrqgovtoolssoftwarecomorbiditycomorbidityjsp
4 Variables PRDAY1 to PRDAY30 are defined as the number of days from date of admission to date of procedure for each procedure For example if the patient was admitted on June 15th and had two procedures - the principal procedure on June 15th and a second procedure on June 18th ndash then the value of PRDAY1 would be zero (0) and the value of PRDAY2 would be three (3) For more information consult the HCUP data documentation at httpwwwhcup-usahrqgovdbvarsprdaynnisnotejsp
Inpatient Quality Indicators (IQI) Software Instruction SAS
Inpatient Quality Indicators (IQI) 52 Version 43 (August 2011)
Appendix D SAS IQI Output Data Dictionary SAS IQI Provider Output Column Heading Description Format Comments
Obs Observation 1 (with HOSPID = ) is the overall average for the entire dataset (TYPELVLP = 0) The remaining observations are individual providers or hospitals (TYPELVLP = 16)
Numeric
HOSPID Identifier for each provider in the dataset
Text Up to 12 characters
AGECAT Age stratification category Numeric range
SEXCAT Gender stratification category Numeric 1 = male 2 = female PAYCAT Payer stratification category Numeric 1 = Medicare
2 = Medicaid 3 = Private incl HMO 4 = Self-pay 5 = No charge 6 = Other
RACECAT Race stratification category Numeric 1 = White 2 = Black 3 = Hispanic 4 = Asian or Pacific Island 5 = Native American 6 = Other
TPIQxx The number of discharge records included in the numerator (outcome of interest) as defined for the indicator
Numeric
PPIQxx The number of discharge records included in the denominator (population at risk) as defined for the indicator
Numeric
OPIQxx The rate (observed numerator observed denominator) as defined for the indicator
Numeric
EPIQxx Rate calculated by assuming an average performance for each patient group based on the reference population but with the providerlsquos actual case-mix
Numeric
RPIQxx The estimated rate calculated by adjusting to an average case-mix
Numeric When stratifications other than hospital or area are selected the RPIQxx variables and their confidence intervals are observedexpected ratios to avoid confounding with risk adjustment variables
LPIQxx The lower confidence bound of the risk adjusted rate
Numeric
UPIQxx The upper confidence bound of the risk adjusted rate
Numeric
Inpatient Quality Indicators (IQI) Software Instruction SAS
Inpatient Quality Indicators (IQI) 53 Version 43 (August 2011)
Column Heading Description Format Comments
SPIQxx The smoothed rate calculated using multivariate signal extraction (MSX)
Numeric
XPIQxx Standard error of smoothed rate Numeric VPIQxx Variance for respective indicators Numeric
SAS IQI Area Output Column Heading Description Format Comments
Obs Observation 1 (with HOSPID = ) is the overall average for the entire dataset (TYPELVLP = 0) The remaining observations are individual providers or hospitals (TYPELVLP = 16)
Numeric
AREA Identifier in the dataset for area Text TAIQxx The number of discharge records
included in the numerator (outcome of interest) as defined for the indicator
Numeric
PAIQxx The number of discharge records included in the denominator (population at risk) as defined for the indicator
Numeric
OAIQxx The rate (observed numerator observed denominator) as defined for the indicator
Numeric
RAIQxx The estimated rate calculated by adjusting to an average case-mix
Numeric When stratifications other than hospital or area are selected the RAIQxx variables and their confidence intervals are observedexpected ratios to avoid confounding with risk adjustment variables
SAIQxx The smoothed rate calculated using multivariate signal extraction (MSX)
Numeric
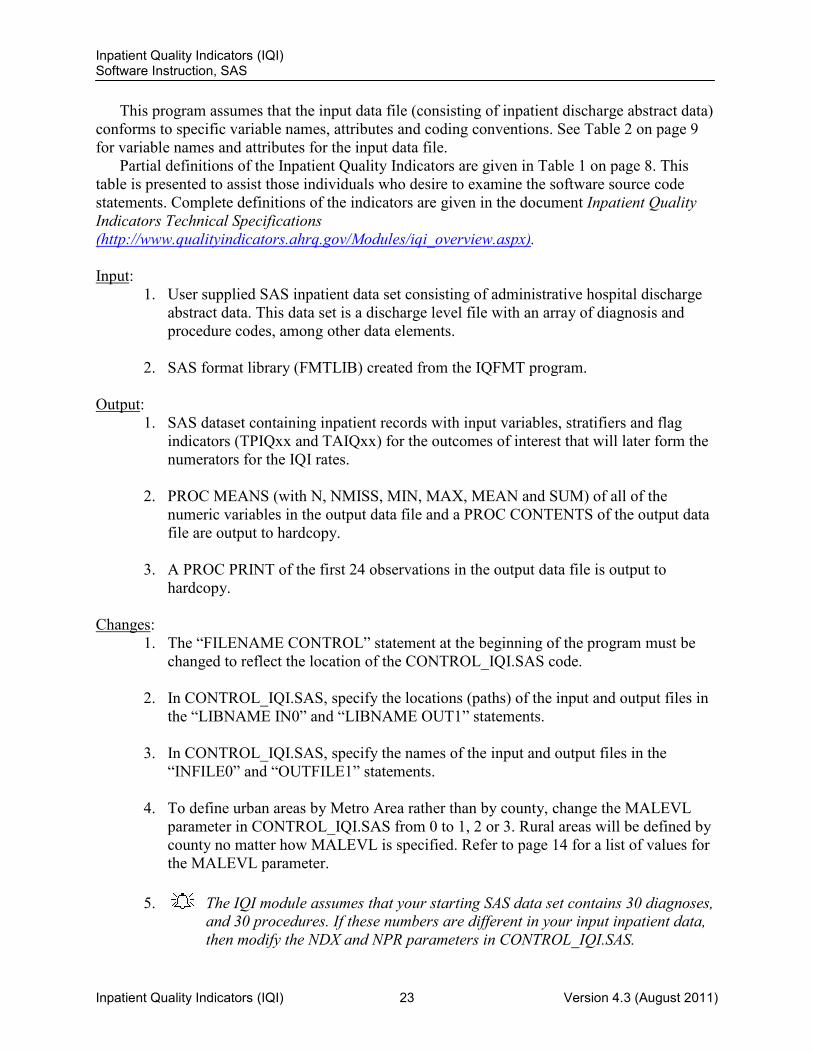
Inpatient Quality Indicators (IQI) Software Instruction SAS
Inpatient Quality Indicators (IQI) 27 Version 43 (August 2011)
Table 6 IQSASP2 Aggregation Possibilities
TYPELVLP Stratification 0 Overall 1 Race 2 Payer 3 Payer Race 4 Sex 5 Sex Race 6 Sex Payer 7 Sex Payer Race 8 Age 9 Age Race 10 Age Payer 11 Age Payer Race 12 Age Sex 13 Age Sex Race 14 Age Sex Payer 15 Age Sex Payer Race 16 Provider 17 Provider Race 18 Provider Payer 19 Provider Payer Race 20 Provider Sex 21 Provider Sex Race 22 Provider Sex Payer 23 Provider Sex Payer Race 24 Provider Age 25 Provider Age Race 26 Provider Age Payer 27 Provider Age Payer Race 28 Provider Age Sex 29 Provider Age Sex Race 30 Provider Age Sex Payer 31 Provider Age Sex Payer Race
0 and 16 TYPELVLP (overall and provider) are default values for the level of computation in the software
For example if you are using a state inpatient hospital database you might specify the following TYPELVLP values
0 ndash provides overall rates for your entire state 8 ndash provides overall rates for your state broken down by age groups 16 ndash provides rates for providers within your state 24 ndash provides rates for age groups within these providers
85 Program 5 Run IQSASP3
The IQSASP3 program calculates risk-adjusted rates by patient age sex and APR-DRG if available for each IQI and then calculates smoothed rates The risk-adjusted and smoothed rates are not calculated for the Provider volume indicators IQI 01-07 just as observed rates were not calculated for these indicators
Inpatient Quality Indicators (IQI) Software Instruction SAS
Inpatient Quality Indicators (IQI) 28 Version 43 (August 2011)
The programs calculate risk-adjusted IQI rates regardless of the number of cases available However IQI rates based on only a few cases should be interpreted with caution
The output file has records summarized to the various combinations of stratifiers that were specified in the TYPELVLP parameter of the preceding IQSASP2 program See Table 6 on page 27 Input
1 SAS format library (FMTLIB) created from the IQFMT program 2 The discharge-level file that was created with the IQSAS1 program
3 The SAS dataset with summary records that was created with the IQSASP2 program 4 A text file containing regression coefficients from a regression that was run on a
reference SID dataset These coefficients will be used in the risk-adjustment process Two files are provided as part of the IQI module Gee_piqxx_RegressionAnalysisGeecsv contains the regression coefficients Prediction_PIQxxxml contains the input parameters for the executable AHRQexe
Users must create a directory ldquoCAHRQQI AHRQPredictionrdquo and copy the
executable AHRQexe to that directory (along with 5 other files) Users must also create a directory ldquoCAHRQQIIQIrdquo and copy the zip file IQI_GEE_Input_Fileszip to that directory Extract all of the files from IQI_GEE_Input_Fileszip into the directory ldquoCAHRQQIIQIrdquo (See version 43 introduction on page 1)
5 A text file containing three arrays for use in the smoothing process The arrays
contain noise estimates signal estimates and mean area rates for each IQI Specify file MSXIQP42TXT The text file does not need to be converted to a SAS file for use with the software
Output
1 A SAS dataset with an overall summary record and with provider-level summary records that contain the three types of indicator rates along with the components of the initial raw rates Specifically the file contains the observed rates (OPIQxx variables) the risk-adjusted rates (RPIQxx variables) the smoothed rates (SPIQxx variables) the expected rates (EPIQxx variables) the counts of outcomes that formed the numerators of the observed rates (TPIQxx variables) and the hospital discharge totals that formed the denominators of the observed rates (PPIQxx variables) When stratifications other than hospital are selected the RPIQxx variables and their confidence intervals are observedexpected ratios to avoid confounding with risk-adjustment variables
2 An optional ASCII (comma delimited) text file that the user can then import into a
spreadsheet This text file contains the same information as the SAS output dataset
Inpatient Quality Indicators (IQI) Software Instruction SAS
Inpatient Quality Indicators (IQI) 29 Version 43 (August 2011)
The text file will contain the OPIQxx observed rates and their TPIQxx and PPIQxx numerator and denominator components the RPIQxx risk-adjusted rates the SPIQxx smoothed rates and the EPIQxx expected rates Each record or row in the text file will correspond to a specification group
3 A PROC MEANS (with N NMISS MIN MAX MEAN and SUM) of the provider-
level summary records that shows statistics for the observed risk-adjusted and smoothed rates and statistics for the counts of outcomes that formed the numerators and denominators of the observed rates These means will only be generated if the user included a value of 16 for the TYPELVLP parameter of the preceding IQSASP2 program (see Table 6 on page 27)
4 A PROC CONTENTS of the output SAS summary dataset is output to hardcopy
5 A PROC PRINT of the output summary dataset is provided at the end of the hardcopy
printout This printout may be quite large depending on the number and the types of stratifications that the user requested with the TYPELVLP parameter of the preceding IQSASP2 program (see Table 6 on page 27) If the user does not wish to generate this printout then the global ldquoPRINTrdquo parameter in CONTROL_IQISAS code should be set to zero
Changes
1 The ldquoFILENAME CONTROLrdquo statement at the beginning of the program must be changed to reflect the location of the CONTROL_IQISAS code
2 In CONTROL_IQISAS specify the locations (paths) of the input and output SAS
files in the ldquoLIBNAME INP3rdquo and ldquoLIBNAME OUTP3rdquo statements
3 In CONTROL_IQISAS specify in the ldquoINFILE1rdquo statement the name of the discharge-level file that you created with the IQSAS1 program
4 In CONTROL_IQISAS specify in the ldquoFILENAME MSXPrdquo statement the path
(including the file name) for the ASCII text file that contains the estimates to smooth the indicator rates Specify file MSXIQP42TXT
5 In CONTROL_IQISAS specify in the ldquoINFILEP2rdquo statement the name of the
summary file that you created with the IQSASA2 program
6 In CONTROL_IQISAS specify in the ldquoOUTFILP3rdquo statement the name that you wish the output file to have
7 In CONTROL_IQISAS if you wish to create an ASCII (comma delimited) text file
that you can import into a spreadsheet then set the TEXTP3 parameter to 1 Otherwise the default value of zero for TEXTA3 will skip the code that would generate this file
Inpatient Quality Indicators (IQI) Software Instruction SAS
Inpatient Quality Indicators (IQI) 30 Version 43 (August 2011)
8 In CONTROL_IQISAS if you wish to create an ASCII (comma delimited) text file that you can import into a spreadsheet then specify the path (including the file name) for this ASCII text file in the ldquoFILENAME IQTEXTP3rdquo statement
86 Program 6 Run IQSASA2
The IQSASA2 program calculates the observed or raw rates for the area-level Inpatient Quality Indicators using the data derived in a previous step (IQSAS1) These observed rates can be stratified by combinations of area sex age and race categories The program first totals the four area indicator flags created by the IQSAS1 program and then for each of the desired stratifiers divides these totals by the pertinent residential population The population denominators are stored in variables with names that have a prefix of ldquoPrdquo (Pop) The Observed rates are stored in variables that have a prefix of ldquoOrdquo Input
1 The SAS dataset that was created in the IQSAS1 This dataset is a discharge-level file that contains inpatient records with input variables stratifiers and the four new flag indicators for the IQI Area-level outcomes of interest
2 A text file with Census area residential populations stratified by area age sex and
ethnicity categories The file POP95T11TXT is currently provided on the website as a separate download The user should set POPYEAR to the year that best matches the userrsquos discharge data file
Users do not need to convert the ASCII text file to a SAS dataset for use with the software
3 SAS format library (FMTLIB) created from the IQFMT program
Output
1 SAS dataset with summary records that contain observed rates (OAIQxx variables where xx refers to the indicator number) the counts of outcomes that formed the numerators of the rates (TAIQxx variables) and the residential population totals that formed the denominators of the observed rates (PAIQxx variables) The output file has records summarized to the various combinations of stratifiers specified in the TYPELVLA parameter that is described in item number 5 in the ldquoChangesrdquo section below
2 An optional ASCII (comma delimited) text file that the user can then import into a
spreadsheet This text file contains the same information as the SAS output dataset The text file will contain the OAIQxx observed rates the TAIQxx counts of outcomes that formed the numerators of the rates and the PAIQxx residential population totals The different recordsrows in the text file will correspond to the different TYPELVLA stratification combinations
Inpatient Quality Indicators (IQI) Software Instruction SAS
Inpatient Quality Indicators (IQI) 31 Version 43 (August 2011)
3 A PROC MEANS (with N NMISS MIN MAX MEAN and SUM) of the area-level summary records that shows statistics for the OAIQxx observed rates the TAIQxx counts of outcomes that formed the numerators of the rates and the PAIQxx residential populations totals These means will only be generated if the user included a value of 8 for the TYPELVLA parameter discussed in item number 5 in the ldquoChangesrdquo section below
4 A PROC CONTENTS of the output SAS summary dataset is output to hardcopy
5 A PROC PRINT of the output summary dataset is provided at the end of the hardcopy
printout This printout may be quite large depending on the number and the types of stratifications that the user requests with the TYPELVLA parameter discussed in item number 5 in the ldquoChangesrdquo section below If the user does not wish to generate this printout then the global ldquoPRINTrdquo parameter in CONTROL_IQISAS code should be set to zero
Changes
1 The ldquoFILENAME CONTROLrdquo statement at the beginning of the program must be changed to reflect the location of the CONTROL_IQISAS code
2 In CONTROL_IQISAS specify the locations (paths) of the input and output SAS
files in the ldquoLIBNAME INA2rdquo and ldquoLIBNAME OUTA2rdquo statements
3 In CONTROL_IQISAS specify the names of the input and output files in the ldquoINFILE1rdquo and ldquoOUTFILA2rdquo statements The name that you specify with INFILE1 should be for the file that you created using the IQSAS1 program
4 In CONTROL_IQISAS specify the path (including the file name) for the ASCII
population text file in the ldquoFILENAME POPFILE statement The file name will be POP95T11TXT The user should set POPYEAR to the year that best matches the userrsquos discharge data file
5 In CONTROL_IQISAS specify the levels of aggregation for the observed rates This
change is done by specifying numbers between 0 and 15 in the ldquoLET TYPELVLA =rdquo statement Each number from 0 to 15 corresponds to a different level or combination of levels as shown in
Inpatient Quality Indicators (IQI) Software Instruction SAS
Inpatient Quality Indicators (IQI) 32 Version 43 (August 2011)
6 Table 7 The default values of 0 (overall) and 8 (area) will provide an overall total and area-level totals
WARNING TYPELVLA must include the values 0 (overall) and 8 (area) if you wish to subsequently run program IQSASA3 for risk-adjusted and smoothed rates
If TYPELVLA includes the value 0 (overall) then the first observation in the output summary data file will contain the overall totals and observed rates for the entire database created with the IQSAS1 program
Table 7 IQSASA2 aggregation possibilities
TYPELVLA Stratification 0 Overall 1 Race 2 Sex 3 Sex Race 4 Age 5 Age Race 6 Age Sex 7 Age Sex Race 8 Area 9 Area Race 10 Area Sex 11 Area Sex Race 12 Area Age 13 Area Age Race 14 Area Age Sex 15 Area Age Sex Race
0 (overall) and 8 (are) TYPELVLA are default values for the level of computation in the software
For example if you are using a state inpatient hospital database you might specify the following TYPELVLA values
0 ndash provides overall rates for your entire state 4 ndash provides overall rates for your state broken down by age groups 8 ndash provides rates for areas within your state 12 ndash provides rates for age groups within these areas
7 In CONTROL_IQISAS if you wish to create an ASCII (comma delimited) text file
that you can import into a spreadsheet then set the TEXTA2 parameter to 1 Otherwise the default value of zero for TEXTA2 will skip the code that would generate this file
8 In CONTROL_IQISAS if you wish to create an ASCII (comma delimited) text file
that you can import into a spreadsheet then specify the path (including the file name) for this ASCII text file in the ldquoFILENAME IQTEXTA2rdquo statement
Inpatient Quality Indicators (IQI) Software Instruction SAS
Inpatient Quality Indicators (IQI) 33 Version 43 (August 2011)
87 Program 7 Run IQSASA3 The IQSASA3 program calculates age and sex risk-adjusted rates for each area-level IQI
(overall rates and rates by area) and then calculates smoothed rates Input
1 SAS format library (FMTLIB) created from the IQFMT program 2 The discharge-level file that was created with the IQSAS1 program
3 The SAS dataset with summary records that was created with the IQSASA2 program
4 A text file with Census area residential populations (stratified by area sex and
discrete age categories) One file is currently provided along with the IQI module software The file is POP95T11TXT The user should set POPYEAR to the year that best matches the userrsquos discharge data file The text file does not need to be converted to a SAS file for use with the software
5 A text file (COVIQA42TXT) containing regression coefficients from a regression
that was run on the reference SID dataset These coefficients will be used in the risk adjustment process This file is provided to you as part of the IQI module The text file does not need to be converted to a SAS file for use with the software
6 A text file (MSXIQA42TXT) containing two arrays for use in the smoothing process
The arrays contain noise estimates signal estimates and mean area rates for each IQI This file is provided to you as part of the IQI module The text file does not need to be converted to a SAS file for use with the software
Output
1 A SAS dataset with an overall summary record and with area-level summary records that contain the three types of indicator rates along with the components of the initial raw rates Specifically the file contains the observed rates (OAIQxx variables) the risk-adjusted rates (RAIQxx variables) the smoothed rates (SAIQxx variables) the counts of outcomes that formed the numerators of the observed rates (TAIQxx variables) and the residential population totals that formed the denominators of the observed rates (PAIQxx variables) When stratifications other than area are selected the RAIQxx variables and their confidence intervals are observedexpected ratios to avoid confounding with risk-adjustment variables
2 An optional ASCII (comma delimited) text file that the user can then import into a
spreadsheet This text file contains the same information as the SAS output dataset The text file will contain the OAIQxx observed rates and their TAIQxx and PAIQxx components the RAIQxx risk-adjusted rates and the SAIQxx smoothed rates Each record or row in the text file will correspond to a different area
Inpatient Quality Indicators (IQI) Software Instruction SAS
Inpatient Quality Indicators (IQI) 34 Version 43 (August 2011)
3 Outputs to hardcopy are PROC MEANS (with N NMISS MIN MAX MEAN and SUM) of risk-adjusted and smoothed rates in two intermediate work files and of all of the numeric variables in the final output data file The printout also contains a PROC CONTENTS of the output SAS dataset A PROC PRINT of the output dataset is provided only if the ldquoPRINTrdquo parameter in CONTROL_IQISAS code is set to one
6 A PROC MEANS (with N NMISS MIN MAX MEAN and SUM) of the area-level
summary records that shows statistics for the OAIQxx observed rates and their TAIQxx and PAIQxx components the RAIQxx risk-adjusted rates and the SAIQxx smoothed rates
7 A PROC CONTENTS of the output SAS summary dataset is output to hardcopy
8 A PROC PRINT of the output summary dataset is provided at the end of the hardcopy
printout If the user does not wish to generate this printout then the global ldquoPRINTrdquo parameter in CONTROL_IQISAS code should be set to zero
Changes
1 The ldquoFILENAME CONTROLrdquo statement at the beginning of the program must be changed to reflect the location of the CONTROL_IQISAS code
2 In CONTROL_IQISAS specify the locations (paths) of the input and output SAS
files in the ldquoLIBNAME INA3rdquo and ldquoLIBNAME OUTA3rdquo statements
3 In CONTROL_IQISAS specify in the ldquoINFILE1rdquo statement the name of the discharge-level file that you created with the IQSAS1 program
4 In CONTROL_IQISAS specify the path (including the file name) for the ASCII
population text file in the ldquoFILENAME POPFILE3rdquo statement The file name is POP95T11TXT These files are provided along with the software The file used should be the one that is closest to the year associated with your particular data These files contain Census residential estimates by area gender and discrete age categories
5 In CONTROL_IQISAS specify in the ldquoFILENAME COVARArdquo statement the path
(including the file name) for the ASCII text file that contains regression coefficients from a regression that was run on reference SID dataset The name of the file is COVIQA42TXT
6 In CONTROL_IQISAS specify in the ldquoFILENAME MSXArdquo statement the path
(including the file name) for the ASCII text file that contains the estimates to smooth the indicator rates The name of the file is MSXIQA42TXT
7 In CONTROL_IQISAS specify in the ldquoINFILEA2rdquo statement the name of the
summary file that you created with the IQSASA2 program
Inpatient Quality Indicators (IQI) Software Instruction SAS
Inpatient Quality Indicators (IQI) 35 Version 43 (August 2011)
8 In CONTROL_IQISAS specify in the ldquoOUTFILA3rdquo statement the name that you wish the output file to have
9 In CONTROL_IQISAS if you wish to create an ASCII (comma delimited) text file
that you can import into a spreadsheet then set the TEXTA3 parameter to 1 Otherwise the default value of zero for TEXTA3 will skip the code that would generate this file
10 In CONTROL_IQISAS if you wish to create an ASCII (comma delimited) text file
that you can import into a spreadsheet then specify the path (including the file name) for this ASCII text file in the ldquoFILENAME IQTEXTA3rdquo statement
Inpatient Quality Indicators (IQI) Software Instruction SAS
Inpatient Quality Indicators (IQI) 36 Version 43 (August 2011)
90 Reviewing the Printed Output This section contains tips for reviewing some of the printed output from the IQI module
These tips are oriented toward explaining the interrelationships between printout items from different programs and hopefully will help to reveal the nature and structure of the module outputs For guidance in interpreting the results see the Interpretations Guide
The final output of the IQI module is a PROC PRINT from IQSASP3 (for provider-level indicators) and IQSASA3 (for area-level indicators) All interim printouts are for checking and trouble-shooting However if you have elected to refrain from risk-adjusting and smoothing the data then the final outputs will be the PROC PRINT at the end of the IQSASP2 andor IQSASA2 programs
91 IQSAS1
The initial printout from the IQSAS1 program contains PROC MEANS for all of the numeric variables in the output discharge-level dataset It will contain information for the newly constructed TAIQxx and TPIQxx flag variables that will later form the numerators for the indicator rates For each TAIQxx and TPIQxx flag variable
bull The SUM will contain the total number of observations in the dataset that were found to have the particular outcome of interest
bull For the six Provider volume indicators (TPIQ01-TPIQ02 TPIQ04-TPIQ07) and the four Area indicators (TAIQ26-TAIQ29) the MEAN MINIMUM and MAXIMUM will usually be the value one since the flag variables have either been set to missing (lsquorsquo) or to a value of one The remainder of the Provider indicators (TPIQ08-TPIQ09 TPIQ11-TPIQ25 and TPIQ30-TPIQ34) have a value of one zero or missing (lsquorsquo) For these indicators a value of zero was assigned to the TPIQxx flag if a particular observation was part of the population at risk for a particular indicator but did not have the particular outcome of interest So for example TPIQ21 = 1 indicates a patient who had a Cesarean section while TPIQ21 = 0 identifies a patient who had a delivery but not a C-section
bull For the Provider indicators TPIQ08-TPIQ09 TPIQ11-TPIQ25 and TPIQ30-TPIQ34 the MEANs will contain a close approximation of the eventual overall observed indicator rates The values will change slightly after IQSASP2 has applied additional parts of the indicator definitions
bull N lists the number of observations in the dataset with non-missing values For the six provider-based volume indicators and the four area-level indicators N for TPIQxx or TAIQxx will be the same as the SUM For the other provider-based indicators N will contain the denominator for the observed indicator rate Note the Nrsquos or denominators for six of the mortality indicators (ie IQI 08-12 30 and 31) will be similar to the Ns and SUMs for the six volume indicators (TPIQ01-TPIQ02 TPIQ04-TPIQ07) but often they will not be exactly identical (eg the mortality indicators exclude discharges that were transferred to other hospitals)
Inpatient Quality Indicators (IQI) Software Instruction SAS
Inpatient Quality Indicators (IQI) 37 Version 43 (August 2011)
The IQSAS1 printout also contains a PROC CONTENTS that lists all of the variables in the output dataset including the character variables that are present and a PROC PRINT of the first 24 observations in the output dataset
92 IQSASP2 The purpose of this printout is to provide the observed rates for all provider-level indicators
The default printout shows results by provider but other levels of output (as shown in Table 6) can be specified as well Note that risk-adjusted and smoothed rates are shown in the output from the next program
The printout from the IQSASP2 program contains PROC MEANS on the provider-level summary records for all of the numeric variables in the output summary dataset It will contain information for the newly constructed OPIQxx rates the PPIQxx denominators and the TPIQxx numerators
bull The _TYPE_ variable described in the MEANS table identifies the stratification level for the records in the output data set The _TYPE_ variable corresponds to the TYPELVLP parameter values that were specified (see item number 4 in the ldquoChangesrdquo section for the IQSASP2 program on page 32) In this case _TYPE_ always assumes the value of 16 since only the provider-level records are selected
bull The N statistic for _TYPE_ contains the number of providers in the output summary data set A TPIQxx numerator variable with a value for N that is lower than the N value for _TYPE_ indicates that there were no outcomes of interest for some of the providers Similarly a PPIQxx denominator variable with a lower value for N than _TYPE_ indicates that for some providers there were no hospital discharges with the outcome of interest
bull The MINIMUM value for the TPIQ08-TPIQ25 TPIQ30 and TPIQ31 numerators will usually be zero since values of zero were assigned for observations that were part of the population for the rate denominator but did not have the particular outcome of interest to be included in the rate numerator For the volume indicators (TPIQ01-TPIQ07) the MINIMUM value will be one or higher
For the observed rates the User should NOT report the MEANS displayed here but instead should refer to the overall means in the output dataset that are also present in the subsequent PROC PRINT The MEANS given here are means of hospital means ie all hospitals are given equal weight regardless of the number of discharges in the different hospitals
bull The SUMs for the counter variables TPIQxx and PPIQxx will contain overall file totals for these data elements The SUMs for the observed rates have no intuitive meaning If the ldquoPRINTrdquo parameter in the CONTROL_IQISAS program is set to one the subsequent
PROC PRINT output contains a complete dump of the output summary file Listed for each record are the stratification values the PPIQxx population denominators for the 30 provider indicators the TPIQxx outcome numerators for the 30 provider indicators and the 30 OPIQxx observed rates
Inpatient Quality Indicators (IQI) Software Instruction SAS
Inpatient Quality Indicators (IQI) 38 Version 43 (August 2011)
93 IQSASP3 The PROC PRINT at the end of this program provides your final output (This printout appears if the ldquoPRINTrdquo parameter in the CONTROL_IQISAS program is set to one)
The following table lists the column headers shown on the printed output and describes each
Each indicator is reported in a separate section Values of ldquoxxrdquo correspond to the two-digit IQI number Table 8 Provider level printed output
Column Heading Description Obs Observation 1 (with HOSPID = ldquordquo) is the overall average for the entire dataset
(TYPELVLP = 0) The remaining observations are individual providers or hospitals (TYPELVLP = 16)
HOSPID Identifier for each provider in the dataset AGECAT Age stratification category ndash See Table 6 for TYPELVLP settings SEXCAT Gender stratification category ndash See Table 6 for TYPELVLP settings PAYCAT Payer stratification category ndash See Table 6 for TYPELVLP settings RACECAT Race stratification category ndash See Table 6 for TYPELVLP settings TPIQxx Number of cases in the numerator PPIQxx Number of cases in the denominator (population at risk) OPIQxx Observed (raw) rate ndash Numerator divided by Denominator EPIQxx Expected rate ndash Rates the provider would have if it performed the same as the
reference population given the providerrsquos actual case-mix (eg age gender modified DRG and comorbidities)
RPIQxx Risk-adjusted rate ndash Accounts for the difference between the case-mix of the reference population and the providerrsquos case-mix When stratifications other than hospital or area are selected the RPIQxx variables and their confidence intervals are observedexpected ratios to avoid confounding with risk adjustment variables
LPIQxx Lower limit of confidence interval of risk-adjusted rate UPIQxx Upper limit of confidence interval of risk-adjusted rate SPIQxx Smoothed rate ndash Rates with removal of fluxuation over time XPIQxx Standard error of smoothed rate
Observation 1 (with HOSPID = ) is the overall average for the entire dataset (TYPELVL =
0) The remaining observations are individual providers or hospitals (TYPELVL = 16) Data will appear under the column headers AGECAT SEXCAT PAYCAT and RACECAT if you specify these levels of aggregation (shown in Table 6)
You may wish to express the results in more understandable terms
bull Multiply the mortality rates by 100 to express them as a percentage (eg 00338 100 = 34 mortality for CABG)
bull Multiply the utilization rates by 100 to express them as a percentage (eg 02040 100 = 204 C-section rate)
Inpatient Quality Indicators (IQI) Software Instruction SAS
Inpatient Quality Indicators (IQI) 39 Version 43 (August 2011)
The MEANS table is generated from the permanent provider-based output file and is provided for trouble-shooting and understanding your data but not for reporting The means are provided just for the provider level summary records
bull The N for all but the TPIQxx counter variables should contain the number of providers in the userrsquos database
bull The MEANS MINIMUMs and MAXIMUMs have their normal meaning and provide comparisons among the different hospitals or providers in your database
For the (observed risk-adjusted or smoothed) rates the User should NOT report the MEANS displayed here but instead refer to the overall means in the output dataset in the PROC PRINT labeled ldquoFINAL OUTPUTrdquo The MEANS given here are means of hospital means ie all hospitals are given equal weight regardless of the number of discharges in the different hospitals
bull Note The denominators for six of the mortality indicators ( 8 ndash 12 30 and 31) will be similar to the totals for the six volume indicators (TPIQ01-TPIQ07) but often they will not be exactly identical (eg the mortality indicators exclude discharges that were transferred to other hospitals)
bull If the ldquoPRINTrdquo parameter in the CONTROL_IQISAS program is set to one at the end of the printout is a PROC PRINT on the final provider-based output file Listed for each level of stratification are the stratifiers the numerator and denominator totals for the observed rates and the observed risk-adjusted and smoothed rates
94 IQSASA2
The purpose of this printout is to provide the observed rates for all area-level indicators The default printout shows overall results and results by area but other levels of output (as shown in Table 6) can be specified as well Note that risk-adjusted and smoothed rates are shown in the output from the next program
The printout from the IQSASA2 program contains PROC MEANS for all of the numeric variables in the output summary dataset It will contain information for the newly constructed OAIQxx rates the PAIQxx denominators and the TAIQxx numerators
bull The _TYPE_ variable described in the first row of the MEANS table identifies the stratification level for the records in the output data set The _TYPE_ variable corresponds to the TYPELVLA parameter values that were specified (see item 5 in the ldquoChangesrdquo section for the IQSASA2 program on page 31) In this case _TYPE_ always assumes the value of 8 since only the area-level records are selected
bull The N statistic for _TYPE_ contains the number of areas in the output summary data set A TAIQxx numerator variable with a lower value for N than _TYPE_ indicates that there were no outcomes of interest for some of the areas
bull The MINIMUM value for the TAIQxx numerators will be one or higher
Inpatient Quality Indicators (IQI) Software Instruction SAS
Inpatient Quality Indicators (IQI) 40 Version 43 (August 2011)
For the observed rates the User should NOT report the MEANS displayed here but instead should refer to the overall means in the output dataset that are also present in the subsequent PROC PRINT The MEANS given here are means of the area means ie all areas are given equal weight regardless of the population in the different areas
bull The SUMs for the counter variables TAQIxx and PAIQXX will contain overall file totals for these data elements The SUMs for the observed rates have no intuitive meaning
If the ldquoPRINTrdquo parameter in the CONTROL_IQISAS program is set to one the subsequent
PROC PRINT output contains a complete dump of the output summary file Listed for each record are the stratification values the PAIQxx population denominators for the four indicators the TAIQxx outcome numerators for the four indicators and the four OAIQxx observed rates
95 IQSASA3 The PROC PRINT at the end of this program provides your final output (This printout appears if the ldquoPRINTrdquo parameter in the CONTROL_IQISAS program is set to one)
The following table lists the column headers shown on the printed output and describes each
Each indicator is reported in a separate section Values of ldquoxxrdquo correspond to the two-digit IQI number Table 9 Area level printed output
Column Heading Description
Obs Observation 1 is the overall average for the entire dataset (TYPELVLA = 0) The remaining observations are individual areas (TYPELVLA = 8)
Area Identifier in the dataset for area TAIQxx Number of cases in the numerator PAIQxx Number of cases in the denominator (population at risk) OAIQxx Observed (raw) rate ndash Numerator divided by Denominator RAIQxx Risk-adjusted rate ndash Accounts for the difference between the case-mix of the
reference population and the arearsquos case-mix When stratifications other than hospital or area are selected the RPIQxx variables and their confidence intervals are observedexpected ratios to avoid confounding with risk adjustment variables
SAIQxx Smoothed rate ndash Rates with removal of fluxuation over time
Observation 1 (with AREA = blank) is the overall average for the entire dataset (TYPELVL = 0) The remaining observations are individual areas (TYPELVL = 8)
You may wish to express the results in more understandable terms
bull Multiply the utilization rates by 100000 to express them as a rate per 100000 population (eg 0000494 100000 = 494 hysterectomies per 100000 population)
The MEANS table is generated from the permanent area-level output file The means are
provided just for the area-level summary records
Inpatient Quality Indicators (IQI) Software Instruction SAS
Inpatient Quality Indicators (IQI) 41 Version 43 (August 2011)
bull The N for all but the TAIQxx counter variables should contain the number of different areas (Metro Areas and counties) in your database
bull The MEANs MINIMUMs and MAXIMUMs have their normal meaning and provide comparisons among the different areas in your database Note that the MAXIMUMs for the counter variables (the TAIQxx and PAIQxx variables) are associated with specific areas and therefore these MAXIMUMs may not match those in the prior IQSAS2 printouts since that run typically will include a record for the entire database
For the (observed risk-adjusted or smoothed) rates the User should NOT report the MEANS displayed here but instead refer to the overall means in the output dataset that are also present in the subsequent PROC PRINT The MEANS given here are means of area means ie all areas are given equal weight regardless of the number of discharges in the different areas
bull The SUMs of the counter variables (the TAIQxx and PAIQxx variables) yield the overall database totals
Inpatient Quality Indicators (IQI) Software Instruction SAS
Inpatient Quality Indicators (IQI) 42 Version 43 (August 2011)
100 Benchmark Timings The benchmark runtimes given below are from runs made on a Windows XP workstation
with a Pentium 4 CPU 280 GHz processor 512 MB of RAM and an IDE hard drive The dataset used contained 757624 observations with 15 diagnosis fields and 15 procedure fields
Step Run time (in seconds) Run IQFMTS to create the format library 2 Run IQSAS1 157 Run IQSASP2 21 Run IQSASP3 86 Run IQSASA2 10 Run IQSASA3 185
101 User Support Technical assistance is available through an electronic user support system monitored by the
QI support team to support users in their application of the IQI software The same e-mail address may be used to communicate to AHRQ any suggestions for IQI enhancements general questions and any QI related comments you may have AHRQ welcomes your feedback
The Internet address for user support and feedback is supportqualityindicatorsahrqgov AHRQ also offers a listserv to keep you informed on the Quality Indicators (QIs) The
listserv is used to announce any QI changes or updates new tools and resources and to distribute other QI related information This is a free service Simply follow the process described below to begin receiving important QI information All you need is a computer Internet access and an E-mail address It works just like other electronic distribution lists
Herersquos how to register 1 Send an E-mail message to listservqualityindicatorsahrqgov 2 On the subject line type Subscribe For example Subscribe
3 In the body of the message type sub Quality_Indicators-L and your full name For example sub Quality_Indicators-L John Doe
4 You will receive a message confirming that you are signed up If you have any questions contact AHRQ QI Support at the e-mail noted above You should
receive an automatic response e-mail message confirming receipt of your e-mail If you do not receive a confirmation message call (888) 512-6090
Inpatient Quality Indicators (IQI) Software Instruction SAS
Inpatient Quality Indicators (IQI) 43 Version 43 (August 2011)
Appendix A Links The following links may be helpful to users of the AHRQ Inpatient Quality Indicators
Inpatient Quality Indicators Version 43 Documents and Software Available at httpwwwqualityindicatorsahrqgovmodulesiqi_resourcesaspx and httpwwwqualityindicatorsahrqgovsoftwaredefaultaspx
Title Description
IQI User Guide Individual Measures
The user guide provides a technical overview of the IQI individual measures including literature and empirical evidence
IQI User Guide Composite Measures
The user guide provides a technical overview of the IQI composite measures
IQI Technical Specifications
Provides detailed definitions of each IQI including all ICD-9-CM and DRG codes that are included in or excluded from the numerator and denominator Note that exclusions from the denominator are automatically applied to the numerator
IQI Comparative Data This document provides the average volume provider rate and population rate as appropriate for each indicator
Fiscal year 2011 Coding Changes
This document summarizes the changes to the indicator definitions resulting from FY 2011 changes to ICD-9-CM coding and DRG changes These changes will only affect data from FY 2011 (October 1 2011) or later
Log of Changes to IQI Documents and Software
The Change Log document provides a cumulative summary of all changes to the IQI software software documentation and other documents made since the release of version 21 of the software in March 2003 Changes to indicator specifications that were not a result of new ICD-9-CM and DRG codes are also described in the Change Log
IQI Risk Adjustment Coefficient Tables
Tables for each IQI provide the stratification and coefficients used to calculate the risk-adjusted rate for each strata
SASreg IQI Software Documentation
This software documentation provides detailed instructions on how to use the SAS reg version of the IQI software including data preparation calculation of the IQI rates and interpretation of output
SASreg IQI Software Requires the SASreg statistical program distributed by the SAS Institute Inc The company may be contacted directly regarding the licensing of its products httpwwwsascom
3Mreg APRreg DRG Limited License Grouper for SASreg
Creates APR-DRG variables for use with SAS version of IQI software Instructions for running the software are included in the Zip file
Version 43 Listserv announcement
This document announces the release of the Version 43 software and documentation provides a summary of changes and links to relevant pages
Inpatient Quality Indicators (IQI) Software Instruction SAS
Inpatient Quality Indicators (IQI) 44 Version 43 (August 2011)
AHRQ QI Windows Application The AHRQ QI Windows Application calculates rates for all of the AHRQ Quality Indicators modules and does not require SASreg It is available at
httpwwwqualityindicatorsahrqgovwinqi_downloadhtm Additional Documents The following documents are available within the Archive section of the AHRQ QI Web page
httpwwwqualityindicatorsahrqgovArchivedefaultaspxiqi
bull Refinement of the HCUP Quality Indicators (Technical Review) May 2001 bull Refinement of the HCUP Quality Indicators (Summary) May 2001
In addition these documents may be accessed at the AHRQ QI Modules Web page
httpwwwqualityindicatorsahrqgovmodulesDefaultaspx bull AHRQ QI Measure Development Implementation Maintenance and Retirement bull ICD-9-CM to ICD-10-CMPCS Conversion of AHRQ QI March 2011 bull AHRQ QI Empirical Methods May 2011 bull Guidance for Using the AHRQ Quality Indicators for Hospital-level Public Reporting
or Payment August 2004 bull AHRQ Summary Statement on Comparative Hospital Public Reporting December
2005 bull Appendix A Current Uses of AHRQ Quality Indicators and Considerations for
Hospital-level bull Comparison of Recommended Evaluation Criteria in Five Existing National
Frameworks bull List of AHRQ QI Endorsed by the National Quality Forum
The following documents can be viewed or downloaded from the AHRQ QI News Web page
httpwwwqualityindicatorsahrqgovnewsdefaultaspx and httpwwwqualityindicatorsahrqgovArchiveNewsaspx bull February 2007 Newsletter - Year highlights and future plans bull February 2006 Newsletter ndash Year highlights and future plans bull 2006 Area Level Indicator Changes bull Considerations in Public Reporting for the AHRQ QI bull June 2005 Newsletter - Contains the article Using Different Types of QI Rates
Inpatient Quality Indicators (IQI) Software Instruction SAS
Inpatient Quality Indicators (IQI) 45 Version 43 (August 2011)
Other Tools and Information
IQI rates can be calculated using the modified Federal Information Processing Standards (FIPS) Statecounty code A list of codes is available at
httpwwwcensusgovpopestgeographiccodes02pdf
AHRQ provides a free on-line query system based on HCUP data that provides access to health statistics and information on hospital stays at the national regional and State level It is available at
httphcupahrqgovHCUPnetasp
Information on the 3Mtrade APR-DRG system is available at
httpwww3mcomushealthcarehisproductscodingrefined_drgjhtml
Inpatient Quality Indicators (IQI) Software Instruction SAS
Inpatient Quality Indicators (IQI) 46 Version 43 (August 2011)
Appendix B Using Different Types of QI Rates When should you use the observed expected risk adjusted andor smoothed rates generated
by the AHRQ QI software Here are some guidelines If the userrsquos primary interest is to identify cases for further follow-up and quality
improvement then the observed rate would help to identify them The observed rate is the raw rate generated by the QI software from the data the user provided Areas for improvement can be identified by the magnitude of the observed rate compared to available benchmarks andor by the number of patients impacted
Additional breakdowns by the default patient characteristics used in stratified rates (eg age gender or payer) can further identify the target population Target populations can also be identified by user-defined patient characteristics supplemented to the casedischarge level flags Trend data can be used to measure change in the rate over time
Another approach to identify areas to focus on is to compare the observed and expected rates The expected rate is the rate the provider would have if it performed the same as the reference population given the providerrsquos actual case-mix (eg age gender DRG and comorbidity categories)
If the observed rate is higher than the expected rate (ie the ratio of observedexpected is greater than 10 or observed minus expected is positive) then the implication is that the provider performed worse than the reference population for that particular indicator Users may want to focus on these indicators for quality improvement
If the observed rate is lower than the expected rate (ie the ratio of observedexpected is less than 10 or observed minus expected is negative) then the implication is that the provider performed better than the reference population Users may want to focus on these indicators for identifying best practices
Users can also compare the expected rate to the reference population rate reported in the AHRQ QI software or Comparative Data document to determine how their case-mix compares to the reference population The population rate refers to the overall rate for the reference population The reference population is defined in the Comparative Data Document If the population rate is higher than the expected rate then the providerrsquos case-mix is less severe than the reference population If the population rate is lower than the expected rate then the providerrsquos case-mix is more severe than the reference population
We use this difference between the population rate and the expected rate to ldquoadjustrdquo the observed rate to account for the difference between the case-mix of the reference population and the providerrsquos case-mix which is the providerrsquos risk-adjusted rate
If the provider has a less severe case-mix then the adjustment is positive (population rate gt expected rate) and the risk-adjusted rate is higher than the observed rate If the provider has a more severe case-mix then the adjustment is negative (population rate lt expected rate) and the risk-adjusted rate is lower than the observed rate The risk-adjusted rate is the rate the provider would have if it had the same case-mix as the reference population given the providerrsquos actual performance
Finally users can compare the risk-adjusted rate to the smoothed or ldquoreliability-adjustedrdquo rate to determine whether this difference between the risk-adjusted rate and reference population rate is likely to remain in the next measurement period Smoothed rates are weighted averages of the population rate and the risk-adjusted rate where the weight reflects the reliability of the providerrsquos risk-adjusted rate
Inpatient Quality Indicators (IQI) Software Instruction SAS
Inpatient Quality Indicators (IQI) 47 Version 43 (August 2011)
A ratio of (smoothed rate - population rate) (risk-adjusted rate - population rate) greater than 080 suggests that the difference is likely to persist (whether the difference is positive or negative) A ratio less than 080 suggests that the difference may be due in part to random differences in patient characteristics (patient characteristics that are not observed and controlled for in the risk-adjustment model) In general users may want to focus on areas where the differences are more likely to persist
Inpatient Quality Indicators (IQI) Software Instruction SAS
Inpatient Quality Indicators (IQI) 48 Version 43 (August 2011)
Appendix C IQI Input Data Dictionary Variable name Description Format Value description Comments
KEY Sequence number Unique case identifier Numeric
User defined unique numeric identifier for each discharge record
Not used by the QI programs but should be present to facilitate possible exploration allows user to link the records from the IQSAS1SAS program output file back to the original input data file
AGE Age in years at admission Numeric Age in years
If this data element is missing the discharge record will be excluded from analysis
AGEDAY Age in days (coded only when the age in years is less than 1) Numeric Age in days
Not used in the IQI program If not present in the input data file it is not necessary to create a dummy variable for this module
RACE Race of patient Numeric 1 2 3 4 5 6
White Black Hispanic Asian or Pacific Island Native American Other
The values of 1-5 are used directly in the QI software All other ethnicity codes are mapped to an lsquootherrsquo category
SEX Sex of patient Numeric
1 2
Male Female
If this data element is missing the discharge record will be excluded from the analysis
PAY1 Expected primary payer
Numeric 1 2 3 4 5 6
Medicare Medicaid Private incl HMO Self-pay No charge Other
The values of 1 2 3 and 4 are used directly in the QI software All other payer codes are mapped to an lsquootherrsquo category This data element is used to stratify only the Provider-level IQI (IQI-01 toIQI-25 IQI-30 to IQI-34)
PAY2 (SAS Only)
Expected secondary payer
Numeric 1 2 3 4 5 6
Medicare Medicaid Private incl HMO Self-pay No charge Other
Use is optional but must be present in data (set to missing if data element not available)
PSTCO
Location of patient residence or hospital location (FIPSdagger Statecounty code)
Numeric ssccc
Modified Federal Information Processing Standards Statecounty code2
See Appendix A for link to most recent list of codes If this data element is missing the discharge record will be excluded from rate calculations
HOSPID Data Source hospital number Numeric Hospital
identification number Used to facilitate data exploration and possible trouble shooting
2 Federal Information Processing Standard as defined by the US Department of Commerce National Institute of Standards and Technology (formerly National Bureau of Standards) Note Certain independent cities (Baltimore City Carson City and St Louis City) and areas within Hawaii and Virginia are assigned to different area groupings in the Modified FIPS categories as compared to the US Census Bureau groupings The AHRQ QI software uses the Modified FIPS code assignment of these areas Failure to use the Modified FIPS codes assignment will result in the use of incorrect denominator estimates for area indicators A list is available at httpwwwcensusgovpopestgeographiccodes02pdf
Inpatient Quality Indicators (IQI) Software Instruction SAS
Inpatient Quality Indicators (IQI) 49 Version 43 (August 2011)
Variable name Description Format Value description Comments
DISP Disposition of patient
Numeric 1 2 3 4 5 6 7 20
Routine Short-term hospital Skilled nursing facility Intermediate care Another type of facility Home health care Against medical advice Died in the hospital
The values 2 and 20 are referenced by the QI code (to identify transfers to another short-term hospital and patients who died in the hospital)
MORT30 (SAS Only)
30-Day Mortality Indicator Numeric
0 ndash not died within 30-days from admission
Use is optional but must be present in data (set to missing if data element not available)
1 ndash died within 30-days from admission
DNR Do Not Resuscitate Indicator Numeric
0 ndash No ldquoDo Not Resuscitaterdquo Indicator
Use is optional but must be present in data (set to missing if data element not available)
1 ndash ldquoDo Not Resuscitaterdquo Indicator
ATYPE Admission Type Numeric 1 2 3 4 5 6
Emergency Urgent Elective Newborn Trauma Center3 Other
Not used by the IQI program If not present in the input data file it is not necessary to create a dummy variable
ASOURCE Admission Source
Numeric 1 2 3 4 5
ER Another hospital Another facility including LTC Courtlaw enforcement Routinebirthother
The value 2 is referenced by the QI code (to identify transfers from another short-term hospital)
LOS Length of Stay Numeric Number of days from admission to discharge
Not used by the IQI program If not present in the input data file it is not necessary to create a dummy variable
APR_DRG APR-DRG category Numeric APR-DRG from 3Mreg software
Although the IQI module will operate without these variables users should run APR-DRG software on their raw data to assign this variable to each case See Section 53 on page 15
APRDRG_ RISK_ MORTALITY
APR-DRG Mortality Score Numeric
APR-DRG Risk of Mortality Score from 3Mreg software
See Section 53 on page 15
XPRDRG_ RISK_ MORTALITY
APR-DRG Mortality Score with POA Numeric
APR-DRG Risk of Mortality Score from 3Mreg Software using
See Section 53 on page 15
3 The ATYPE value ldquo5rdquo was used to indicate delivery only in the 1988 to 1997 HCUP data files The UB standards currently use ldquo5rdquo to indicate Trauma Center
Inpatient Quality Indicators (IQI) Software Instruction SAS
Inpatient Quality Indicators (IQI) 50 Version 43 (August 2011)
Variable name Description Format Value description Comments
POA information
DRG Diagnosis Related Group Numeric DRG from federal (CMS) DRG Grouper
DRGVER Diagnosis Related Group Version Numeric
DRG Version of federal (CMS) DRG Grouper
eg Version 28 for FY2011
MDC Major Diagnostic Category Numeric MDC from federal (CMS) DRG grouper
DISCWT Weight to assign to discharge Numeric Format as nnnnn
Cases with missing values are assigned a value of 1 Assigning a weight of zero has the effect of removing the case from the analysis
DX1 ndash DX30
ICD-9-CM diagnosis codes DX1 is the principal diagnosis DX2-DX30 are secondary diagnoses
String 3 4 or 5
characters (do not include decimal point)
Diagnosis codes Users must specify the number of diagnoses in the parameter ampNDX in CONTROL_IQISAS program
DXPOA1- DXPOA30-
Present on admission indicator for each diagnosis code
String
1 = present at the time of inpatient admission
These data will be used in risk adjustment and smoothing if the alternative parameter files of risk-adjustment covariates and population rates is specified
(YWE1)
0 = not present at the time of inpatient admission
(NUrsquo0rsquo )
NDX Count of the number of diagnoses (DX) on the discharge record
Numeric
Count of diagnoses (principal and all secondary diagnoses)
Not used by the IQI SAS program If not present in the input data file it is not necessary to create a dummy variable Definition is If the 1st discharge record has 1 Pr and the 2nd has 2 NPR would be 1 for the 1st record and 2 for the 2nd
PR1 ndash PR30
ICD-9-CM procedure codes PR1 is the principal procedure PR2-PR30 are secondary procedures
String 3 or 4
characters (do not include decimal point)
Procedure code
Users with more or fewer secondary procedures should modify the parameter ampNPR in CONTROL_IQISAS to reflect the number of diagnoses
NPR Count of the number of procedures (PR) on the discharge record
Numeric
Count of procedures (principal and all secondary procedures)
Not used by the IQI SAS program If not present in the input data file it is not necessary to create a dummy variable Definition is If the 1st discharge record has 1 Pr and the 2nd has 2 NPR would be 1 for the 1st record and 2 for the 2nd
Inpatient Quality Indicators (IQI) Software Instruction SAS
Inpatient Quality Indicators (IQI) 51 Version 43 (August 2011)
Variable name Description Format Value description Comments
POINTOFORIGINUB04
Point of Origin Numeric 4 Transfer from a hospital 5 Transfer from a skilled Nursing Facility (SNF) or Intermediate Care Facility (ICF)
Only these values are used by the QI programs
6 Transfer from another health care facility
IF ATYPE = 4
5 Born inside this hospital
6 Born outside of this hospital
PRDAY1 ndash PRDAY30
Days from admission to procedure PR1 is the principal procedure PR2-PR30 are secondary procedures
Numeric Days from Admission to Procedure4
Not used by the IQI program If not present in the input data file it is not necessary to create a dummy variable for this module
YEAR
Year of discharge The patientrsquos year of discharge For example a patient discharged on July 7 2004 would have a discharge year of lsquo2004rsquo
Numeric
YYYY
Discharge year should be within the range of 1997 to 2011
DQTR Quarter of discharge The calendar quarter of the patientrsquos discharge For example a patient discharged on July 7 2004 would have a discharge quarter of lsquo3rsquo
Numeric 1 January-March 2 April-June 3 July-September 4 October-December
See httphcup-usahrqgovtoolssoftwarecomorbiditycomorbidityjsp
4 Variables PRDAY1 to PRDAY30 are defined as the number of days from date of admission to date of procedure for each procedure For example if the patient was admitted on June 15th and had two procedures - the principal procedure on June 15th and a second procedure on June 18th ndash then the value of PRDAY1 would be zero (0) and the value of PRDAY2 would be three (3) For more information consult the HCUP data documentation at httpwwwhcup-usahrqgovdbvarsprdaynnisnotejsp
Inpatient Quality Indicators (IQI) Software Instruction SAS
Inpatient Quality Indicators (IQI) 52 Version 43 (August 2011)
Appendix D SAS IQI Output Data Dictionary SAS IQI Provider Output Column Heading Description Format Comments
Obs Observation 1 (with HOSPID = ) is the overall average for the entire dataset (TYPELVLP = 0) The remaining observations are individual providers or hospitals (TYPELVLP = 16)
Numeric
HOSPID Identifier for each provider in the dataset
Text Up to 12 characters
AGECAT Age stratification category Numeric range
SEXCAT Gender stratification category Numeric 1 = male 2 = female PAYCAT Payer stratification category Numeric 1 = Medicare
2 = Medicaid 3 = Private incl HMO 4 = Self-pay 5 = No charge 6 = Other
RACECAT Race stratification category Numeric 1 = White 2 = Black 3 = Hispanic 4 = Asian or Pacific Island 5 = Native American 6 = Other
TPIQxx The number of discharge records included in the numerator (outcome of interest) as defined for the indicator
Numeric
PPIQxx The number of discharge records included in the denominator (population at risk) as defined for the indicator
Numeric
OPIQxx The rate (observed numerator observed denominator) as defined for the indicator
Numeric
EPIQxx Rate calculated by assuming an average performance for each patient group based on the reference population but with the providerlsquos actual case-mix
Numeric
RPIQxx The estimated rate calculated by adjusting to an average case-mix
Numeric When stratifications other than hospital or area are selected the RPIQxx variables and their confidence intervals are observedexpected ratios to avoid confounding with risk adjustment variables
LPIQxx The lower confidence bound of the risk adjusted rate
Numeric
UPIQxx The upper confidence bound of the risk adjusted rate
Numeric
Inpatient Quality Indicators (IQI) Software Instruction SAS
Inpatient Quality Indicators (IQI) 53 Version 43 (August 2011)
Column Heading Description Format Comments
SPIQxx The smoothed rate calculated using multivariate signal extraction (MSX)
Numeric
XPIQxx Standard error of smoothed rate Numeric VPIQxx Variance for respective indicators Numeric
SAS IQI Area Output Column Heading Description Format Comments
Obs Observation 1 (with HOSPID = ) is the overall average for the entire dataset (TYPELVLP = 0) The remaining observations are individual providers or hospitals (TYPELVLP = 16)
Numeric
AREA Identifier in the dataset for area Text TAIQxx The number of discharge records
included in the numerator (outcome of interest) as defined for the indicator
Numeric
PAIQxx The number of discharge records included in the denominator (population at risk) as defined for the indicator
Numeric
OAIQxx The rate (observed numerator observed denominator) as defined for the indicator
Numeric
RAIQxx The estimated rate calculated by adjusting to an average case-mix
Numeric When stratifications other than hospital or area are selected the RAIQxx variables and their confidence intervals are observedexpected ratios to avoid confounding with risk adjustment variables
SAIQxx The smoothed rate calculated using multivariate signal extraction (MSX)
Numeric
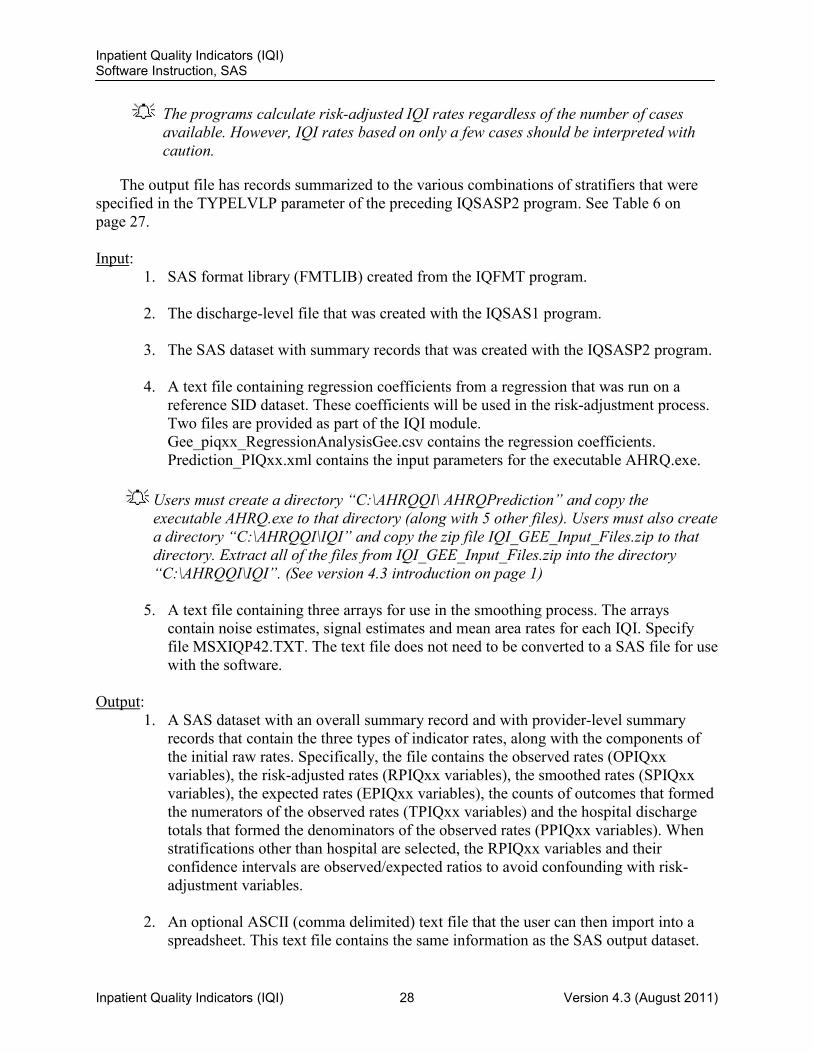
Inpatient Quality Indicators (IQI) Software Instruction SAS
Inpatient Quality Indicators (IQI) 33 Version 43 (August 2011)
87 Program 7 Run IQSASA3 The IQSASA3 program calculates age and sex risk-adjusted rates for each area-level IQI
(overall rates and rates by area) and then calculates smoothed rates Input
1 SAS format library (FMTLIB) created from the IQFMT program 2 The discharge-level file that was created with the IQSAS1 program
3 The SAS dataset with summary records that was created with the IQSASA2 program
4 A text file with Census area residential populations (stratified by area sex and
discrete age categories) One file is currently provided along with the IQI module software The file is POP95T11TXT The user should set POPYEAR to the year that best matches the userrsquos discharge data file The text file does not need to be converted to a SAS file for use with the software
5 A text file (COVIQA42TXT) containing regression coefficients from a regression
that was run on the reference SID dataset These coefficients will be used in the risk adjustment process This file is provided to you as part of the IQI module The text file does not need to be converted to a SAS file for use with the software
6 A text file (MSXIQA42TXT) containing two arrays for use in the smoothing process
The arrays contain noise estimates signal estimates and mean area rates for each IQI This file is provided to you as part of the IQI module The text file does not need to be converted to a SAS file for use with the software
Output
1 A SAS dataset with an overall summary record and with area-level summary records that contain the three types of indicator rates along with the components of the initial raw rates Specifically the file contains the observed rates (OAIQxx variables) the risk-adjusted rates (RAIQxx variables) the smoothed rates (SAIQxx variables) the counts of outcomes that formed the numerators of the observed rates (TAIQxx variables) and the residential population totals that formed the denominators of the observed rates (PAIQxx variables) When stratifications other than area are selected the RAIQxx variables and their confidence intervals are observedexpected ratios to avoid confounding with risk-adjustment variables
2 An optional ASCII (comma delimited) text file that the user can then import into a
spreadsheet This text file contains the same information as the SAS output dataset The text file will contain the OAIQxx observed rates and their TAIQxx and PAIQxx components the RAIQxx risk-adjusted rates and the SAIQxx smoothed rates Each record or row in the text file will correspond to a different area
Inpatient Quality Indicators (IQI) Software Instruction SAS
Inpatient Quality Indicators (IQI) 34 Version 43 (August 2011)
3 Outputs to hardcopy are PROC MEANS (with N NMISS MIN MAX MEAN and SUM) of risk-adjusted and smoothed rates in two intermediate work files and of all of the numeric variables in the final output data file The printout also contains a PROC CONTENTS of the output SAS dataset A PROC PRINT of the output dataset is provided only if the ldquoPRINTrdquo parameter in CONTROL_IQISAS code is set to one
6 A PROC MEANS (with N NMISS MIN MAX MEAN and SUM) of the area-level
summary records that shows statistics for the OAIQxx observed rates and their TAIQxx and PAIQxx components the RAIQxx risk-adjusted rates and the SAIQxx smoothed rates
7 A PROC CONTENTS of the output SAS summary dataset is output to hardcopy
8 A PROC PRINT of the output summary dataset is provided at the end of the hardcopy
printout If the user does not wish to generate this printout then the global ldquoPRINTrdquo parameter in CONTROL_IQISAS code should be set to zero
Changes
1 The ldquoFILENAME CONTROLrdquo statement at the beginning of the program must be changed to reflect the location of the CONTROL_IQISAS code
2 In CONTROL_IQISAS specify the locations (paths) of the input and output SAS
files in the ldquoLIBNAME INA3rdquo and ldquoLIBNAME OUTA3rdquo statements
3 In CONTROL_IQISAS specify in the ldquoINFILE1rdquo statement the name of the discharge-level file that you created with the IQSAS1 program
4 In CONTROL_IQISAS specify the path (including the file name) for the ASCII
population text file in the ldquoFILENAME POPFILE3rdquo statement The file name is POP95T11TXT These files are provided along with the software The file used should be the one that is closest to the year associated with your particular data These files contain Census residential estimates by area gender and discrete age categories
5 In CONTROL_IQISAS specify in the ldquoFILENAME COVARArdquo statement the path
(including the file name) for the ASCII text file that contains regression coefficients from a regression that was run on reference SID dataset The name of the file is COVIQA42TXT
6 In CONTROL_IQISAS specify in the ldquoFILENAME MSXArdquo statement the path
(including the file name) for the ASCII text file that contains the estimates to smooth the indicator rates The name of the file is MSXIQA42TXT
7 In CONTROL_IQISAS specify in the ldquoINFILEA2rdquo statement the name of the
summary file that you created with the IQSASA2 program
Inpatient Quality Indicators (IQI) Software Instruction SAS
Inpatient Quality Indicators (IQI) 35 Version 43 (August 2011)
8 In CONTROL_IQISAS specify in the ldquoOUTFILA3rdquo statement the name that you wish the output file to have
9 In CONTROL_IQISAS if you wish to create an ASCII (comma delimited) text file
that you can import into a spreadsheet then set the TEXTA3 parameter to 1 Otherwise the default value of zero for TEXTA3 will skip the code that would generate this file
10 In CONTROL_IQISAS if you wish to create an ASCII (comma delimited) text file
that you can import into a spreadsheet then specify the path (including the file name) for this ASCII text file in the ldquoFILENAME IQTEXTA3rdquo statement
Inpatient Quality Indicators (IQI) Software Instruction SAS
Inpatient Quality Indicators (IQI) 36 Version 43 (August 2011)
90 Reviewing the Printed Output This section contains tips for reviewing some of the printed output from the IQI module
These tips are oriented toward explaining the interrelationships between printout items from different programs and hopefully will help to reveal the nature and structure of the module outputs For guidance in interpreting the results see the Interpretations Guide
The final output of the IQI module is a PROC PRINT from IQSASP3 (for provider-level indicators) and IQSASA3 (for area-level indicators) All interim printouts are for checking and trouble-shooting However if you have elected to refrain from risk-adjusting and smoothing the data then the final outputs will be the PROC PRINT at the end of the IQSASP2 andor IQSASA2 programs
91 IQSAS1
The initial printout from the IQSAS1 program contains PROC MEANS for all of the numeric variables in the output discharge-level dataset It will contain information for the newly constructed TAIQxx and TPIQxx flag variables that will later form the numerators for the indicator rates For each TAIQxx and TPIQxx flag variable
bull The SUM will contain the total number of observations in the dataset that were found to have the particular outcome of interest
bull For the six Provider volume indicators (TPIQ01-TPIQ02 TPIQ04-TPIQ07) and the four Area indicators (TAIQ26-TAIQ29) the MEAN MINIMUM and MAXIMUM will usually be the value one since the flag variables have either been set to missing (lsquorsquo) or to a value of one The remainder of the Provider indicators (TPIQ08-TPIQ09 TPIQ11-TPIQ25 and TPIQ30-TPIQ34) have a value of one zero or missing (lsquorsquo) For these indicators a value of zero was assigned to the TPIQxx flag if a particular observation was part of the population at risk for a particular indicator but did not have the particular outcome of interest So for example TPIQ21 = 1 indicates a patient who had a Cesarean section while TPIQ21 = 0 identifies a patient who had a delivery but not a C-section
bull For the Provider indicators TPIQ08-TPIQ09 TPIQ11-TPIQ25 and TPIQ30-TPIQ34 the MEANs will contain a close approximation of the eventual overall observed indicator rates The values will change slightly after IQSASP2 has applied additional parts of the indicator definitions
bull N lists the number of observations in the dataset with non-missing values For the six provider-based volume indicators and the four area-level indicators N for TPIQxx or TAIQxx will be the same as the SUM For the other provider-based indicators N will contain the denominator for the observed indicator rate Note the Nrsquos or denominators for six of the mortality indicators (ie IQI 08-12 30 and 31) will be similar to the Ns and SUMs for the six volume indicators (TPIQ01-TPIQ02 TPIQ04-TPIQ07) but often they will not be exactly identical (eg the mortality indicators exclude discharges that were transferred to other hospitals)
Inpatient Quality Indicators (IQI) Software Instruction SAS
Inpatient Quality Indicators (IQI) 37 Version 43 (August 2011)
The IQSAS1 printout also contains a PROC CONTENTS that lists all of the variables in the output dataset including the character variables that are present and a PROC PRINT of the first 24 observations in the output dataset
92 IQSASP2 The purpose of this printout is to provide the observed rates for all provider-level indicators
The default printout shows results by provider but other levels of output (as shown in Table 6) can be specified as well Note that risk-adjusted and smoothed rates are shown in the output from the next program
The printout from the IQSASP2 program contains PROC MEANS on the provider-level summary records for all of the numeric variables in the output summary dataset It will contain information for the newly constructed OPIQxx rates the PPIQxx denominators and the TPIQxx numerators
bull The _TYPE_ variable described in the MEANS table identifies the stratification level for the records in the output data set The _TYPE_ variable corresponds to the TYPELVLP parameter values that were specified (see item number 4 in the ldquoChangesrdquo section for the IQSASP2 program on page 32) In this case _TYPE_ always assumes the value of 16 since only the provider-level records are selected
bull The N statistic for _TYPE_ contains the number of providers in the output summary data set A TPIQxx numerator variable with a value for N that is lower than the N value for _TYPE_ indicates that there were no outcomes of interest for some of the providers Similarly a PPIQxx denominator variable with a lower value for N than _TYPE_ indicates that for some providers there were no hospital discharges with the outcome of interest
bull The MINIMUM value for the TPIQ08-TPIQ25 TPIQ30 and TPIQ31 numerators will usually be zero since values of zero were assigned for observations that were part of the population for the rate denominator but did not have the particular outcome of interest to be included in the rate numerator For the volume indicators (TPIQ01-TPIQ07) the MINIMUM value will be one or higher
For the observed rates the User should NOT report the MEANS displayed here but instead should refer to the overall means in the output dataset that are also present in the subsequent PROC PRINT The MEANS given here are means of hospital means ie all hospitals are given equal weight regardless of the number of discharges in the different hospitals
bull The SUMs for the counter variables TPIQxx and PPIQxx will contain overall file totals for these data elements The SUMs for the observed rates have no intuitive meaning If the ldquoPRINTrdquo parameter in the CONTROL_IQISAS program is set to one the subsequent
PROC PRINT output contains a complete dump of the output summary file Listed for each record are the stratification values the PPIQxx population denominators for the 30 provider indicators the TPIQxx outcome numerators for the 30 provider indicators and the 30 OPIQxx observed rates
Inpatient Quality Indicators (IQI) Software Instruction SAS
Inpatient Quality Indicators (IQI) 38 Version 43 (August 2011)
93 IQSASP3 The PROC PRINT at the end of this program provides your final output (This printout appears if the ldquoPRINTrdquo parameter in the CONTROL_IQISAS program is set to one)
The following table lists the column headers shown on the printed output and describes each
Each indicator is reported in a separate section Values of ldquoxxrdquo correspond to the two-digit IQI number Table 8 Provider level printed output
Column Heading Description Obs Observation 1 (with HOSPID = ldquordquo) is the overall average for the entire dataset
(TYPELVLP = 0) The remaining observations are individual providers or hospitals (TYPELVLP = 16)
HOSPID Identifier for each provider in the dataset AGECAT Age stratification category ndash See Table 6 for TYPELVLP settings SEXCAT Gender stratification category ndash See Table 6 for TYPELVLP settings PAYCAT Payer stratification category ndash See Table 6 for TYPELVLP settings RACECAT Race stratification category ndash See Table 6 for TYPELVLP settings TPIQxx Number of cases in the numerator PPIQxx Number of cases in the denominator (population at risk) OPIQxx Observed (raw) rate ndash Numerator divided by Denominator EPIQxx Expected rate ndash Rates the provider would have if it performed the same as the
reference population given the providerrsquos actual case-mix (eg age gender modified DRG and comorbidities)
RPIQxx Risk-adjusted rate ndash Accounts for the difference between the case-mix of the reference population and the providerrsquos case-mix When stratifications other than hospital or area are selected the RPIQxx variables and their confidence intervals are observedexpected ratios to avoid confounding with risk adjustment variables
LPIQxx Lower limit of confidence interval of risk-adjusted rate UPIQxx Upper limit of confidence interval of risk-adjusted rate SPIQxx Smoothed rate ndash Rates with removal of fluxuation over time XPIQxx Standard error of smoothed rate
Observation 1 (with HOSPID = ) is the overall average for the entire dataset (TYPELVL =
0) The remaining observations are individual providers or hospitals (TYPELVL = 16) Data will appear under the column headers AGECAT SEXCAT PAYCAT and RACECAT if you specify these levels of aggregation (shown in Table 6)
You may wish to express the results in more understandable terms
bull Multiply the mortality rates by 100 to express them as a percentage (eg 00338 100 = 34 mortality for CABG)
bull Multiply the utilization rates by 100 to express them as a percentage (eg 02040 100 = 204 C-section rate)
Inpatient Quality Indicators (IQI) Software Instruction SAS
Inpatient Quality Indicators (IQI) 39 Version 43 (August 2011)
The MEANS table is generated from the permanent provider-based output file and is provided for trouble-shooting and understanding your data but not for reporting The means are provided just for the provider level summary records
bull The N for all but the TPIQxx counter variables should contain the number of providers in the userrsquos database
bull The MEANS MINIMUMs and MAXIMUMs have their normal meaning and provide comparisons among the different hospitals or providers in your database
For the (observed risk-adjusted or smoothed) rates the User should NOT report the MEANS displayed here but instead refer to the overall means in the output dataset in the PROC PRINT labeled ldquoFINAL OUTPUTrdquo The MEANS given here are means of hospital means ie all hospitals are given equal weight regardless of the number of discharges in the different hospitals
bull Note The denominators for six of the mortality indicators ( 8 ndash 12 30 and 31) will be similar to the totals for the six volume indicators (TPIQ01-TPIQ07) but often they will not be exactly identical (eg the mortality indicators exclude discharges that were transferred to other hospitals)
bull If the ldquoPRINTrdquo parameter in the CONTROL_IQISAS program is set to one at the end of the printout is a PROC PRINT on the final provider-based output file Listed for each level of stratification are the stratifiers the numerator and denominator totals for the observed rates and the observed risk-adjusted and smoothed rates
94 IQSASA2
The purpose of this printout is to provide the observed rates for all area-level indicators The default printout shows overall results and results by area but other levels of output (as shown in Table 6) can be specified as well Note that risk-adjusted and smoothed rates are shown in the output from the next program
The printout from the IQSASA2 program contains PROC MEANS for all of the numeric variables in the output summary dataset It will contain information for the newly constructed OAIQxx rates the PAIQxx denominators and the TAIQxx numerators
bull The _TYPE_ variable described in the first row of the MEANS table identifies the stratification level for the records in the output data set The _TYPE_ variable corresponds to the TYPELVLA parameter values that were specified (see item 5 in the ldquoChangesrdquo section for the IQSASA2 program on page 31) In this case _TYPE_ always assumes the value of 8 since only the area-level records are selected
bull The N statistic for _TYPE_ contains the number of areas in the output summary data set A TAIQxx numerator variable with a lower value for N than _TYPE_ indicates that there were no outcomes of interest for some of the areas
bull The MINIMUM value for the TAIQxx numerators will be one or higher
Inpatient Quality Indicators (IQI) Software Instruction SAS
Inpatient Quality Indicators (IQI) 40 Version 43 (August 2011)
For the observed rates the User should NOT report the MEANS displayed here but instead should refer to the overall means in the output dataset that are also present in the subsequent PROC PRINT The MEANS given here are means of the area means ie all areas are given equal weight regardless of the population in the different areas
bull The SUMs for the counter variables TAQIxx and PAIQXX will contain overall file totals for these data elements The SUMs for the observed rates have no intuitive meaning
If the ldquoPRINTrdquo parameter in the CONTROL_IQISAS program is set to one the subsequent
PROC PRINT output contains a complete dump of the output summary file Listed for each record are the stratification values the PAIQxx population denominators for the four indicators the TAIQxx outcome numerators for the four indicators and the four OAIQxx observed rates
95 IQSASA3 The PROC PRINT at the end of this program provides your final output (This printout appears if the ldquoPRINTrdquo parameter in the CONTROL_IQISAS program is set to one)
The following table lists the column headers shown on the printed output and describes each
Each indicator is reported in a separate section Values of ldquoxxrdquo correspond to the two-digit IQI number Table 9 Area level printed output
Column Heading Description
Obs Observation 1 is the overall average for the entire dataset (TYPELVLA = 0) The remaining observations are individual areas (TYPELVLA = 8)
Area Identifier in the dataset for area TAIQxx Number of cases in the numerator PAIQxx Number of cases in the denominator (population at risk) OAIQxx Observed (raw) rate ndash Numerator divided by Denominator RAIQxx Risk-adjusted rate ndash Accounts for the difference between the case-mix of the
reference population and the arearsquos case-mix When stratifications other than hospital or area are selected the RPIQxx variables and their confidence intervals are observedexpected ratios to avoid confounding with risk adjustment variables
SAIQxx Smoothed rate ndash Rates with removal of fluxuation over time
Observation 1 (with AREA = blank) is the overall average for the entire dataset (TYPELVL = 0) The remaining observations are individual areas (TYPELVL = 8)
You may wish to express the results in more understandable terms
bull Multiply the utilization rates by 100000 to express them as a rate per 100000 population (eg 0000494 100000 = 494 hysterectomies per 100000 population)
The MEANS table is generated from the permanent area-level output file The means are
provided just for the area-level summary records
Inpatient Quality Indicators (IQI) Software Instruction SAS
Inpatient Quality Indicators (IQI) 41 Version 43 (August 2011)
bull The N for all but the TAIQxx counter variables should contain the number of different areas (Metro Areas and counties) in your database
bull The MEANs MINIMUMs and MAXIMUMs have their normal meaning and provide comparisons among the different areas in your database Note that the MAXIMUMs for the counter variables (the TAIQxx and PAIQxx variables) are associated with specific areas and therefore these MAXIMUMs may not match those in the prior IQSAS2 printouts since that run typically will include a record for the entire database
For the (observed risk-adjusted or smoothed) rates the User should NOT report the MEANS displayed here but instead refer to the overall means in the output dataset that are also present in the subsequent PROC PRINT The MEANS given here are means of area means ie all areas are given equal weight regardless of the number of discharges in the different areas
bull The SUMs of the counter variables (the TAIQxx and PAIQxx variables) yield the overall database totals
Inpatient Quality Indicators (IQI) Software Instruction SAS
Inpatient Quality Indicators (IQI) 42 Version 43 (August 2011)
100 Benchmark Timings The benchmark runtimes given below are from runs made on a Windows XP workstation
with a Pentium 4 CPU 280 GHz processor 512 MB of RAM and an IDE hard drive The dataset used contained 757624 observations with 15 diagnosis fields and 15 procedure fields
Step Run time (in seconds) Run IQFMTS to create the format library 2 Run IQSAS1 157 Run IQSASP2 21 Run IQSASP3 86 Run IQSASA2 10 Run IQSASA3 185
101 User Support Technical assistance is available through an electronic user support system monitored by the
QI support team to support users in their application of the IQI software The same e-mail address may be used to communicate to AHRQ any suggestions for IQI enhancements general questions and any QI related comments you may have AHRQ welcomes your feedback
The Internet address for user support and feedback is supportqualityindicatorsahrqgov AHRQ also offers a listserv to keep you informed on the Quality Indicators (QIs) The
listserv is used to announce any QI changes or updates new tools and resources and to distribute other QI related information This is a free service Simply follow the process described below to begin receiving important QI information All you need is a computer Internet access and an E-mail address It works just like other electronic distribution lists
Herersquos how to register 1 Send an E-mail message to listservqualityindicatorsahrqgov 2 On the subject line type Subscribe For example Subscribe
3 In the body of the message type sub Quality_Indicators-L and your full name For example sub Quality_Indicators-L John Doe
4 You will receive a message confirming that you are signed up If you have any questions contact AHRQ QI Support at the e-mail noted above You should
receive an automatic response e-mail message confirming receipt of your e-mail If you do not receive a confirmation message call (888) 512-6090
Inpatient Quality Indicators (IQI) Software Instruction SAS
Inpatient Quality Indicators (IQI) 43 Version 43 (August 2011)
Appendix A Links The following links may be helpful to users of the AHRQ Inpatient Quality Indicators
Inpatient Quality Indicators Version 43 Documents and Software Available at httpwwwqualityindicatorsahrqgovmodulesiqi_resourcesaspx and httpwwwqualityindicatorsahrqgovsoftwaredefaultaspx
Title Description
IQI User Guide Individual Measures
The user guide provides a technical overview of the IQI individual measures including literature and empirical evidence
IQI User Guide Composite Measures
The user guide provides a technical overview of the IQI composite measures
IQI Technical Specifications
Provides detailed definitions of each IQI including all ICD-9-CM and DRG codes that are included in or excluded from the numerator and denominator Note that exclusions from the denominator are automatically applied to the numerator
IQI Comparative Data This document provides the average volume provider rate and population rate as appropriate for each indicator
Fiscal year 2011 Coding Changes
This document summarizes the changes to the indicator definitions resulting from FY 2011 changes to ICD-9-CM coding and DRG changes These changes will only affect data from FY 2011 (October 1 2011) or later
Log of Changes to IQI Documents and Software
The Change Log document provides a cumulative summary of all changes to the IQI software software documentation and other documents made since the release of version 21 of the software in March 2003 Changes to indicator specifications that were not a result of new ICD-9-CM and DRG codes are also described in the Change Log
IQI Risk Adjustment Coefficient Tables
Tables for each IQI provide the stratification and coefficients used to calculate the risk-adjusted rate for each strata
SASreg IQI Software Documentation
This software documentation provides detailed instructions on how to use the SAS reg version of the IQI software including data preparation calculation of the IQI rates and interpretation of output
SASreg IQI Software Requires the SASreg statistical program distributed by the SAS Institute Inc The company may be contacted directly regarding the licensing of its products httpwwwsascom
3Mreg APRreg DRG Limited License Grouper for SASreg
Creates APR-DRG variables for use with SAS version of IQI software Instructions for running the software are included in the Zip file
Version 43 Listserv announcement
This document announces the release of the Version 43 software and documentation provides a summary of changes and links to relevant pages
Inpatient Quality Indicators (IQI) Software Instruction SAS
Inpatient Quality Indicators (IQI) 44 Version 43 (August 2011)
AHRQ QI Windows Application The AHRQ QI Windows Application calculates rates for all of the AHRQ Quality Indicators modules and does not require SASreg It is available at
httpwwwqualityindicatorsahrqgovwinqi_downloadhtm Additional Documents The following documents are available within the Archive section of the AHRQ QI Web page
httpwwwqualityindicatorsahrqgovArchivedefaultaspxiqi
bull Refinement of the HCUP Quality Indicators (Technical Review) May 2001 bull Refinement of the HCUP Quality Indicators (Summary) May 2001
In addition these documents may be accessed at the AHRQ QI Modules Web page
httpwwwqualityindicatorsahrqgovmodulesDefaultaspx bull AHRQ QI Measure Development Implementation Maintenance and Retirement bull ICD-9-CM to ICD-10-CMPCS Conversion of AHRQ QI March 2011 bull AHRQ QI Empirical Methods May 2011 bull Guidance for Using the AHRQ Quality Indicators for Hospital-level Public Reporting
or Payment August 2004 bull AHRQ Summary Statement on Comparative Hospital Public Reporting December
2005 bull Appendix A Current Uses of AHRQ Quality Indicators and Considerations for
Hospital-level bull Comparison of Recommended Evaluation Criteria in Five Existing National
Frameworks bull List of AHRQ QI Endorsed by the National Quality Forum
The following documents can be viewed or downloaded from the AHRQ QI News Web page
httpwwwqualityindicatorsahrqgovnewsdefaultaspx and httpwwwqualityindicatorsahrqgovArchiveNewsaspx bull February 2007 Newsletter - Year highlights and future plans bull February 2006 Newsletter ndash Year highlights and future plans bull 2006 Area Level Indicator Changes bull Considerations in Public Reporting for the AHRQ QI bull June 2005 Newsletter - Contains the article Using Different Types of QI Rates
Inpatient Quality Indicators (IQI) Software Instruction SAS
Inpatient Quality Indicators (IQI) 45 Version 43 (August 2011)
Other Tools and Information
IQI rates can be calculated using the modified Federal Information Processing Standards (FIPS) Statecounty code A list of codes is available at
httpwwwcensusgovpopestgeographiccodes02pdf
AHRQ provides a free on-line query system based on HCUP data that provides access to health statistics and information on hospital stays at the national regional and State level It is available at
httphcupahrqgovHCUPnetasp
Information on the 3Mtrade APR-DRG system is available at
httpwww3mcomushealthcarehisproductscodingrefined_drgjhtml
Inpatient Quality Indicators (IQI) Software Instruction SAS
Inpatient Quality Indicators (IQI) 46 Version 43 (August 2011)
Appendix B Using Different Types of QI Rates When should you use the observed expected risk adjusted andor smoothed rates generated
by the AHRQ QI software Here are some guidelines If the userrsquos primary interest is to identify cases for further follow-up and quality
improvement then the observed rate would help to identify them The observed rate is the raw rate generated by the QI software from the data the user provided Areas for improvement can be identified by the magnitude of the observed rate compared to available benchmarks andor by the number of patients impacted
Additional breakdowns by the default patient characteristics used in stratified rates (eg age gender or payer) can further identify the target population Target populations can also be identified by user-defined patient characteristics supplemented to the casedischarge level flags Trend data can be used to measure change in the rate over time
Another approach to identify areas to focus on is to compare the observed and expected rates The expected rate is the rate the provider would have if it performed the same as the reference population given the providerrsquos actual case-mix (eg age gender DRG and comorbidity categories)
If the observed rate is higher than the expected rate (ie the ratio of observedexpected is greater than 10 or observed minus expected is positive) then the implication is that the provider performed worse than the reference population for that particular indicator Users may want to focus on these indicators for quality improvement
If the observed rate is lower than the expected rate (ie the ratio of observedexpected is less than 10 or observed minus expected is negative) then the implication is that the provider performed better than the reference population Users may want to focus on these indicators for identifying best practices
Users can also compare the expected rate to the reference population rate reported in the AHRQ QI software or Comparative Data document to determine how their case-mix compares to the reference population The population rate refers to the overall rate for the reference population The reference population is defined in the Comparative Data Document If the population rate is higher than the expected rate then the providerrsquos case-mix is less severe than the reference population If the population rate is lower than the expected rate then the providerrsquos case-mix is more severe than the reference population
We use this difference between the population rate and the expected rate to ldquoadjustrdquo the observed rate to account for the difference between the case-mix of the reference population and the providerrsquos case-mix which is the providerrsquos risk-adjusted rate
If the provider has a less severe case-mix then the adjustment is positive (population rate gt expected rate) and the risk-adjusted rate is higher than the observed rate If the provider has a more severe case-mix then the adjustment is negative (population rate lt expected rate) and the risk-adjusted rate is lower than the observed rate The risk-adjusted rate is the rate the provider would have if it had the same case-mix as the reference population given the providerrsquos actual performance
Finally users can compare the risk-adjusted rate to the smoothed or ldquoreliability-adjustedrdquo rate to determine whether this difference between the risk-adjusted rate and reference population rate is likely to remain in the next measurement period Smoothed rates are weighted averages of the population rate and the risk-adjusted rate where the weight reflects the reliability of the providerrsquos risk-adjusted rate
Inpatient Quality Indicators (IQI) Software Instruction SAS
Inpatient Quality Indicators (IQI) 47 Version 43 (August 2011)
A ratio of (smoothed rate - population rate) (risk-adjusted rate - population rate) greater than 080 suggests that the difference is likely to persist (whether the difference is positive or negative) A ratio less than 080 suggests that the difference may be due in part to random differences in patient characteristics (patient characteristics that are not observed and controlled for in the risk-adjustment model) In general users may want to focus on areas where the differences are more likely to persist
Inpatient Quality Indicators (IQI) Software Instruction SAS
Inpatient Quality Indicators (IQI) 48 Version 43 (August 2011)
Appendix C IQI Input Data Dictionary Variable name Description Format Value description Comments
KEY Sequence number Unique case identifier Numeric
User defined unique numeric identifier for each discharge record
Not used by the QI programs but should be present to facilitate possible exploration allows user to link the records from the IQSAS1SAS program output file back to the original input data file
AGE Age in years at admission Numeric Age in years
If this data element is missing the discharge record will be excluded from analysis
AGEDAY Age in days (coded only when the age in years is less than 1) Numeric Age in days
Not used in the IQI program If not present in the input data file it is not necessary to create a dummy variable for this module
RACE Race of patient Numeric 1 2 3 4 5 6
White Black Hispanic Asian or Pacific Island Native American Other
The values of 1-5 are used directly in the QI software All other ethnicity codes are mapped to an lsquootherrsquo category
SEX Sex of patient Numeric
1 2
Male Female
If this data element is missing the discharge record will be excluded from the analysis
PAY1 Expected primary payer
Numeric 1 2 3 4 5 6
Medicare Medicaid Private incl HMO Self-pay No charge Other
The values of 1 2 3 and 4 are used directly in the QI software All other payer codes are mapped to an lsquootherrsquo category This data element is used to stratify only the Provider-level IQI (IQI-01 toIQI-25 IQI-30 to IQI-34)
PAY2 (SAS Only)
Expected secondary payer
Numeric 1 2 3 4 5 6
Medicare Medicaid Private incl HMO Self-pay No charge Other
Use is optional but must be present in data (set to missing if data element not available)
PSTCO
Location of patient residence or hospital location (FIPSdagger Statecounty code)
Numeric ssccc
Modified Federal Information Processing Standards Statecounty code2
See Appendix A for link to most recent list of codes If this data element is missing the discharge record will be excluded from rate calculations
HOSPID Data Source hospital number Numeric Hospital
identification number Used to facilitate data exploration and possible trouble shooting
2 Federal Information Processing Standard as defined by the US Department of Commerce National Institute of Standards and Technology (formerly National Bureau of Standards) Note Certain independent cities (Baltimore City Carson City and St Louis City) and areas within Hawaii and Virginia are assigned to different area groupings in the Modified FIPS categories as compared to the US Census Bureau groupings The AHRQ QI software uses the Modified FIPS code assignment of these areas Failure to use the Modified FIPS codes assignment will result in the use of incorrect denominator estimates for area indicators A list is available at httpwwwcensusgovpopestgeographiccodes02pdf
Inpatient Quality Indicators (IQI) Software Instruction SAS
Inpatient Quality Indicators (IQI) 49 Version 43 (August 2011)
Variable name Description Format Value description Comments
DISP Disposition of patient
Numeric 1 2 3 4 5 6 7 20
Routine Short-term hospital Skilled nursing facility Intermediate care Another type of facility Home health care Against medical advice Died in the hospital
The values 2 and 20 are referenced by the QI code (to identify transfers to another short-term hospital and patients who died in the hospital)
MORT30 (SAS Only)
30-Day Mortality Indicator Numeric
0 ndash not died within 30-days from admission
Use is optional but must be present in data (set to missing if data element not available)
1 ndash died within 30-days from admission
DNR Do Not Resuscitate Indicator Numeric
0 ndash No ldquoDo Not Resuscitaterdquo Indicator
Use is optional but must be present in data (set to missing if data element not available)
1 ndash ldquoDo Not Resuscitaterdquo Indicator
ATYPE Admission Type Numeric 1 2 3 4 5 6
Emergency Urgent Elective Newborn Trauma Center3 Other
Not used by the IQI program If not present in the input data file it is not necessary to create a dummy variable
ASOURCE Admission Source
Numeric 1 2 3 4 5
ER Another hospital Another facility including LTC Courtlaw enforcement Routinebirthother
The value 2 is referenced by the QI code (to identify transfers from another short-term hospital)
LOS Length of Stay Numeric Number of days from admission to discharge
Not used by the IQI program If not present in the input data file it is not necessary to create a dummy variable
APR_DRG APR-DRG category Numeric APR-DRG from 3Mreg software
Although the IQI module will operate without these variables users should run APR-DRG software on their raw data to assign this variable to each case See Section 53 on page 15
APRDRG_ RISK_ MORTALITY
APR-DRG Mortality Score Numeric
APR-DRG Risk of Mortality Score from 3Mreg software
See Section 53 on page 15
XPRDRG_ RISK_ MORTALITY
APR-DRG Mortality Score with POA Numeric
APR-DRG Risk of Mortality Score from 3Mreg Software using
See Section 53 on page 15
3 The ATYPE value ldquo5rdquo was used to indicate delivery only in the 1988 to 1997 HCUP data files The UB standards currently use ldquo5rdquo to indicate Trauma Center
Inpatient Quality Indicators (IQI) Software Instruction SAS
Inpatient Quality Indicators (IQI) 50 Version 43 (August 2011)
Variable name Description Format Value description Comments
POA information
DRG Diagnosis Related Group Numeric DRG from federal (CMS) DRG Grouper
DRGVER Diagnosis Related Group Version Numeric
DRG Version of federal (CMS) DRG Grouper
eg Version 28 for FY2011
MDC Major Diagnostic Category Numeric MDC from federal (CMS) DRG grouper
DISCWT Weight to assign to discharge Numeric Format as nnnnn
Cases with missing values are assigned a value of 1 Assigning a weight of zero has the effect of removing the case from the analysis
DX1 ndash DX30
ICD-9-CM diagnosis codes DX1 is the principal diagnosis DX2-DX30 are secondary diagnoses
String 3 4 or 5
characters (do not include decimal point)
Diagnosis codes Users must specify the number of diagnoses in the parameter ampNDX in CONTROL_IQISAS program
DXPOA1- DXPOA30-
Present on admission indicator for each diagnosis code
String
1 = present at the time of inpatient admission
These data will be used in risk adjustment and smoothing if the alternative parameter files of risk-adjustment covariates and population rates is specified
(YWE1)
0 = not present at the time of inpatient admission
(NUrsquo0rsquo )
NDX Count of the number of diagnoses (DX) on the discharge record
Numeric
Count of diagnoses (principal and all secondary diagnoses)
Not used by the IQI SAS program If not present in the input data file it is not necessary to create a dummy variable Definition is If the 1st discharge record has 1 Pr and the 2nd has 2 NPR would be 1 for the 1st record and 2 for the 2nd
PR1 ndash PR30
ICD-9-CM procedure codes PR1 is the principal procedure PR2-PR30 are secondary procedures
String 3 or 4
characters (do not include decimal point)
Procedure code
Users with more or fewer secondary procedures should modify the parameter ampNPR in CONTROL_IQISAS to reflect the number of diagnoses
NPR Count of the number of procedures (PR) on the discharge record
Numeric
Count of procedures (principal and all secondary procedures)
Not used by the IQI SAS program If not present in the input data file it is not necessary to create a dummy variable Definition is If the 1st discharge record has 1 Pr and the 2nd has 2 NPR would be 1 for the 1st record and 2 for the 2nd
Inpatient Quality Indicators (IQI) Software Instruction SAS
Inpatient Quality Indicators (IQI) 51 Version 43 (August 2011)
Variable name Description Format Value description Comments
POINTOFORIGINUB04
Point of Origin Numeric 4 Transfer from a hospital 5 Transfer from a skilled Nursing Facility (SNF) or Intermediate Care Facility (ICF)
Only these values are used by the QI programs
6 Transfer from another health care facility
IF ATYPE = 4
5 Born inside this hospital
6 Born outside of this hospital
PRDAY1 ndash PRDAY30
Days from admission to procedure PR1 is the principal procedure PR2-PR30 are secondary procedures
Numeric Days from Admission to Procedure4
Not used by the IQI program If not present in the input data file it is not necessary to create a dummy variable for this module
YEAR
Year of discharge The patientrsquos year of discharge For example a patient discharged on July 7 2004 would have a discharge year of lsquo2004rsquo
Numeric
YYYY
Discharge year should be within the range of 1997 to 2011
DQTR Quarter of discharge The calendar quarter of the patientrsquos discharge For example a patient discharged on July 7 2004 would have a discharge quarter of lsquo3rsquo
Numeric 1 January-March 2 April-June 3 July-September 4 October-December
See httphcup-usahrqgovtoolssoftwarecomorbiditycomorbidityjsp
4 Variables PRDAY1 to PRDAY30 are defined as the number of days from date of admission to date of procedure for each procedure For example if the patient was admitted on June 15th and had two procedures - the principal procedure on June 15th and a second procedure on June 18th ndash then the value of PRDAY1 would be zero (0) and the value of PRDAY2 would be three (3) For more information consult the HCUP data documentation at httpwwwhcup-usahrqgovdbvarsprdaynnisnotejsp
Inpatient Quality Indicators (IQI) Software Instruction SAS
Inpatient Quality Indicators (IQI) 52 Version 43 (August 2011)
Appendix D SAS IQI Output Data Dictionary SAS IQI Provider Output Column Heading Description Format Comments
Obs Observation 1 (with HOSPID = ) is the overall average for the entire dataset (TYPELVLP = 0) The remaining observations are individual providers or hospitals (TYPELVLP = 16)
Numeric
HOSPID Identifier for each provider in the dataset
Text Up to 12 characters
AGECAT Age stratification category Numeric range
SEXCAT Gender stratification category Numeric 1 = male 2 = female PAYCAT Payer stratification category Numeric 1 = Medicare
2 = Medicaid 3 = Private incl HMO 4 = Self-pay 5 = No charge 6 = Other
RACECAT Race stratification category Numeric 1 = White 2 = Black 3 = Hispanic 4 = Asian or Pacific Island 5 = Native American 6 = Other
TPIQxx The number of discharge records included in the numerator (outcome of interest) as defined for the indicator
Numeric
PPIQxx The number of discharge records included in the denominator (population at risk) as defined for the indicator
Numeric
OPIQxx The rate (observed numerator observed denominator) as defined for the indicator
Numeric
EPIQxx Rate calculated by assuming an average performance for each patient group based on the reference population but with the providerlsquos actual case-mix
Numeric
RPIQxx The estimated rate calculated by adjusting to an average case-mix
Numeric When stratifications other than hospital or area are selected the RPIQxx variables and their confidence intervals are observedexpected ratios to avoid confounding with risk adjustment variables
LPIQxx The lower confidence bound of the risk adjusted rate
Numeric
UPIQxx The upper confidence bound of the risk adjusted rate
Numeric
Inpatient Quality Indicators (IQI) Software Instruction SAS
Inpatient Quality Indicators (IQI) 53 Version 43 (August 2011)
Column Heading Description Format Comments
SPIQxx The smoothed rate calculated using multivariate signal extraction (MSX)
Numeric
XPIQxx Standard error of smoothed rate Numeric VPIQxx Variance for respective indicators Numeric
SAS IQI Area Output Column Heading Description Format Comments
Obs Observation 1 (with HOSPID = ) is the overall average for the entire dataset (TYPELVLP = 0) The remaining observations are individual providers or hospitals (TYPELVLP = 16)
Numeric
AREA Identifier in the dataset for area Text TAIQxx The number of discharge records
included in the numerator (outcome of interest) as defined for the indicator
Numeric
PAIQxx The number of discharge records included in the denominator (population at risk) as defined for the indicator
Numeric
OAIQxx The rate (observed numerator observed denominator) as defined for the indicator
Numeric
RAIQxx The estimated rate calculated by adjusting to an average case-mix
Numeric When stratifications other than hospital or area are selected the RAIQxx variables and their confidence intervals are observedexpected ratios to avoid confounding with risk adjustment variables
SAIQxx The smoothed rate calculated using multivariate signal extraction (MSX)
Numeric
Inpatient Quality Indicators (IQI) Software Instruction SAS
Inpatient Quality Indicators (IQI) 34 Version 43 (August 2011)
3 Outputs to hardcopy are PROC MEANS (with N NMISS MIN MAX MEAN and SUM) of risk-adjusted and smoothed rates in two intermediate work files and of all of the numeric variables in the final output data file The printout also contains a PROC CONTENTS of the output SAS dataset A PROC PRINT of the output dataset is provided only if the ldquoPRINTrdquo parameter in CONTROL_IQISAS code is set to one
6 A PROC MEANS (with N NMISS MIN MAX MEAN and SUM) of the area-level
summary records that shows statistics for the OAIQxx observed rates and their TAIQxx and PAIQxx components the RAIQxx risk-adjusted rates and the SAIQxx smoothed rates
7 A PROC CONTENTS of the output SAS summary dataset is output to hardcopy
8 A PROC PRINT of the output summary dataset is provided at the end of the hardcopy
printout If the user does not wish to generate this printout then the global ldquoPRINTrdquo parameter in CONTROL_IQISAS code should be set to zero
Changes
1 The ldquoFILENAME CONTROLrdquo statement at the beginning of the program must be changed to reflect the location of the CONTROL_IQISAS code
2 In CONTROL_IQISAS specify the locations (paths) of the input and output SAS
files in the ldquoLIBNAME INA3rdquo and ldquoLIBNAME OUTA3rdquo statements
3 In CONTROL_IQISAS specify in the ldquoINFILE1rdquo statement the name of the discharge-level file that you created with the IQSAS1 program
4 In CONTROL_IQISAS specify the path (including the file name) for the ASCII
population text file in the ldquoFILENAME POPFILE3rdquo statement The file name is POP95T11TXT These files are provided along with the software The file used should be the one that is closest to the year associated with your particular data These files contain Census residential estimates by area gender and discrete age categories
5 In CONTROL_IQISAS specify in the ldquoFILENAME COVARArdquo statement the path
(including the file name) for the ASCII text file that contains regression coefficients from a regression that was run on reference SID dataset The name of the file is COVIQA42TXT
6 In CONTROL_IQISAS specify in the ldquoFILENAME MSXArdquo statement the path
(including the file name) for the ASCII text file that contains the estimates to smooth the indicator rates The name of the file is MSXIQA42TXT
7 In CONTROL_IQISAS specify in the ldquoINFILEA2rdquo statement the name of the
summary file that you created with the IQSASA2 program
Inpatient Quality Indicators (IQI) Software Instruction SAS
Inpatient Quality Indicators (IQI) 35 Version 43 (August 2011)
8 In CONTROL_IQISAS specify in the ldquoOUTFILA3rdquo statement the name that you wish the output file to have
9 In CONTROL_IQISAS if you wish to create an ASCII (comma delimited) text file
that you can import into a spreadsheet then set the TEXTA3 parameter to 1 Otherwise the default value of zero for TEXTA3 will skip the code that would generate this file
10 In CONTROL_IQISAS if you wish to create an ASCII (comma delimited) text file
that you can import into a spreadsheet then specify the path (including the file name) for this ASCII text file in the ldquoFILENAME IQTEXTA3rdquo statement
Inpatient Quality Indicators (IQI) Software Instruction SAS
Inpatient Quality Indicators (IQI) 36 Version 43 (August 2011)
90 Reviewing the Printed Output This section contains tips for reviewing some of the printed output from the IQI module
These tips are oriented toward explaining the interrelationships between printout items from different programs and hopefully will help to reveal the nature and structure of the module outputs For guidance in interpreting the results see the Interpretations Guide
The final output of the IQI module is a PROC PRINT from IQSASP3 (for provider-level indicators) and IQSASA3 (for area-level indicators) All interim printouts are for checking and trouble-shooting However if you have elected to refrain from risk-adjusting and smoothing the data then the final outputs will be the PROC PRINT at the end of the IQSASP2 andor IQSASA2 programs
91 IQSAS1
The initial printout from the IQSAS1 program contains PROC MEANS for all of the numeric variables in the output discharge-level dataset It will contain information for the newly constructed TAIQxx and TPIQxx flag variables that will later form the numerators for the indicator rates For each TAIQxx and TPIQxx flag variable
bull The SUM will contain the total number of observations in the dataset that were found to have the particular outcome of interest
bull For the six Provider volume indicators (TPIQ01-TPIQ02 TPIQ04-TPIQ07) and the four Area indicators (TAIQ26-TAIQ29) the MEAN MINIMUM and MAXIMUM will usually be the value one since the flag variables have either been set to missing (lsquorsquo) or to a value of one The remainder of the Provider indicators (TPIQ08-TPIQ09 TPIQ11-TPIQ25 and TPIQ30-TPIQ34) have a value of one zero or missing (lsquorsquo) For these indicators a value of zero was assigned to the TPIQxx flag if a particular observation was part of the population at risk for a particular indicator but did not have the particular outcome of interest So for example TPIQ21 = 1 indicates a patient who had a Cesarean section while TPIQ21 = 0 identifies a patient who had a delivery but not a C-section
bull For the Provider indicators TPIQ08-TPIQ09 TPIQ11-TPIQ25 and TPIQ30-TPIQ34 the MEANs will contain a close approximation of the eventual overall observed indicator rates The values will change slightly after IQSASP2 has applied additional parts of the indicator definitions
bull N lists the number of observations in the dataset with non-missing values For the six provider-based volume indicators and the four area-level indicators N for TPIQxx or TAIQxx will be the same as the SUM For the other provider-based indicators N will contain the denominator for the observed indicator rate Note the Nrsquos or denominators for six of the mortality indicators (ie IQI 08-12 30 and 31) will be similar to the Ns and SUMs for the six volume indicators (TPIQ01-TPIQ02 TPIQ04-TPIQ07) but often they will not be exactly identical (eg the mortality indicators exclude discharges that were transferred to other hospitals)
Inpatient Quality Indicators (IQI) Software Instruction SAS
Inpatient Quality Indicators (IQI) 37 Version 43 (August 2011)
The IQSAS1 printout also contains a PROC CONTENTS that lists all of the variables in the output dataset including the character variables that are present and a PROC PRINT of the first 24 observations in the output dataset
92 IQSASP2 The purpose of this printout is to provide the observed rates for all provider-level indicators
The default printout shows results by provider but other levels of output (as shown in Table 6) can be specified as well Note that risk-adjusted and smoothed rates are shown in the output from the next program
The printout from the IQSASP2 program contains PROC MEANS on the provider-level summary records for all of the numeric variables in the output summary dataset It will contain information for the newly constructed OPIQxx rates the PPIQxx denominators and the TPIQxx numerators
bull The _TYPE_ variable described in the MEANS table identifies the stratification level for the records in the output data set The _TYPE_ variable corresponds to the TYPELVLP parameter values that were specified (see item number 4 in the ldquoChangesrdquo section for the IQSASP2 program on page 32) In this case _TYPE_ always assumes the value of 16 since only the provider-level records are selected
bull The N statistic for _TYPE_ contains the number of providers in the output summary data set A TPIQxx numerator variable with a value for N that is lower than the N value for _TYPE_ indicates that there were no outcomes of interest for some of the providers Similarly a PPIQxx denominator variable with a lower value for N than _TYPE_ indicates that for some providers there were no hospital discharges with the outcome of interest
bull The MINIMUM value for the TPIQ08-TPIQ25 TPIQ30 and TPIQ31 numerators will usually be zero since values of zero were assigned for observations that were part of the population for the rate denominator but did not have the particular outcome of interest to be included in the rate numerator For the volume indicators (TPIQ01-TPIQ07) the MINIMUM value will be one or higher
For the observed rates the User should NOT report the MEANS displayed here but instead should refer to the overall means in the output dataset that are also present in the subsequent PROC PRINT The MEANS given here are means of hospital means ie all hospitals are given equal weight regardless of the number of discharges in the different hospitals
bull The SUMs for the counter variables TPIQxx and PPIQxx will contain overall file totals for these data elements The SUMs for the observed rates have no intuitive meaning If the ldquoPRINTrdquo parameter in the CONTROL_IQISAS program is set to one the subsequent
PROC PRINT output contains a complete dump of the output summary file Listed for each record are the stratification values the PPIQxx population denominators for the 30 provider indicators the TPIQxx outcome numerators for the 30 provider indicators and the 30 OPIQxx observed rates
Inpatient Quality Indicators (IQI) Software Instruction SAS
Inpatient Quality Indicators (IQI) 38 Version 43 (August 2011)
93 IQSASP3 The PROC PRINT at the end of this program provides your final output (This printout appears if the ldquoPRINTrdquo parameter in the CONTROL_IQISAS program is set to one)
The following table lists the column headers shown on the printed output and describes each
Each indicator is reported in a separate section Values of ldquoxxrdquo correspond to the two-digit IQI number Table 8 Provider level printed output
Column Heading Description Obs Observation 1 (with HOSPID = ldquordquo) is the overall average for the entire dataset
(TYPELVLP = 0) The remaining observations are individual providers or hospitals (TYPELVLP = 16)
HOSPID Identifier for each provider in the dataset AGECAT Age stratification category ndash See Table 6 for TYPELVLP settings SEXCAT Gender stratification category ndash See Table 6 for TYPELVLP settings PAYCAT Payer stratification category ndash See Table 6 for TYPELVLP settings RACECAT Race stratification category ndash See Table 6 for TYPELVLP settings TPIQxx Number of cases in the numerator PPIQxx Number of cases in the denominator (population at risk) OPIQxx Observed (raw) rate ndash Numerator divided by Denominator EPIQxx Expected rate ndash Rates the provider would have if it performed the same as the
reference population given the providerrsquos actual case-mix (eg age gender modified DRG and comorbidities)
RPIQxx Risk-adjusted rate ndash Accounts for the difference between the case-mix of the reference population and the providerrsquos case-mix When stratifications other than hospital or area are selected the RPIQxx variables and their confidence intervals are observedexpected ratios to avoid confounding with risk adjustment variables
LPIQxx Lower limit of confidence interval of risk-adjusted rate UPIQxx Upper limit of confidence interval of risk-adjusted rate SPIQxx Smoothed rate ndash Rates with removal of fluxuation over time XPIQxx Standard error of smoothed rate
Observation 1 (with HOSPID = ) is the overall average for the entire dataset (TYPELVL =
0) The remaining observations are individual providers or hospitals (TYPELVL = 16) Data will appear under the column headers AGECAT SEXCAT PAYCAT and RACECAT if you specify these levels of aggregation (shown in Table 6)
You may wish to express the results in more understandable terms
bull Multiply the mortality rates by 100 to express them as a percentage (eg 00338 100 = 34 mortality for CABG)
bull Multiply the utilization rates by 100 to express them as a percentage (eg 02040 100 = 204 C-section rate)
Inpatient Quality Indicators (IQI) Software Instruction SAS
Inpatient Quality Indicators (IQI) 39 Version 43 (August 2011)
The MEANS table is generated from the permanent provider-based output file and is provided for trouble-shooting and understanding your data but not for reporting The means are provided just for the provider level summary records
bull The N for all but the TPIQxx counter variables should contain the number of providers in the userrsquos database
bull The MEANS MINIMUMs and MAXIMUMs have their normal meaning and provide comparisons among the different hospitals or providers in your database
For the (observed risk-adjusted or smoothed) rates the User should NOT report the MEANS displayed here but instead refer to the overall means in the output dataset in the PROC PRINT labeled ldquoFINAL OUTPUTrdquo The MEANS given here are means of hospital means ie all hospitals are given equal weight regardless of the number of discharges in the different hospitals
bull Note The denominators for six of the mortality indicators ( 8 ndash 12 30 and 31) will be similar to the totals for the six volume indicators (TPIQ01-TPIQ07) but often they will not be exactly identical (eg the mortality indicators exclude discharges that were transferred to other hospitals)
bull If the ldquoPRINTrdquo parameter in the CONTROL_IQISAS program is set to one at the end of the printout is a PROC PRINT on the final provider-based output file Listed for each level of stratification are the stratifiers the numerator and denominator totals for the observed rates and the observed risk-adjusted and smoothed rates
94 IQSASA2
The purpose of this printout is to provide the observed rates for all area-level indicators The default printout shows overall results and results by area but other levels of output (as shown in Table 6) can be specified as well Note that risk-adjusted and smoothed rates are shown in the output from the next program
The printout from the IQSASA2 program contains PROC MEANS for all of the numeric variables in the output summary dataset It will contain information for the newly constructed OAIQxx rates the PAIQxx denominators and the TAIQxx numerators
bull The _TYPE_ variable described in the first row of the MEANS table identifies the stratification level for the records in the output data set The _TYPE_ variable corresponds to the TYPELVLA parameter values that were specified (see item 5 in the ldquoChangesrdquo section for the IQSASA2 program on page 31) In this case _TYPE_ always assumes the value of 8 since only the area-level records are selected
bull The N statistic for _TYPE_ contains the number of areas in the output summary data set A TAIQxx numerator variable with a lower value for N than _TYPE_ indicates that there were no outcomes of interest for some of the areas
bull The MINIMUM value for the TAIQxx numerators will be one or higher
Inpatient Quality Indicators (IQI) Software Instruction SAS
Inpatient Quality Indicators (IQI) 40 Version 43 (August 2011)
For the observed rates the User should NOT report the MEANS displayed here but instead should refer to the overall means in the output dataset that are also present in the subsequent PROC PRINT The MEANS given here are means of the area means ie all areas are given equal weight regardless of the population in the different areas
bull The SUMs for the counter variables TAQIxx and PAIQXX will contain overall file totals for these data elements The SUMs for the observed rates have no intuitive meaning
If the ldquoPRINTrdquo parameter in the CONTROL_IQISAS program is set to one the subsequent
PROC PRINT output contains a complete dump of the output summary file Listed for each record are the stratification values the PAIQxx population denominators for the four indicators the TAIQxx outcome numerators for the four indicators and the four OAIQxx observed rates
95 IQSASA3 The PROC PRINT at the end of this program provides your final output (This printout appears if the ldquoPRINTrdquo parameter in the CONTROL_IQISAS program is set to one)
The following table lists the column headers shown on the printed output and describes each
Each indicator is reported in a separate section Values of ldquoxxrdquo correspond to the two-digit IQI number Table 9 Area level printed output
Column Heading Description
Obs Observation 1 is the overall average for the entire dataset (TYPELVLA = 0) The remaining observations are individual areas (TYPELVLA = 8)
Area Identifier in the dataset for area TAIQxx Number of cases in the numerator PAIQxx Number of cases in the denominator (population at risk) OAIQxx Observed (raw) rate ndash Numerator divided by Denominator RAIQxx Risk-adjusted rate ndash Accounts for the difference between the case-mix of the
reference population and the arearsquos case-mix When stratifications other than hospital or area are selected the RPIQxx variables and their confidence intervals are observedexpected ratios to avoid confounding with risk adjustment variables
SAIQxx Smoothed rate ndash Rates with removal of fluxuation over time
Observation 1 (with AREA = blank) is the overall average for the entire dataset (TYPELVL = 0) The remaining observations are individual areas (TYPELVL = 8)
You may wish to express the results in more understandable terms
bull Multiply the utilization rates by 100000 to express them as a rate per 100000 population (eg 0000494 100000 = 494 hysterectomies per 100000 population)
The MEANS table is generated from the permanent area-level output file The means are
provided just for the area-level summary records
Inpatient Quality Indicators (IQI) Software Instruction SAS
Inpatient Quality Indicators (IQI) 41 Version 43 (August 2011)
bull The N for all but the TAIQxx counter variables should contain the number of different areas (Metro Areas and counties) in your database
bull The MEANs MINIMUMs and MAXIMUMs have their normal meaning and provide comparisons among the different areas in your database Note that the MAXIMUMs for the counter variables (the TAIQxx and PAIQxx variables) are associated with specific areas and therefore these MAXIMUMs may not match those in the prior IQSAS2 printouts since that run typically will include a record for the entire database
For the (observed risk-adjusted or smoothed) rates the User should NOT report the MEANS displayed here but instead refer to the overall means in the output dataset that are also present in the subsequent PROC PRINT The MEANS given here are means of area means ie all areas are given equal weight regardless of the number of discharges in the different areas
bull The SUMs of the counter variables (the TAIQxx and PAIQxx variables) yield the overall database totals
Inpatient Quality Indicators (IQI) Software Instruction SAS
Inpatient Quality Indicators (IQI) 42 Version 43 (August 2011)
100 Benchmark Timings The benchmark runtimes given below are from runs made on a Windows XP workstation
with a Pentium 4 CPU 280 GHz processor 512 MB of RAM and an IDE hard drive The dataset used contained 757624 observations with 15 diagnosis fields and 15 procedure fields
Step Run time (in seconds) Run IQFMTS to create the format library 2 Run IQSAS1 157 Run IQSASP2 21 Run IQSASP3 86 Run IQSASA2 10 Run IQSASA3 185
101 User Support Technical assistance is available through an electronic user support system monitored by the
QI support team to support users in their application of the IQI software The same e-mail address may be used to communicate to AHRQ any suggestions for IQI enhancements general questions and any QI related comments you may have AHRQ welcomes your feedback
The Internet address for user support and feedback is supportqualityindicatorsahrqgov AHRQ also offers a listserv to keep you informed on the Quality Indicators (QIs) The
listserv is used to announce any QI changes or updates new tools and resources and to distribute other QI related information This is a free service Simply follow the process described below to begin receiving important QI information All you need is a computer Internet access and an E-mail address It works just like other electronic distribution lists
Herersquos how to register 1 Send an E-mail message to listservqualityindicatorsahrqgov 2 On the subject line type Subscribe For example Subscribe
3 In the body of the message type sub Quality_Indicators-L and your full name For example sub Quality_Indicators-L John Doe
4 You will receive a message confirming that you are signed up If you have any questions contact AHRQ QI Support at the e-mail noted above You should
receive an automatic response e-mail message confirming receipt of your e-mail If you do not receive a confirmation message call (888) 512-6090
Inpatient Quality Indicators (IQI) Software Instruction SAS
Inpatient Quality Indicators (IQI) 43 Version 43 (August 2011)
Appendix A Links The following links may be helpful to users of the AHRQ Inpatient Quality Indicators
Inpatient Quality Indicators Version 43 Documents and Software Available at httpwwwqualityindicatorsahrqgovmodulesiqi_resourcesaspx and httpwwwqualityindicatorsahrqgovsoftwaredefaultaspx
Title Description
IQI User Guide Individual Measures
The user guide provides a technical overview of the IQI individual measures including literature and empirical evidence
IQI User Guide Composite Measures
The user guide provides a technical overview of the IQI composite measures
IQI Technical Specifications
Provides detailed definitions of each IQI including all ICD-9-CM and DRG codes that are included in or excluded from the numerator and denominator Note that exclusions from the denominator are automatically applied to the numerator
IQI Comparative Data This document provides the average volume provider rate and population rate as appropriate for each indicator
Fiscal year 2011 Coding Changes
This document summarizes the changes to the indicator definitions resulting from FY 2011 changes to ICD-9-CM coding and DRG changes These changes will only affect data from FY 2011 (October 1 2011) or later
Log of Changes to IQI Documents and Software
The Change Log document provides a cumulative summary of all changes to the IQI software software documentation and other documents made since the release of version 21 of the software in March 2003 Changes to indicator specifications that were not a result of new ICD-9-CM and DRG codes are also described in the Change Log
IQI Risk Adjustment Coefficient Tables
Tables for each IQI provide the stratification and coefficients used to calculate the risk-adjusted rate for each strata
SASreg IQI Software Documentation
This software documentation provides detailed instructions on how to use the SAS reg version of the IQI software including data preparation calculation of the IQI rates and interpretation of output
SASreg IQI Software Requires the SASreg statistical program distributed by the SAS Institute Inc The company may be contacted directly regarding the licensing of its products httpwwwsascom
3Mreg APRreg DRG Limited License Grouper for SASreg
Creates APR-DRG variables for use with SAS version of IQI software Instructions for running the software are included in the Zip file
Version 43 Listserv announcement
This document announces the release of the Version 43 software and documentation provides a summary of changes and links to relevant pages
Inpatient Quality Indicators (IQI) Software Instruction SAS
Inpatient Quality Indicators (IQI) 44 Version 43 (August 2011)
AHRQ QI Windows Application The AHRQ QI Windows Application calculates rates for all of the AHRQ Quality Indicators modules and does not require SASreg It is available at
httpwwwqualityindicatorsahrqgovwinqi_downloadhtm Additional Documents The following documents are available within the Archive section of the AHRQ QI Web page
httpwwwqualityindicatorsahrqgovArchivedefaultaspxiqi
bull Refinement of the HCUP Quality Indicators (Technical Review) May 2001 bull Refinement of the HCUP Quality Indicators (Summary) May 2001
In addition these documents may be accessed at the AHRQ QI Modules Web page
httpwwwqualityindicatorsahrqgovmodulesDefaultaspx bull AHRQ QI Measure Development Implementation Maintenance and Retirement bull ICD-9-CM to ICD-10-CMPCS Conversion of AHRQ QI March 2011 bull AHRQ QI Empirical Methods May 2011 bull Guidance for Using the AHRQ Quality Indicators for Hospital-level Public Reporting
or Payment August 2004 bull AHRQ Summary Statement on Comparative Hospital Public Reporting December
2005 bull Appendix A Current Uses of AHRQ Quality Indicators and Considerations for
Hospital-level bull Comparison of Recommended Evaluation Criteria in Five Existing National
Frameworks bull List of AHRQ QI Endorsed by the National Quality Forum
The following documents can be viewed or downloaded from the AHRQ QI News Web page
httpwwwqualityindicatorsahrqgovnewsdefaultaspx and httpwwwqualityindicatorsahrqgovArchiveNewsaspx bull February 2007 Newsletter - Year highlights and future plans bull February 2006 Newsletter ndash Year highlights and future plans bull 2006 Area Level Indicator Changes bull Considerations in Public Reporting for the AHRQ QI bull June 2005 Newsletter - Contains the article Using Different Types of QI Rates
Inpatient Quality Indicators (IQI) Software Instruction SAS
Inpatient Quality Indicators (IQI) 45 Version 43 (August 2011)
Other Tools and Information
IQI rates can be calculated using the modified Federal Information Processing Standards (FIPS) Statecounty code A list of codes is available at
httpwwwcensusgovpopestgeographiccodes02pdf
AHRQ provides a free on-line query system based on HCUP data that provides access to health statistics and information on hospital stays at the national regional and State level It is available at
httphcupahrqgovHCUPnetasp
Information on the 3Mtrade APR-DRG system is available at
httpwww3mcomushealthcarehisproductscodingrefined_drgjhtml
Inpatient Quality Indicators (IQI) Software Instruction SAS
Inpatient Quality Indicators (IQI) 46 Version 43 (August 2011)
Appendix B Using Different Types of QI Rates When should you use the observed expected risk adjusted andor smoothed rates generated
by the AHRQ QI software Here are some guidelines If the userrsquos primary interest is to identify cases for further follow-up and quality
improvement then the observed rate would help to identify them The observed rate is the raw rate generated by the QI software from the data the user provided Areas for improvement can be identified by the magnitude of the observed rate compared to available benchmarks andor by the number of patients impacted
Additional breakdowns by the default patient characteristics used in stratified rates (eg age gender or payer) can further identify the target population Target populations can also be identified by user-defined patient characteristics supplemented to the casedischarge level flags Trend data can be used to measure change in the rate over time
Another approach to identify areas to focus on is to compare the observed and expected rates The expected rate is the rate the provider would have if it performed the same as the reference population given the providerrsquos actual case-mix (eg age gender DRG and comorbidity categories)
If the observed rate is higher than the expected rate (ie the ratio of observedexpected is greater than 10 or observed minus expected is positive) then the implication is that the provider performed worse than the reference population for that particular indicator Users may want to focus on these indicators for quality improvement
If the observed rate is lower than the expected rate (ie the ratio of observedexpected is less than 10 or observed minus expected is negative) then the implication is that the provider performed better than the reference population Users may want to focus on these indicators for identifying best practices
Users can also compare the expected rate to the reference population rate reported in the AHRQ QI software or Comparative Data document to determine how their case-mix compares to the reference population The population rate refers to the overall rate for the reference population The reference population is defined in the Comparative Data Document If the population rate is higher than the expected rate then the providerrsquos case-mix is less severe than the reference population If the population rate is lower than the expected rate then the providerrsquos case-mix is more severe than the reference population
We use this difference between the population rate and the expected rate to ldquoadjustrdquo the observed rate to account for the difference between the case-mix of the reference population and the providerrsquos case-mix which is the providerrsquos risk-adjusted rate
If the provider has a less severe case-mix then the adjustment is positive (population rate gt expected rate) and the risk-adjusted rate is higher than the observed rate If the provider has a more severe case-mix then the adjustment is negative (population rate lt expected rate) and the risk-adjusted rate is lower than the observed rate The risk-adjusted rate is the rate the provider would have if it had the same case-mix as the reference population given the providerrsquos actual performance
Finally users can compare the risk-adjusted rate to the smoothed or ldquoreliability-adjustedrdquo rate to determine whether this difference between the risk-adjusted rate and reference population rate is likely to remain in the next measurement period Smoothed rates are weighted averages of the population rate and the risk-adjusted rate where the weight reflects the reliability of the providerrsquos risk-adjusted rate
Inpatient Quality Indicators (IQI) Software Instruction SAS
Inpatient Quality Indicators (IQI) 47 Version 43 (August 2011)
A ratio of (smoothed rate - population rate) (risk-adjusted rate - population rate) greater than 080 suggests that the difference is likely to persist (whether the difference is positive or negative) A ratio less than 080 suggests that the difference may be due in part to random differences in patient characteristics (patient characteristics that are not observed and controlled for in the risk-adjustment model) In general users may want to focus on areas where the differences are more likely to persist
Inpatient Quality Indicators (IQI) Software Instruction SAS
Inpatient Quality Indicators (IQI) 48 Version 43 (August 2011)
Appendix C IQI Input Data Dictionary Variable name Description Format Value description Comments
KEY Sequence number Unique case identifier Numeric
User defined unique numeric identifier for each discharge record
Not used by the QI programs but should be present to facilitate possible exploration allows user to link the records from the IQSAS1SAS program output file back to the original input data file
AGE Age in years at admission Numeric Age in years
If this data element is missing the discharge record will be excluded from analysis
AGEDAY Age in days (coded only when the age in years is less than 1) Numeric Age in days
Not used in the IQI program If not present in the input data file it is not necessary to create a dummy variable for this module
RACE Race of patient Numeric 1 2 3 4 5 6
White Black Hispanic Asian or Pacific Island Native American Other
The values of 1-5 are used directly in the QI software All other ethnicity codes are mapped to an lsquootherrsquo category
SEX Sex of patient Numeric
1 2
Male Female
If this data element is missing the discharge record will be excluded from the analysis
PAY1 Expected primary payer
Numeric 1 2 3 4 5 6
Medicare Medicaid Private incl HMO Self-pay No charge Other
The values of 1 2 3 and 4 are used directly in the QI software All other payer codes are mapped to an lsquootherrsquo category This data element is used to stratify only the Provider-level IQI (IQI-01 toIQI-25 IQI-30 to IQI-34)
PAY2 (SAS Only)
Expected secondary payer
Numeric 1 2 3 4 5 6
Medicare Medicaid Private incl HMO Self-pay No charge Other
Use is optional but must be present in data (set to missing if data element not available)
PSTCO
Location of patient residence or hospital location (FIPSdagger Statecounty code)
Numeric ssccc
Modified Federal Information Processing Standards Statecounty code2
See Appendix A for link to most recent list of codes If this data element is missing the discharge record will be excluded from rate calculations
HOSPID Data Source hospital number Numeric Hospital
identification number Used to facilitate data exploration and possible trouble shooting
2 Federal Information Processing Standard as defined by the US Department of Commerce National Institute of Standards and Technology (formerly National Bureau of Standards) Note Certain independent cities (Baltimore City Carson City and St Louis City) and areas within Hawaii and Virginia are assigned to different area groupings in the Modified FIPS categories as compared to the US Census Bureau groupings The AHRQ QI software uses the Modified FIPS code assignment of these areas Failure to use the Modified FIPS codes assignment will result in the use of incorrect denominator estimates for area indicators A list is available at httpwwwcensusgovpopestgeographiccodes02pdf
Inpatient Quality Indicators (IQI) Software Instruction SAS
Inpatient Quality Indicators (IQI) 49 Version 43 (August 2011)
Variable name Description Format Value description Comments
DISP Disposition of patient
Numeric 1 2 3 4 5 6 7 20
Routine Short-term hospital Skilled nursing facility Intermediate care Another type of facility Home health care Against medical advice Died in the hospital
The values 2 and 20 are referenced by the QI code (to identify transfers to another short-term hospital and patients who died in the hospital)
MORT30 (SAS Only)
30-Day Mortality Indicator Numeric
0 ndash not died within 30-days from admission
Use is optional but must be present in data (set to missing if data element not available)
1 ndash died within 30-days from admission
DNR Do Not Resuscitate Indicator Numeric
0 ndash No ldquoDo Not Resuscitaterdquo Indicator
Use is optional but must be present in data (set to missing if data element not available)
1 ndash ldquoDo Not Resuscitaterdquo Indicator
ATYPE Admission Type Numeric 1 2 3 4 5 6
Emergency Urgent Elective Newborn Trauma Center3 Other
Not used by the IQI program If not present in the input data file it is not necessary to create a dummy variable
ASOURCE Admission Source
Numeric 1 2 3 4 5
ER Another hospital Another facility including LTC Courtlaw enforcement Routinebirthother
The value 2 is referenced by the QI code (to identify transfers from another short-term hospital)
LOS Length of Stay Numeric Number of days from admission to discharge
Not used by the IQI program If not present in the input data file it is not necessary to create a dummy variable
APR_DRG APR-DRG category Numeric APR-DRG from 3Mreg software
Although the IQI module will operate without these variables users should run APR-DRG software on their raw data to assign this variable to each case See Section 53 on page 15
APRDRG_ RISK_ MORTALITY
APR-DRG Mortality Score Numeric
APR-DRG Risk of Mortality Score from 3Mreg software
See Section 53 on page 15
XPRDRG_ RISK_ MORTALITY
APR-DRG Mortality Score with POA Numeric
APR-DRG Risk of Mortality Score from 3Mreg Software using
See Section 53 on page 15
3 The ATYPE value ldquo5rdquo was used to indicate delivery only in the 1988 to 1997 HCUP data files The UB standards currently use ldquo5rdquo to indicate Trauma Center
Inpatient Quality Indicators (IQI) Software Instruction SAS
Inpatient Quality Indicators (IQI) 50 Version 43 (August 2011)
Variable name Description Format Value description Comments
POA information
DRG Diagnosis Related Group Numeric DRG from federal (CMS) DRG Grouper
DRGVER Diagnosis Related Group Version Numeric
DRG Version of federal (CMS) DRG Grouper
eg Version 28 for FY2011
MDC Major Diagnostic Category Numeric MDC from federal (CMS) DRG grouper
DISCWT Weight to assign to discharge Numeric Format as nnnnn
Cases with missing values are assigned a value of 1 Assigning a weight of zero has the effect of removing the case from the analysis
DX1 ndash DX30
ICD-9-CM diagnosis codes DX1 is the principal diagnosis DX2-DX30 are secondary diagnoses
String 3 4 or 5
characters (do not include decimal point)
Diagnosis codes Users must specify the number of diagnoses in the parameter ampNDX in CONTROL_IQISAS program
DXPOA1- DXPOA30-
Present on admission indicator for each diagnosis code
String
1 = present at the time of inpatient admission
These data will be used in risk adjustment and smoothing if the alternative parameter files of risk-adjustment covariates and population rates is specified
(YWE1)
0 = not present at the time of inpatient admission
(NUrsquo0rsquo )
NDX Count of the number of diagnoses (DX) on the discharge record
Numeric
Count of diagnoses (principal and all secondary diagnoses)
Not used by the IQI SAS program If not present in the input data file it is not necessary to create a dummy variable Definition is If the 1st discharge record has 1 Pr and the 2nd has 2 NPR would be 1 for the 1st record and 2 for the 2nd
PR1 ndash PR30
ICD-9-CM procedure codes PR1 is the principal procedure PR2-PR30 are secondary procedures
String 3 or 4
characters (do not include decimal point)
Procedure code
Users with more or fewer secondary procedures should modify the parameter ampNPR in CONTROL_IQISAS to reflect the number of diagnoses
NPR Count of the number of procedures (PR) on the discharge record
Numeric
Count of procedures (principal and all secondary procedures)
Not used by the IQI SAS program If not present in the input data file it is not necessary to create a dummy variable Definition is If the 1st discharge record has 1 Pr and the 2nd has 2 NPR would be 1 for the 1st record and 2 for the 2nd
Inpatient Quality Indicators (IQI) Software Instruction SAS
Inpatient Quality Indicators (IQI) 51 Version 43 (August 2011)
Variable name Description Format Value description Comments
POINTOFORIGINUB04
Point of Origin Numeric 4 Transfer from a hospital 5 Transfer from a skilled Nursing Facility (SNF) or Intermediate Care Facility (ICF)
Only these values are used by the QI programs
6 Transfer from another health care facility
IF ATYPE = 4
5 Born inside this hospital
6 Born outside of this hospital
PRDAY1 ndash PRDAY30
Days from admission to procedure PR1 is the principal procedure PR2-PR30 are secondary procedures
Numeric Days from Admission to Procedure4
Not used by the IQI program If not present in the input data file it is not necessary to create a dummy variable for this module
YEAR
Year of discharge The patientrsquos year of discharge For example a patient discharged on July 7 2004 would have a discharge year of lsquo2004rsquo
Numeric
YYYY
Discharge year should be within the range of 1997 to 2011
DQTR Quarter of discharge The calendar quarter of the patientrsquos discharge For example a patient discharged on July 7 2004 would have a discharge quarter of lsquo3rsquo
Numeric 1 January-March 2 April-June 3 July-September 4 October-December
See httphcup-usahrqgovtoolssoftwarecomorbiditycomorbidityjsp
4 Variables PRDAY1 to PRDAY30 are defined as the number of days from date of admission to date of procedure for each procedure For example if the patient was admitted on June 15th and had two procedures - the principal procedure on June 15th and a second procedure on June 18th ndash then the value of PRDAY1 would be zero (0) and the value of PRDAY2 would be three (3) For more information consult the HCUP data documentation at httpwwwhcup-usahrqgovdbvarsprdaynnisnotejsp
Inpatient Quality Indicators (IQI) Software Instruction SAS
Inpatient Quality Indicators (IQI) 52 Version 43 (August 2011)
Appendix D SAS IQI Output Data Dictionary SAS IQI Provider Output Column Heading Description Format Comments
Obs Observation 1 (with HOSPID = ) is the overall average for the entire dataset (TYPELVLP = 0) The remaining observations are individual providers or hospitals (TYPELVLP = 16)
Numeric
HOSPID Identifier for each provider in the dataset
Text Up to 12 characters
AGECAT Age stratification category Numeric range
SEXCAT Gender stratification category Numeric 1 = male 2 = female PAYCAT Payer stratification category Numeric 1 = Medicare
2 = Medicaid 3 = Private incl HMO 4 = Self-pay 5 = No charge 6 = Other
RACECAT Race stratification category Numeric 1 = White 2 = Black 3 = Hispanic 4 = Asian or Pacific Island 5 = Native American 6 = Other
TPIQxx The number of discharge records included in the numerator (outcome of interest) as defined for the indicator
Numeric
PPIQxx The number of discharge records included in the denominator (population at risk) as defined for the indicator
Numeric
OPIQxx The rate (observed numerator observed denominator) as defined for the indicator
Numeric
EPIQxx Rate calculated by assuming an average performance for each patient group based on the reference population but with the providerlsquos actual case-mix
Numeric
RPIQxx The estimated rate calculated by adjusting to an average case-mix
Numeric When stratifications other than hospital or area are selected the RPIQxx variables and their confidence intervals are observedexpected ratios to avoid confounding with risk adjustment variables
LPIQxx The lower confidence bound of the risk adjusted rate
Numeric
UPIQxx The upper confidence bound of the risk adjusted rate
Numeric
Inpatient Quality Indicators (IQI) Software Instruction SAS
Inpatient Quality Indicators (IQI) 53 Version 43 (August 2011)
Column Heading Description Format Comments
SPIQxx The smoothed rate calculated using multivariate signal extraction (MSX)
Numeric
XPIQxx Standard error of smoothed rate Numeric VPIQxx Variance for respective indicators Numeric
SAS IQI Area Output Column Heading Description Format Comments
Obs Observation 1 (with HOSPID = ) is the overall average for the entire dataset (TYPELVLP = 0) The remaining observations are individual providers or hospitals (TYPELVLP = 16)
Numeric
AREA Identifier in the dataset for area Text TAIQxx The number of discharge records
included in the numerator (outcome of interest) as defined for the indicator
Numeric
PAIQxx The number of discharge records included in the denominator (population at risk) as defined for the indicator
Numeric
OAIQxx The rate (observed numerator observed denominator) as defined for the indicator
Numeric
RAIQxx The estimated rate calculated by adjusting to an average case-mix
Numeric When stratifications other than hospital or area are selected the RAIQxx variables and their confidence intervals are observedexpected ratios to avoid confounding with risk adjustment variables
SAIQxx The smoothed rate calculated using multivariate signal extraction (MSX)
Numeric

Inpatient Quality Indicators (IQI) Software Instruction SAS
Inpatient Quality Indicators (IQI) 40 Version 43 (August 2011)
For the observed rates the User should NOT report the MEANS displayed here but instead should refer to the overall means in the output dataset that are also present in the subsequent PROC PRINT The MEANS given here are means of the area means ie all areas are given equal weight regardless of the population in the different areas
bull The SUMs for the counter variables TAQIxx and PAIQXX will contain overall file totals for these data elements The SUMs for the observed rates have no intuitive meaning
If the ldquoPRINTrdquo parameter in the CONTROL_IQISAS program is set to one the subsequent
PROC PRINT output contains a complete dump of the output summary file Listed for each record are the stratification values the PAIQxx population denominators for the four indicators the TAIQxx outcome numerators for the four indicators and the four OAIQxx observed rates
95 IQSASA3 The PROC PRINT at the end of this program provides your final output (This printout appears if the ldquoPRINTrdquo parameter in the CONTROL_IQISAS program is set to one)
The following table lists the column headers shown on the printed output and describes each
Each indicator is reported in a separate section Values of ldquoxxrdquo correspond to the two-digit IQI number Table 9 Area level printed output
Column Heading Description
Obs Observation 1 is the overall average for the entire dataset (TYPELVLA = 0) The remaining observations are individual areas (TYPELVLA = 8)
Area Identifier in the dataset for area TAIQxx Number of cases in the numerator PAIQxx Number of cases in the denominator (population at risk) OAIQxx Observed (raw) rate ndash Numerator divided by Denominator RAIQxx Risk-adjusted rate ndash Accounts for the difference between the case-mix of the
reference population and the arearsquos case-mix When stratifications other than hospital or area are selected the RPIQxx variables and their confidence intervals are observedexpected ratios to avoid confounding with risk adjustment variables
SAIQxx Smoothed rate ndash Rates with removal of fluxuation over time
Observation 1 (with AREA = blank) is the overall average for the entire dataset (TYPELVL = 0) The remaining observations are individual areas (TYPELVL = 8)
You may wish to express the results in more understandable terms
bull Multiply the utilization rates by 100000 to express them as a rate per 100000 population (eg 0000494 100000 = 494 hysterectomies per 100000 population)
The MEANS table is generated from the permanent area-level output file The means are
provided just for the area-level summary records
Inpatient Quality Indicators (IQI) Software Instruction SAS
Inpatient Quality Indicators (IQI) 41 Version 43 (August 2011)
bull The N for all but the TAIQxx counter variables should contain the number of different areas (Metro Areas and counties) in your database
bull The MEANs MINIMUMs and MAXIMUMs have their normal meaning and provide comparisons among the different areas in your database Note that the MAXIMUMs for the counter variables (the TAIQxx and PAIQxx variables) are associated with specific areas and therefore these MAXIMUMs may not match those in the prior IQSAS2 printouts since that run typically will include a record for the entire database
For the (observed risk-adjusted or smoothed) rates the User should NOT report the MEANS displayed here but instead refer to the overall means in the output dataset that are also present in the subsequent PROC PRINT The MEANS given here are means of area means ie all areas are given equal weight regardless of the number of discharges in the different areas
bull The SUMs of the counter variables (the TAIQxx and PAIQxx variables) yield the overall database totals
Inpatient Quality Indicators (IQI) Software Instruction SAS
Inpatient Quality Indicators (IQI) 42 Version 43 (August 2011)
100 Benchmark Timings The benchmark runtimes given below are from runs made on a Windows XP workstation
with a Pentium 4 CPU 280 GHz processor 512 MB of RAM and an IDE hard drive The dataset used contained 757624 observations with 15 diagnosis fields and 15 procedure fields
Step Run time (in seconds) Run IQFMTS to create the format library 2 Run IQSAS1 157 Run IQSASP2 21 Run IQSASP3 86 Run IQSASA2 10 Run IQSASA3 185
101 User Support Technical assistance is available through an electronic user support system monitored by the
QI support team to support users in their application of the IQI software The same e-mail address may be used to communicate to AHRQ any suggestions for IQI enhancements general questions and any QI related comments you may have AHRQ welcomes your feedback
The Internet address for user support and feedback is supportqualityindicatorsahrqgov AHRQ also offers a listserv to keep you informed on the Quality Indicators (QIs) The
listserv is used to announce any QI changes or updates new tools and resources and to distribute other QI related information This is a free service Simply follow the process described below to begin receiving important QI information All you need is a computer Internet access and an E-mail address It works just like other electronic distribution lists
Herersquos how to register 1 Send an E-mail message to listservqualityindicatorsahrqgov 2 On the subject line type Subscribe For example Subscribe
3 In the body of the message type sub Quality_Indicators-L and your full name For example sub Quality_Indicators-L John Doe
4 You will receive a message confirming that you are signed up If you have any questions contact AHRQ QI Support at the e-mail noted above You should
receive an automatic response e-mail message confirming receipt of your e-mail If you do not receive a confirmation message call (888) 512-6090
Inpatient Quality Indicators (IQI) Software Instruction SAS
Inpatient Quality Indicators (IQI) 43 Version 43 (August 2011)
Appendix A Links The following links may be helpful to users of the AHRQ Inpatient Quality Indicators
Inpatient Quality Indicators Version 43 Documents and Software Available at httpwwwqualityindicatorsahrqgovmodulesiqi_resourcesaspx and httpwwwqualityindicatorsahrqgovsoftwaredefaultaspx
Title Description
IQI User Guide Individual Measures
The user guide provides a technical overview of the IQI individual measures including literature and empirical evidence
IQI User Guide Composite Measures
The user guide provides a technical overview of the IQI composite measures
IQI Technical Specifications
Provides detailed definitions of each IQI including all ICD-9-CM and DRG codes that are included in or excluded from the numerator and denominator Note that exclusions from the denominator are automatically applied to the numerator
IQI Comparative Data This document provides the average volume provider rate and population rate as appropriate for each indicator
Fiscal year 2011 Coding Changes
This document summarizes the changes to the indicator definitions resulting from FY 2011 changes to ICD-9-CM coding and DRG changes These changes will only affect data from FY 2011 (October 1 2011) or later
Log of Changes to IQI Documents and Software
The Change Log document provides a cumulative summary of all changes to the IQI software software documentation and other documents made since the release of version 21 of the software in March 2003 Changes to indicator specifications that were not a result of new ICD-9-CM and DRG codes are also described in the Change Log
IQI Risk Adjustment Coefficient Tables
Tables for each IQI provide the stratification and coefficients used to calculate the risk-adjusted rate for each strata
SASreg IQI Software Documentation
This software documentation provides detailed instructions on how to use the SAS reg version of the IQI software including data preparation calculation of the IQI rates and interpretation of output
SASreg IQI Software Requires the SASreg statistical program distributed by the SAS Institute Inc The company may be contacted directly regarding the licensing of its products httpwwwsascom
3Mreg APRreg DRG Limited License Grouper for SASreg
Creates APR-DRG variables for use with SAS version of IQI software Instructions for running the software are included in the Zip file
Version 43 Listserv announcement
This document announces the release of the Version 43 software and documentation provides a summary of changes and links to relevant pages
Inpatient Quality Indicators (IQI) Software Instruction SAS
Inpatient Quality Indicators (IQI) 44 Version 43 (August 2011)
AHRQ QI Windows Application The AHRQ QI Windows Application calculates rates for all of the AHRQ Quality Indicators modules and does not require SASreg It is available at
httpwwwqualityindicatorsahrqgovwinqi_downloadhtm Additional Documents The following documents are available within the Archive section of the AHRQ QI Web page
httpwwwqualityindicatorsahrqgovArchivedefaultaspxiqi
bull Refinement of the HCUP Quality Indicators (Technical Review) May 2001 bull Refinement of the HCUP Quality Indicators (Summary) May 2001
In addition these documents may be accessed at the AHRQ QI Modules Web page
httpwwwqualityindicatorsahrqgovmodulesDefaultaspx bull AHRQ QI Measure Development Implementation Maintenance and Retirement bull ICD-9-CM to ICD-10-CMPCS Conversion of AHRQ QI March 2011 bull AHRQ QI Empirical Methods May 2011 bull Guidance for Using the AHRQ Quality Indicators for Hospital-level Public Reporting
or Payment August 2004 bull AHRQ Summary Statement on Comparative Hospital Public Reporting December
2005 bull Appendix A Current Uses of AHRQ Quality Indicators and Considerations for
Hospital-level bull Comparison of Recommended Evaluation Criteria in Five Existing National
Frameworks bull List of AHRQ QI Endorsed by the National Quality Forum
The following documents can be viewed or downloaded from the AHRQ QI News Web page
httpwwwqualityindicatorsahrqgovnewsdefaultaspx and httpwwwqualityindicatorsahrqgovArchiveNewsaspx bull February 2007 Newsletter - Year highlights and future plans bull February 2006 Newsletter ndash Year highlights and future plans bull 2006 Area Level Indicator Changes bull Considerations in Public Reporting for the AHRQ QI bull June 2005 Newsletter - Contains the article Using Different Types of QI Rates
Inpatient Quality Indicators (IQI) Software Instruction SAS
Inpatient Quality Indicators (IQI) 45 Version 43 (August 2011)
Other Tools and Information
IQI rates can be calculated using the modified Federal Information Processing Standards (FIPS) Statecounty code A list of codes is available at
httpwwwcensusgovpopestgeographiccodes02pdf
AHRQ provides a free on-line query system based on HCUP data that provides access to health statistics and information on hospital stays at the national regional and State level It is available at
httphcupahrqgovHCUPnetasp
Information on the 3Mtrade APR-DRG system is available at
httpwww3mcomushealthcarehisproductscodingrefined_drgjhtml
Inpatient Quality Indicators (IQI) Software Instruction SAS
Inpatient Quality Indicators (IQI) 46 Version 43 (August 2011)
Appendix B Using Different Types of QI Rates When should you use the observed expected risk adjusted andor smoothed rates generated
by the AHRQ QI software Here are some guidelines If the userrsquos primary interest is to identify cases for further follow-up and quality
improvement then the observed rate would help to identify them The observed rate is the raw rate generated by the QI software from the data the user provided Areas for improvement can be identified by the magnitude of the observed rate compared to available benchmarks andor by the number of patients impacted
Additional breakdowns by the default patient characteristics used in stratified rates (eg age gender or payer) can further identify the target population Target populations can also be identified by user-defined patient characteristics supplemented to the casedischarge level flags Trend data can be used to measure change in the rate over time
Another approach to identify areas to focus on is to compare the observed and expected rates The expected rate is the rate the provider would have if it performed the same as the reference population given the providerrsquos actual case-mix (eg age gender DRG and comorbidity categories)
If the observed rate is higher than the expected rate (ie the ratio of observedexpected is greater than 10 or observed minus expected is positive) then the implication is that the provider performed worse than the reference population for that particular indicator Users may want to focus on these indicators for quality improvement
If the observed rate is lower than the expected rate (ie the ratio of observedexpected is less than 10 or observed minus expected is negative) then the implication is that the provider performed better than the reference population Users may want to focus on these indicators for identifying best practices
Users can also compare the expected rate to the reference population rate reported in the AHRQ QI software or Comparative Data document to determine how their case-mix compares to the reference population The population rate refers to the overall rate for the reference population The reference population is defined in the Comparative Data Document If the population rate is higher than the expected rate then the providerrsquos case-mix is less severe than the reference population If the population rate is lower than the expected rate then the providerrsquos case-mix is more severe than the reference population
We use this difference between the population rate and the expected rate to ldquoadjustrdquo the observed rate to account for the difference between the case-mix of the reference population and the providerrsquos case-mix which is the providerrsquos risk-adjusted rate
If the provider has a less severe case-mix then the adjustment is positive (population rate gt expected rate) and the risk-adjusted rate is higher than the observed rate If the provider has a more severe case-mix then the adjustment is negative (population rate lt expected rate) and the risk-adjusted rate is lower than the observed rate The risk-adjusted rate is the rate the provider would have if it had the same case-mix as the reference population given the providerrsquos actual performance
Finally users can compare the risk-adjusted rate to the smoothed or ldquoreliability-adjustedrdquo rate to determine whether this difference between the risk-adjusted rate and reference population rate is likely to remain in the next measurement period Smoothed rates are weighted averages of the population rate and the risk-adjusted rate where the weight reflects the reliability of the providerrsquos risk-adjusted rate
Inpatient Quality Indicators (IQI) Software Instruction SAS
Inpatient Quality Indicators (IQI) 47 Version 43 (August 2011)
A ratio of (smoothed rate - population rate) (risk-adjusted rate - population rate) greater than 080 suggests that the difference is likely to persist (whether the difference is positive or negative) A ratio less than 080 suggests that the difference may be due in part to random differences in patient characteristics (patient characteristics that are not observed and controlled for in the risk-adjustment model) In general users may want to focus on areas where the differences are more likely to persist
Inpatient Quality Indicators (IQI) Software Instruction SAS
Inpatient Quality Indicators (IQI) 48 Version 43 (August 2011)
Appendix C IQI Input Data Dictionary Variable name Description Format Value description Comments
KEY Sequence number Unique case identifier Numeric
User defined unique numeric identifier for each discharge record
Not used by the QI programs but should be present to facilitate possible exploration allows user to link the records from the IQSAS1SAS program output file back to the original input data file
AGE Age in years at admission Numeric Age in years
If this data element is missing the discharge record will be excluded from analysis
AGEDAY Age in days (coded only when the age in years is less than 1) Numeric Age in days
Not used in the IQI program If not present in the input data file it is not necessary to create a dummy variable for this module
RACE Race of patient Numeric 1 2 3 4 5 6
White Black Hispanic Asian or Pacific Island Native American Other
The values of 1-5 are used directly in the QI software All other ethnicity codes are mapped to an lsquootherrsquo category
SEX Sex of patient Numeric
1 2
Male Female
If this data element is missing the discharge record will be excluded from the analysis
PAY1 Expected primary payer
Numeric 1 2 3 4 5 6
Medicare Medicaid Private incl HMO Self-pay No charge Other
The values of 1 2 3 and 4 are used directly in the QI software All other payer codes are mapped to an lsquootherrsquo category This data element is used to stratify only the Provider-level IQI (IQI-01 toIQI-25 IQI-30 to IQI-34)
PAY2 (SAS Only)
Expected secondary payer
Numeric 1 2 3 4 5 6
Medicare Medicaid Private incl HMO Self-pay No charge Other
Use is optional but must be present in data (set to missing if data element not available)
PSTCO
Location of patient residence or hospital location (FIPSdagger Statecounty code)
Numeric ssccc
Modified Federal Information Processing Standards Statecounty code2
See Appendix A for link to most recent list of codes If this data element is missing the discharge record will be excluded from rate calculations
HOSPID Data Source hospital number Numeric Hospital
identification number Used to facilitate data exploration and possible trouble shooting
2 Federal Information Processing Standard as defined by the US Department of Commerce National Institute of Standards and Technology (formerly National Bureau of Standards) Note Certain independent cities (Baltimore City Carson City and St Louis City) and areas within Hawaii and Virginia are assigned to different area groupings in the Modified FIPS categories as compared to the US Census Bureau groupings The AHRQ QI software uses the Modified FIPS code assignment of these areas Failure to use the Modified FIPS codes assignment will result in the use of incorrect denominator estimates for area indicators A list is available at httpwwwcensusgovpopestgeographiccodes02pdf
Inpatient Quality Indicators (IQI) Software Instruction SAS
Inpatient Quality Indicators (IQI) 49 Version 43 (August 2011)
Variable name Description Format Value description Comments
DISP Disposition of patient
Numeric 1 2 3 4 5 6 7 20
Routine Short-term hospital Skilled nursing facility Intermediate care Another type of facility Home health care Against medical advice Died in the hospital
The values 2 and 20 are referenced by the QI code (to identify transfers to another short-term hospital and patients who died in the hospital)
MORT30 (SAS Only)
30-Day Mortality Indicator Numeric
0 ndash not died within 30-days from admission
Use is optional but must be present in data (set to missing if data element not available)
1 ndash died within 30-days from admission
DNR Do Not Resuscitate Indicator Numeric
0 ndash No ldquoDo Not Resuscitaterdquo Indicator
Use is optional but must be present in data (set to missing if data element not available)
1 ndash ldquoDo Not Resuscitaterdquo Indicator
ATYPE Admission Type Numeric 1 2 3 4 5 6
Emergency Urgent Elective Newborn Trauma Center3 Other
Not used by the IQI program If not present in the input data file it is not necessary to create a dummy variable
ASOURCE Admission Source
Numeric 1 2 3 4 5
ER Another hospital Another facility including LTC Courtlaw enforcement Routinebirthother
The value 2 is referenced by the QI code (to identify transfers from another short-term hospital)
LOS Length of Stay Numeric Number of days from admission to discharge
Not used by the IQI program If not present in the input data file it is not necessary to create a dummy variable
APR_DRG APR-DRG category Numeric APR-DRG from 3Mreg software
Although the IQI module will operate without these variables users should run APR-DRG software on their raw data to assign this variable to each case See Section 53 on page 15
APRDRG_ RISK_ MORTALITY
APR-DRG Mortality Score Numeric
APR-DRG Risk of Mortality Score from 3Mreg software
See Section 53 on page 15
XPRDRG_ RISK_ MORTALITY
APR-DRG Mortality Score with POA Numeric
APR-DRG Risk of Mortality Score from 3Mreg Software using
See Section 53 on page 15
3 The ATYPE value ldquo5rdquo was used to indicate delivery only in the 1988 to 1997 HCUP data files The UB standards currently use ldquo5rdquo to indicate Trauma Center
Inpatient Quality Indicators (IQI) Software Instruction SAS
Inpatient Quality Indicators (IQI) 50 Version 43 (August 2011)
Variable name Description Format Value description Comments
POA information
DRG Diagnosis Related Group Numeric DRG from federal (CMS) DRG Grouper
DRGVER Diagnosis Related Group Version Numeric
DRG Version of federal (CMS) DRG Grouper
eg Version 28 for FY2011
MDC Major Diagnostic Category Numeric MDC from federal (CMS) DRG grouper
DISCWT Weight to assign to discharge Numeric Format as nnnnn
Cases with missing values are assigned a value of 1 Assigning a weight of zero has the effect of removing the case from the analysis
DX1 ndash DX30
ICD-9-CM diagnosis codes DX1 is the principal diagnosis DX2-DX30 are secondary diagnoses
String 3 4 or 5
characters (do not include decimal point)
Diagnosis codes Users must specify the number of diagnoses in the parameter ampNDX in CONTROL_IQISAS program
DXPOA1- DXPOA30-
Present on admission indicator for each diagnosis code
String
1 = present at the time of inpatient admission
These data will be used in risk adjustment and smoothing if the alternative parameter files of risk-adjustment covariates and population rates is specified
(YWE1)
0 = not present at the time of inpatient admission
(NUrsquo0rsquo )
NDX Count of the number of diagnoses (DX) on the discharge record
Numeric
Count of diagnoses (principal and all secondary diagnoses)
Not used by the IQI SAS program If not present in the input data file it is not necessary to create a dummy variable Definition is If the 1st discharge record has 1 Pr and the 2nd has 2 NPR would be 1 for the 1st record and 2 for the 2nd
PR1 ndash PR30
ICD-9-CM procedure codes PR1 is the principal procedure PR2-PR30 are secondary procedures
String 3 or 4
characters (do not include decimal point)
Procedure code
Users with more or fewer secondary procedures should modify the parameter ampNPR in CONTROL_IQISAS to reflect the number of diagnoses
NPR Count of the number of procedures (PR) on the discharge record
Numeric
Count of procedures (principal and all secondary procedures)
Not used by the IQI SAS program If not present in the input data file it is not necessary to create a dummy variable Definition is If the 1st discharge record has 1 Pr and the 2nd has 2 NPR would be 1 for the 1st record and 2 for the 2nd
Inpatient Quality Indicators (IQI) Software Instruction SAS
Inpatient Quality Indicators (IQI) 51 Version 43 (August 2011)
Variable name Description Format Value description Comments
POINTOFORIGINUB04
Point of Origin Numeric 4 Transfer from a hospital 5 Transfer from a skilled Nursing Facility (SNF) or Intermediate Care Facility (ICF)
Only these values are used by the QI programs
6 Transfer from another health care facility
IF ATYPE = 4
5 Born inside this hospital
6 Born outside of this hospital
PRDAY1 ndash PRDAY30
Days from admission to procedure PR1 is the principal procedure PR2-PR30 are secondary procedures
Numeric Days from Admission to Procedure4
Not used by the IQI program If not present in the input data file it is not necessary to create a dummy variable for this module
YEAR
Year of discharge The patientrsquos year of discharge For example a patient discharged on July 7 2004 would have a discharge year of lsquo2004rsquo
Numeric
YYYY
Discharge year should be within the range of 1997 to 2011
DQTR Quarter of discharge The calendar quarter of the patientrsquos discharge For example a patient discharged on July 7 2004 would have a discharge quarter of lsquo3rsquo
Numeric 1 January-March 2 April-June 3 July-September 4 October-December
See httphcup-usahrqgovtoolssoftwarecomorbiditycomorbidityjsp
4 Variables PRDAY1 to PRDAY30 are defined as the number of days from date of admission to date of procedure for each procedure For example if the patient was admitted on June 15th and had two procedures - the principal procedure on June 15th and a second procedure on June 18th ndash then the value of PRDAY1 would be zero (0) and the value of PRDAY2 would be three (3) For more information consult the HCUP data documentation at httpwwwhcup-usahrqgovdbvarsprdaynnisnotejsp
Inpatient Quality Indicators (IQI) Software Instruction SAS
Inpatient Quality Indicators (IQI) 52 Version 43 (August 2011)
Appendix D SAS IQI Output Data Dictionary SAS IQI Provider Output Column Heading Description Format Comments
Obs Observation 1 (with HOSPID = ) is the overall average for the entire dataset (TYPELVLP = 0) The remaining observations are individual providers or hospitals (TYPELVLP = 16)
Numeric
HOSPID Identifier for each provider in the dataset
Text Up to 12 characters
AGECAT Age stratification category Numeric range
SEXCAT Gender stratification category Numeric 1 = male 2 = female PAYCAT Payer stratification category Numeric 1 = Medicare
2 = Medicaid 3 = Private incl HMO 4 = Self-pay 5 = No charge 6 = Other
RACECAT Race stratification category Numeric 1 = White 2 = Black 3 = Hispanic 4 = Asian or Pacific Island 5 = Native American 6 = Other
TPIQxx The number of discharge records included in the numerator (outcome of interest) as defined for the indicator
Numeric
PPIQxx The number of discharge records included in the denominator (population at risk) as defined for the indicator
Numeric
OPIQxx The rate (observed numerator observed denominator) as defined for the indicator
Numeric
EPIQxx Rate calculated by assuming an average performance for each patient group based on the reference population but with the providerlsquos actual case-mix
Numeric
RPIQxx The estimated rate calculated by adjusting to an average case-mix
Numeric When stratifications other than hospital or area are selected the RPIQxx variables and their confidence intervals are observedexpected ratios to avoid confounding with risk adjustment variables
LPIQxx The lower confidence bound of the risk adjusted rate
Numeric
UPIQxx The upper confidence bound of the risk adjusted rate
Numeric
Inpatient Quality Indicators (IQI) Software Instruction SAS
Inpatient Quality Indicators (IQI) 53 Version 43 (August 2011)
Column Heading Description Format Comments
SPIQxx The smoothed rate calculated using multivariate signal extraction (MSX)
Numeric
XPIQxx Standard error of smoothed rate Numeric VPIQxx Variance for respective indicators Numeric
SAS IQI Area Output Column Heading Description Format Comments
Obs Observation 1 (with HOSPID = ) is the overall average for the entire dataset (TYPELVLP = 0) The remaining observations are individual providers or hospitals (TYPELVLP = 16)
Numeric
AREA Identifier in the dataset for area Text TAIQxx The number of discharge records
included in the numerator (outcome of interest) as defined for the indicator
Numeric
PAIQxx The number of discharge records included in the denominator (population at risk) as defined for the indicator
Numeric
OAIQxx The rate (observed numerator observed denominator) as defined for the indicator
Numeric
RAIQxx The estimated rate calculated by adjusting to an average case-mix
Numeric When stratifications other than hospital or area are selected the RAIQxx variables and their confidence intervals are observedexpected ratios to avoid confounding with risk adjustment variables
SAIQxx The smoothed rate calculated using multivariate signal extraction (MSX)
Numeric
Inpatient Quality Indicators (IQI) Software Instruction SAS
Inpatient Quality Indicators (IQI) 41 Version 43 (August 2011)
bull The N for all but the TAIQxx counter variables should contain the number of different areas (Metro Areas and counties) in your database
bull The MEANs MINIMUMs and MAXIMUMs have their normal meaning and provide comparisons among the different areas in your database Note that the MAXIMUMs for the counter variables (the TAIQxx and PAIQxx variables) are associated with specific areas and therefore these MAXIMUMs may not match those in the prior IQSAS2 printouts since that run typically will include a record for the entire database
For the (observed risk-adjusted or smoothed) rates the User should NOT report the MEANS displayed here but instead refer to the overall means in the output dataset that are also present in the subsequent PROC PRINT The MEANS given here are means of area means ie all areas are given equal weight regardless of the number of discharges in the different areas
bull The SUMs of the counter variables (the TAIQxx and PAIQxx variables) yield the overall database totals
Inpatient Quality Indicators (IQI) Software Instruction SAS
Inpatient Quality Indicators (IQI) 42 Version 43 (August 2011)
100 Benchmark Timings The benchmark runtimes given below are from runs made on a Windows XP workstation
with a Pentium 4 CPU 280 GHz processor 512 MB of RAM and an IDE hard drive The dataset used contained 757624 observations with 15 diagnosis fields and 15 procedure fields
Step Run time (in seconds) Run IQFMTS to create the format library 2 Run IQSAS1 157 Run IQSASP2 21 Run IQSASP3 86 Run IQSASA2 10 Run IQSASA3 185
101 User Support Technical assistance is available through an electronic user support system monitored by the
QI support team to support users in their application of the IQI software The same e-mail address may be used to communicate to AHRQ any suggestions for IQI enhancements general questions and any QI related comments you may have AHRQ welcomes your feedback
The Internet address for user support and feedback is supportqualityindicatorsahrqgov AHRQ also offers a listserv to keep you informed on the Quality Indicators (QIs) The
listserv is used to announce any QI changes or updates new tools and resources and to distribute other QI related information This is a free service Simply follow the process described below to begin receiving important QI information All you need is a computer Internet access and an E-mail address It works just like other electronic distribution lists
Herersquos how to register 1 Send an E-mail message to listservqualityindicatorsahrqgov 2 On the subject line type Subscribe For example Subscribe
3 In the body of the message type sub Quality_Indicators-L and your full name For example sub Quality_Indicators-L John Doe
4 You will receive a message confirming that you are signed up If you have any questions contact AHRQ QI Support at the e-mail noted above You should
receive an automatic response e-mail message confirming receipt of your e-mail If you do not receive a confirmation message call (888) 512-6090
Inpatient Quality Indicators (IQI) Software Instruction SAS
Inpatient Quality Indicators (IQI) 43 Version 43 (August 2011)
Appendix A Links The following links may be helpful to users of the AHRQ Inpatient Quality Indicators
Inpatient Quality Indicators Version 43 Documents and Software Available at httpwwwqualityindicatorsahrqgovmodulesiqi_resourcesaspx and httpwwwqualityindicatorsahrqgovsoftwaredefaultaspx
Title Description
IQI User Guide Individual Measures
The user guide provides a technical overview of the IQI individual measures including literature and empirical evidence
IQI User Guide Composite Measures
The user guide provides a technical overview of the IQI composite measures
IQI Technical Specifications
Provides detailed definitions of each IQI including all ICD-9-CM and DRG codes that are included in or excluded from the numerator and denominator Note that exclusions from the denominator are automatically applied to the numerator
IQI Comparative Data This document provides the average volume provider rate and population rate as appropriate for each indicator
Fiscal year 2011 Coding Changes
This document summarizes the changes to the indicator definitions resulting from FY 2011 changes to ICD-9-CM coding and DRG changes These changes will only affect data from FY 2011 (October 1 2011) or later
Log of Changes to IQI Documents and Software
The Change Log document provides a cumulative summary of all changes to the IQI software software documentation and other documents made since the release of version 21 of the software in March 2003 Changes to indicator specifications that were not a result of new ICD-9-CM and DRG codes are also described in the Change Log
IQI Risk Adjustment Coefficient Tables
Tables for each IQI provide the stratification and coefficients used to calculate the risk-adjusted rate for each strata
SASreg IQI Software Documentation
This software documentation provides detailed instructions on how to use the SAS reg version of the IQI software including data preparation calculation of the IQI rates and interpretation of output
SASreg IQI Software Requires the SASreg statistical program distributed by the SAS Institute Inc The company may be contacted directly regarding the licensing of its products httpwwwsascom
3Mreg APRreg DRG Limited License Grouper for SASreg
Creates APR-DRG variables for use with SAS version of IQI software Instructions for running the software are included in the Zip file
Version 43 Listserv announcement
This document announces the release of the Version 43 software and documentation provides a summary of changes and links to relevant pages
Inpatient Quality Indicators (IQI) Software Instruction SAS
Inpatient Quality Indicators (IQI) 44 Version 43 (August 2011)
AHRQ QI Windows Application The AHRQ QI Windows Application calculates rates for all of the AHRQ Quality Indicators modules and does not require SASreg It is available at
httpwwwqualityindicatorsahrqgovwinqi_downloadhtm Additional Documents The following documents are available within the Archive section of the AHRQ QI Web page
httpwwwqualityindicatorsahrqgovArchivedefaultaspxiqi
bull Refinement of the HCUP Quality Indicators (Technical Review) May 2001 bull Refinement of the HCUP Quality Indicators (Summary) May 2001
In addition these documents may be accessed at the AHRQ QI Modules Web page
httpwwwqualityindicatorsahrqgovmodulesDefaultaspx bull AHRQ QI Measure Development Implementation Maintenance and Retirement bull ICD-9-CM to ICD-10-CMPCS Conversion of AHRQ QI March 2011 bull AHRQ QI Empirical Methods May 2011 bull Guidance for Using the AHRQ Quality Indicators for Hospital-level Public Reporting
or Payment August 2004 bull AHRQ Summary Statement on Comparative Hospital Public Reporting December
2005 bull Appendix A Current Uses of AHRQ Quality Indicators and Considerations for
Hospital-level bull Comparison of Recommended Evaluation Criteria in Five Existing National
Frameworks bull List of AHRQ QI Endorsed by the National Quality Forum
The following documents can be viewed or downloaded from the AHRQ QI News Web page
httpwwwqualityindicatorsahrqgovnewsdefaultaspx and httpwwwqualityindicatorsahrqgovArchiveNewsaspx bull February 2007 Newsletter - Year highlights and future plans bull February 2006 Newsletter ndash Year highlights and future plans bull 2006 Area Level Indicator Changes bull Considerations in Public Reporting for the AHRQ QI bull June 2005 Newsletter - Contains the article Using Different Types of QI Rates
Inpatient Quality Indicators (IQI) Software Instruction SAS
Inpatient Quality Indicators (IQI) 45 Version 43 (August 2011)
Other Tools and Information
IQI rates can be calculated using the modified Federal Information Processing Standards (FIPS) Statecounty code A list of codes is available at
httpwwwcensusgovpopestgeographiccodes02pdf
AHRQ provides a free on-line query system based on HCUP data that provides access to health statistics and information on hospital stays at the national regional and State level It is available at
httphcupahrqgovHCUPnetasp
Information on the 3Mtrade APR-DRG system is available at
httpwww3mcomushealthcarehisproductscodingrefined_drgjhtml
Inpatient Quality Indicators (IQI) Software Instruction SAS
Inpatient Quality Indicators (IQI) 46 Version 43 (August 2011)
Appendix B Using Different Types of QI Rates When should you use the observed expected risk adjusted andor smoothed rates generated
by the AHRQ QI software Here are some guidelines If the userrsquos primary interest is to identify cases for further follow-up and quality
improvement then the observed rate would help to identify them The observed rate is the raw rate generated by the QI software from the data the user provided Areas for improvement can be identified by the magnitude of the observed rate compared to available benchmarks andor by the number of patients impacted
Additional breakdowns by the default patient characteristics used in stratified rates (eg age gender or payer) can further identify the target population Target populations can also be identified by user-defined patient characteristics supplemented to the casedischarge level flags Trend data can be used to measure change in the rate over time
Another approach to identify areas to focus on is to compare the observed and expected rates The expected rate is the rate the provider would have if it performed the same as the reference population given the providerrsquos actual case-mix (eg age gender DRG and comorbidity categories)
If the observed rate is higher than the expected rate (ie the ratio of observedexpected is greater than 10 or observed minus expected is positive) then the implication is that the provider performed worse than the reference population for that particular indicator Users may want to focus on these indicators for quality improvement
If the observed rate is lower than the expected rate (ie the ratio of observedexpected is less than 10 or observed minus expected is negative) then the implication is that the provider performed better than the reference population Users may want to focus on these indicators for identifying best practices
Users can also compare the expected rate to the reference population rate reported in the AHRQ QI software or Comparative Data document to determine how their case-mix compares to the reference population The population rate refers to the overall rate for the reference population The reference population is defined in the Comparative Data Document If the population rate is higher than the expected rate then the providerrsquos case-mix is less severe than the reference population If the population rate is lower than the expected rate then the providerrsquos case-mix is more severe than the reference population
We use this difference between the population rate and the expected rate to ldquoadjustrdquo the observed rate to account for the difference between the case-mix of the reference population and the providerrsquos case-mix which is the providerrsquos risk-adjusted rate
If the provider has a less severe case-mix then the adjustment is positive (population rate gt expected rate) and the risk-adjusted rate is higher than the observed rate If the provider has a more severe case-mix then the adjustment is negative (population rate lt expected rate) and the risk-adjusted rate is lower than the observed rate The risk-adjusted rate is the rate the provider would have if it had the same case-mix as the reference population given the providerrsquos actual performance
Finally users can compare the risk-adjusted rate to the smoothed or ldquoreliability-adjustedrdquo rate to determine whether this difference between the risk-adjusted rate and reference population rate is likely to remain in the next measurement period Smoothed rates are weighted averages of the population rate and the risk-adjusted rate where the weight reflects the reliability of the providerrsquos risk-adjusted rate
Inpatient Quality Indicators (IQI) Software Instruction SAS
Inpatient Quality Indicators (IQI) 47 Version 43 (August 2011)
A ratio of (smoothed rate - population rate) (risk-adjusted rate - population rate) greater than 080 suggests that the difference is likely to persist (whether the difference is positive or negative) A ratio less than 080 suggests that the difference may be due in part to random differences in patient characteristics (patient characteristics that are not observed and controlled for in the risk-adjustment model) In general users may want to focus on areas where the differences are more likely to persist
Inpatient Quality Indicators (IQI) Software Instruction SAS
Inpatient Quality Indicators (IQI) 48 Version 43 (August 2011)
Appendix C IQI Input Data Dictionary Variable name Description Format Value description Comments
KEY Sequence number Unique case identifier Numeric
User defined unique numeric identifier for each discharge record
Not used by the QI programs but should be present to facilitate possible exploration allows user to link the records from the IQSAS1SAS program output file back to the original input data file
AGE Age in years at admission Numeric Age in years
If this data element is missing the discharge record will be excluded from analysis
AGEDAY Age in days (coded only when the age in years is less than 1) Numeric Age in days
Not used in the IQI program If not present in the input data file it is not necessary to create a dummy variable for this module
RACE Race of patient Numeric 1 2 3 4 5 6
White Black Hispanic Asian or Pacific Island Native American Other
The values of 1-5 are used directly in the QI software All other ethnicity codes are mapped to an lsquootherrsquo category
SEX Sex of patient Numeric
1 2
Male Female
If this data element is missing the discharge record will be excluded from the analysis
PAY1 Expected primary payer
Numeric 1 2 3 4 5 6
Medicare Medicaid Private incl HMO Self-pay No charge Other
The values of 1 2 3 and 4 are used directly in the QI software All other payer codes are mapped to an lsquootherrsquo category This data element is used to stratify only the Provider-level IQI (IQI-01 toIQI-25 IQI-30 to IQI-34)
PAY2 (SAS Only)
Expected secondary payer
Numeric 1 2 3 4 5 6
Medicare Medicaid Private incl HMO Self-pay No charge Other
Use is optional but must be present in data (set to missing if data element not available)
PSTCO
Location of patient residence or hospital location (FIPSdagger Statecounty code)
Numeric ssccc
Modified Federal Information Processing Standards Statecounty code2
See Appendix A for link to most recent list of codes If this data element is missing the discharge record will be excluded from rate calculations
HOSPID Data Source hospital number Numeric Hospital
identification number Used to facilitate data exploration and possible trouble shooting
2 Federal Information Processing Standard as defined by the US Department of Commerce National Institute of Standards and Technology (formerly National Bureau of Standards) Note Certain independent cities (Baltimore City Carson City and St Louis City) and areas within Hawaii and Virginia are assigned to different area groupings in the Modified FIPS categories as compared to the US Census Bureau groupings The AHRQ QI software uses the Modified FIPS code assignment of these areas Failure to use the Modified FIPS codes assignment will result in the use of incorrect denominator estimates for area indicators A list is available at httpwwwcensusgovpopestgeographiccodes02pdf
Inpatient Quality Indicators (IQI) Software Instruction SAS
Inpatient Quality Indicators (IQI) 49 Version 43 (August 2011)
Variable name Description Format Value description Comments
DISP Disposition of patient
Numeric 1 2 3 4 5 6 7 20
Routine Short-term hospital Skilled nursing facility Intermediate care Another type of facility Home health care Against medical advice Died in the hospital
The values 2 and 20 are referenced by the QI code (to identify transfers to another short-term hospital and patients who died in the hospital)
MORT30 (SAS Only)
30-Day Mortality Indicator Numeric
0 ndash not died within 30-days from admission
Use is optional but must be present in data (set to missing if data element not available)
1 ndash died within 30-days from admission
DNR Do Not Resuscitate Indicator Numeric
0 ndash No ldquoDo Not Resuscitaterdquo Indicator
Use is optional but must be present in data (set to missing if data element not available)
1 ndash ldquoDo Not Resuscitaterdquo Indicator
ATYPE Admission Type Numeric 1 2 3 4 5 6
Emergency Urgent Elective Newborn Trauma Center3 Other
Not used by the IQI program If not present in the input data file it is not necessary to create a dummy variable
ASOURCE Admission Source
Numeric 1 2 3 4 5
ER Another hospital Another facility including LTC Courtlaw enforcement Routinebirthother
The value 2 is referenced by the QI code (to identify transfers from another short-term hospital)
LOS Length of Stay Numeric Number of days from admission to discharge
Not used by the IQI program If not present in the input data file it is not necessary to create a dummy variable
APR_DRG APR-DRG category Numeric APR-DRG from 3Mreg software
Although the IQI module will operate without these variables users should run APR-DRG software on their raw data to assign this variable to each case See Section 53 on page 15
APRDRG_ RISK_ MORTALITY
APR-DRG Mortality Score Numeric
APR-DRG Risk of Mortality Score from 3Mreg software
See Section 53 on page 15
XPRDRG_ RISK_ MORTALITY
APR-DRG Mortality Score with POA Numeric
APR-DRG Risk of Mortality Score from 3Mreg Software using
See Section 53 on page 15
3 The ATYPE value ldquo5rdquo was used to indicate delivery only in the 1988 to 1997 HCUP data files The UB standards currently use ldquo5rdquo to indicate Trauma Center
Inpatient Quality Indicators (IQI) Software Instruction SAS
Inpatient Quality Indicators (IQI) 50 Version 43 (August 2011)
Variable name Description Format Value description Comments
POA information
DRG Diagnosis Related Group Numeric DRG from federal (CMS) DRG Grouper
DRGVER Diagnosis Related Group Version Numeric
DRG Version of federal (CMS) DRG Grouper
eg Version 28 for FY2011
MDC Major Diagnostic Category Numeric MDC from federal (CMS) DRG grouper
DISCWT Weight to assign to discharge Numeric Format as nnnnn
Cases with missing values are assigned a value of 1 Assigning a weight of zero has the effect of removing the case from the analysis
DX1 ndash DX30
ICD-9-CM diagnosis codes DX1 is the principal diagnosis DX2-DX30 are secondary diagnoses
String 3 4 or 5
characters (do not include decimal point)
Diagnosis codes Users must specify the number of diagnoses in the parameter ampNDX in CONTROL_IQISAS program
DXPOA1- DXPOA30-
Present on admission indicator for each diagnosis code
String
1 = present at the time of inpatient admission
These data will be used in risk adjustment and smoothing if the alternative parameter files of risk-adjustment covariates and population rates is specified
(YWE1)
0 = not present at the time of inpatient admission
(NUrsquo0rsquo )
NDX Count of the number of diagnoses (DX) on the discharge record
Numeric
Count of diagnoses (principal and all secondary diagnoses)
Not used by the IQI SAS program If not present in the input data file it is not necessary to create a dummy variable Definition is If the 1st discharge record has 1 Pr and the 2nd has 2 NPR would be 1 for the 1st record and 2 for the 2nd
PR1 ndash PR30
ICD-9-CM procedure codes PR1 is the principal procedure PR2-PR30 are secondary procedures
String 3 or 4
characters (do not include decimal point)
Procedure code
Users with more or fewer secondary procedures should modify the parameter ampNPR in CONTROL_IQISAS to reflect the number of diagnoses
NPR Count of the number of procedures (PR) on the discharge record
Numeric
Count of procedures (principal and all secondary procedures)
Not used by the IQI SAS program If not present in the input data file it is not necessary to create a dummy variable Definition is If the 1st discharge record has 1 Pr and the 2nd has 2 NPR would be 1 for the 1st record and 2 for the 2nd
Inpatient Quality Indicators (IQI) Software Instruction SAS
Inpatient Quality Indicators (IQI) 51 Version 43 (August 2011)
Variable name Description Format Value description Comments
POINTOFORIGINUB04
Point of Origin Numeric 4 Transfer from a hospital 5 Transfer from a skilled Nursing Facility (SNF) or Intermediate Care Facility (ICF)
Only these values are used by the QI programs
6 Transfer from another health care facility
IF ATYPE = 4
5 Born inside this hospital
6 Born outside of this hospital
PRDAY1 ndash PRDAY30
Days from admission to procedure PR1 is the principal procedure PR2-PR30 are secondary procedures
Numeric Days from Admission to Procedure4
Not used by the IQI program If not present in the input data file it is not necessary to create a dummy variable for this module
YEAR
Year of discharge The patientrsquos year of discharge For example a patient discharged on July 7 2004 would have a discharge year of lsquo2004rsquo
Numeric
YYYY
Discharge year should be within the range of 1997 to 2011
DQTR Quarter of discharge The calendar quarter of the patientrsquos discharge For example a patient discharged on July 7 2004 would have a discharge quarter of lsquo3rsquo
Numeric 1 January-March 2 April-June 3 July-September 4 October-December
See httphcup-usahrqgovtoolssoftwarecomorbiditycomorbidityjsp
4 Variables PRDAY1 to PRDAY30 are defined as the number of days from date of admission to date of procedure for each procedure For example if the patient was admitted on June 15th and had two procedures - the principal procedure on June 15th and a second procedure on June 18th ndash then the value of PRDAY1 would be zero (0) and the value of PRDAY2 would be three (3) For more information consult the HCUP data documentation at httpwwwhcup-usahrqgovdbvarsprdaynnisnotejsp
Inpatient Quality Indicators (IQI) Software Instruction SAS
Inpatient Quality Indicators (IQI) 52 Version 43 (August 2011)
Appendix D SAS IQI Output Data Dictionary SAS IQI Provider Output Column Heading Description Format Comments
Obs Observation 1 (with HOSPID = ) is the overall average for the entire dataset (TYPELVLP = 0) The remaining observations are individual providers or hospitals (TYPELVLP = 16)
Numeric
HOSPID Identifier for each provider in the dataset
Text Up to 12 characters
AGECAT Age stratification category Numeric range
SEXCAT Gender stratification category Numeric 1 = male 2 = female PAYCAT Payer stratification category Numeric 1 = Medicare
2 = Medicaid 3 = Private incl HMO 4 = Self-pay 5 = No charge 6 = Other
RACECAT Race stratification category Numeric 1 = White 2 = Black 3 = Hispanic 4 = Asian or Pacific Island 5 = Native American 6 = Other
TPIQxx The number of discharge records included in the numerator (outcome of interest) as defined for the indicator
Numeric
PPIQxx The number of discharge records included in the denominator (population at risk) as defined for the indicator
Numeric
OPIQxx The rate (observed numerator observed denominator) as defined for the indicator
Numeric
EPIQxx Rate calculated by assuming an average performance for each patient group based on the reference population but with the providerlsquos actual case-mix
Numeric
RPIQxx The estimated rate calculated by adjusting to an average case-mix
Numeric When stratifications other than hospital or area are selected the RPIQxx variables and their confidence intervals are observedexpected ratios to avoid confounding with risk adjustment variables
LPIQxx The lower confidence bound of the risk adjusted rate
Numeric
UPIQxx The upper confidence bound of the risk adjusted rate
Numeric
Inpatient Quality Indicators (IQI) Software Instruction SAS
Inpatient Quality Indicators (IQI) 53 Version 43 (August 2011)
Column Heading Description Format Comments
SPIQxx The smoothed rate calculated using multivariate signal extraction (MSX)
Numeric
XPIQxx Standard error of smoothed rate Numeric VPIQxx Variance for respective indicators Numeric
SAS IQI Area Output Column Heading Description Format Comments
Obs Observation 1 (with HOSPID = ) is the overall average for the entire dataset (TYPELVLP = 0) The remaining observations are individual providers or hospitals (TYPELVLP = 16)
Numeric
AREA Identifier in the dataset for area Text TAIQxx The number of discharge records
included in the numerator (outcome of interest) as defined for the indicator
Numeric
PAIQxx The number of discharge records included in the denominator (population at risk) as defined for the indicator
Numeric
OAIQxx The rate (observed numerator observed denominator) as defined for the indicator
Numeric
RAIQxx The estimated rate calculated by adjusting to an average case-mix
Numeric When stratifications other than hospital or area are selected the RAIQxx variables and their confidence intervals are observedexpected ratios to avoid confounding with risk adjustment variables
SAIQxx The smoothed rate calculated using multivariate signal extraction (MSX)
Numeric

Inpatient Quality Indicators (IQI) Software Instruction SAS
Inpatient Quality Indicators (IQI) 42 Version 43 (August 2011)
100 Benchmark Timings The benchmark runtimes given below are from runs made on a Windows XP workstation
with a Pentium 4 CPU 280 GHz processor 512 MB of RAM and an IDE hard drive The dataset used contained 757624 observations with 15 diagnosis fields and 15 procedure fields
Step Run time (in seconds) Run IQFMTS to create the format library 2 Run IQSAS1 157 Run IQSASP2 21 Run IQSASP3 86 Run IQSASA2 10 Run IQSASA3 185
101 User Support Technical assistance is available through an electronic user support system monitored by the
QI support team to support users in their application of the IQI software The same e-mail address may be used to communicate to AHRQ any suggestions for IQI enhancements general questions and any QI related comments you may have AHRQ welcomes your feedback
The Internet address for user support and feedback is supportqualityindicatorsahrqgov AHRQ also offers a listserv to keep you informed on the Quality Indicators (QIs) The
listserv is used to announce any QI changes or updates new tools and resources and to distribute other QI related information This is a free service Simply follow the process described below to begin receiving important QI information All you need is a computer Internet access and an E-mail address It works just like other electronic distribution lists
Herersquos how to register 1 Send an E-mail message to listservqualityindicatorsahrqgov 2 On the subject line type Subscribe For example Subscribe
3 In the body of the message type sub Quality_Indicators-L and your full name For example sub Quality_Indicators-L John Doe
4 You will receive a message confirming that you are signed up If you have any questions contact AHRQ QI Support at the e-mail noted above You should
receive an automatic response e-mail message confirming receipt of your e-mail If you do not receive a confirmation message call (888) 512-6090
Inpatient Quality Indicators (IQI) Software Instruction SAS
Inpatient Quality Indicators (IQI) 43 Version 43 (August 2011)
Appendix A Links The following links may be helpful to users of the AHRQ Inpatient Quality Indicators
Inpatient Quality Indicators Version 43 Documents and Software Available at httpwwwqualityindicatorsahrqgovmodulesiqi_resourcesaspx and httpwwwqualityindicatorsahrqgovsoftwaredefaultaspx
Title Description
IQI User Guide Individual Measures
The user guide provides a technical overview of the IQI individual measures including literature and empirical evidence
IQI User Guide Composite Measures
The user guide provides a technical overview of the IQI composite measures
IQI Technical Specifications
Provides detailed definitions of each IQI including all ICD-9-CM and DRG codes that are included in or excluded from the numerator and denominator Note that exclusions from the denominator are automatically applied to the numerator
IQI Comparative Data This document provides the average volume provider rate and population rate as appropriate for each indicator
Fiscal year 2011 Coding Changes
This document summarizes the changes to the indicator definitions resulting from FY 2011 changes to ICD-9-CM coding and DRG changes These changes will only affect data from FY 2011 (October 1 2011) or later
Log of Changes to IQI Documents and Software
The Change Log document provides a cumulative summary of all changes to the IQI software software documentation and other documents made since the release of version 21 of the software in March 2003 Changes to indicator specifications that were not a result of new ICD-9-CM and DRG codes are also described in the Change Log
IQI Risk Adjustment Coefficient Tables
Tables for each IQI provide the stratification and coefficients used to calculate the risk-adjusted rate for each strata
SASreg IQI Software Documentation
This software documentation provides detailed instructions on how to use the SAS reg version of the IQI software including data preparation calculation of the IQI rates and interpretation of output
SASreg IQI Software Requires the SASreg statistical program distributed by the SAS Institute Inc The company may be contacted directly regarding the licensing of its products httpwwwsascom
3Mreg APRreg DRG Limited License Grouper for SASreg
Creates APR-DRG variables for use with SAS version of IQI software Instructions for running the software are included in the Zip file
Version 43 Listserv announcement
This document announces the release of the Version 43 software and documentation provides a summary of changes and links to relevant pages
Inpatient Quality Indicators (IQI) Software Instruction SAS
Inpatient Quality Indicators (IQI) 44 Version 43 (August 2011)
AHRQ QI Windows Application The AHRQ QI Windows Application calculates rates for all of the AHRQ Quality Indicators modules and does not require SASreg It is available at
httpwwwqualityindicatorsahrqgovwinqi_downloadhtm Additional Documents The following documents are available within the Archive section of the AHRQ QI Web page
httpwwwqualityindicatorsahrqgovArchivedefaultaspxiqi
bull Refinement of the HCUP Quality Indicators (Technical Review) May 2001 bull Refinement of the HCUP Quality Indicators (Summary) May 2001
In addition these documents may be accessed at the AHRQ QI Modules Web page
httpwwwqualityindicatorsahrqgovmodulesDefaultaspx bull AHRQ QI Measure Development Implementation Maintenance and Retirement bull ICD-9-CM to ICD-10-CMPCS Conversion of AHRQ QI March 2011 bull AHRQ QI Empirical Methods May 2011 bull Guidance for Using the AHRQ Quality Indicators for Hospital-level Public Reporting
or Payment August 2004 bull AHRQ Summary Statement on Comparative Hospital Public Reporting December
2005 bull Appendix A Current Uses of AHRQ Quality Indicators and Considerations for
Hospital-level bull Comparison of Recommended Evaluation Criteria in Five Existing National
Frameworks bull List of AHRQ QI Endorsed by the National Quality Forum
The following documents can be viewed or downloaded from the AHRQ QI News Web page
httpwwwqualityindicatorsahrqgovnewsdefaultaspx and httpwwwqualityindicatorsahrqgovArchiveNewsaspx bull February 2007 Newsletter - Year highlights and future plans bull February 2006 Newsletter ndash Year highlights and future plans bull 2006 Area Level Indicator Changes bull Considerations in Public Reporting for the AHRQ QI bull June 2005 Newsletter - Contains the article Using Different Types of QI Rates
Inpatient Quality Indicators (IQI) Software Instruction SAS
Inpatient Quality Indicators (IQI) 45 Version 43 (August 2011)
Other Tools and Information
IQI rates can be calculated using the modified Federal Information Processing Standards (FIPS) Statecounty code A list of codes is available at
httpwwwcensusgovpopestgeographiccodes02pdf
AHRQ provides a free on-line query system based on HCUP data that provides access to health statistics and information on hospital stays at the national regional and State level It is available at
httphcupahrqgovHCUPnetasp
Information on the 3Mtrade APR-DRG system is available at
httpwww3mcomushealthcarehisproductscodingrefined_drgjhtml
Inpatient Quality Indicators (IQI) Software Instruction SAS
Inpatient Quality Indicators (IQI) 46 Version 43 (August 2011)
Appendix B Using Different Types of QI Rates When should you use the observed expected risk adjusted andor smoothed rates generated
by the AHRQ QI software Here are some guidelines If the userrsquos primary interest is to identify cases for further follow-up and quality
improvement then the observed rate would help to identify them The observed rate is the raw rate generated by the QI software from the data the user provided Areas for improvement can be identified by the magnitude of the observed rate compared to available benchmarks andor by the number of patients impacted
Additional breakdowns by the default patient characteristics used in stratified rates (eg age gender or payer) can further identify the target population Target populations can also be identified by user-defined patient characteristics supplemented to the casedischarge level flags Trend data can be used to measure change in the rate over time
Another approach to identify areas to focus on is to compare the observed and expected rates The expected rate is the rate the provider would have if it performed the same as the reference population given the providerrsquos actual case-mix (eg age gender DRG and comorbidity categories)
If the observed rate is higher than the expected rate (ie the ratio of observedexpected is greater than 10 or observed minus expected is positive) then the implication is that the provider performed worse than the reference population for that particular indicator Users may want to focus on these indicators for quality improvement
If the observed rate is lower than the expected rate (ie the ratio of observedexpected is less than 10 or observed minus expected is negative) then the implication is that the provider performed better than the reference population Users may want to focus on these indicators for identifying best practices
Users can also compare the expected rate to the reference population rate reported in the AHRQ QI software or Comparative Data document to determine how their case-mix compares to the reference population The population rate refers to the overall rate for the reference population The reference population is defined in the Comparative Data Document If the population rate is higher than the expected rate then the providerrsquos case-mix is less severe than the reference population If the population rate is lower than the expected rate then the providerrsquos case-mix is more severe than the reference population
We use this difference between the population rate and the expected rate to ldquoadjustrdquo the observed rate to account for the difference between the case-mix of the reference population and the providerrsquos case-mix which is the providerrsquos risk-adjusted rate
If the provider has a less severe case-mix then the adjustment is positive (population rate gt expected rate) and the risk-adjusted rate is higher than the observed rate If the provider has a more severe case-mix then the adjustment is negative (population rate lt expected rate) and the risk-adjusted rate is lower than the observed rate The risk-adjusted rate is the rate the provider would have if it had the same case-mix as the reference population given the providerrsquos actual performance
Finally users can compare the risk-adjusted rate to the smoothed or ldquoreliability-adjustedrdquo rate to determine whether this difference between the risk-adjusted rate and reference population rate is likely to remain in the next measurement period Smoothed rates are weighted averages of the population rate and the risk-adjusted rate where the weight reflects the reliability of the providerrsquos risk-adjusted rate
Inpatient Quality Indicators (IQI) Software Instruction SAS
Inpatient Quality Indicators (IQI) 47 Version 43 (August 2011)
A ratio of (smoothed rate - population rate) (risk-adjusted rate - population rate) greater than 080 suggests that the difference is likely to persist (whether the difference is positive or negative) A ratio less than 080 suggests that the difference may be due in part to random differences in patient characteristics (patient characteristics that are not observed and controlled for in the risk-adjustment model) In general users may want to focus on areas where the differences are more likely to persist
Inpatient Quality Indicators (IQI) Software Instruction SAS
Inpatient Quality Indicators (IQI) 48 Version 43 (August 2011)
Appendix C IQI Input Data Dictionary Variable name Description Format Value description Comments
KEY Sequence number Unique case identifier Numeric
User defined unique numeric identifier for each discharge record
Not used by the QI programs but should be present to facilitate possible exploration allows user to link the records from the IQSAS1SAS program output file back to the original input data file
AGE Age in years at admission Numeric Age in years
If this data element is missing the discharge record will be excluded from analysis
AGEDAY Age in days (coded only when the age in years is less than 1) Numeric Age in days
Not used in the IQI program If not present in the input data file it is not necessary to create a dummy variable for this module
RACE Race of patient Numeric 1 2 3 4 5 6
White Black Hispanic Asian or Pacific Island Native American Other
The values of 1-5 are used directly in the QI software All other ethnicity codes are mapped to an lsquootherrsquo category
SEX Sex of patient Numeric
1 2
Male Female
If this data element is missing the discharge record will be excluded from the analysis
PAY1 Expected primary payer
Numeric 1 2 3 4 5 6
Medicare Medicaid Private incl HMO Self-pay No charge Other
The values of 1 2 3 and 4 are used directly in the QI software All other payer codes are mapped to an lsquootherrsquo category This data element is used to stratify only the Provider-level IQI (IQI-01 toIQI-25 IQI-30 to IQI-34)
PAY2 (SAS Only)
Expected secondary payer
Numeric 1 2 3 4 5 6
Medicare Medicaid Private incl HMO Self-pay No charge Other
Use is optional but must be present in data (set to missing if data element not available)
PSTCO
Location of patient residence or hospital location (FIPSdagger Statecounty code)
Numeric ssccc
Modified Federal Information Processing Standards Statecounty code2
See Appendix A for link to most recent list of codes If this data element is missing the discharge record will be excluded from rate calculations
HOSPID Data Source hospital number Numeric Hospital
identification number Used to facilitate data exploration and possible trouble shooting
2 Federal Information Processing Standard as defined by the US Department of Commerce National Institute of Standards and Technology (formerly National Bureau of Standards) Note Certain independent cities (Baltimore City Carson City and St Louis City) and areas within Hawaii and Virginia are assigned to different area groupings in the Modified FIPS categories as compared to the US Census Bureau groupings The AHRQ QI software uses the Modified FIPS code assignment of these areas Failure to use the Modified FIPS codes assignment will result in the use of incorrect denominator estimates for area indicators A list is available at httpwwwcensusgovpopestgeographiccodes02pdf
Inpatient Quality Indicators (IQI) Software Instruction SAS
Inpatient Quality Indicators (IQI) 49 Version 43 (August 2011)
Variable name Description Format Value description Comments
DISP Disposition of patient
Numeric 1 2 3 4 5 6 7 20
Routine Short-term hospital Skilled nursing facility Intermediate care Another type of facility Home health care Against medical advice Died in the hospital
The values 2 and 20 are referenced by the QI code (to identify transfers to another short-term hospital and patients who died in the hospital)
MORT30 (SAS Only)
30-Day Mortality Indicator Numeric
0 ndash not died within 30-days from admission
Use is optional but must be present in data (set to missing if data element not available)
1 ndash died within 30-days from admission
DNR Do Not Resuscitate Indicator Numeric
0 ndash No ldquoDo Not Resuscitaterdquo Indicator
Use is optional but must be present in data (set to missing if data element not available)
1 ndash ldquoDo Not Resuscitaterdquo Indicator
ATYPE Admission Type Numeric 1 2 3 4 5 6
Emergency Urgent Elective Newborn Trauma Center3 Other
Not used by the IQI program If not present in the input data file it is not necessary to create a dummy variable
ASOURCE Admission Source
Numeric 1 2 3 4 5
ER Another hospital Another facility including LTC Courtlaw enforcement Routinebirthother
The value 2 is referenced by the QI code (to identify transfers from another short-term hospital)
LOS Length of Stay Numeric Number of days from admission to discharge
Not used by the IQI program If not present in the input data file it is not necessary to create a dummy variable
APR_DRG APR-DRG category Numeric APR-DRG from 3Mreg software
Although the IQI module will operate without these variables users should run APR-DRG software on their raw data to assign this variable to each case See Section 53 on page 15
APRDRG_ RISK_ MORTALITY
APR-DRG Mortality Score Numeric
APR-DRG Risk of Mortality Score from 3Mreg software
See Section 53 on page 15
XPRDRG_ RISK_ MORTALITY
APR-DRG Mortality Score with POA Numeric
APR-DRG Risk of Mortality Score from 3Mreg Software using
See Section 53 on page 15
3 The ATYPE value ldquo5rdquo was used to indicate delivery only in the 1988 to 1997 HCUP data files The UB standards currently use ldquo5rdquo to indicate Trauma Center
Inpatient Quality Indicators (IQI) Software Instruction SAS
Inpatient Quality Indicators (IQI) 50 Version 43 (August 2011)
Variable name Description Format Value description Comments
POA information
DRG Diagnosis Related Group Numeric DRG from federal (CMS) DRG Grouper
DRGVER Diagnosis Related Group Version Numeric
DRG Version of federal (CMS) DRG Grouper
eg Version 28 for FY2011
MDC Major Diagnostic Category Numeric MDC from federal (CMS) DRG grouper
DISCWT Weight to assign to discharge Numeric Format as nnnnn
Cases with missing values are assigned a value of 1 Assigning a weight of zero has the effect of removing the case from the analysis
DX1 ndash DX30
ICD-9-CM diagnosis codes DX1 is the principal diagnosis DX2-DX30 are secondary diagnoses
String 3 4 or 5
characters (do not include decimal point)
Diagnosis codes Users must specify the number of diagnoses in the parameter ampNDX in CONTROL_IQISAS program
DXPOA1- DXPOA30-
Present on admission indicator for each diagnosis code
String
1 = present at the time of inpatient admission
These data will be used in risk adjustment and smoothing if the alternative parameter files of risk-adjustment covariates and population rates is specified
(YWE1)
0 = not present at the time of inpatient admission
(NUrsquo0rsquo )
NDX Count of the number of diagnoses (DX) on the discharge record
Numeric
Count of diagnoses (principal and all secondary diagnoses)
Not used by the IQI SAS program If not present in the input data file it is not necessary to create a dummy variable Definition is If the 1st discharge record has 1 Pr and the 2nd has 2 NPR would be 1 for the 1st record and 2 for the 2nd
PR1 ndash PR30
ICD-9-CM procedure codes PR1 is the principal procedure PR2-PR30 are secondary procedures
String 3 or 4
characters (do not include decimal point)
Procedure code
Users with more or fewer secondary procedures should modify the parameter ampNPR in CONTROL_IQISAS to reflect the number of diagnoses
NPR Count of the number of procedures (PR) on the discharge record
Numeric
Count of procedures (principal and all secondary procedures)
Not used by the IQI SAS program If not present in the input data file it is not necessary to create a dummy variable Definition is If the 1st discharge record has 1 Pr and the 2nd has 2 NPR would be 1 for the 1st record and 2 for the 2nd
Inpatient Quality Indicators (IQI) Software Instruction SAS
Inpatient Quality Indicators (IQI) 51 Version 43 (August 2011)
Variable name Description Format Value description Comments
POINTOFORIGINUB04
Point of Origin Numeric 4 Transfer from a hospital 5 Transfer from a skilled Nursing Facility (SNF) or Intermediate Care Facility (ICF)
Only these values are used by the QI programs
6 Transfer from another health care facility
IF ATYPE = 4
5 Born inside this hospital
6 Born outside of this hospital
PRDAY1 ndash PRDAY30
Days from admission to procedure PR1 is the principal procedure PR2-PR30 are secondary procedures
Numeric Days from Admission to Procedure4
Not used by the IQI program If not present in the input data file it is not necessary to create a dummy variable for this module
YEAR
Year of discharge The patientrsquos year of discharge For example a patient discharged on July 7 2004 would have a discharge year of lsquo2004rsquo
Numeric
YYYY
Discharge year should be within the range of 1997 to 2011
DQTR Quarter of discharge The calendar quarter of the patientrsquos discharge For example a patient discharged on July 7 2004 would have a discharge quarter of lsquo3rsquo
Numeric 1 January-March 2 April-June 3 July-September 4 October-December
See httphcup-usahrqgovtoolssoftwarecomorbiditycomorbidityjsp
4 Variables PRDAY1 to PRDAY30 are defined as the number of days from date of admission to date of procedure for each procedure For example if the patient was admitted on June 15th and had two procedures - the principal procedure on June 15th and a second procedure on June 18th ndash then the value of PRDAY1 would be zero (0) and the value of PRDAY2 would be three (3) For more information consult the HCUP data documentation at httpwwwhcup-usahrqgovdbvarsprdaynnisnotejsp
Inpatient Quality Indicators (IQI) Software Instruction SAS
Inpatient Quality Indicators (IQI) 52 Version 43 (August 2011)
Appendix D SAS IQI Output Data Dictionary SAS IQI Provider Output Column Heading Description Format Comments
Obs Observation 1 (with HOSPID = ) is the overall average for the entire dataset (TYPELVLP = 0) The remaining observations are individual providers or hospitals (TYPELVLP = 16)
Numeric
HOSPID Identifier for each provider in the dataset
Text Up to 12 characters
AGECAT Age stratification category Numeric range
SEXCAT Gender stratification category Numeric 1 = male 2 = female PAYCAT Payer stratification category Numeric 1 = Medicare
2 = Medicaid 3 = Private incl HMO 4 = Self-pay 5 = No charge 6 = Other
RACECAT Race stratification category Numeric 1 = White 2 = Black 3 = Hispanic 4 = Asian or Pacific Island 5 = Native American 6 = Other
TPIQxx The number of discharge records included in the numerator (outcome of interest) as defined for the indicator
Numeric
PPIQxx The number of discharge records included in the denominator (population at risk) as defined for the indicator
Numeric
OPIQxx The rate (observed numerator observed denominator) as defined for the indicator
Numeric
EPIQxx Rate calculated by assuming an average performance for each patient group based on the reference population but with the providerlsquos actual case-mix
Numeric
RPIQxx The estimated rate calculated by adjusting to an average case-mix
Numeric When stratifications other than hospital or area are selected the RPIQxx variables and their confidence intervals are observedexpected ratios to avoid confounding with risk adjustment variables
LPIQxx The lower confidence bound of the risk adjusted rate
Numeric
UPIQxx The upper confidence bound of the risk adjusted rate
Numeric
Inpatient Quality Indicators (IQI) Software Instruction SAS
Inpatient Quality Indicators (IQI) 53 Version 43 (August 2011)
Column Heading Description Format Comments
SPIQxx The smoothed rate calculated using multivariate signal extraction (MSX)
Numeric
XPIQxx Standard error of smoothed rate Numeric VPIQxx Variance for respective indicators Numeric
SAS IQI Area Output Column Heading Description Format Comments
Obs Observation 1 (with HOSPID = ) is the overall average for the entire dataset (TYPELVLP = 0) The remaining observations are individual providers or hospitals (TYPELVLP = 16)
Numeric
AREA Identifier in the dataset for area Text TAIQxx The number of discharge records
included in the numerator (outcome of interest) as defined for the indicator
Numeric
PAIQxx The number of discharge records included in the denominator (population at risk) as defined for the indicator
Numeric
OAIQxx The rate (observed numerator observed denominator) as defined for the indicator
Numeric
RAIQxx The estimated rate calculated by adjusting to an average case-mix
Numeric When stratifications other than hospital or area are selected the RAIQxx variables and their confidence intervals are observedexpected ratios to avoid confounding with risk adjustment variables
SAIQxx The smoothed rate calculated using multivariate signal extraction (MSX)
Numeric
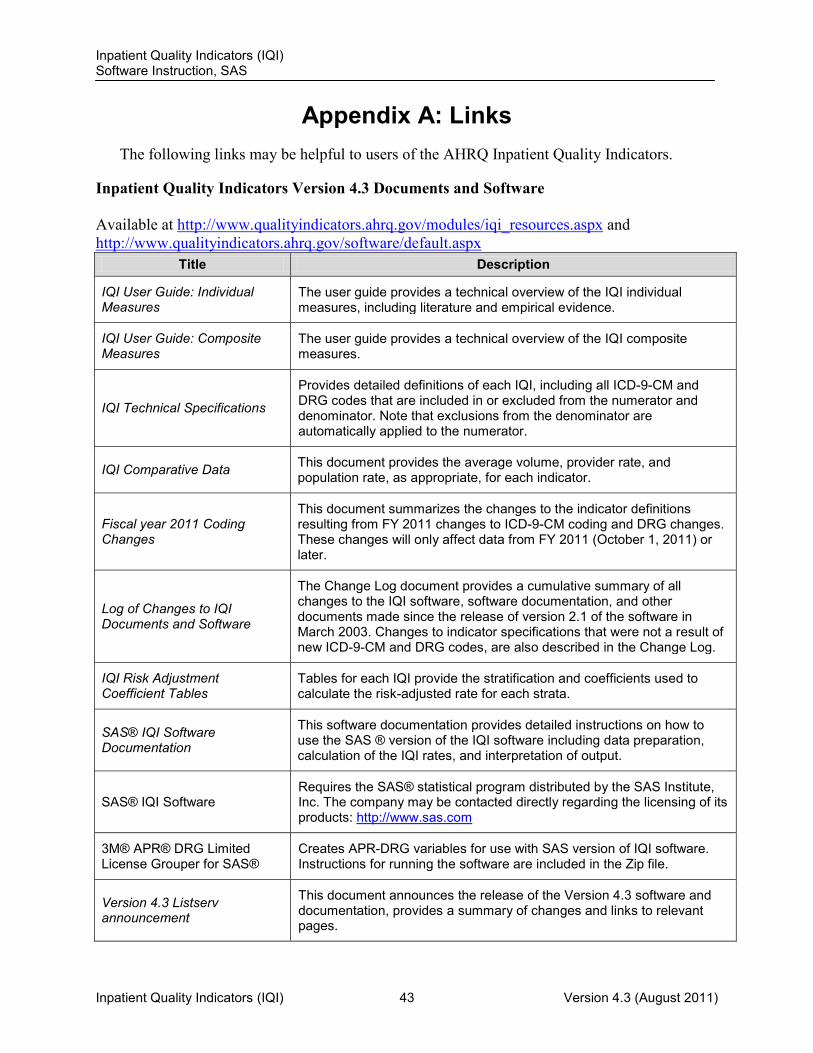
Inpatient Quality Indicators (IQI) Software Instruction SAS
Inpatient Quality Indicators (IQI) 44 Version 43 (August 2011)
AHRQ QI Windows Application The AHRQ QI Windows Application calculates rates for all of the AHRQ Quality Indicators modules and does not require SASreg It is available at
httpwwwqualityindicatorsahrqgovwinqi_downloadhtm Additional Documents The following documents are available within the Archive section of the AHRQ QI Web page
httpwwwqualityindicatorsahrqgovArchivedefaultaspxiqi
bull Refinement of the HCUP Quality Indicators (Technical Review) May 2001 bull Refinement of the HCUP Quality Indicators (Summary) May 2001
In addition these documents may be accessed at the AHRQ QI Modules Web page
httpwwwqualityindicatorsahrqgovmodulesDefaultaspx bull AHRQ QI Measure Development Implementation Maintenance and Retirement bull ICD-9-CM to ICD-10-CMPCS Conversion of AHRQ QI March 2011 bull AHRQ QI Empirical Methods May 2011 bull Guidance for Using the AHRQ Quality Indicators for Hospital-level Public Reporting
or Payment August 2004 bull AHRQ Summary Statement on Comparative Hospital Public Reporting December
2005 bull Appendix A Current Uses of AHRQ Quality Indicators and Considerations for
Hospital-level bull Comparison of Recommended Evaluation Criteria in Five Existing National
Frameworks bull List of AHRQ QI Endorsed by the National Quality Forum
The following documents can be viewed or downloaded from the AHRQ QI News Web page
httpwwwqualityindicatorsahrqgovnewsdefaultaspx and httpwwwqualityindicatorsahrqgovArchiveNewsaspx bull February 2007 Newsletter - Year highlights and future plans bull February 2006 Newsletter ndash Year highlights and future plans bull 2006 Area Level Indicator Changes bull Considerations in Public Reporting for the AHRQ QI bull June 2005 Newsletter - Contains the article Using Different Types of QI Rates
Inpatient Quality Indicators (IQI) Software Instruction SAS
Inpatient Quality Indicators (IQI) 45 Version 43 (August 2011)
Other Tools and Information
IQI rates can be calculated using the modified Federal Information Processing Standards (FIPS) Statecounty code A list of codes is available at
httpwwwcensusgovpopestgeographiccodes02pdf
AHRQ provides a free on-line query system based on HCUP data that provides access to health statistics and information on hospital stays at the national regional and State level It is available at
httphcupahrqgovHCUPnetasp
Information on the 3Mtrade APR-DRG system is available at
httpwww3mcomushealthcarehisproductscodingrefined_drgjhtml
Inpatient Quality Indicators (IQI) Software Instruction SAS
Inpatient Quality Indicators (IQI) 46 Version 43 (August 2011)
Appendix B Using Different Types of QI Rates When should you use the observed expected risk adjusted andor smoothed rates generated
by the AHRQ QI software Here are some guidelines If the userrsquos primary interest is to identify cases for further follow-up and quality
improvement then the observed rate would help to identify them The observed rate is the raw rate generated by the QI software from the data the user provided Areas for improvement can be identified by the magnitude of the observed rate compared to available benchmarks andor by the number of patients impacted
Additional breakdowns by the default patient characteristics used in stratified rates (eg age gender or payer) can further identify the target population Target populations can also be identified by user-defined patient characteristics supplemented to the casedischarge level flags Trend data can be used to measure change in the rate over time
Another approach to identify areas to focus on is to compare the observed and expected rates The expected rate is the rate the provider would have if it performed the same as the reference population given the providerrsquos actual case-mix (eg age gender DRG and comorbidity categories)
If the observed rate is higher than the expected rate (ie the ratio of observedexpected is greater than 10 or observed minus expected is positive) then the implication is that the provider performed worse than the reference population for that particular indicator Users may want to focus on these indicators for quality improvement
If the observed rate is lower than the expected rate (ie the ratio of observedexpected is less than 10 or observed minus expected is negative) then the implication is that the provider performed better than the reference population Users may want to focus on these indicators for identifying best practices
Users can also compare the expected rate to the reference population rate reported in the AHRQ QI software or Comparative Data document to determine how their case-mix compares to the reference population The population rate refers to the overall rate for the reference population The reference population is defined in the Comparative Data Document If the population rate is higher than the expected rate then the providerrsquos case-mix is less severe than the reference population If the population rate is lower than the expected rate then the providerrsquos case-mix is more severe than the reference population
We use this difference between the population rate and the expected rate to ldquoadjustrdquo the observed rate to account for the difference between the case-mix of the reference population and the providerrsquos case-mix which is the providerrsquos risk-adjusted rate
If the provider has a less severe case-mix then the adjustment is positive (population rate gt expected rate) and the risk-adjusted rate is higher than the observed rate If the provider has a more severe case-mix then the adjustment is negative (population rate lt expected rate) and the risk-adjusted rate is lower than the observed rate The risk-adjusted rate is the rate the provider would have if it had the same case-mix as the reference population given the providerrsquos actual performance
Finally users can compare the risk-adjusted rate to the smoothed or ldquoreliability-adjustedrdquo rate to determine whether this difference between the risk-adjusted rate and reference population rate is likely to remain in the next measurement period Smoothed rates are weighted averages of the population rate and the risk-adjusted rate where the weight reflects the reliability of the providerrsquos risk-adjusted rate
Inpatient Quality Indicators (IQI) Software Instruction SAS
Inpatient Quality Indicators (IQI) 47 Version 43 (August 2011)
A ratio of (smoothed rate - population rate) (risk-adjusted rate - population rate) greater than 080 suggests that the difference is likely to persist (whether the difference is positive or negative) A ratio less than 080 suggests that the difference may be due in part to random differences in patient characteristics (patient characteristics that are not observed and controlled for in the risk-adjustment model) In general users may want to focus on areas where the differences are more likely to persist
Inpatient Quality Indicators (IQI) Software Instruction SAS
Inpatient Quality Indicators (IQI) 48 Version 43 (August 2011)
Appendix C IQI Input Data Dictionary Variable name Description Format Value description Comments
KEY Sequence number Unique case identifier Numeric
User defined unique numeric identifier for each discharge record
Not used by the QI programs but should be present to facilitate possible exploration allows user to link the records from the IQSAS1SAS program output file back to the original input data file
AGE Age in years at admission Numeric Age in years
If this data element is missing the discharge record will be excluded from analysis
AGEDAY Age in days (coded only when the age in years is less than 1) Numeric Age in days
Not used in the IQI program If not present in the input data file it is not necessary to create a dummy variable for this module
RACE Race of patient Numeric 1 2 3 4 5 6
White Black Hispanic Asian or Pacific Island Native American Other
The values of 1-5 are used directly in the QI software All other ethnicity codes are mapped to an lsquootherrsquo category
SEX Sex of patient Numeric
1 2
Male Female
If this data element is missing the discharge record will be excluded from the analysis
PAY1 Expected primary payer
Numeric 1 2 3 4 5 6
Medicare Medicaid Private incl HMO Self-pay No charge Other
The values of 1 2 3 and 4 are used directly in the QI software All other payer codes are mapped to an lsquootherrsquo category This data element is used to stratify only the Provider-level IQI (IQI-01 toIQI-25 IQI-30 to IQI-34)
PAY2 (SAS Only)
Expected secondary payer
Numeric 1 2 3 4 5 6
Medicare Medicaid Private incl HMO Self-pay No charge Other
Use is optional but must be present in data (set to missing if data element not available)
PSTCO
Location of patient residence or hospital location (FIPSdagger Statecounty code)
Numeric ssccc
Modified Federal Information Processing Standards Statecounty code2
See Appendix A for link to most recent list of codes If this data element is missing the discharge record will be excluded from rate calculations
HOSPID Data Source hospital number Numeric Hospital
identification number Used to facilitate data exploration and possible trouble shooting
2 Federal Information Processing Standard as defined by the US Department of Commerce National Institute of Standards and Technology (formerly National Bureau of Standards) Note Certain independent cities (Baltimore City Carson City and St Louis City) and areas within Hawaii and Virginia are assigned to different area groupings in the Modified FIPS categories as compared to the US Census Bureau groupings The AHRQ QI software uses the Modified FIPS code assignment of these areas Failure to use the Modified FIPS codes assignment will result in the use of incorrect denominator estimates for area indicators A list is available at httpwwwcensusgovpopestgeographiccodes02pdf
Inpatient Quality Indicators (IQI) Software Instruction SAS
Inpatient Quality Indicators (IQI) 49 Version 43 (August 2011)
Variable name Description Format Value description Comments
DISP Disposition of patient
Numeric 1 2 3 4 5 6 7 20
Routine Short-term hospital Skilled nursing facility Intermediate care Another type of facility Home health care Against medical advice Died in the hospital
The values 2 and 20 are referenced by the QI code (to identify transfers to another short-term hospital and patients who died in the hospital)
MORT30 (SAS Only)
30-Day Mortality Indicator Numeric
0 ndash not died within 30-days from admission
Use is optional but must be present in data (set to missing if data element not available)
1 ndash died within 30-days from admission
DNR Do Not Resuscitate Indicator Numeric
0 ndash No ldquoDo Not Resuscitaterdquo Indicator
Use is optional but must be present in data (set to missing if data element not available)
1 ndash ldquoDo Not Resuscitaterdquo Indicator
ATYPE Admission Type Numeric 1 2 3 4 5 6
Emergency Urgent Elective Newborn Trauma Center3 Other
Not used by the IQI program If not present in the input data file it is not necessary to create a dummy variable
ASOURCE Admission Source
Numeric 1 2 3 4 5
ER Another hospital Another facility including LTC Courtlaw enforcement Routinebirthother
The value 2 is referenced by the QI code (to identify transfers from another short-term hospital)
LOS Length of Stay Numeric Number of days from admission to discharge
Not used by the IQI program If not present in the input data file it is not necessary to create a dummy variable
APR_DRG APR-DRG category Numeric APR-DRG from 3Mreg software
Although the IQI module will operate without these variables users should run APR-DRG software on their raw data to assign this variable to each case See Section 53 on page 15
APRDRG_ RISK_ MORTALITY
APR-DRG Mortality Score Numeric
APR-DRG Risk of Mortality Score from 3Mreg software
See Section 53 on page 15
XPRDRG_ RISK_ MORTALITY
APR-DRG Mortality Score with POA Numeric
APR-DRG Risk of Mortality Score from 3Mreg Software using
See Section 53 on page 15
3 The ATYPE value ldquo5rdquo was used to indicate delivery only in the 1988 to 1997 HCUP data files The UB standards currently use ldquo5rdquo to indicate Trauma Center
Inpatient Quality Indicators (IQI) Software Instruction SAS
Inpatient Quality Indicators (IQI) 50 Version 43 (August 2011)
Variable name Description Format Value description Comments
POA information
DRG Diagnosis Related Group Numeric DRG from federal (CMS) DRG Grouper
DRGVER Diagnosis Related Group Version Numeric
DRG Version of federal (CMS) DRG Grouper
eg Version 28 for FY2011
MDC Major Diagnostic Category Numeric MDC from federal (CMS) DRG grouper
DISCWT Weight to assign to discharge Numeric Format as nnnnn
Cases with missing values are assigned a value of 1 Assigning a weight of zero has the effect of removing the case from the analysis
DX1 ndash DX30
ICD-9-CM diagnosis codes DX1 is the principal diagnosis DX2-DX30 are secondary diagnoses
String 3 4 or 5
characters (do not include decimal point)
Diagnosis codes Users must specify the number of diagnoses in the parameter ampNDX in CONTROL_IQISAS program
DXPOA1- DXPOA30-
Present on admission indicator for each diagnosis code
String
1 = present at the time of inpatient admission
These data will be used in risk adjustment and smoothing if the alternative parameter files of risk-adjustment covariates and population rates is specified
(YWE1)
0 = not present at the time of inpatient admission
(NUrsquo0rsquo )
NDX Count of the number of diagnoses (DX) on the discharge record
Numeric
Count of diagnoses (principal and all secondary diagnoses)
Not used by the IQI SAS program If not present in the input data file it is not necessary to create a dummy variable Definition is If the 1st discharge record has 1 Pr and the 2nd has 2 NPR would be 1 for the 1st record and 2 for the 2nd
PR1 ndash PR30
ICD-9-CM procedure codes PR1 is the principal procedure PR2-PR30 are secondary procedures
String 3 or 4
characters (do not include decimal point)
Procedure code
Users with more or fewer secondary procedures should modify the parameter ampNPR in CONTROL_IQISAS to reflect the number of diagnoses
NPR Count of the number of procedures (PR) on the discharge record
Numeric
Count of procedures (principal and all secondary procedures)
Not used by the IQI SAS program If not present in the input data file it is not necessary to create a dummy variable Definition is If the 1st discharge record has 1 Pr and the 2nd has 2 NPR would be 1 for the 1st record and 2 for the 2nd
Inpatient Quality Indicators (IQI) Software Instruction SAS
Inpatient Quality Indicators (IQI) 51 Version 43 (August 2011)
Variable name Description Format Value description Comments
POINTOFORIGINUB04
Point of Origin Numeric 4 Transfer from a hospital 5 Transfer from a skilled Nursing Facility (SNF) or Intermediate Care Facility (ICF)
Only these values are used by the QI programs
6 Transfer from another health care facility
IF ATYPE = 4
5 Born inside this hospital
6 Born outside of this hospital
PRDAY1 ndash PRDAY30
Days from admission to procedure PR1 is the principal procedure PR2-PR30 are secondary procedures
Numeric Days from Admission to Procedure4
Not used by the IQI program If not present in the input data file it is not necessary to create a dummy variable for this module
YEAR
Year of discharge The patientrsquos year of discharge For example a patient discharged on July 7 2004 would have a discharge year of lsquo2004rsquo
Numeric
YYYY
Discharge year should be within the range of 1997 to 2011
DQTR Quarter of discharge The calendar quarter of the patientrsquos discharge For example a patient discharged on July 7 2004 would have a discharge quarter of lsquo3rsquo
Numeric 1 January-March 2 April-June 3 July-September 4 October-December
See httphcup-usahrqgovtoolssoftwarecomorbiditycomorbidityjsp
4 Variables PRDAY1 to PRDAY30 are defined as the number of days from date of admission to date of procedure for each procedure For example if the patient was admitted on June 15th and had two procedures - the principal procedure on June 15th and a second procedure on June 18th ndash then the value of PRDAY1 would be zero (0) and the value of PRDAY2 would be three (3) For more information consult the HCUP data documentation at httpwwwhcup-usahrqgovdbvarsprdaynnisnotejsp
Inpatient Quality Indicators (IQI) Software Instruction SAS
Inpatient Quality Indicators (IQI) 52 Version 43 (August 2011)
Appendix D SAS IQI Output Data Dictionary SAS IQI Provider Output Column Heading Description Format Comments
Obs Observation 1 (with HOSPID = ) is the overall average for the entire dataset (TYPELVLP = 0) The remaining observations are individual providers or hospitals (TYPELVLP = 16)
Numeric
HOSPID Identifier for each provider in the dataset
Text Up to 12 characters
AGECAT Age stratification category Numeric range
SEXCAT Gender stratification category Numeric 1 = male 2 = female PAYCAT Payer stratification category Numeric 1 = Medicare
2 = Medicaid 3 = Private incl HMO 4 = Self-pay 5 = No charge 6 = Other
RACECAT Race stratification category Numeric 1 = White 2 = Black 3 = Hispanic 4 = Asian or Pacific Island 5 = Native American 6 = Other
TPIQxx The number of discharge records included in the numerator (outcome of interest) as defined for the indicator
Numeric
PPIQxx The number of discharge records included in the denominator (population at risk) as defined for the indicator
Numeric
OPIQxx The rate (observed numerator observed denominator) as defined for the indicator
Numeric
EPIQxx Rate calculated by assuming an average performance for each patient group based on the reference population but with the providerlsquos actual case-mix
Numeric
RPIQxx The estimated rate calculated by adjusting to an average case-mix
Numeric When stratifications other than hospital or area are selected the RPIQxx variables and their confidence intervals are observedexpected ratios to avoid confounding with risk adjustment variables
LPIQxx The lower confidence bound of the risk adjusted rate
Numeric
UPIQxx The upper confidence bound of the risk adjusted rate
Numeric
Inpatient Quality Indicators (IQI) Software Instruction SAS
Inpatient Quality Indicators (IQI) 53 Version 43 (August 2011)
Column Heading Description Format Comments
SPIQxx The smoothed rate calculated using multivariate signal extraction (MSX)
Numeric
XPIQxx Standard error of smoothed rate Numeric VPIQxx Variance for respective indicators Numeric
SAS IQI Area Output Column Heading Description Format Comments
Obs Observation 1 (with HOSPID = ) is the overall average for the entire dataset (TYPELVLP = 0) The remaining observations are individual providers or hospitals (TYPELVLP = 16)
Numeric
AREA Identifier in the dataset for area Text TAIQxx The number of discharge records
included in the numerator (outcome of interest) as defined for the indicator
Numeric
PAIQxx The number of discharge records included in the denominator (population at risk) as defined for the indicator
Numeric
OAIQxx The rate (observed numerator observed denominator) as defined for the indicator
Numeric
RAIQxx The estimated rate calculated by adjusting to an average case-mix
Numeric When stratifications other than hospital or area are selected the RAIQxx variables and their confidence intervals are observedexpected ratios to avoid confounding with risk adjustment variables
SAIQxx The smoothed rate calculated using multivariate signal extraction (MSX)
Numeric
Inpatient Quality Indicators (IQI) Software Instruction SAS
Inpatient Quality Indicators (IQI) 45 Version 43 (August 2011)
Other Tools and Information
IQI rates can be calculated using the modified Federal Information Processing Standards (FIPS) Statecounty code A list of codes is available at
httpwwwcensusgovpopestgeographiccodes02pdf
AHRQ provides a free on-line query system based on HCUP data that provides access to health statistics and information on hospital stays at the national regional and State level It is available at
httphcupahrqgovHCUPnetasp
Information on the 3Mtrade APR-DRG system is available at
httpwww3mcomushealthcarehisproductscodingrefined_drgjhtml
Inpatient Quality Indicators (IQI) Software Instruction SAS
Inpatient Quality Indicators (IQI) 46 Version 43 (August 2011)
Appendix B Using Different Types of QI Rates When should you use the observed expected risk adjusted andor smoothed rates generated
by the AHRQ QI software Here are some guidelines If the userrsquos primary interest is to identify cases for further follow-up and quality
improvement then the observed rate would help to identify them The observed rate is the raw rate generated by the QI software from the data the user provided Areas for improvement can be identified by the magnitude of the observed rate compared to available benchmarks andor by the number of patients impacted
Additional breakdowns by the default patient characteristics used in stratified rates (eg age gender or payer) can further identify the target population Target populations can also be identified by user-defined patient characteristics supplemented to the casedischarge level flags Trend data can be used to measure change in the rate over time
Another approach to identify areas to focus on is to compare the observed and expected rates The expected rate is the rate the provider would have if it performed the same as the reference population given the providerrsquos actual case-mix (eg age gender DRG and comorbidity categories)
If the observed rate is higher than the expected rate (ie the ratio of observedexpected is greater than 10 or observed minus expected is positive) then the implication is that the provider performed worse than the reference population for that particular indicator Users may want to focus on these indicators for quality improvement
If the observed rate is lower than the expected rate (ie the ratio of observedexpected is less than 10 or observed minus expected is negative) then the implication is that the provider performed better than the reference population Users may want to focus on these indicators for identifying best practices
Users can also compare the expected rate to the reference population rate reported in the AHRQ QI software or Comparative Data document to determine how their case-mix compares to the reference population The population rate refers to the overall rate for the reference population The reference population is defined in the Comparative Data Document If the population rate is higher than the expected rate then the providerrsquos case-mix is less severe than the reference population If the population rate is lower than the expected rate then the providerrsquos case-mix is more severe than the reference population
We use this difference between the population rate and the expected rate to ldquoadjustrdquo the observed rate to account for the difference between the case-mix of the reference population and the providerrsquos case-mix which is the providerrsquos risk-adjusted rate
If the provider has a less severe case-mix then the adjustment is positive (population rate gt expected rate) and the risk-adjusted rate is higher than the observed rate If the provider has a more severe case-mix then the adjustment is negative (population rate lt expected rate) and the risk-adjusted rate is lower than the observed rate The risk-adjusted rate is the rate the provider would have if it had the same case-mix as the reference population given the providerrsquos actual performance
Finally users can compare the risk-adjusted rate to the smoothed or ldquoreliability-adjustedrdquo rate to determine whether this difference between the risk-adjusted rate and reference population rate is likely to remain in the next measurement period Smoothed rates are weighted averages of the population rate and the risk-adjusted rate where the weight reflects the reliability of the providerrsquos risk-adjusted rate
Inpatient Quality Indicators (IQI) Software Instruction SAS
Inpatient Quality Indicators (IQI) 47 Version 43 (August 2011)
A ratio of (smoothed rate - population rate) (risk-adjusted rate - population rate) greater than 080 suggests that the difference is likely to persist (whether the difference is positive or negative) A ratio less than 080 suggests that the difference may be due in part to random differences in patient characteristics (patient characteristics that are not observed and controlled for in the risk-adjustment model) In general users may want to focus on areas where the differences are more likely to persist
Inpatient Quality Indicators (IQI) Software Instruction SAS
Inpatient Quality Indicators (IQI) 48 Version 43 (August 2011)
Appendix C IQI Input Data Dictionary Variable name Description Format Value description Comments
KEY Sequence number Unique case identifier Numeric
User defined unique numeric identifier for each discharge record
Not used by the QI programs but should be present to facilitate possible exploration allows user to link the records from the IQSAS1SAS program output file back to the original input data file
AGE Age in years at admission Numeric Age in years
If this data element is missing the discharge record will be excluded from analysis
AGEDAY Age in days (coded only when the age in years is less than 1) Numeric Age in days
Not used in the IQI program If not present in the input data file it is not necessary to create a dummy variable for this module
RACE Race of patient Numeric 1 2 3 4 5 6
White Black Hispanic Asian or Pacific Island Native American Other
The values of 1-5 are used directly in the QI software All other ethnicity codes are mapped to an lsquootherrsquo category
SEX Sex of patient Numeric
1 2
Male Female
If this data element is missing the discharge record will be excluded from the analysis
PAY1 Expected primary payer
Numeric 1 2 3 4 5 6
Medicare Medicaid Private incl HMO Self-pay No charge Other
The values of 1 2 3 and 4 are used directly in the QI software All other payer codes are mapped to an lsquootherrsquo category This data element is used to stratify only the Provider-level IQI (IQI-01 toIQI-25 IQI-30 to IQI-34)
PAY2 (SAS Only)
Expected secondary payer
Numeric 1 2 3 4 5 6
Medicare Medicaid Private incl HMO Self-pay No charge Other
Use is optional but must be present in data (set to missing if data element not available)
PSTCO
Location of patient residence or hospital location (FIPSdagger Statecounty code)
Numeric ssccc
Modified Federal Information Processing Standards Statecounty code2
See Appendix A for link to most recent list of codes If this data element is missing the discharge record will be excluded from rate calculations
HOSPID Data Source hospital number Numeric Hospital
identification number Used to facilitate data exploration and possible trouble shooting
2 Federal Information Processing Standard as defined by the US Department of Commerce National Institute of Standards and Technology (formerly National Bureau of Standards) Note Certain independent cities (Baltimore City Carson City and St Louis City) and areas within Hawaii and Virginia are assigned to different area groupings in the Modified FIPS categories as compared to the US Census Bureau groupings The AHRQ QI software uses the Modified FIPS code assignment of these areas Failure to use the Modified FIPS codes assignment will result in the use of incorrect denominator estimates for area indicators A list is available at httpwwwcensusgovpopestgeographiccodes02pdf
Inpatient Quality Indicators (IQI) Software Instruction SAS
Inpatient Quality Indicators (IQI) 49 Version 43 (August 2011)
Variable name Description Format Value description Comments
DISP Disposition of patient
Numeric 1 2 3 4 5 6 7 20
Routine Short-term hospital Skilled nursing facility Intermediate care Another type of facility Home health care Against medical advice Died in the hospital
The values 2 and 20 are referenced by the QI code (to identify transfers to another short-term hospital and patients who died in the hospital)
MORT30 (SAS Only)
30-Day Mortality Indicator Numeric
0 ndash not died within 30-days from admission
Use is optional but must be present in data (set to missing if data element not available)
1 ndash died within 30-days from admission
DNR Do Not Resuscitate Indicator Numeric
0 ndash No ldquoDo Not Resuscitaterdquo Indicator
Use is optional but must be present in data (set to missing if data element not available)
1 ndash ldquoDo Not Resuscitaterdquo Indicator
ATYPE Admission Type Numeric 1 2 3 4 5 6
Emergency Urgent Elective Newborn Trauma Center3 Other
Not used by the IQI program If not present in the input data file it is not necessary to create a dummy variable
ASOURCE Admission Source
Numeric 1 2 3 4 5
ER Another hospital Another facility including LTC Courtlaw enforcement Routinebirthother
The value 2 is referenced by the QI code (to identify transfers from another short-term hospital)
LOS Length of Stay Numeric Number of days from admission to discharge
Not used by the IQI program If not present in the input data file it is not necessary to create a dummy variable
APR_DRG APR-DRG category Numeric APR-DRG from 3Mreg software
Although the IQI module will operate without these variables users should run APR-DRG software on their raw data to assign this variable to each case See Section 53 on page 15
APRDRG_ RISK_ MORTALITY
APR-DRG Mortality Score Numeric
APR-DRG Risk of Mortality Score from 3Mreg software
See Section 53 on page 15
XPRDRG_ RISK_ MORTALITY
APR-DRG Mortality Score with POA Numeric
APR-DRG Risk of Mortality Score from 3Mreg Software using
See Section 53 on page 15
3 The ATYPE value ldquo5rdquo was used to indicate delivery only in the 1988 to 1997 HCUP data files The UB standards currently use ldquo5rdquo to indicate Trauma Center
Inpatient Quality Indicators (IQI) Software Instruction SAS
Inpatient Quality Indicators (IQI) 50 Version 43 (August 2011)
Variable name Description Format Value description Comments
POA information
DRG Diagnosis Related Group Numeric DRG from federal (CMS) DRG Grouper
DRGVER Diagnosis Related Group Version Numeric
DRG Version of federal (CMS) DRG Grouper
eg Version 28 for FY2011
MDC Major Diagnostic Category Numeric MDC from federal (CMS) DRG grouper
DISCWT Weight to assign to discharge Numeric Format as nnnnn
Cases with missing values are assigned a value of 1 Assigning a weight of zero has the effect of removing the case from the analysis
DX1 ndash DX30
ICD-9-CM diagnosis codes DX1 is the principal diagnosis DX2-DX30 are secondary diagnoses
String 3 4 or 5
characters (do not include decimal point)
Diagnosis codes Users must specify the number of diagnoses in the parameter ampNDX in CONTROL_IQISAS program
DXPOA1- DXPOA30-
Present on admission indicator for each diagnosis code
String
1 = present at the time of inpatient admission
These data will be used in risk adjustment and smoothing if the alternative parameter files of risk-adjustment covariates and population rates is specified
(YWE1)
0 = not present at the time of inpatient admission
(NUrsquo0rsquo )
NDX Count of the number of diagnoses (DX) on the discharge record
Numeric
Count of diagnoses (principal and all secondary diagnoses)
Not used by the IQI SAS program If not present in the input data file it is not necessary to create a dummy variable Definition is If the 1st discharge record has 1 Pr and the 2nd has 2 NPR would be 1 for the 1st record and 2 for the 2nd
PR1 ndash PR30
ICD-9-CM procedure codes PR1 is the principal procedure PR2-PR30 are secondary procedures
String 3 or 4
characters (do not include decimal point)
Procedure code
Users with more or fewer secondary procedures should modify the parameter ampNPR in CONTROL_IQISAS to reflect the number of diagnoses
NPR Count of the number of procedures (PR) on the discharge record
Numeric
Count of procedures (principal and all secondary procedures)
Not used by the IQI SAS program If not present in the input data file it is not necessary to create a dummy variable Definition is If the 1st discharge record has 1 Pr and the 2nd has 2 NPR would be 1 for the 1st record and 2 for the 2nd
Inpatient Quality Indicators (IQI) Software Instruction SAS
Inpatient Quality Indicators (IQI) 51 Version 43 (August 2011)
Variable name Description Format Value description Comments
POINTOFORIGINUB04
Point of Origin Numeric 4 Transfer from a hospital 5 Transfer from a skilled Nursing Facility (SNF) or Intermediate Care Facility (ICF)
Only these values are used by the QI programs
6 Transfer from another health care facility
IF ATYPE = 4
5 Born inside this hospital
6 Born outside of this hospital
PRDAY1 ndash PRDAY30
Days from admission to procedure PR1 is the principal procedure PR2-PR30 are secondary procedures
Numeric Days from Admission to Procedure4
Not used by the IQI program If not present in the input data file it is not necessary to create a dummy variable for this module
YEAR
Year of discharge The patientrsquos year of discharge For example a patient discharged on July 7 2004 would have a discharge year of lsquo2004rsquo
Numeric
YYYY
Discharge year should be within the range of 1997 to 2011
DQTR Quarter of discharge The calendar quarter of the patientrsquos discharge For example a patient discharged on July 7 2004 would have a discharge quarter of lsquo3rsquo
Numeric 1 January-March 2 April-June 3 July-September 4 October-December
See httphcup-usahrqgovtoolssoftwarecomorbiditycomorbidityjsp
4 Variables PRDAY1 to PRDAY30 are defined as the number of days from date of admission to date of procedure for each procedure For example if the patient was admitted on June 15th and had two procedures - the principal procedure on June 15th and a second procedure on June 18th ndash then the value of PRDAY1 would be zero (0) and the value of PRDAY2 would be three (3) For more information consult the HCUP data documentation at httpwwwhcup-usahrqgovdbvarsprdaynnisnotejsp
Inpatient Quality Indicators (IQI) Software Instruction SAS
Inpatient Quality Indicators (IQI) 52 Version 43 (August 2011)
Appendix D SAS IQI Output Data Dictionary SAS IQI Provider Output Column Heading Description Format Comments
Obs Observation 1 (with HOSPID = ) is the overall average for the entire dataset (TYPELVLP = 0) The remaining observations are individual providers or hospitals (TYPELVLP = 16)
Numeric
HOSPID Identifier for each provider in the dataset
Text Up to 12 characters
AGECAT Age stratification category Numeric range
SEXCAT Gender stratification category Numeric 1 = male 2 = female PAYCAT Payer stratification category Numeric 1 = Medicare
2 = Medicaid 3 = Private incl HMO 4 = Self-pay 5 = No charge 6 = Other
RACECAT Race stratification category Numeric 1 = White 2 = Black 3 = Hispanic 4 = Asian or Pacific Island 5 = Native American 6 = Other
TPIQxx The number of discharge records included in the numerator (outcome of interest) as defined for the indicator
Numeric
PPIQxx The number of discharge records included in the denominator (population at risk) as defined for the indicator
Numeric
OPIQxx The rate (observed numerator observed denominator) as defined for the indicator
Numeric
EPIQxx Rate calculated by assuming an average performance for each patient group based on the reference population but with the providerlsquos actual case-mix
Numeric
RPIQxx The estimated rate calculated by adjusting to an average case-mix
Numeric When stratifications other than hospital or area are selected the RPIQxx variables and their confidence intervals are observedexpected ratios to avoid confounding with risk adjustment variables
LPIQxx The lower confidence bound of the risk adjusted rate
Numeric
UPIQxx The upper confidence bound of the risk adjusted rate
Numeric
Inpatient Quality Indicators (IQI) Software Instruction SAS
Inpatient Quality Indicators (IQI) 53 Version 43 (August 2011)
Column Heading Description Format Comments
SPIQxx The smoothed rate calculated using multivariate signal extraction (MSX)
Numeric
XPIQxx Standard error of smoothed rate Numeric VPIQxx Variance for respective indicators Numeric
SAS IQI Area Output Column Heading Description Format Comments
Obs Observation 1 (with HOSPID = ) is the overall average for the entire dataset (TYPELVLP = 0) The remaining observations are individual providers or hospitals (TYPELVLP = 16)
Numeric
AREA Identifier in the dataset for area Text TAIQxx The number of discharge records
included in the numerator (outcome of interest) as defined for the indicator
Numeric
PAIQxx The number of discharge records included in the denominator (population at risk) as defined for the indicator
Numeric
OAIQxx The rate (observed numerator observed denominator) as defined for the indicator
Numeric
RAIQxx The estimated rate calculated by adjusting to an average case-mix
Numeric When stratifications other than hospital or area are selected the RAIQxx variables and their confidence intervals are observedexpected ratios to avoid confounding with risk adjustment variables
SAIQxx The smoothed rate calculated using multivariate signal extraction (MSX)
Numeric

Inpatient Quality Indicators (IQI) Software Instruction SAS
Inpatient Quality Indicators (IQI) 49 Version 43 (August 2011)
Variable name Description Format Value description Comments
DISP Disposition of patient
Numeric 1 2 3 4 5 6 7 20
Routine Short-term hospital Skilled nursing facility Intermediate care Another type of facility Home health care Against medical advice Died in the hospital
The values 2 and 20 are referenced by the QI code (to identify transfers to another short-term hospital and patients who died in the hospital)
MORT30 (SAS Only)
30-Day Mortality Indicator Numeric
0 ndash not died within 30-days from admission
Use is optional but must be present in data (set to missing if data element not available)
1 ndash died within 30-days from admission
DNR Do Not Resuscitate Indicator Numeric
0 ndash No ldquoDo Not Resuscitaterdquo Indicator
Use is optional but must be present in data (set to missing if data element not available)
1 ndash ldquoDo Not Resuscitaterdquo Indicator
ATYPE Admission Type Numeric 1 2 3 4 5 6
Emergency Urgent Elective Newborn Trauma Center3 Other
Not used by the IQI program If not present in the input data file it is not necessary to create a dummy variable
ASOURCE Admission Source
Numeric 1 2 3 4 5
ER Another hospital Another facility including LTC Courtlaw enforcement Routinebirthother
The value 2 is referenced by the QI code (to identify transfers from another short-term hospital)
LOS Length of Stay Numeric Number of days from admission to discharge
Not used by the IQI program If not present in the input data file it is not necessary to create a dummy variable
APR_DRG APR-DRG category Numeric APR-DRG from 3Mreg software
Although the IQI module will operate without these variables users should run APR-DRG software on their raw data to assign this variable to each case See Section 53 on page 15
APRDRG_ RISK_ MORTALITY
APR-DRG Mortality Score Numeric
APR-DRG Risk of Mortality Score from 3Mreg software
See Section 53 on page 15
XPRDRG_ RISK_ MORTALITY
APR-DRG Mortality Score with POA Numeric
APR-DRG Risk of Mortality Score from 3Mreg Software using
See Section 53 on page 15
3 The ATYPE value ldquo5rdquo was used to indicate delivery only in the 1988 to 1997 HCUP data files The UB standards currently use ldquo5rdquo to indicate Trauma Center
Inpatient Quality Indicators (IQI) Software Instruction SAS
Inpatient Quality Indicators (IQI) 50 Version 43 (August 2011)
Variable name Description Format Value description Comments
POA information
DRG Diagnosis Related Group Numeric DRG from federal (CMS) DRG Grouper
DRGVER Diagnosis Related Group Version Numeric
DRG Version of federal (CMS) DRG Grouper
eg Version 28 for FY2011
MDC Major Diagnostic Category Numeric MDC from federal (CMS) DRG grouper
DISCWT Weight to assign to discharge Numeric Format as nnnnn
Cases with missing values are assigned a value of 1 Assigning a weight of zero has the effect of removing the case from the analysis
DX1 ndash DX30
ICD-9-CM diagnosis codes DX1 is the principal diagnosis DX2-DX30 are secondary diagnoses
String 3 4 or 5
characters (do not include decimal point)
Diagnosis codes Users must specify the number of diagnoses in the parameter ampNDX in CONTROL_IQISAS program
DXPOA1- DXPOA30-
Present on admission indicator for each diagnosis code
String
1 = present at the time of inpatient admission
These data will be used in risk adjustment and smoothing if the alternative parameter files of risk-adjustment covariates and population rates is specified
(YWE1)
0 = not present at the time of inpatient admission
(NUrsquo0rsquo )
NDX Count of the number of diagnoses (DX) on the discharge record
Numeric
Count of diagnoses (principal and all secondary diagnoses)
Not used by the IQI SAS program If not present in the input data file it is not necessary to create a dummy variable Definition is If the 1st discharge record has 1 Pr and the 2nd has 2 NPR would be 1 for the 1st record and 2 for the 2nd
PR1 ndash PR30
ICD-9-CM procedure codes PR1 is the principal procedure PR2-PR30 are secondary procedures
String 3 or 4
characters (do not include decimal point)
Procedure code
Users with more or fewer secondary procedures should modify the parameter ampNPR in CONTROL_IQISAS to reflect the number of diagnoses
NPR Count of the number of procedures (PR) on the discharge record
Numeric
Count of procedures (principal and all secondary procedures)
Not used by the IQI SAS program If not present in the input data file it is not necessary to create a dummy variable Definition is If the 1st discharge record has 1 Pr and the 2nd has 2 NPR would be 1 for the 1st record and 2 for the 2nd
Inpatient Quality Indicators (IQI) Software Instruction SAS
Inpatient Quality Indicators (IQI) 51 Version 43 (August 2011)
Variable name Description Format Value description Comments
POINTOFORIGINUB04
Point of Origin Numeric 4 Transfer from a hospital 5 Transfer from a skilled Nursing Facility (SNF) or Intermediate Care Facility (ICF)
Only these values are used by the QI programs
6 Transfer from another health care facility
IF ATYPE = 4
5 Born inside this hospital
6 Born outside of this hospital
PRDAY1 ndash PRDAY30
Days from admission to procedure PR1 is the principal procedure PR2-PR30 are secondary procedures
Numeric Days from Admission to Procedure4
Not used by the IQI program If not present in the input data file it is not necessary to create a dummy variable for this module
YEAR
Year of discharge The patientrsquos year of discharge For example a patient discharged on July 7 2004 would have a discharge year of lsquo2004rsquo
Numeric
YYYY
Discharge year should be within the range of 1997 to 2011
DQTR Quarter of discharge The calendar quarter of the patientrsquos discharge For example a patient discharged on July 7 2004 would have a discharge quarter of lsquo3rsquo
Numeric 1 January-March 2 April-June 3 July-September 4 October-December
See httphcup-usahrqgovtoolssoftwarecomorbiditycomorbidityjsp
4 Variables PRDAY1 to PRDAY30 are defined as the number of days from date of admission to date of procedure for each procedure For example if the patient was admitted on June 15th and had two procedures - the principal procedure on June 15th and a second procedure on June 18th ndash then the value of PRDAY1 would be zero (0) and the value of PRDAY2 would be three (3) For more information consult the HCUP data documentation at httpwwwhcup-usahrqgovdbvarsprdaynnisnotejsp
Inpatient Quality Indicators (IQI) Software Instruction SAS
Inpatient Quality Indicators (IQI) 52 Version 43 (August 2011)
Appendix D SAS IQI Output Data Dictionary SAS IQI Provider Output Column Heading Description Format Comments
Obs Observation 1 (with HOSPID = ) is the overall average for the entire dataset (TYPELVLP = 0) The remaining observations are individual providers or hospitals (TYPELVLP = 16)
Numeric
HOSPID Identifier for each provider in the dataset
Text Up to 12 characters
AGECAT Age stratification category Numeric range
SEXCAT Gender stratification category Numeric 1 = male 2 = female PAYCAT Payer stratification category Numeric 1 = Medicare
2 = Medicaid 3 = Private incl HMO 4 = Self-pay 5 = No charge 6 = Other
RACECAT Race stratification category Numeric 1 = White 2 = Black 3 = Hispanic 4 = Asian or Pacific Island 5 = Native American 6 = Other
TPIQxx The number of discharge records included in the numerator (outcome of interest) as defined for the indicator
Numeric
PPIQxx The number of discharge records included in the denominator (population at risk) as defined for the indicator
Numeric
OPIQxx The rate (observed numerator observed denominator) as defined for the indicator
Numeric
EPIQxx Rate calculated by assuming an average performance for each patient group based on the reference population but with the providerlsquos actual case-mix
Numeric
RPIQxx The estimated rate calculated by adjusting to an average case-mix
Numeric When stratifications other than hospital or area are selected the RPIQxx variables and their confidence intervals are observedexpected ratios to avoid confounding with risk adjustment variables
LPIQxx The lower confidence bound of the risk adjusted rate
Numeric
UPIQxx The upper confidence bound of the risk adjusted rate
Numeric
Inpatient Quality Indicators (IQI) Software Instruction SAS
Inpatient Quality Indicators (IQI) 53 Version 43 (August 2011)
Column Heading Description Format Comments
SPIQxx The smoothed rate calculated using multivariate signal extraction (MSX)
Numeric
XPIQxx Standard error of smoothed rate Numeric VPIQxx Variance for respective indicators Numeric
SAS IQI Area Output Column Heading Description Format Comments
Obs Observation 1 (with HOSPID = ) is the overall average for the entire dataset (TYPELVLP = 0) The remaining observations are individual providers or hospitals (TYPELVLP = 16)
Numeric
AREA Identifier in the dataset for area Text TAIQxx The number of discharge records
included in the numerator (outcome of interest) as defined for the indicator
Numeric
PAIQxx The number of discharge records included in the denominator (population at risk) as defined for the indicator
Numeric
OAIQxx The rate (observed numerator observed denominator) as defined for the indicator
Numeric
RAIQxx The estimated rate calculated by adjusting to an average case-mix
Numeric When stratifications other than hospital or area are selected the RAIQxx variables and their confidence intervals are observedexpected ratios to avoid confounding with risk adjustment variables
SAIQxx The smoothed rate calculated using multivariate signal extraction (MSX)
Numeric
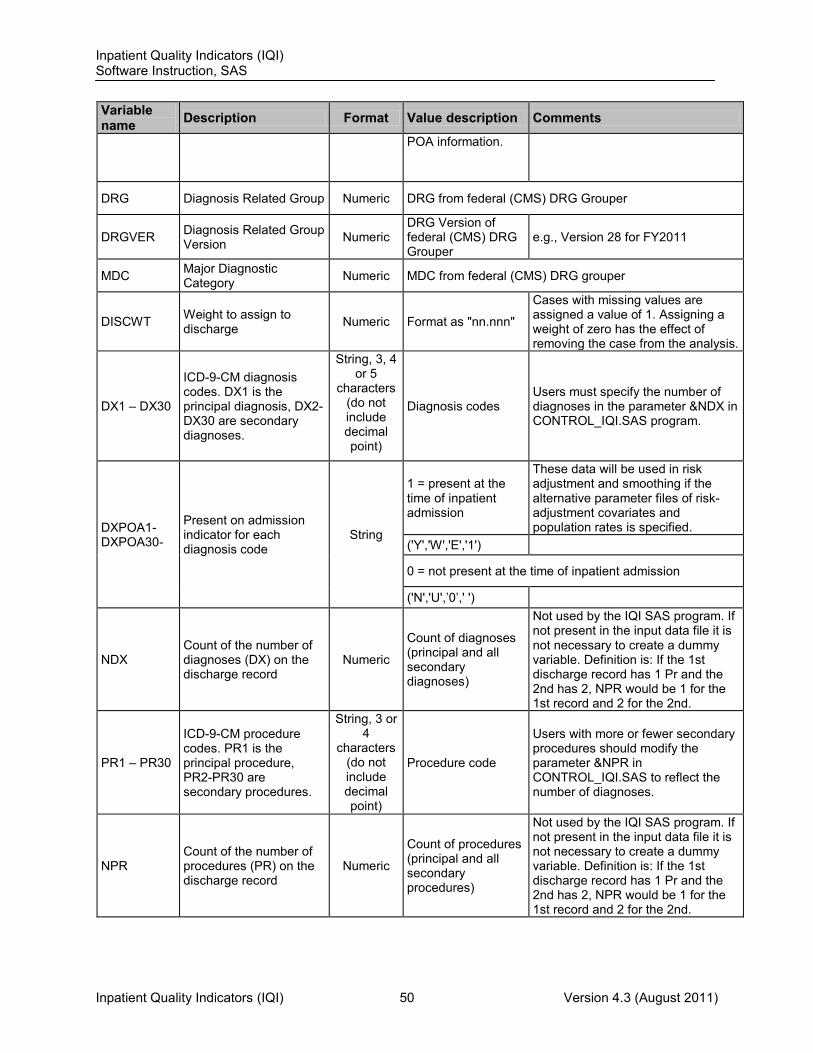
Inpatient Quality Indicators (IQI) Software Instruction SAS
Inpatient Quality Indicators (IQI) 53 Version 43 (August 2011)
Column Heading Description Format Comments
SPIQxx The smoothed rate calculated using multivariate signal extraction (MSX)
Numeric
XPIQxx Standard error of smoothed rate Numeric VPIQxx Variance for respective indicators Numeric
SAS IQI Area Output Column Heading Description Format Comments
Obs Observation 1 (with HOSPID = ) is the overall average for the entire dataset (TYPELVLP = 0) The remaining observations are individual providers or hospitals (TYPELVLP = 16)
Numeric
AREA Identifier in the dataset for area Text TAIQxx The number of discharge records
included in the numerator (outcome of interest) as defined for the indicator
Numeric
PAIQxx The number of discharge records included in the denominator (population at risk) as defined for the indicator
Numeric
OAIQxx The rate (observed numerator observed denominator) as defined for the indicator
Numeric
RAIQxx The estimated rate calculated by adjusting to an average case-mix
Numeric When stratifications other than hospital or area are selected the RAIQxx variables and their confidence intervals are observedexpected ratios to avoid confounding with risk adjustment variables
SAIQxx The smoothed rate calculated using multivariate signal extraction (MSX)
Numeric