Embed Size (px)
Citation preview

Innovative Retrofit Insulation Strategies for Concrete Masonry Foundations
P. Huelman, L. Goldberg, and R. Jacobson NorthernSTAR
May 2015

ii
NOTICE
This report was prepared as an account of work sponsored by an agency of the United States government. Neither the United States government nor any agency thereof, nor any of their employees, subcontractors, or affiliated partners makes any warranty, express or implied, or assumes any legal liability or responsibility for the accuracy, completeness, or usefulness of any information, apparatus, product, or process disclosed, or represents that its use would not infringe privately owned rights. Reference herein to any specific commercial product, process, or service by trade name, trademark, manufacturer, or otherwise does not necessarily constitute or imply its endorsement, recommendation, or favoring by the United States government or any agency thereof. The views and opinions of authors expressed herein do not necessarily state or reflect those of the United States government or any agency thereof.
Available electronically at http://www.osti.gov/scitech
Available for a processing fee to U.S. Department of Energy and its contractors, in paper, from:
U.S. Department of Energy Office of Scientific and Technical Information P.O. Box 62 Oak Ridge, TN 37831-0062 phone: 865.576.8401 fax: 865.576.5728 email: mailto:[email protected]
Available for sale to the public, in paper, from:
U.S. Department of Commerce National Technical Information Service 5285 Port Royal Road Springfield, VA 22161 phone: 800.553.6847 fax: 703.605.6900 email: [email protected] online ordering: http://www.ntis.gov/ordering.htm
iii
Innovative Retrofit Insulation Strategies for Concrete Masonry Foundations
Prepared for:
The National Renewable Energy Laboratory
On behalf of the U.S. Department of Energy’s Building America Program
Office of Energy Efficiency and Renewable Energy
15013 Denver West Parkway
Golden, CO 80401
NREL Contract No. DE-AC36-08GO28308
P. Huelman, L. Goldberg, and R. Jacobson
NorthernSTAR Building America Partnership
University of Minnesota
2004 Folwell Avenue
St. Paul, MN 55108
NREL Technical Monitor: Stacey Rothgeb
Prepared under Subcontract No. KNDJ-0-04338-03
May 2015

iv
The work presented in this report does not represent performance of any product relative to regulated minimum efficiency requirements.
The laboratory and/or field sites used for this work are not certified rating test facilities. The conditions and methods under which products were characterized for this work differ from standard rating conditions, as described.
Because the methods and conditions differ, the reported results are not comparable to rated product performance and should only be used to estimate performance under the measured conditions.

v
Contents List of Figures ............................................................................................................................................ vi List of Tables ............................................................................................................................................. vii Definitions ................................................................................................................................................. viii Executive Summary ................................................................................................................................... ix 1 Introduction ........................................................................................................................................... 1
1.1 Motivation ............................................................................................................................1 1.2 Previous Work .....................................................................................................................3 1.3 Scope of Work .....................................................................................................................4
2 Foundation Survey ............................................................................................................................... 6 2.1 Survey Methodology ............................................................................................................6 2.2 Survey Results .....................................................................................................................6 2.3 Survey Analysis ...................................................................................................................7
3 Energy Performance Modeling .......................................................................................................... 11 3.1 Methodology ......................................................................................................................11 3.2 Results ................................................................................................................................18 3.3 Discussion of Results .........................................................................................................23
4 Space Temperature Modeling ........................................................................................................... 29 4.1 Methodology ......................................................................................................................29 4.2 Results ................................................................................................................................29 4.3 Analysis..............................................................................................................................33
5 Hygrothermal Modeling ..................................................................................................................... 36 5.1 Methodology ......................................................................................................................36 5.2 Results ................................................................................................................................38
6 Cost Analysis ...................................................................................................................................... 39 6.1 Methodology ......................................................................................................................39 6.2 Results ................................................................................................................................39
7 Conclusions ........................................................................................................................................ 42 References ................................................................................................................................................. 45 Appendix A: Foundation Survey Form ................................................................................................... 47 Appendix B: Hollow-Core Masonry Block Modeling ............................................................................. 48 Appendix C: Hygrothermal Modeling Results (WUFI 2D) ..................................................................... 65 Appendix D: Space Temperature Modeling Additional Results ........................................................... 85

vi
List of Figures Figure 1. Foundation wall type by decade ................................................................................................ 7 Figure 2. Evidence of moisture issues by decade ................................................................................... 9 Figure 3. Exposure height AG ................................................................................................................. 10 Figure 4. Two-foot AG foundation wall section, with optional exterior insulation and 33% fill ........ 13 Figure 5. Four-foot AG foundation wall section, with optional exterior insulation and 33% fill ....... 13 Figure 6. BEopt/EnergyPlus model house ............................................................................................. 15 Figure 7. Basement zone total energy transfer, 2-ft AG cases in blue, 4-ft AG cases in green ........ 23 Figure 8. Effect of AG height (2 ft versus 4 ft) on basement zone energy transfer ............................ 27 Figure 9. Effect of mortar droppings (33% concrete fill) on basement zone energy transfer, shown
for 4-ft AG options .............................................................................................................................. 28 Figure 10. AG surface temperature, 2-ft AG with no concrete fill ........................................................ 30 Figure 11. BG surface temperature, 2-ft AG with no concrete fill ........................................................ 30 Figure 12. Basement zone air temperature, 2-ft AG with no concrete fill ........................................... 31 Figure 13. AG surface temperature, 4-ft AG with no concrete fill ........................................................ 31 Figure 14. BG surface temperature, 4-ft AG with no concrete fill ........................................................ 32 Figure 15. Basement zone air temperature, 4-ft AG with no concrete fill ........................................... 32 Figure 16. Basement zone average air temperature for all cases ........................................................ 35 Figure 17. WUFI 2D Reporting locations for temperature, MC, and RH .............................................. 38 Figure B.1. Solid model for 2-ft AG, full air core .................................................................................... 52 Figure B.2. Two-foot AG, full air core: flooded temperature contours ................................................ 53 Figure B.3. Two-foot AG, full air core: flooded vertical velocity component contours ..................... 54 Figure B.4. Two-foot AG, full air core: diffusive wall heat transfer only flooded temperature
contours .............................................................................................................................................. 55 Figure B.5. Solid model for 2-ft AG, 33% concrete fill, upper 50% of air core filled with CCSPU .... 56 Figure B.6. Two-foot AG, 33% concrete fill, upper 50% of air core filled with CCSPU: flooded
temperature contours ........................................................................................................................ 57 Figure B.7. Two-foot AG, 33% concrete fill, upper 50% of air core filled with CCSPU: flooded
vertical velocity component contours .............................................................................................. 58 Figure B.8. Solid model for 4-ft AG, full air core .................................................................................... 59 Figure B.9. Four-foot AG, full air core: flooded temperature contours ............................................... 60 Figure B.10. Four-foot AG, full air core: flooded vertical velocity component contours .................. 61 Figure B. 11. Solid model for 1-½-ft AG, 3-D wall segment consisting of a single standard 10-in.
wide stretcher block with two air cores ........................................................................................... 63 Figure C.1. Two-foot AG wall simulation model .................................................................................... 67 Figure C.2. Comparison of 2-ft AG upper wall MC contours with the cores filled with air and
CCSPU on October 1/year 1 .............................................................................................................. 68 Figure C.3. Comparison of 2-ft AG upper wall MC contours with the cores filled with air and
CCSPU on November 11/year 1 ......................................................................................................... 68 Figure C.4. Comparison of 2-ft AG upper wall MC contours with the cores filled with air and
CCSPU on February 24/year 2 ........................................................................................................... 69 Figure C.5. Comparison of 2-ft AG upper wall MC contours with the cores filled with air and
CCSPU on July 17/year 2 ................................................................................................................... 69 Figure C.6. Four-foot AG wall simulation model.................................................................................... 70 Figure C.7. Comparison of 4-ft AG upper wall MC contours with the cores filled with air and
CCSPU on October 1/year 2 .............................................................................................................. 71 Figure C.8 Comparison of 4-ft AG upper wall MC contours with the cores filled with air and CCSPU
on November 11/year 2 ...................................................................................................................... 71 Figure C.9. Comparison of 4-ft AG upper wall MC contours with the cores filled with air and
CCSPU on February 24/year 2 ........................................................................................................... 72 Figure C.10. Comparison of 4-ft AG upper wall MC contours with the cores filled with air and
CCSPU on July 17/year 2 ................................................................................................................... 72 Figure C.11. Two-foot AG wall RH profiles ............................................................................................. 74 Figure C.12. Two-foot AG wall RH profiles on the rim-joist cavity condensing surfaces ................. 75

vii
Figure C.13. Two-foot AG wall MC profiles ............................................................................................ 76 Figure C.14. Two-foot AG wall temperature profiles ............................................................................. 77 Figure C.15. Four-foot AG wall RH profiles ............................................................................................ 80 Figure C.16. Four-foot AG wall RH profiles on the rim-joist cavity condensing surfaces ................ 81 Figure C.17. Four-foot AG wall MC profiles ............................................................................................ 82 Figure C.18. Four-foot AG wall temperature profiles ............................................................................ 83 Figure D.1. AG surface temperature, 2-ft AG with 33% concrete fill ................................................... 85 Figure D.2. BG surface temperature, 2-ft AG with 33% concrete fill ................................................... 85 Figure D.3. Basement zone air temperature, 2-ft AG with 33% concrete fill ....................................... 86 Figure D.4. AG surface temperature, 4-ft AG with 33% concrete fill ................................................... 86 Figure D.5. BG surface temperature, 4-ft AG with 33% concrete fill ................................................... 87 Figure D.6. Basement zone air temperature, 4-ft AG with 33% concrete fill ....................................... 87
Unless otherwise noted, all figures were created by NorthernSTAR.
List of Tables Table 1. Foundation Survey Results ......................................................................................................... 7 Table 2. Ratio of Block Versus Poured Foundation Walls ...................................................................... 8 Table 3. Ratio of Open Core Versus Filled Core (Block Walls Only) ..................................................... 8 Table 4. Evidence of Moisture ................................................................................................................... 9 Table 5. Modeled Retrofit Insulation Packages...................................................................................... 12 Table 6. EnergyPlus Model House Characteristics ............................................................................... 16 Table 7. EnergyPlus Site-to-Source Energy Conversion Factors ........................................................ 17 Table 8. Whole-Wall Equivalent Thermal Conductivity ......................................................................... 19 Table 10. Whole-Building Annual Energy Performance Results, Air Core Reference Case ............. 21 Table 11. Whole-Building Annual Energy Performance Results, LWA Core Reference Case .......... 22 Table 11. Retrofit Options Energy Savings Summary, Air Core Reference Case .............................. 24 Table 12. Retrofit Options Energy Savings Summary, LWA Core Reference Case ........................... 25 Table 13. Basement Zone Fraction of Whole-House Energy Transfer ................................................ 26 Table 14. Average Winter Season Basement Temperatures, 2-ft AG No Concrete Fill ..................... 33 Table 15. Average Winter Season Basement Temperatures, 2-ft AG 33% Concrete Fill ................... 34 Table 16. Average Winter Season Basement Temperatures, 4-ft AG No Concrete Fill ..................... 34 Table 17. Average Winter Season Basement Temperatures, 4-ft AG 33% Concrete Fill ................... 34 Table 18. Insulation Retrofit Installation Cost Comparison .................................................................. 41 Table B.1. Steady-State CFD 2-D Air Core Convection Results ........................................................... 50
Unless otherwise noted, all tables were created by NorthernSTAR.

viii
Definitions
1-D, 2-D, 3-D One-, two-, and three-dimensional, respectively
AG Above Grade
ANSI American National Standards Institute
ASHRAE American Society of Heating, Refrigerating and Air-Conditioning Engineers
BEM BUFETS/EnergyPlus Model
BEopt™ Building Energy Optimization software
BEoptE+ Building Energy Optimization using EnergyPlus software
BG Below grade
BUFETS Building Foundation Energy Transport Simulation
CCSPU Closed cell spray polyurethane foam
CFD Computational fluid dynamics
ESL Equivalent soil layer
FTF Foundation Test Facility
LWA Lightweight aggregate
MC Moisture content
NREL National Renewable Energy Laboratory
RH Relative humidity
WSP Water separation plane
WUFI Wärme und Feuchte instationär (hygrothermal software)
XPS Extruded polystyrene foam

ix
Executive Summary
Historically, almost all the foundations in International Energy Conservation Code climate zones 6 and 7 have been full or partial basements constructed of uninsulated stone, concrete block, or poured concrete walls. These basements can account for a meaningful fraction of a home’s total heat loss. This is particularly true when they are fully conditioned, which is quite common today. Such foundations are also frequently sources of moisture because convection in open block cavities redistributes water from the wall base, usually in the heating season. Even when block cavities are capped, the cold foundation concrete can act as a moisture source for wood rim-joist components that are in contact with it. Because below-grade basements are increasingly used for habitable space, cold foundation walls pose challenges for moisture contribution, energy use, and occupant comfort.
This study was designed to test a new approach for foundation insulation retrofits, with the goal of demonstrating improved moisture control, improved occupant comfort, and reduced heat loss. Because conducting experimental research on existing below-grade assemblies is very difficult, most of the results are based on simulations. The retrofit approach consists of filling open concrete block cores with an insulating material and adding R-10 exterior insulation that extends 1 ft below grade. The core fill is designed to improve the R-value of the foundation wall and increase the interior wall surface temperature, but more importantly to block convection currents that could otherwise increase moisture loads on the foundation wall and interior space. The exterior insulation significantly reduces heat loss through the most exposed part of the foundation and further increases the interior wall surface temperature. This improves occupant comfort and decreases the risk of condensation. Such an insulation package avoids the full-depth excavation necessary for exterior insulation retrofits, reduces costs, and eliminates the moisture and indoor air quality risks associated with interior insulation retrofits. Retrofit costs for the proposed approach were estimated at roughly half those of a full-depth exterior insulation retrofit.
Several analyses were carried out to determine the effectiveness of this approach. First, a foundation survey was completed with the help of several industry partners as an additional step in their typical energy audit processes. Two hundred twenty-two surveys were returned with useful information. Within the target retrofit group, almost 80% of foundations were constructed with concrete block, 25% of which had cores that were open and accessible at the top. The retrofit package proposed in this study is particularly applicable to this subset of foundations. However, further investigation identified techniques that can fill cores even when the top is not readily accessible. In addition—based on observational (noninvasive) evidence—close to 20% of basements were found to have current or historical moisture issues.
As a precursor to accurate energy simulations, thermal conductivity values for the retrofit wall options and uninsulated open core reference case were calculated using a steady-state approach based on work by Shipp (1983). Comparing to actual thermal conductivity values derived from heat flow measurements at the Foundation Test Facility, the open core reference case calculation underpredicted heat loss during the heating season by about 28%. This case was prone to convection currents in the open block cavities. Thus, it was determined that a steady-state calculation is not a valid approach to calculate the thermal conductivity of hollow masonry block foundation walls exposed to real environmental conditions. To complete the energy modeling,

x
the experimental heat flow measurements from the Foundation Test Facility were used to calculate the thermal conductivity of the open core block wall reference case.
Once equivalent thermal conductivity values were calculated, the retrofit insulation packages were tested to determine their impact on basement wall heat loss and overall home energy performance, using the Building Foundation Energy Transport System/EnergyPlus Model approach discussed in Phase 1 of this project. Basement zone heat loss was reduced by up to 27% and whole-house site energy savings up to 8.8% were found for foundations incorporating the shallow R-10 exterior insulation option. Building Foundation Energy Transport System/EnergyPlus Model energy modeling also provided data on foundation wall interior surface and basement zone air temperatures. Basement air temperatures were commonly increased by several degrees Fahrenheit using only an insulating core fill, and by up to 10°F when combined with the shallow R-10 exterior insulation.
Finally, an experimental Wärme und Feuchte instationär 2D simulation with an equivalent soil layer methodology was used in an attempt to determine the hygrothermal impacts of core fills on foundation wall and rim-joist moisture levels. While a closed-cell spray polyurethane core fill prevents convection currents and associated moisture redistribution within the block cores, modeling results did not show the expected decrease in rim-joist moisture levels. Rather, the model predicted increased moisture levels, likely resulting from additional condensation of interior moisture. However, the unrealistically high rim-joist moisture levels in the simulation call into question the applicability of the current Wärme und Feuchte instationär 2D approach to building foundation hygrothermal modeling.
In summary, open-core concrete block foundation walls made up a significant fraction of foundations in the NorthernSTAR territory, primarily Minnesota and Wisconsin. Simulation results showed that the proposed insulation retrofit approach can improve the performance of these foundations in multiple ways. Combining shallow exterior insulation with an insulating core fill can reduce basement zone heat loss and increase basement interior surface temperatures substantially, making occupied basements cheaper to condition and more comfortable to inhabit. Moisture load reductions and safety improvements are also expected but could not be verified.

1
1 Introduction
Durable, new-construction foundation insulation designs in compliance with the performance option of the Minnesota Energy Code have been well tested and documented (Goldberg and Huelman 2005; Goldberg et al. 2010). Generally these solutions have been developed without overt consideration of life cycle cost. However, in a retrofit application, economic considerations are of primary significance, particularly if the homeowner is funding the retrofit. Payback periods of 4–5 years are generally required to make a persuasive case. Finding cost-effective foundation insulation retrofit solutions that are also durable is difficult, requiring a great deal of design and analytic sophistication.
Standard approaches to basement insulation retrofits generally fall into two categories: (1) an exterior approach requiring full-depth excavation and installation of exterior rigid foam; and (2) an interior approach involving construction of an interior stud wall with either insulated cavities or rigid foam between the foundation wall and stud wall. While an exterior insulation retrofit is ideal from a moisture safety perspective, the excavation work necessary is often prohibitively expensive and disruptive, leading many homeowners to select an interior approach. Unfortunately, because of the complex and variable nature of moisture flows and vapor drives through hollow-core masonry block basement walls, and difficulties with necessary air sealing steps, typical interior retrofit approaches often aggravate moisture issues.
A successful foundation insulation retrofit in a cold climate requires a cost-effective solution that avoids both full-depth exterior excavation and risky interior insulation. This project is aimed directly at fulfilling this need.
1.1 Motivation Cost-effectively retrofitting masonry block foundations is a very challenging undertaking because myriad hygrothermal issues prevail to a greater or lesser extent in the target retrofit housing stock:
• Absence of a capillary break at the footings
• No waterproofing of the exterior wall surface (damp-proofing, even if intact, does not address bulk water incursion and does not provide an adequate vapor retarder, 0.1 perm or less is needed in this case)
• No water separation plane (WSP) between the wall and the rim-joist cavity or its components
• Poor or no footing drainage
• Wet and/or frost-susceptible soils
• Wet open block cores often with standing water at their base above the footing
• High interior humidity in the cooling season.
Most of these issues also apply to poured concrete foundations and to masonry block foundations with their cores filled. However, when masonry block walls with unfilled cores are retrofitted

2
with interior insulation, the open cores exacerbate the hygrothermal problem because natural convection in the core cavities transports vapor from the footings to the top of the wall during the heating season, when it condenses and freezes. This freezing and subsequent thawing action can cause structural damage to the above-grade (AG) wall such as interior spalling that can reduce web and flange thicknesses to structurally unsafe levels. Further, upon thawing, the condensate produces a wet AG wall that creates a high moisture source for the rim-joist cavity. Thus, inhibiting drying of the rim-joist cavity by improper insulation or installation of a vapor retarder can cause severe mold and rot problems in the rim assembly. This is particularly true for rim-joist interior insulation covered with a warm-side polyethylene vapor retarder that is common in current foundation wall insulation retrofit practice (these retrofits currently are not covered by the Minnesota building code, for example). Clearly, for masonry block walls with hollow cores, these problems increase in severity with increasing AG wall exposure. This is a particular issue for the target retrofit housing stock in which AG wall exposures of 2 ft or larger are fairly common.
In light of these problems, this research proposes a different approach based on insulating core fills and a mostly AG installation of exterior insulation. In this case, the proposed insulation retrofit packages are designed to help address—rather than exacerbate—these issues. To understand the applicability and actual performance improvements offered by the proposed retrofit packages, this research addresses the following important questions:
1. What are the characteristics and configurations of typical foundations in the targeted retrofit market (climate zones 6 and 7 built before the 1990s), including construction type, presence or absence of core fills in block construction, height AG, and history of moisture performance?
2. Is it currently possible to simulate natural convection in open-core concrete block walls below grade (BG, also referred to as buoyant cavity flow)? What are the effects on the wall’s thermal conductivity? Also, is it possible to use a steady-state equivalent thermal conductivity to model year-round transient heat flows through basement walls?
3. What types of retrofit insulation packages have the greatest impact on energy use, and are savings significant compared to whole-house energy use? What are the impacts of basement wall configuration (i.e., height AG and presence of mortar droppings in the concrete block cavities) on those savings?
4. Can the proposed retrofit insulation packages improve occupant comfort in the basement zone without resorting to risky (from a moisture safety perspective) interior insulation? If so, which insulation packages have the greatest impact?
5. Can the proposed retrofit insulation packages significantly improve the moisture safety of open-core concrete block foundation walls by eliminating convection within the cores and warming the wall? Does the insulation improve moisture safety in the adjoining rim joist?
To conclude, the proposed insulation retrofit packages are aimed at developing a cost-effective foundation wall retrofit that provides benefits to energy use, occupant comfort, and moisture safety, while eliminating the increased moisture risks associated with BG interior insulation.

3
1.2 Previous Work To conclusively address these issues and provide a fully durable interior foundation retrofit solution, a system must be installed in full compliance with the foundation performance option in the 2009 Minnesota Energy Code (Minnesota Statutes Chapter 1322, Section N1102.2.6.12), with additional provisions to deal with the structural issues that can arise with hollow masonry block walls. Examples of such systems for zone 6 and 7 climates can be found in Goldberg and Huelman (2005). A version of one of these systems has been proposed by Ueno and Lstiburek (2012) as a standard retrofit measure that requires the installation of a continuous WSP from the outside top edge of the wall to the top of the interior basement slab. According to Ueno and Lstiburek, this would require lifting the house off its foundation so the WSP could be applied to the wall top, a potentially expensive solution for the average homeowner.
Goldberg et al. (1996) showed experimentally that a full basement with unfilled core masonry block walls has a 4% higher heating energy consumption than a basement with poured concrete walls with the identical geometry. Filling the cores with an artificial lightweight aggregate (LWA) (made from paper mill sludge and boiler fly ash) reduces the basement energy consumption by 16% under calorimetric conditions.1 Shipp (1983) conducted an experimental evaluation of buoyant cavity flows in hollow masonry block walls. Based on the results, he concluded that the differences between conventional, steady-state circular arc foundation heat transfer calculation2 methods and the experimental results did not invalidate these methods. Thus, a steady-state approach to calculating the effective wall thermal conductivity was adopted for this project.
In a follow-up study using a similar approach, McBride (2013)3 tested the effects of convection in open-core concrete block walls on steady-state thermal conductivity. In the same study, McBride compared steady-state R-values, calculated using the circular arc method, to experimentally test steady-state R-values derived from hot box chamber tests. While hot box chamber tests include the effects of convection, the circular arc method does not. McBride then repeated the calculations and experimental tests with the block cores filled with sand. Differences in thermal conductivity were primarily attributable to convection loops within the open cores. Convection was found to be the major driving force behind thermal transfer in the open cell blocks. McBride concluded that for this limited test using steady state conditions, heat transfer and results were too complex to suggest improvements to the “arc-length model” (circular arc) methodology. This conclusion is supported by the simulation analyses conducted during this project.
1 Calorimetric conditions describe the case in which the interior surface of the basement is held constant; the energy required to keep the interior temperature stable is therefore equal to the heat loss through nonadiabatic surfaces (exterior walls and basement slab floor exposed to exterior conditions). 2 A circular arc heat transfer calculation can be used to calculate the U-value of a BG wall, including the effects of the ground when the wall is under steady-state conditions. In this case, the heat flow path from the outside surface of the foundation wall follows a circular path to the surface at grade, with the center of the circle located exactly at grade on the outside wall surface. Thus, the length of the heat flow path at any depth is given by the quadrant of a circle with radius equal to depth BG. This approach enables the U-value of the ground to be calculated analytically. 3 This paper was published well after the modeling aspects of this project were completed.

4
1.3 Scope of Work This project has five primary areas of focus, intended to assess the following: (1) the general need for, and applicability of, the proposed retrofit solutions; (2) convection effects on thermal conductivity in hollow masonry block foundations; (3) energy savings and thermal performance offered by the retrofit solutions; (4) improvements to occupant comfort in BG space; and (5) improvements to moisture safety within the foundation and rim-joist assemblies.
1. Use survey results from partner organizations to develop an understanding of the distribution and performance of foundation walls in the target retrofit housing stock. This includes determining the proportion of foundations with masonry block walls and the extent to which these walls have filled or partially filled cores. Additionally, the survey determines foundation age, average wall height AG, and moisture performance (limited to qualitative assessments based on observation). These data demonstrate the applicability of the proposed retrofit solutions and test configurations.
2. Conduct a computational fluid dynamics (CFD) analysis of representative hollow masonry block walls to quantify convection and the thermal impacts of that flow. These data are used together with thermal performance data from actual wall assemblies built and tested at the Foundation Test Facility (FTF) in Cloquet, Minnesota, to provide accurate thermal conductivity inputs for Building Foundation Energy Transport System (BUFETS)/Building Energy Modeling (BEM) energy modeling.
3. Evaluate the thermal performance of the retrofit insulation packages as well as the baseline (reference) case using the BEM energy analysis methodology deployed in the preceding foundation insulation project (Goldberg and Steigauff 2013) and briefly described in Section 3.1.2. Use Building Energy Optimization (BEopt™) software to generate the house model used in the BEM calculations, in compliance with National Renewable Energy Laboratory (NREL) requirements. Calculate energy savings from the simulations in terms of living and basement zones, for both heating and cooling. Calculate total building energy savings (site and source).
4. Calculate foundation wall surface temperatures and basement zone air temperatures as part of the EnergyPlus energy model simulations. Compared to the baseline, these temperatures demonstrate the improvements to occupant comfort afforded by the proposed retrofit solutions.
5. Perform a hygrothermal analysis of the combined block wall and rim-joist assembly using the Wärme und Feuchte instationär (WUFI) 2D/equivalent soil layer (ESL) methodology. Test the baseline together with selected retrofit solutions. Simulate relative humidity (RH) and moisture content (MC) data from the foundation wall cores and rim-joist assembly to identify the hygrothermal durability and improvement offered by the retrofits.
While a comparison between the performance of full-depth, BG exterior insulation and the proposed core fill retrofit solutions would be informative, a full analysis of the exterior insulation approach is beyond the scope of this work. Kehrer and Christian (2012) completed one such study. However, the full-depth exterior insulation approach is used as a point of comparison for the cost analysis in Section 6, because exterior insulation is expected to provide comparable energy, comfort, and moisture control benefits.

5
The insulation retrofit packages proposed in this report are based on the performance option in the Minnesota Energy Code as well as the experimental energy performance data for masonry block walls. These solutions have the following elements:
• Filling the cores of the masonry block walls to provide enhanced air and vapor sealing of the rim joist and eliminate the convective airflows.
• Adding an external WSP that extends from above the rim-joist cavity to 1 ft BG
• Adding exterior rigid insulation over the external WSP and protecting this insulation from ultraviolet light, water infiltration, and physical damage.
The proposed package of measures is in compliance with the Minnesota Energy Code hygrothermal performance criteria. It is expected to provide energy savings for hollow masonry block foundation walls comparable to conventional full-wall exterior or interior insulation, particularly for walls with substantial AG exposure. Because of the apparent simplicity of the retrofit that can be accomplished essentially from the exterior, it is also expected to be relatively inexpensive. As suggested by the experimental FTF data, on a full-basement, calorimetric basis with the interior temperature held constant, the energy savings from filling the walls with a LWA were measured to be 16%.4 On a noncalorimetric basis that reflects standard residential practice, the savings can be expected to be about half the calorimetric savings. Adding AG exterior insulation will increase these savings. The package also offers the potential of creating a durable base platform to which full-wall interior insulation can be added as a secondary retrofit measure with lower hygrothermal risk. Finally, filling the cores can yield advantages for wall and subslab depressurization radon mitigation strategies.
On a practical level, a closed-cell spray polyurethane (CCSPU) core fill is typically accomplished using liquid, pourable, closed cell polyurethane foam. The foam is specially formulated for BG conditions, but is otherwise similar to conventional two-part polyurethane and can be installed using the same basic equipment. Typically, the spray nozzle on the applicator wand is removed and replaced with a 6-in. long tube. Removing the nozzle allows the foam to exit in a pourable state, rather than a spray, while the 6-in. tube helps the installer direct the liquid down into the cores.
4 http://www.buildingfoundation.umn.edu/res98_99.htm. In conditions with a floating basement temperature; that is, a noncalorimetric situation in which the basement temperature varies as a function of enclosure insulation, the effect is to increase the interior temperature, rather than to decrease the enclosure heat flux. Thus, the noncalorimetric enclosure heat flux savings yielded by foundation insulation are about 50% of the calorimetric heat flux savings.

6
2 Foundation Survey
According to Labs et al. (1988), for the period 1979–1983 in climate zones 6 and 7, 92.5%–99% of new construction comprised full basements or crawlspaces; the latter had a 0%–7% share of the total. This distribution is likely representative of previous years as well, so it is reasonable to assume that almost all houses in the target retrofit pool (constructed in climate zones 6 and 7 from 1900 to 1990) have either basements or crawlspaces. The foundation survey was conducted to confirm this assumption and to develop a fuller understanding of the foundations in this retrofit pool, including: (1) construction type (poured, block, other); (2) presence or absence of core fills in block construction; (3) exposure height AG; and (4) history of moisture performance. The answers to these questions helped guide and determine the applicability of the proposed retrofit solutions and test configurations.
2.1 Survey Methodology The foundation survey was administered by energy auditors from three industry partners in the St. Paul/Minneapolis seven-county metropolitan area. These partners regularly conduct energy audits as part of utility audit programs required for various rebates, low-income weatherization programs, and voluntary neighborhood engagement programs. Energy auditors from these three partners completed the short foundation survey as an additional step in their standard audit process. The survey format is available in Appendix A. To answer the survey questions, nondestructive visual inspections were made of the foundations. Moisture performance was assessed qualitatively by looking for signs of past moisture intrusion such as stains, efflorescence, a musty smell, and standing water. For block wall construction, access to the cores at the rim joist was necessary to determine whether the cores were filled or open. When access was not available; for example, in the case of a concrete topping poured against the rim joist, a determination could not be made. No attempt was made to randomize the selection of homes for the foundation survey. Rather, the surveys show a representative sample of foundations taken from single-family and small multifamily homes in the metropolitan area that were audited by the industry partners in 2013. In all, 227 surveys were returned.
2.2 Survey Results Five surveys were removed from the data set because they contained no data. A significant number of those remaining lacked data in one or more fields. These fields were recorded as “no response.” Results from the 222 substantially completed surveys are shown in Table 1, grouped by response to the survey’s most significant questions. The values shown represent the number of homes tallied within each category.

7
Table 1. Foundation Survey Results
Foundation Wall Type
Distance to Grade
Siding Type
Wall Thickness
Access to Top of Wall
Core Top Open
Signs of Moisture
Poured 0–1 ft Brick 8 in. Yes Open Yes 22 34 13 101 90 27 33
Block 1–2 ft Stone 10 in. No Closed No 174 123 3 61 72 83 144
Slab 2–3 ft Stucco 12 in. No response No
access/ response
No response
1 51 52 15 60 90 45 No
Response > 3 ft and
other Other No response
25 11 150 45
No
response No
response
3 4
2.3 Survey Analysis One of the survey’s primary purposes was to help determine the distribution of poured versus block foundation walls. Anecdotal evidence suggested that the use of poured foundation walls has been increasing in the last few decades, while concrete block has been declining. Understanding this distribution and characterizing its change over time were crucial for determining the applicability of various retrofit solutions, including insulating block fills and exterior insulation. A graph depicting the number of block and poured foundation walls per decade is shown in Figure 1.
Figure 1. Foundation wall type by decade
05
101520253035404550
Num
ber o
f Fou
ndat
ions
Foundation Wall Type
Other/No Rspns
Block
Poured

8
The distribution shown in Figure 1 does not indicate the actual numbers of houses that were built in the St. Paul/Minneapolis metropolitan region over this time span. However, the distribution does show the following trends:
• The greatest numbers of masonry foundations were built in the 1920s through the 1950s, except during the Great Depression era.
• Block wall construction reached its peak in the 1940s and 1950s, representing 97% of all foundation walls that were built during this period.
• The popularity of block foundation walls has been declining since then, with a notable exception in the 1980s.
• Poured concrete walls have represented close to 50% of construction beginning in the 1990s.
Overall within the target retrofit group, more than 78% of foundations were constructed with concrete block, while 10% were poured (see Table 2). Fewer than 1% of the foundations surveyed were slab on grade, demonstrating the overwhelming popularity of basements in the target region, climate zones 6 and 7. Again, the values shown in the table represent the number of homes tallied within each category; a percentage of the total is listed in the table.
Table 2. Ratio of Block Versus Poured Foundation Walls
Poured Block Slab No Response Total 22 174 1 25 222
9.9% 78.4% 0.5% 11.3% Within the subset of block walls, access to open cores is important for the proposed retrofit core fill solutions. Survey results show that open cores are frequently found, but do not represent the majority of block wall cases (see Table 3). After eliminating poured walls, open block cores are found 13.5% of the time. However, this includes many foundation walls that were never verified as concrete block, or for which there was no access allowing determination of open or filled cores. For the subset of foundations in which an open core or a filled core was determined, open cores were found 25% of the time.
Table 3. Ratio of Open Core Versus Filled Core (Block Walls Only)
Block—Open Core Block—Filled Core No Access/No Response Total 27 83 90 200
13.5% 41.5% 45.0% According to survey results (Table 4), moisture frequently intrudes within the target foundation retrofit pool, but most foundations appear to be functioning well in this regard. A rather small percentage (14.4%) of the foundations that were surveyed had visible evidence of current or past moisture intrusion. However, that calculation includes many foundations for which there was no response to this query. If surveys with no response are removed, close to 20% of the foundations had visible evidence of moisture.

9
Table 4. Evidence of Moisture
No Moisture Evident Moisture Evident No Response Total 145 32 45 222
65.3% 14.4% 20.3%
Figure 2 shows instances of foundations with visible moisture intrusion by decade of construction. These data show that older foundations typically have more moisture problems. This may primarily be due to foundation age and increased weathering or cracking of old foundation walls and floors, but better construction practices such as installing interior or exterior drain tile may also play a role. Not including surveys with “no response” answers, the percentage of foundations with visible moisture intrusion ranges between:
• 20%–40% for foundations built between 1900 and 1940
• 8%–16% for foundations built between 1940 and 1980
• 0%–4% for foundations built between 1980 and the 2010.
Figure 2. Evidence of moisture issues by decade
A large number of surveys in the 1990s and 2000s contained “no response,” reducing the sample size markedly for these decades.
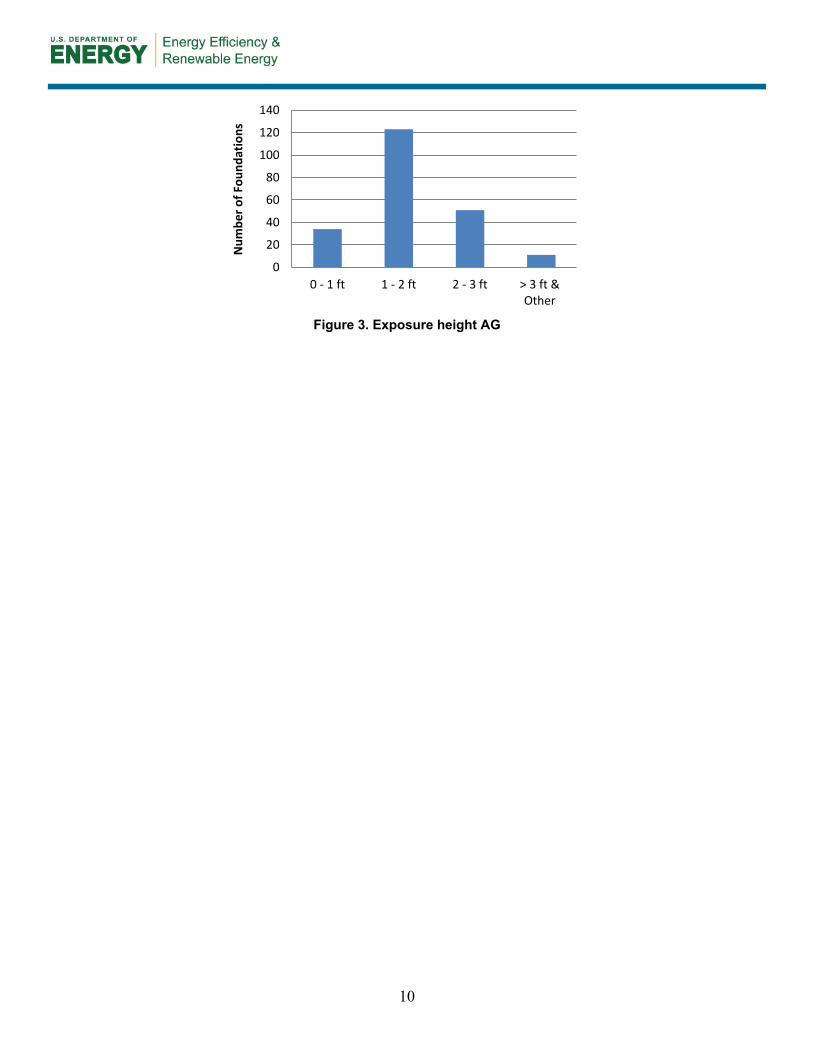
Foundation wall exposure AG is an important issue because it affects heat loss and interior wall surface temperatures, especially for poorly insulated foundations in the target retrofit pool. Survey results show that most of these foundations have a 1- to 2-ft exposure AG, accounting for 55% of the foundations surveyed (see Figure 3). Exposures larger than 2 ft account for 28% of the foundations surveyed, and exposures smaller than 1 ft account for the remaining 15%.
0
5
10
15
20
25
30
35
40
45
50
Num
ber o
f Fou
ndat
ions
Moisture Issues
No Rspns
No Moisture Evident
Moisture Evident
10
Figure 3. Exposure height AG
0
20
40
60
80
100
120
140
0 - 1 ft 1 - 2 ft 2 - 3 ft > 3 ft &Other
Num
ber o
f Fou
ndat
ions

11
3 Energy Performance Modeling
Heat loss through basement foundation walls is a significant component of overall heat loss in typical single-family and small multifamily homes. The issue has become more important as occupants increasingly view basements as habitable space and seek to condition them. Energy performance simulations were conducted to determine the fraction of overall heat loss from basement foundation walls, and to measure the expected energy improvements from the proposed insulation retrofit packages. However, calculating heat loss through basement foundation walls is a difficult challenge because of the complexities of transient moisture transport in soils and convection (buoyant cavity flows) in hollow masonry block walls. Convection was shown experimentally to have a significant impact on the seasonal thermal performance of uninsulated basement walls5 on a transient, seasonal basis. Under calorimetric measurement conditions in which the interior basement temperature was held constant, a hollow-core masonry block wall yielded a 4% higher wall heat transfer compared to a poured concrete wall. Furthermore, as the convective airflows transiently vary in strength according to the temperature conditions experienced by the wall, the wall assembly effective R-value varies significantly over time on both diurnal and seasonal scales.
3.1 Methodology Table 5 shows the retrofit insulation packages that were modeled for this report: (1) LWA core fill only; (2) CCSPU core fill only; and (3) CCSPU core fill with R-10 exterior extruded polystyrene foam (XPS) extending to 1 ft BG. These three options were modeled in four configurations: an AG exposure of 2 ft with and without the bottom 33% of the cores filled with porous concrete, and an AG exposure of 4 ft with and without the 33% porous concrete fill. The 33% concrete core fill cases were included to illustrate the effects of mortar droppings on the energy performance of the retrofit insulation packages. In addition, an air-filled core with a 2-ft AG exposure was modeled as the reference case. The thermal conductivity of this wall was based on experimental results, because it could not be accurately determined with the simulation approach used for the solid core cases (see Appendix B). The process used to determine the thermal conductivity of the air core is described more fully in Section 3.1.1.
An experimental thermal conductivity value was not available for the air core case with a 4-ft AG exposure, so the LWA cases were also used as reference cases. The energy savings are also reported with reference to the LWA cases.
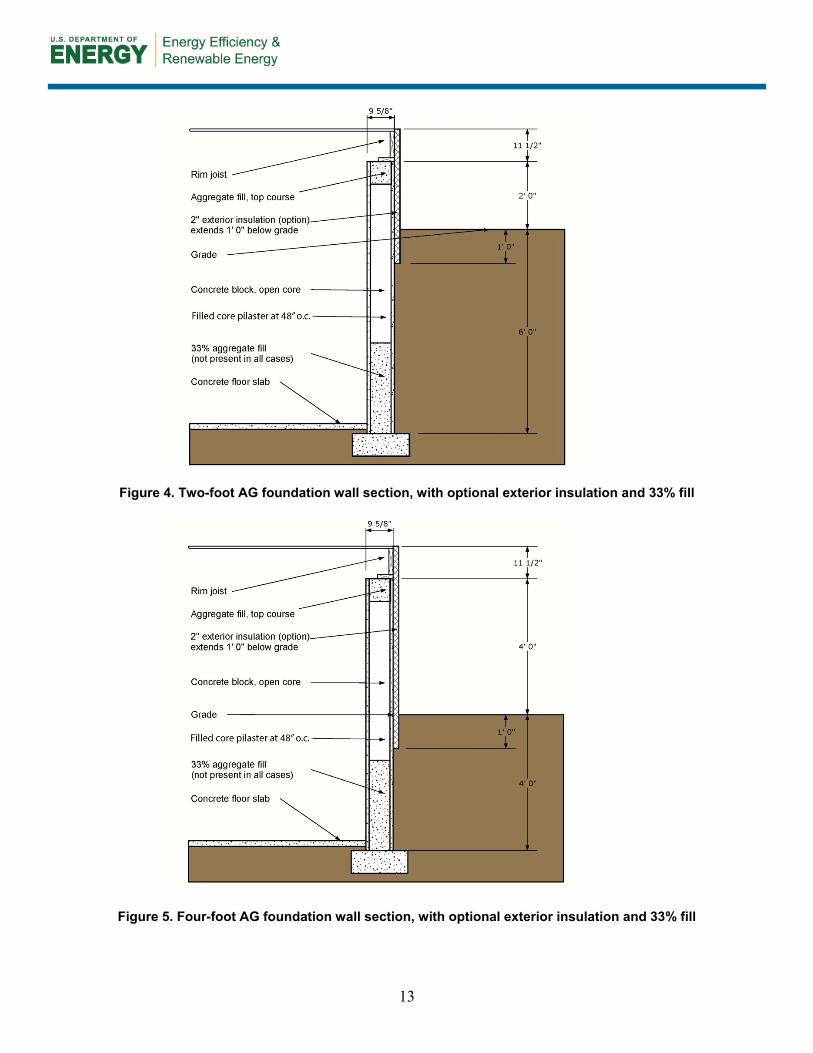
The layouts for the modeled foundation wall assemblies are shown in Figures 4 and 5. Although the concrete block cores were assumed to be generally open, in every case the top course cores were filled with aggregate, acting as an air barrier between the core and the rim-joist cavity. In cases with 33% concrete fill, the bottom one-third of the cores were also filled and only the remaining open section of the cores was insulated with CCSPU or LWA. For all other cases, the entire height of the core was filled down to the footing.
5 http://www.buildingfoundation.umn.edu/res98_99.htm. This has been confirmed by recent unpublished experimental research in which the transient temperatures and humidity’s in the cores of hollow masonry block walls have been measured.

12
Table 5. Modeled Retrofit Insulation Packages
AG Height (ft) 2 4
Porous Concrete
Fill Height (%)
0 33 0 33
Amount of Insulation
(%) 100 100 100 100
Core Fill Material
Air (reference
case) CCSPU
CCSPU with R-10 exterior XPS to
12-in. BG rim
LWA (reference
case) CCSPU
LWA (reference
case) CCSPU
CCSPU with R-10 exterior XPS to
12-in. BG rim
LWA (reference
case) CCSPU
LWA (reference
case)
13
Figure 4. Two-foot AG foundation wall section, with optional exterior insulation and 33% fill
Figure 5. Four-foot AG foundation wall section, with optional exterior insulation and 33% fill

14
3.1.1 Foundation Wall Heat Transfer Calculation Methodology To calculate heat transfer savings for the proposed insulation packages, thermal conductivity values for the various foundation wall sections had to be calculated first. The air core case posed the greatest difficulty because of buoyant cavity flow within the hollow cores. The results and methodology for this case are discussed in greater detail in Appendix B. The calculation methodology was based on an assertion by Shipp (1983), who stated that conventional steady-state circular arc foundation heat transfer calculations yield equivalent wall thermal resistances within 10% of those measured, as long as a foundation wall is not partially insulated on the interior. Based on this assertion, a two-dimensional (2-D), steady-state CFD simulation (using ALGOR software) was used to calculate the equivalent thermal conductivity of the hollow masonry block wall’s air core. (This step was not necessary for completely filled walls.) The resulting thermal conductivity of the air core was used in a steady-state, three-dimensional (3-D) simulation (again ALGOR) of a masonry block wall to determine the equivalent thermal conductivity of the entire wall assembly. For solid core foundation walls, the thermal properties of the solid fill materials were used directly in this step. The whole-wall equivalent thermal conductivity, or k-value, was then used as an input for the BEM energy modeling sequence, outlined in Section 3.1.2, and described fully by Goldberg and Steigauf (2013).
The steady-state approach yielded satisfactory equivalent thermal conductivities for use in a transient/seasonal analysis for solid core walls, in agreement with Shipp. However, the steady-state approach proved inaccurate for hollow masonry block walls with air cores experiencing buoyant cavity flow. When comparing the hollow core BUFETS output results to the single available experimental case with a hollow masonry block core and a 1-½-ft AG exposure (Goldberg 1999), the simulated heating season energy transfer through the wall was about 28% less than that measured experimentally. That is, the steady-state calculation significantly underestimated heat transfer compared to empirical results. Further CFD investigation identified the reason: airflow velocities within cores experiencing steady-state conditions could be two to three times lower than the air velocities in cores under transient conditions—and lower air velocities result in reduced heat transfer. Thus, a steady-state calculation cannot be used to accurately model seasonal (transient) thermal performance for hollow-core masonry block walls.6
At this point, the initial methodology proposed to simulate the thermal conductivity of the air core cases with steady-state models had to be altered, because the initial assumption was clearly incorrect. Furthermore, simulating the dynamic conditions within dozens of open cores found in a full 3-D foundation model is not currently tractable. For this reason (with the consent of NREL), the attempt to simulate the thermal performance of hollow masonry block walls was abandoned. Thus, only a single hollow masonry block wall case is included in the results—that for which experimental data were available and the transient equivalent wall thermal properties could be computed.
6 The model was in agreement with the experimental results generated by Shipp when the cores were filled with sand.
15
3.1.2 Basement Heat Flow (BUFETS) and Whole-House Energy Savings (BEopt) Methodology
Once equivalent thermal conductivities (k-values) for foundation walls were calculated, they were used as inputs for the basement heat flow and whole-house energy savings simulations. This simulation sequence was complex, involving multiple energy models from three separate programs. A complete methodology for this process, termed BEM, is given in Goldberg and Steigauff (2013). Only the key steps are summarized below.
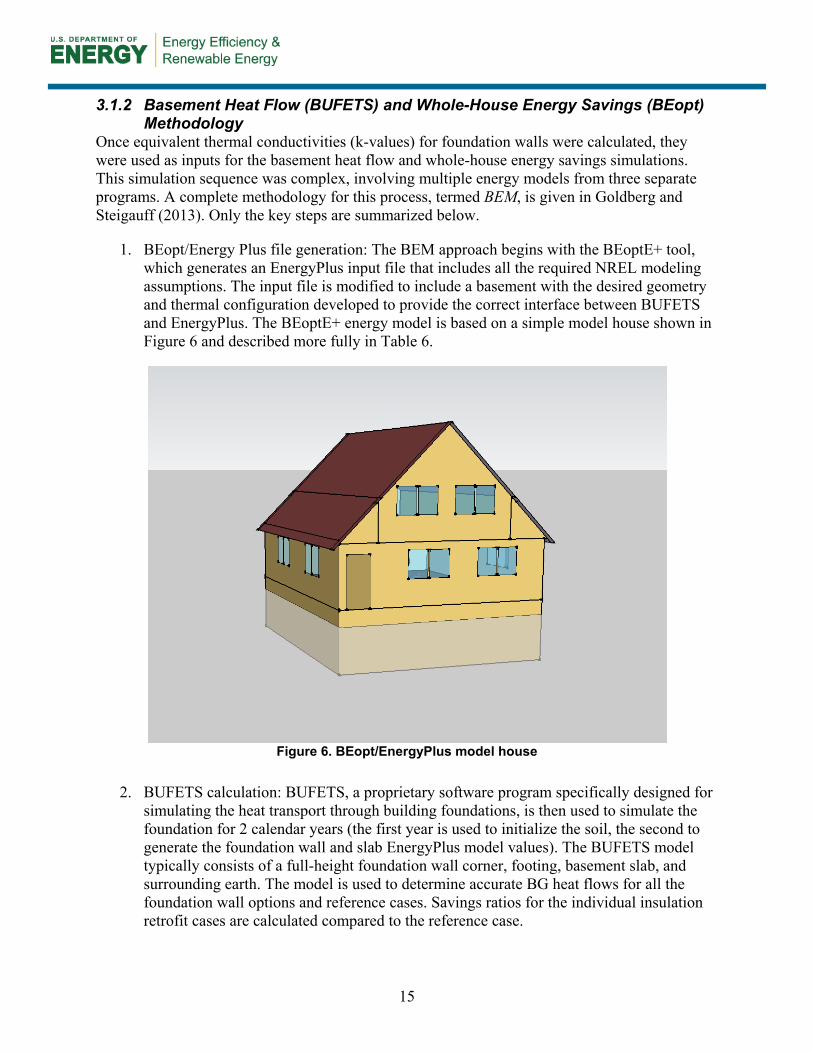
1. BEopt/Energy Plus file generation: The BEM approach begins with the BEoptE+ tool, which generates an EnergyPlus input file that includes all the required NREL modeling assumptions. The input file is modified to include a basement with the desired geometry and thermal configuration developed to provide the correct interface between BUFETS and EnergyPlus. The BEoptE+ energy model is based on a simple model house shown in Figure 6 and described more fully in Table 6.
Figure 6. BEopt/EnergyPlus model house
2. BUFETS calculation: BUFETS, a proprietary software program specifically designed for simulating the heat transport through building foundations, is then used to simulate the foundation for 2 calendar years (the first year is used to initialize the soil, the second to generate the foundation wall and slab EnergyPlus model values). The BUFETS model typically consists of a full-height foundation wall corner, footing, basement slab, and surrounding earth. The model is used to determine accurate BG heat flows for all the foundation wall options and reference cases. Savings ratios for the individual insulation retrofit cases are calculated compared to the reference case.

16
3. Energy Plus/BUFETS coupling: EnergyPlus is then run with the BUFETS foundation values to generate the BEoptE+ energy performance report. However, because EnergyPlus invokes a purely one-dimensional (1-D) foundation heat transfer model while the actual heat transfer is 3-D, the coupling wall element7 thermal conductivity used in EnergyPlus is determined by iteration until the EnergyPlus BG wall annual heat transfer matches that calculated by BUFETS. Specifically, this iteration process within EnergyPlus is used to find a thermal conductivity value for each wall case which matches the calculated BUFETS savings ratio (BUFETS case/BUFETS reference case = EnergyPlus case/EnergyPlus reference case) As yet the energy performance report cannot be imported back into BEopt for further analysis, so the report is used directly to evaluate whole-house energy use.
4. Performance report: The BEoptE+ energy performance report provides total household energy use and heating and cooling energy transfer for all components of the house. Site energy is converted to source energy using conversion factors listed in Table 7. However, for the model house tested in this project, only electricity and natural gas factors were used.
Table 6. EnergyPlus Model House Characteristics
Model House Characteristics General Characteristic Specification
Housing Type Single-family, two-story Occupancy 2.64 Location Minneapolis/St. Paul, latitude/longitude: 44.88/–93.2
Weather Minneapolis-St. Paul International Airport, 7,565 heating degree days, 751 cooling degree days
Construction AG: wood frame, BG: concrete block Total Floor Area 3,035 ft2
Total Finished Area 2,675 ft2, including 1,008-ft2 finished basement Conditioned Floor Area 2,675 ft2
Footprint 36 ft × 28 ft Conditioned Volume 19,080 ft3
Basement Zone Height 8 ft 7 ¼ in. First Floor Zone Height 8 ft
Second Floor Zone Height 14 ft 4-¾ in. at ridge, 5 ft 4-¾ in. at side attic Grade Height 2 ft or 4 ft below top of foundation wall (depends on case)
Glazing Characteristics Specification Glazing Area Ratio
(Window/Wall) North: 8.5%, East: 14.5%, South: 11.8%, West: 8.0%,
Total: 10.8% Glazing Area 195 ft2
Glazing U-Value 0.54 Glazing Solar Heat Gain
Coefficient Value 0.48
7 A fictitious, nonmassive element with a defined R-value only.

17
Model House Characteristics Envelope Characteristics Specification
Roof Area 916 ft2 finished, 509 ft2 unfinished Roof R-Value R-16.0 finished, R-1.4 unfinished
Framed Wall Area 1380 ft2 Framed Wall R-Value R-8.9 Basement Wall Area 987 ft2
Basement Wall R-Value Variable (depends on case) Rim Area 115 ft2
Rim R-Value R-2.0 Door Area 20 ft2
Door U-Value 0.24 Floor Slab Area 768 ft2
Floor Slab R-Value R-10.1 Air Exchange Characteristics Specification
Infiltration Rate Effective air leakage area = 172.6 in.2 Mech. Ventilation Rate 0.075 ACH
Equipment Characteristics Specification
Equipment Refrigerator, range, dishwasher, washing machine, clothes
dryer, sink disposal, microwave oven, central air conditioning, water heater
Heating Equipment Forced-air furnace, natural gas Heating Efficiency Burner efficiency = 76% Heating Set Point Per ANSI/ASHRAE standard 160
Cooling Equipment Central air conditioning, electric Cooling Efficiency 9.26 seasonal energy efficiency ratio Cooling Set Point Per ANSI/ASHRAE standard 160
Water Heating Equipment 40-gallon tank water heater, natural gas Water Heating Efficiency 0.58 energy factor Plug and Process Loads 0.979 W/ft2 (0.242 W/ft2 finished basement)
Lighting Density 0.35 W/ft2 (same for finished basement)
Table 7. EnergyPlus Site-to-Source Energy Conversion Factors
Electricity 3.167 Natural Gas 1.084
District Cooling 1.056 District Heating 3.613
Steam 0.30 Gasoline 1.05
Diesel 1.05 Propane 1.05
Coal 1.05

18
3.2 Results An experimentally determined effective wall thermal conductivity was available for the 2-ft AG wall configuration with a full air core only—these data were not available for any other case that included an air cavity within the core. The remaining cases had filled cores only, and could be modeled accurately using thermal diffusion transport only. Thus, effective wall thermal transport properties could be calculated for all these cases for use in BUFETS.
The uninsulated, open-core concrete block wall was desired for the reference case to compare energy savings gained through the insulation retrofits. This comparison can be made for the 2-ft AG wall with a 0% concrete fill configuration. However, experimental thermal conductivity values were not available for a full height air core in the 4-ft AG configuration, so this could not be used as a reference for the 4-ft AG wall cases. Thus, for this configuration, the full height core LWA-filled case was chosen as the reference case. Whole-house energy results shown below are presented in two sections. First, results are given for the 2-ft AG wall only with a full air core as the reference case. Then results are given for both the 2-ft and 4-ft AG cases, with the LWA core fill as the reference case against which savings are measured.
3.2.1 Thermal Conductivity Results As discussed previously, steady-state CFD modeling for the air core case failed to generate reasonable thermal conductivity values. Results from this analysis are shown in Appendix B. Rather, the thermal conductivity for the air core case was determined from calorimetric measurements of a corresponding test wall at the FTF. The remaining thermal conductivities for solid core cases (CCSPU and LWA) were determined using a steady-state ALGOR finite element code including thermal diffusion only. The whole-wall equivalent thermal properties (conductivity, heat capacity, and density) for all the cases are shown in Table 8. The air core case has the highest thermal conductivity, primarily because of convective airflow and associated heat transfer within the open cores. Walls with 33% concrete fill have slightly higher thermal conductivities than their 0% counterparts, because their cores were filled with less insulation.

19
Table 8. Whole-Wall Equivalent Thermal Conductivity
2 4
0 33 0 33
Air CCSPU LWA CCSPU LWA CCSPU LWA CCSPU LWA
Wall Equivalent Thermal Conductivity,
k (W/mK) 1.0094 0.3875 0.6754 0.4610 0.7086 0.3704 0.6635 0.4480 0.7008
Wall Equivalent Density, ρ (kg/m3) 1236.7 1916.1 1621.0 2044.1 1847.3 1916.1 1621.0 2044.1 1847.3
Wall Equivalent Heat Capacity, C (J/kg.K) 653.2 435.1 687.9 516.8 673.4 435.1 687.9 516.8 673.4

20
3.2.2 Basement Heat Flow (BUFETS) and Whole-House Energy Savings (BEopt) Results
Basement heat flow and whole-house energy savings are shown in Tables 9 and 10. Table 9 shows the results for the 2-ft AG with 0% concrete fill configuration only, using the air core as the reference case. Table 10 shows the results for all configurations and solid core options using an LWA core as the reference case. The top two rows of each chart describe the basement wall configuration (2-ft AG, 4-ft AG, 0% concrete fill, 33% concrete fill, etc.). The third row lists the specific insulation case. At a minimum, each configuration was tested with both CCSPU and LWA core fills. In addition, the 0% concrete fill configuration was tested with the R-10 exterior insulation option, extending from 1 ft BG to the top of the rim joist. Site and source energy use and savings are presented first, followed by a breakdown of living zone (AG) energy use and basement zone (largely BG) energy use. At the bottom of the chart, basement and living zones are added together to show total building energy flow and savings. Heating “energy transfer” represents winter season heat loss across the envelope; cooling energy transfer represents summer season heat gain. The “basement zone” incorporates energy transfer across the foundation walls (AG and BG), the basement floor slab, and the rim joist. Site energy use incorporates heating and cooling equipment efficiencies and system losses. Source energy use is site energy use portioned between electricity and natural gas, then multiplied by EnergyPlus source energy factors listed in Table 7.

21
Table 9. Whole-Building Annual Energy Performance Results, Air Core Reference Case
AG Height (ft) 2 Porous Concrete Fill Height (%) 0
Core Fill Material Air (reference case) CCSPU
CCSPU with R-10 exterior XPS to 12-in. BG rim
LWA
Source Energy (MMBtu) 271.77 262.02 253.09 266.73 Source Energy Savings (%) N/A 3.6 6.9 1.9
Site Energy (MMBtu) 181.91 173.42 165.85 177.54 Site Energy Savings (%) N/A 4.7 8.8 2.4
Living Zone Heating Energy Transfer (MMBtu) 79.81 75.31 71.27 77.52 Living Zone Cooling Energy Transfer (MMBtu) 17.10 16.93 16.55 17
Living Zone Total Energy Transfer (MMBtu) 96.91 92.25 87.82 94.53 Living Zone Total Energy Fraction (%) 88.2 89.2 90.1 88.7
Basement Zone Heating Energy Transfer (MMBtu) 11.21 9.53 8.13 10.32 Basement Zone Cooling Energy Transfer (MMBtu) 1.8 1.69 1.53 1.71
Basement Zone Total Energy Transfer (MMBtu) 13.02 11.21 9.66 12.03 Basement Zone Total Energy Transfer Fraction (%) 11.8 10.8 9.9 11.3 Basement Zone Total Energy Transfer Savings (%) N/A 13.88 25.79 7.56
Building Total Energy Transfer (MMBtu) 109.93 103.46 97.48 106.56 Building Total Energy Transfer Savings (%) N/A 5.9 11.3 3.1

22
Table 10. Whole-Building Annual Energy Performance Results, LWA Core Reference Case
AG Height (ft) 2 4 Porous Concrete Fill Height (%) 0 33 0 33
Core Fill Material CCSPU
CCSPU with R-10 exterior XPS to 12-in. BG rim
LWA (reference
case) CCSPU
LWA (reference
case) CCSPU
CCSPU with R-10 exterior XPS to 12-in.
BG rim
LWA (reference
case) CCSPU
LWA (reference
case)
Source Energy (MMBtu) 262.02 253.09 266.73 263.28 267.24 266.32 252.92 274.35 268.49 275.34 Source Energy Savings (%) 1.8 5.1 N/A 1.5 N/A 2.9 7.8 N/A 2.5 N/A
Site Energy (MMBtu) 173.42 165.85 177.54 174.52 177.98 176.88 166.55 183.75 178.74 184.61 Site Energy Savings (%) 2.3 6.6 N/A 1.9 N/A 3.7 9.9 N/A 3,2 N/A
Living Zone Heating Energy Transfer (MMBtu) 75.31 71.27 77.52 75.91 77.76 77.07 71.05 80.66 78.06 81.1
Living Zone Cooling Energy Transfer (MMBtu) 16.93 16.55 17 16.95 17.01 17.34 16.72 17.60 17.41 17.63
Living Zone Total Energy Transfer (MMBtu) 92.25 87.82 94.53 92.86 94.77 94.41 87.78 98.26 95.46 98.73
Living Zone Total Energy Fraction (%) 89.2 90.1 88.7 89 88.7 88.7 90.1 87.9 88.5 87.8
Basement Zone Heating Energy Transfer (MMBtu) 9.53 8.13 10.32 9.73 10.41 10.19 8.08 11.58 10.55 11.76
Basement Zone Cooling Energy Transfer (MMBtu) 1.69 1.53 1.71 1.69 1.72 1.81 1.58 1.93 1.83 1.95
Basement Zone Total Energy Transfer (MMBtu) 11.21 9.66 12.03 11.42 12.12 12 9.65 13.51 12.39 13.70
Basement Zone Total Energy Transfer Fraction (%) 10.8 9.9 11.3 11 11.3 11.3 9.9 12.1 11.5 12.2
Basement Zone Total Energy Transfer Savings (%) 6.83 19.71 N/A 5.76 N/A 11.19 28.56 N/A 9.6 N/A
Building Total Energy Transfer (MMBtu) 103.46 97.48 106.56 104.28 106.89 106.41 97.43 111.77 107.85 112.44
Building Total Energy Transfer Savings (%) 2.9 8.5 N/A 2.4 N/A 4.8 12.8 N/A 4.1 N/A
Notes: No rim joist, no AG wall. Foundation wall construction: R-1.9 fictitious layer/12-in. soil/8-in. concrete/½-in. gypsum. Slab construction: R-999.9 fictitious layer/12-in. soil/4-in. concrete.

23
3.3 Discussion of Results An analysis of basement heat transfer and whole-house energy savings can help answer many of the key research questions raised at the beginning of this report, including which of the proposed insulation retrofit packages save the greatest amount of energy, and whether those savings are significant compared to whole-house energy use; also, the impacts of basement wall configuration (i.e., height AG and the presence of mortar droppings in the concrete block cavities) on those savings.
3.3.1 Basement Heat Flow (BUFETS) and Whole-House Energy Savings (BEopt) Analysis
The total yearly basement energy transfer (sum of heating and cooling load) is shown in Figure 7 for each retrofit insulation option. Wall configurations with a 2-ft AG exposure are shown in blue and those with a 4-ft AG exposure are shown in green. The cases are further grouped into those with 33% concrete fill and those with 0% concrete fill.
Figure 7. Basement zone total energy transfer, 2-ft AG cases in blue, 4-ft AG cases in green
Clearly, the lowest total energy loss and greatest energy savings are provided by the options incorporating exterior insulation. The graph also shows that basement wall configurations with 4-ft AG exposure (green bars) lose substantially more heating and cooling energy than those with 2-ft AG exposure (blue bars), except for cases with exterior insulation. In addition, the impact of mortar droppings (33% core fill) is quite small, identified by the difference between the first and second groupings of cases. Finally, insulation retrofits relying on core fills alone provide limited

24
benefits in terms of increasing the energy performance of concrete block walls. These conclusions can be analyzed with greater specificity using percent savings reported in Tables 11 and 12.
Table 11. Retrofit Options Energy Savings Summary, Air Core Reference Case
AG Height (ft) 2
Porous Concrete Fill Height (%) 0
Core Fill Material Air
(reference case)
CCSPU CCSPU with R-10
exterior XPS to 12-in. BG plus rim
LWA
Basement Zone Total Energy Transfer Savings N/A 13.9% 25.8% 7.6%
Site Energy Savings N/A 4.7% 8.8% 2.4% Source Energy Savings N/A 3.6% 6.9% 1.9%
Table 11 lists percent energy savings for the 2-ft AG exposure with no concrete fill wall configuration only. Percent savings are calculated relative to the uninsulated hollow core reference case. Filling the cores with LWA reduced basement zone total energy transfer by 7.6% in the simulations; a CCSPU core fill nearly doubled that impact to 13.9%. Exterior insulation provided much more significant energy savings. The exterior insulation combined with a CCSPU core fill increased basement zone heating and cooling energy savings to 26%. The chart also contains summary information for the simulated home’s total site and source energy savings. Filling the uninsulated hollow-core basement wall with LWA reduced site and source energy use by 2.4% and 1.9%, respectively. The CCSPU core fill improved these savings to 4.7% and 3.6%, respectively. Adding exterior insulation nearly doubled these savings to 8.8% and 6.9%.
While the basement zone in the energy model was conditioned, the thermostat used to regulate house temperature in the energy model was on the first floor, not in the basement. Furthermore, the basement was heated with a minimal number of supply registers, resulting in zone air temperatures that were often 10°–20°F colder than the house set point during the heating season. If basement zone temperatures had been maintained closer to the house set point, heating energy loss in the basement zone would have been higher, especially for the uninsulated hollow core reference case. In turn, the savings offered by the insulation packages would have been greater.
Savings for the 4-ft AG exposure and 33% concrete fill configurations could not be calculated relative to an uninsulated hollow-core wall, because the air core case could not be simulated and these configurations had no experimental data. In lieu of the air core reference case, the LWA core fill cases were chosen for reference, and savings percentages were recalculated relative to them. These data are presented in Table 12.

25
Table 12. Retrofit Options Energy Savings Summary, LWA Core Reference Case
AG Height (ft) 2 4 Porous
Concrete Fill Height (%)
0 33 0 33
Core Fill Material Air CCSPU
CCSPU with R-10
exterior XPS to 12-in. BG
plus rim
LWA (reference
case) CCSPU
LWA (reference
case) CCSPU
CCSPU with R-10
exterior XPS to 12-in. BG
plus rim
LWA (reference
case) CCSPU
LWA (reference
case)
Basement Zone Total
Energy Transfer
Savings (%)
N/A 6.8 19.7 N/A 5.8 N/A 11.2 28.6 N/A 9.6 N/A
Site Energy Savings (%) N/A 2.3 6.6 N/A 1.9 N/A 3.7 9.9 N/A 3.2 N/A
Source Energy Savings (%) N/A 1.8 5.1 N/A 1.5 N/A 2.9 7.8 N/A 2.5 N/A

26
Once again, the exterior insulation doubled the energy savings compared to a CCSPU core fill alone. Basement zone energy savings for the exterior insulation option exceeded 28% compared to the LWA reference case. Site energy and source energy savings of 9.9% and 7.8% were found, respectively, with exterior insulation. Compared to an uninsulated hollow-core concrete block wall, savings would be even greater than those shown.
In conclusion, an LWA core fill had a very small impact in terms of whole-house energy use, and a CCSPU core fill was only marginally better. Thus, insulative core fills are of limited value from an energy savings perspective, although they provide other significant benefits, such as raising interior wall surface temperatures, as discussed in Section 4.3. In comparison, exterior insulation is quite effective, even when it extends only 1 ft BG. Exterior insulation was necessary to achieve more significant reductions (usually 5%–10%) in whole-house energy use.
The basement’s contribution to whole-house heating and cooling energy use can be analyzed as the fraction of total energy transfer that is due to the basement zone. Selected results from Table 10 are repeated in Table 13, showing the maximum and minimum fractions for 2-ft AG and 4-ft AG configurations. As expected, basement wall configurations with the least insulation are responsible for a greater share of the house’s total heating and cooling energy loss, up to 12.2% according to the simulation results; better insulated options reduce that fraction to 9.9%. These results indicate that basement zone heating and cooling energy transfer amounts to a significant fraction of total house energy loss, and for basements that are heated to a comfortable set point, that fraction would be even greater than those shown below.
Table 13. Basement Zone Fraction of Whole-House Energy Transfer
2-ft AG, Air Core
2-ft AG, CCSPU Core
With R-10 Exterior XPS
4-ft AG, LWA Core, 33%
Concrete Fill
4-ft AG, CCSPU Core
With R-10 Exterior XPS
Basement Zone Total Energy Transfer Fraction 11.8% 9.9% 12.2% 9.9%
The effect of AG foundation wall height can also play a strong role in basement zone energy loss. For example, increasing the AG exposure from 2 ft to 4 ft increases the basement zone total energy transfer by almost 1.5 MMBtu/year, or 12.5%, for a concrete block wall with an LWA core fill. However, as insulation levels are increased first by using a CCSPU core fill, then by applying R-10 exterior insulation, the impact of grade height and AG exposure declines markedly. As shown in Figure 8, with R-10 exterior insulation extending 1 ft BG, the total energy transfer is almost equal between the 2-ft AG case and the 4-ft AG case. Interestingly, this suggests that 2 ft of wall height exposed to ambient air temperatures and insulated to R-10 will lose as much heating and cooling energy over the course of a year as 2 ft of uninsulated wall height well below grade for a zone 6 climate.

27
Figure 8. Effect of AG height (2 ft versus 4 ft) on basement zone energy transfer
Mortar droppings can also impact the energy performance of basement walls, most noticeably when core fills are the primary means of insulation. Mortar droppings affect the energy performance of filled core concrete block walls by increasing conductive heat transfer while reducing the volume available for insulation fills. In this project, mortar droppings were modeled as a 33% concrete fill, located at the bottom of the cores, BG. In practice, if the mortar droppings were distributed between AG and BG locations, or concentrated AG, energy impacts could be greater.
Compared to the LWA core fill case with no mortar droppings (0% concrete fill), the LWA case with 33% concrete fill shows a 1.5% increase in total energy transfer. Likewise, when CCSPU core fill insulation is used, the mortar droppings increase total energy transfer by 3.3%. Thus, the impact of mortar droppings is greater when using insulating core fills with high R-values, but in both cases the overall impact is relatively minor. These results are shown in Figure 9 for the 4-ft AG cases. Furthermore, although the R-10 exterior insulation cases were not modeled with mortar droppings, it is assumed that the exterior insulation would almost entirely negate their energy impact, because a very small fraction of the wall’s thermal resistance is provided by the concrete block in these cases.
0.0
2.0
4.0
6.0
8.0
10.0
12.0
14.0
16.0
LWA core fill CCSPU core fill CCSPU core fill +ext. R-10
Base
men
t Zon
e To
tal E
nerg
y Tr
ansf
er (M
MBt
u)
Insulation Option
2ft AG configuration
4ft AG configuration
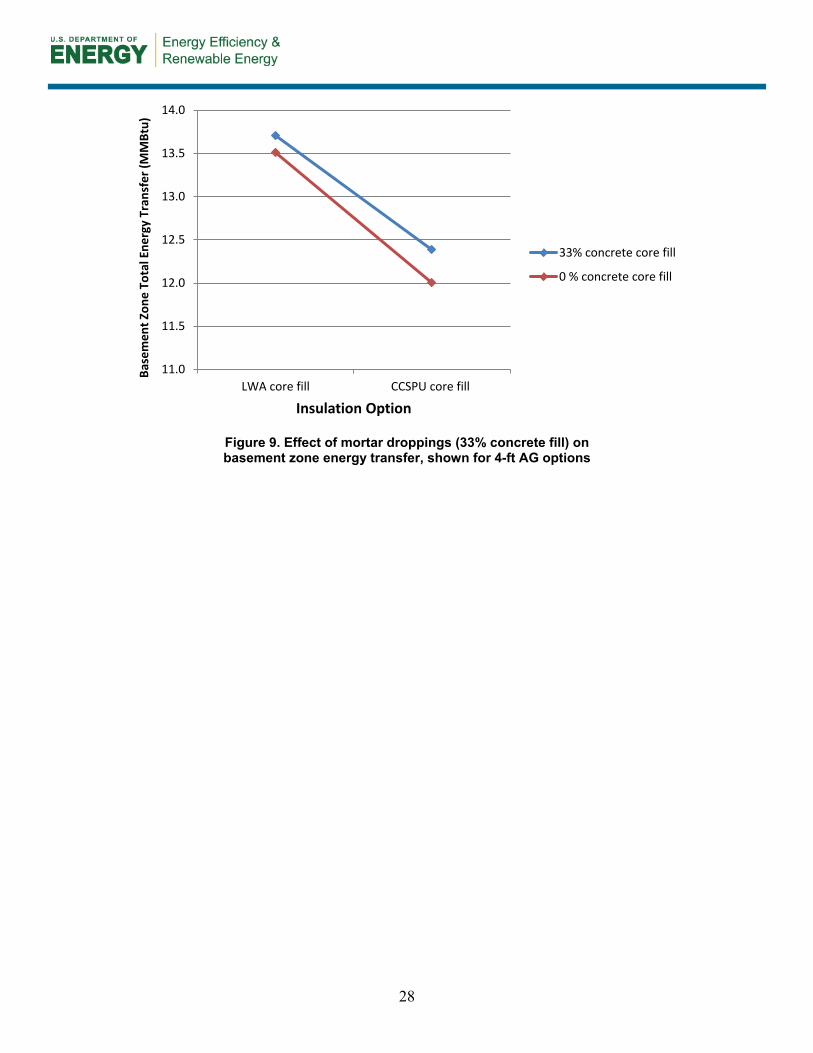
28
Figure 9. Effect of mortar droppings (33% concrete fill) on basement zone energy transfer, shown for 4-ft AG options
11.0
11.5
12.0
12.5
13.0
13.5
14.0
LWA core fill CCSPU core fill
Base
men
t Zon
e To
tal E
nerg
y Tr
ansf
er (M
MBt
u)
Insulation Option
33% concrete core fill
0 % concrete core fill

29
4 Space Temperature Modeling
For basements, insulation retrofits are often carried out to save energy and utility costs, and to make the space more comfortable for habitation. Even when active heating is used to keep air temperatures comfortable, uninsulated basements can feel cold because exposed concrete block walls and slab floors reduce the mean radiant temperature of the space below comfortable levels. To deal with this problem, many homeowners choose to construct insulated stud walls on the interior side of the foundation wall and install carpet over the floor slab, both of which are risky strategies from a moisture safety and indoor air quality perspective. The insulation retrofit packages selected for this research were intended to increase basement wall surface temperatures to a comfortable level without the use of risky interior insulation strategies.
4.1 Methodology Interior surface temperatures for AG and BG sections of the basement wall were tracked, along with basement zone air temperatures, for each retrofit case. Data were collected hourly over the course of 1 year from the BEoptE+ simulations. Basement wall surface temperatures were taken from the center of each wall section (north AG, north BG, south AG, south BG, etc.)
4.2 Results Air and surface temperature results for each retrofit insulation package are grouped together by wall configuration in Figure 10 through Figure 15. Within each configuration, the first graph shows AG wall surface temperatures, the second graph shows BG wall surface temperatures, and the third graph shows basement zone air temperatures. All surface temperature data were taken from the east wall of the simulation. The reference case (LWA core fill) for each configuration is always shown with a black line. Although the air core was tested in one configuration only (2-ft AG exposure with 0% concrete fill), it is repeated on the 2-ft AG exposure with 33% concrete fill graphs for comparison purposes. The graphs for the two configurations with 33% concrete fill are shown in Appendix D, for completeness.
Even though the basement zone was conditioned, air temperatures were allowed to fluctuate widely. This occurred because the controlling thermostat was located upstairs in the simulation and the number of heating registers supplying the basement zone was assumed to be minimal. However, the wide fluctuation in basement zone temperatures could then be used as an indicator for the success or failure of the insulation retrofits, in terms of improving space and surface temperatures.

30
Figure 10. AG surface temperature, 2-ft AG with no concrete fill
Figure 11. BG surface temperature, 2-ft AG with no concrete fill
0
5
10
15
20
25
30
Abov
e G
rade
Sur
face
Tem
p (C
)
2-ft AG, no concrete fill
Air Core CCSPU Core + Ext. foam
CCSPU Core LWA Core (Ref. Case)
0
5
10
15
20
25
30
Belo
w G
rade
Sur
face
Tem
p (C
)
2-ft AG, no concrete fill
Air Core CCSPU Core + Ext. foam
CCSPU Core LWA Core (Ref. Case)

31
Figure 12. Basement zone air temperature, 2-ft AG with no concrete fill
Figure 13. AG surface temperature, 4-ft AG with no concrete fill
0
5
10
15
20
25
30
Zone
Air
Tem
p (C
)
2-ft AG, no concrete fill
Air Core CCSPU Core + Ext. foam
CCSPU Core LWA Core (Ref. Case)
0
5
10
15
20
25
30
AG S
urfa
ce T
emp
(C)
4-ft AG, no concrete fill
CCSPU Core + Ext. foam CCSPU Core LWA (Ref. Case)

32
Figure 14. BG surface temperature, 4-ft AG with no concrete fill
Figure 15. Basement zone air temperature, 4-ft AG with no concrete fill
0
5
10
15
20
25
30
Belo
w G
rade
Sur
face
Tem
p (C
)
4-ft AG, no concrete fill
CCSPU Core + Ext. foam CCSPU Core LWA (Ref. Case)
0
5
10
15
20
25
30
Zone
Air
Tem
p (C
)
4-ft AG, no concrete fill
CCSPU Core + Ext. foam CCSPU Core LWA (Ref. Case)

33
In general, AG surface temperatures show the greatest variability because they are exposed to ambient outdoor air temperatures. BG surface temperatures are much more stable. As expected, wall surface temperatures are commonly colder than the basement air temperature, dragging down the mean radiant temperature of the space and reducing occupant comfort. In some cases, AG wall surface temperatures are significantly colder than BG surface temperatures. For example, when the AG surface temperature of the 2-ft AG configuration with air core approaches 32°F, the BG surface temperature stays above 43°F. However, options with more effective insulation such as the CCSPU core fill and CCSPU fill with R-10 exterior insulation show very little difference between AG and BG surface temperatures. Thus, with improved insulation the temperature gradient from top to bottom experienced by the basement wall is reduced.
Improved insulation is particularly important for the 4-ft AG configuration. For that configuration, basement zone and wall surface temperatures for the LWA fill reference case show a marked decrease and greater fluctuation in winter temperatures compared to the corresponding 2-ft AG configuration. With a CCSPU core fill combined with R-10 exterior insulation, there is almost no discernible difference in temperature conditions between 2-ft and 4-ft AG configurations. More quantitative analysis is contained in Section 4.3.
4.3 Analysis Seasonal average basement zone air temperatures and east wall inner surface temperatures were calculated for all cases for the winter period (November 1 through March 31). These results were separated by wall configuration and are shown in Tables 14–17.
Surveying the temperatures, it is apparent that a simple core fill using CCSPU or LWA is quite effective at raising both wall surface and air temperatures, at least for the 2-ft AG exposure. Compared to an open, air-filled core, the LWA core fill increases the average AG surface temperature by more than 5°F and the average basement zone air temperature by 3°F, while the CCSPU core fill increases the AG surface temperature by almost 10°F, and the air temperature by 6°F. However, for basement walls with a 4-ft AG exposure, a CCSPU core fill is required to raise all average surface temperatures above 50°F, and average air temperatures above 60°F. In all cases, shallow R-10 exterior foam raises both surface and basement zone air temperatures well above 60°F when combined with a CCSPU core fill.
Table 14. Average Winter Season Basement Temperatures, 2-ft AG No Concrete Fill
Air Core
LWA Core (reference case)
CCSPU Core
CCSPU Core + Exterior Foam
Average Basement Zone Air Temperature (°F) 57.7 60.7 63.6 68.9
BG Surface Temperature (°F) 53.0 56.4 59.9 66.3
AG Surface Temperature (°F) 49.0 54.1 58.7 65.8

34
Table 15. Average Winter Season Basement Temperatures, 2-ft AG 33% Concrete Fill
LWA Core (reference case)
CCSPU Core
Average Basement Zone Air Temperature (°F) 60.4 62.8
BG Surface Temperature (°F) 56.0 58.9 AG Surface Temperature (°F) 53.6 57.5
Table 16. Average Winter Season Basement Temperatures, 4-ft AG No Concrete Fill
LWA Core (reference case)
CCSPU Core
CCSPU Core + Exterior Foam
Average Basement Zone Air Temperature (°F) 56.3 61.2 69.1
BG Surface Temperature (°F) 51.0 56.8 66.5 AG Surface Temperature (°F) 49.0 55.8 66.1
Table 17. Average Winter Season Basement Temperatures, 4-ft AG 33% Concrete Fill
LWA Core (reference case)
CCSPU Core
Average Basement Zone Air Temperature (°F) 55.7 59.8
BG Surface Temperature (°F) 50.4 55.2 AG Surface Temperature (°F) 48.1 54.0
In Figure 16, the average basement zone air temperatures for each case are grouped by configuration, with 4-ft AG exposures shown together in green, and 2-ft AG exposures shown together in blue. For a given insulation option, the temperature difference between the 2-ft and 4-ft AG exposures is commonly 3°–5°F, for cases using a core-fill-only approach. However, the difference between the two cases incorporating R-10 exterior insulation is only 0.2°F. Thus, grade height does have a significant impact on surface temperatures and basement zone air temperatures for walls insulated with core fills only, but exterior insulation almost entirely eliminates this difference. The graph also shows that mortar droppings, represented by cases with 33% concrete fill, again have a very minor impact. Finally, compared to the impact of core fills, exterior insulation commonly accounts for most of the increase in basement zone air temperature.

35
Figure 16. Basement zone average air temperature for all cases

36
5 Hygrothermal Modeling
While core fills were quite effective at increasing foundation wall interior surface temperatures and basement zone air temperatures, their ability to block convection, and perhaps positively influence moisture conditions in the wall, rim joist, and adjoining basement space, is equally valuable. Within the target cold climate foundation retrofit pool, most masonry block foundations face difficult moisture challenges. These include:
• Absence of a capillary break at the footing
• Lack of exterior surface waterproofing (or waterproofing in poor condition)
• No capillary break between the concrete wall and wood rim-joist components
• Poorly graded wet soils
• No drainage provided at the footing
• Open block cores that can redistribute moisture from the footing, leading to increased moisture loads on the AG part of the wall and interior space.
Unfortunately, the installation of interior insulation and vapor retarder during typical basement insulation retrofits exacerbates these problems by cooling the foundation wall below the dew point and preventing inward drying. Structural damage of the rim joist and mold growth can result.
The proposed insulation retrofit package attempts to address these challenges in a number of ways.
• Installation of the external WSP behind the exterior insulation blocks capillary and bulk water flow from wet soil and cladding in contact with the rim joist and top of the foundation wall.
• LWA or CCSPU core fill prevents convection currents from transporting collected moisture at the footing to the AG portion of the foundation wall and potentially the rim joist.
• Exterior insulation warms the top of the foundation wall and rim joist, reducing risk of condensation and adsorption while improving inward drying potential.
5.1 Methodology To determine the moisture impact of these improvements, WUFI 2D v3.3 was used to simulate the moisture behavior of the concrete block basement wall and adjoining rim joist. WUFI 2D is available from the Fraunhofer-Institut für Bauphysik. It can simulate moisture transport in two dimensions through diffusion and capillary flow. It can also account for built-in moisture, periodic bulk water intrusion, and the wetting and drying effects of ventilation and air leakage from interior and exterior environments. WUFI also contains a database of stock materials with moisture-dependent functions describing thermal conductivity, heat capacity, vapor permeability, and other pertinent properties. Unfortunately, WUFI 2D cannot model moisture transport through buoyant cavity flow, which is one of the primary means of moisture redistribution within open-core concrete block walls. Further, bulk water transport in the soil cannot be modeled

37
explicitly, but must be approximated by empirical coefficients relating the bulk water diffusion to the water vapor diffusion represented by the RH. However, as soil humidities are typically saturated, this approach is of limited applicability (see Appendix C).
However, it was proposed that in the absence of buoyant cavity flows and bulk water leakage through the foundation enclosure, the last objection could be overcome by postulating an ESL that would represent the fluid mechanics of porous media in real soils by an equivalent material layer placed adjacent to the foundation walls and slab, thus eliminating the need to simulate the full soil domain. The equivalent flow coefficients for the ESL would thus have to be derived experimentally.8 Note that this is an experimental approach and its validity has not yet been established.
In this context, the WUFI 2D/ESL methodology has been applied to the two uninsulated, full height hollow-core masonry block configurations investigated in this report, namely, those with 2- and 4-ft AG wall exposures (see Figures B.1 and B.8). An experimental ESL layer was deployed with estimated transport coefficients based on previous research (Goldberg 2012). Further, as WUFI 2D is unable to in any way account for buoyant convective flows in the hollow masonry block cores, these cores were modeled using still air thermal and vapor transport parameters. For this hygrothermal analysis, only four cases were tested: a 2-ft AG exposure with an unfilled (open) core, a CCSPU-filled core, a 4-ft AG exposure with an unfilled core, and a CCSPU-filled core.
With these limitations, the purpose of the exercise was to determine whether there is any vapor coupling between the hollow cores and a sealed rim-joist cavity, and whether this coupling can be reduced by filling the hollow cores with CCSPU. In other words, whether it is indeed true that filling hollow masonry block cores (even in the less stringent condition in which buoyant cavity flows are ignored) reduces the vapor coupling of the walls to the rim-joist cavity.9
The interior temperature boundary conditions are in compliance with ASHRAE/ANSI standard 160 while a Minneapolis, Minnesota, Typical Meteorological Year 3 climate data are used for the ambient conditions. Figures C.1 and C.6 in Appendix C depict the 2-ft and 4-ft AG simulation models, respectively. Of crucial importance are that (1) the rim-joist cavity is vapor sealed with a 6-mil polyethylene membrane to isolate the cavity from the interior conditions; and (2) the floor sealing the cavity from above is exposed to the interior temperature and humidity boundary conditions. Further, there is no vapor retarder or waterproofing membrane between the sill plate and the wall or on the exposed top wall surface.
RH, temperature, and MC results were tracked for a variety of locations within the masonry block wall and adjoining rim-joist simulations. In general, RH and temperature results were taken from the top, middle, and bottom core of the wall, in addition to the rim-joist cavity center. MC results were taken from the interior face of the rim board, the top surface of the sill plate, and the top and bottom faces of the bond beam. The exact reporting locations are shown in the wall section in Figure 17, and remained essentially the same for both 2-ft and 4-ft AG configurations.
8 An experiment to collect the necessary experimental data is in progress. 9 This is also being investigated experimentally at the University of Minnesota’s Cold Climate Research Facility.

38
Figure 17. WUFI 2D Reporting locations for temperature, MC, and RH
5.2 Results WUFI 2D simulations were completed for each of the four cases described. The simulation results are questionable in light of the expected physical behavior of the hollow-core foundation wall system. Results are sufficiently doubtful that they are reported in Appendix C only, along with a discussion. The ultimate determination of the validity of this approach will be determined by experiments currently underway at the Cloquet Residential Research Facility. These experiments are measuring directly the coupling between the cores of hollow masonry block walls and a vapor-sealed rim-joist cavity.

39
6 Cost Analysis
Because basement insulation retrofits are generally carried out by homeowners, retrofit costs are of considerable importance (Table 18). Interior insulation retrofits are often chosen because costs are lower than exterior insulation options. However, standard interior approaches are risky from a moisture safety perspective, especially in retrofit situations where exterior drainage and intact water control layers cannot be assumed. For that reason, they are not recommended and have not been included in the following cost comparison. A full-depth exterior insulation approach, including installation of a new exterior water barrier, is included as a reference case because it offers improved moisture safety benefits similar to those afforded by the proposed approach. While a full investigation of the energy, temperature, and hygrothermal performance benefits of a full-depth exterior foundation insulation retrofit is outside the scope of this research, it is useful to include cost information to demonstrate the reduction in cost offered by the proposed approach. The cost data for the full-depth exterior insulation reference case were obtained from recent NorthernSTAR foundation insulation research (Mosiman et al. 2013).
6.1 Methodology Costs are based on the geometry of the BEopt/EnergyPlus model house shown in Figure 6, with a 36-ft × 28-ft foundation, 8-ft high hollow-core masonry block walls, and a 2-ft AG exposure.
1. Reference case. Standard full-depth excavation with rigid exterior foam and water barrier: 3-in. thick sheets of 4-ft × 8-ft XPS rigid foam at $32 per sheet. Typical self-adhered sheet waterproofing (peel-and-stick membrane) at $2/ft2 (includes installation cost). Excavation and labor costs are based on actual costs from recent NorthernSTAR foundation research (Mosiman et al. 2013).
2. Core fill case. Core fill only with CCSPU. Masonry block with dimensions of 8 in. × 10 in. × 16 in. are assumed with a core volume of 0.32 ft3. Total wall core volume is reduced by 33% to account for pilasters, top course bond beam, and mortar droppings, yielding approximately 226.5 ft3. CSPU (installed) at $1.10 per board foot yields approximately $3,000.
3. Proposed approach. Core fill of CCSPU combined with shallow rigid exterior foam to 1 ft BG and water barrier: 2-in. thick sheets of 4-ft × 8-ft XPS rigid foam at $26 per sheet (the foam is placed horizontally to cover 1-ft rim joist, 2-ft AG foundation wall exposure, and 1-ft BG). 4-ft wide 15-mil poly (or similar) at $0.25/ft2 is used for the water barrier, fastened at the top of the rim joist with weather-tight flashing. Exterior material, labor, and excavation costs are added to the core fill costs from Approach 2 for the total cost.
6.2 Results A standard full-depth exterior insulation approach is the most expensive option for foundation wall insulation retrofits. It is roughly twice the cost of the proposed solution (Approach 3). However, it does afford several significant advantages, including more flexibility to achieve higher wall R-values if desired, and elimination of thermal bridging through uninsulated portions of the wall (inherent with Approaches 2 and 3). This approach affords the opportunity to install a complete water control layer from the footing to the rim joist, improving moisture performance.

40
The core fill-only approach is quite inexpensive compared to other retrofit approaches, but does not offer a comparable reduction in basement zone heat loss. Nominal wall R-values are likely limited to R-6 to R-7, depending on the volume of block core that is already filled with mortar droppings and pilasters, and significant sections of the wall are left uninsulated. This approach does not provide an AG or BG water control layer on the exterior of the foundation wall.
Combining the core fill with shallow exterior insulation significantly improves the wall R-value and offers a substantial reduction in basement zone heat loss. Nominal wall R-values are likely limited to R-11 to R-14, depending on the volume of CCSPU core fill and the overall fraction of the foundation wall that is covered with exterior insulation. (Larger AG exposures with more exterior rigid foam will allow higher R-values.) A water control layer can be installed behind the AG insulation to shed bulk water and protect the rim joist. Costs are approximately half that of a standard full-depth exterior insulation retrofit.
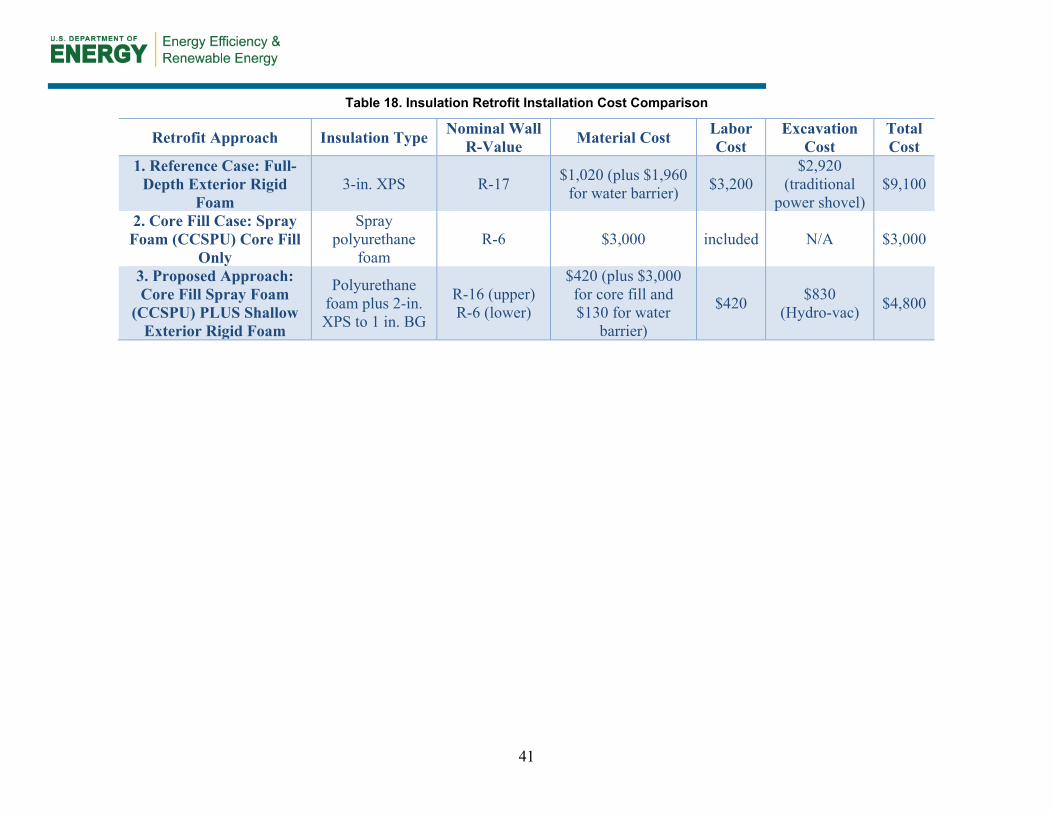
41
Table 18. Insulation Retrofit Installation Cost Comparison
Retrofit Approach Insulation Type Nominal Wall R-Value Material Cost Labor
Cost Excavation
Cost Total Cost
1. Reference Case: Full-Depth Exterior Rigid
Foam 3-in. XPS R-17 $1,020 (plus $1,960
for water barrier) $3,200 $2,920
(traditional power shovel)
$9,100
2. Core Fill Case: Spray Foam (CCSPU) Core Fill
Only
Spray polyurethane
foam R-6 $3,000 included N/A $3,000
3. Proposed Approach: Core Fill Spray Foam
(CCSPU) PLUS Shallow Exterior Rigid Foam
Polyurethane foam plus 2-in. XPS to 1 in. BG
R-16 (upper) R-6 (lower)
$420 (plus $3,000 for core fill and $130 for water
barrier)
$420 $830 (Hydro-vac) $4,800

42
7 Conclusions
To understand the stock of foundations within the target retrofit market, and to verify the applicability of the proposed retrofit package, a noninvasive foundation survey was carried out with several industry partners experienced in home energy audits. Two hundred twenty-two surveys were returned with useful information, primarily from the St. Paul/Minneapolis metropolitan area. The survey found that, within this pool, almost 80% of foundations were constructed with concrete block. Most of the remaining foundations were built with poured concrete. For concrete block foundations with visual access to the top of the wall, 75% were verified to have filled cores and 25% were verified to have open cores. The full insulation retrofit package proposed in this research is applicable to that subset with open cores. However, installation of the exterior WSP and R-10 insulation extending 1 ft BG could still be applied with positive impacts regardless of the condition of the cores, or even wall type (block or poured). Furthermore, based on observational evidence only, close to 20% of foundations were found with past or present moisture issues. In conclusion, the full proposed retrofit is applicable to a significant number of foundations in the retrofit pool, but not the majority.
Buoyant cavity flow in open-core concrete block walls is difficult to simulate, but is important to quantify because of its significant impact on thermal (and moisture) performance. Heating seasonal calorimetric experiments have shown that buoyant cavity flow in hollow-core masonry block walls can yield higher effective overall wall thermal conductance than solid walls with diffusion-only heat transfer. Initial attempts at steady-state 3-D convection simulations using CFD analysis of hollow-core masonry block walls failed to reach equilibrium as expected (see Appendix B). Hence, a 2-D steady-state CFD calculation was used to calculate the thermal conductivity of a single air core alone. This value was used in a 3-D steady-state heat diffusion-only model to calculate the equivalent thermal conductivity of the entire wall. However, when this value was applied to a seasonal heat loss simulation, the heating season energy transfer through the wall was about 28% less than that measured experimentally. That is, the steady-state calculation significantly underestimated heat transfer compared to empirical results. It was thus concluded that steady-state equivalent thermal properties for hollow masonry block walls are not applicable to the actual transient case, in contradiction to Shipp’s findings (1983).
In the cold climate zones (International Energy Conservation Code 6 and 7) making up the NorthernSTAR service territory, heat loss from uninsulated basement space can be a significant segment of overall house heat loss, commonly 10%–13% for a partially conditioned basement, according to simulation results. Retrofit insulation becomes necessary when occupants wish to convert a basement into habitable space with active space conditioning. The BEoptE+ sequence of energy simulations was used to estimate the impacts of the proposed insulation retrofit packages on whole-house energy use. Effective thermal conductivities for the retrofit walls were first calculated using a steady-state 3-D finite element simulation using diffusion only transport applicable to all the cases in which the cores were filled completely. The effective thermal properties for the single hollow-core masonry block case included were derived from transient/seasonal experimental data. The effective wall thermal properties were then used in the BUFETS program to generate the foundation enclosure data necessary for inclusion in the BEM model. Results show that core fills alone do not provide significant savings in terms of whole-house site and source energy use. A CCSPU core fill alone had a source energy savings of 3.6% with a 2-ft AG foundation wall exposure, compared to the uninsulated air core case. Savings for

43
the LWA core fill were even less. Savings would likely increase with a 4-ft AG exposure; however, this percentage could not be calculated, because effective thermal properties could not be calculated for an air-core wall with 4-ft AG exposure. The application of exterior R-10 insulation on the rim joist down to 1 ft BG was found to have a greater impact on energy use. When combined with a CCSPU core fill, total source energy savings close to 7% were found compared to the air core reference case. In the energy simulation, basement zone air temperatures were frequently well below the comfort point. If a comfortable space temperature had been maintained for the basement zone, heat loss in the reference cases would have been higher and the retrofit insulation packages would have offered greater percentage savings.
For homeowners wishing to convert basement space into habitable space, thermal comfort can often be the primary reason for undertaking an insulation retrofit. Providing active space conditioning can raise air temperatures to comfortable levels, but a low mean radiant temperature from uninsulated basement walls and the floor slab keeps the space uncomfortable without added insulation. The BEoptE+ simulation sequence was used to track improvements to space and interior surface temperatures offered by the insulation retrofit packages. In this regard, simple core fills were found to have significant positive impacts on wall surface and space temperatures. For example, the CCSPU core fill with a 2-ft AG exposure increased average surface temperatures during the heating season by almost 10°F for the AG part of the basement wall, and average basement zone space temperatures by almost 6°F. Even with a 4-ft AG exposure, the CCSPU core fill raised average wall surface temperatures above 50°F, and average space temperatures above 60°F, with minimal active conditioning. Exterior insulation provided another significant boost to temperatures, to roughly 66°F for average wall surface temperatures, and 69°F for average space temperatures. With exterior insulation, AG exposure ceased to have a significant effect on interior surface and basement air temperatures.
In general, basement foundations within the NorthernSTAR target retrofit pool are at a high risk for moisture issues for a wide variety of reasons, including age, poor site grading and drainage, and historical construction materials and assemblies. Unfortunately, typical interior insulation retrofits for basement space exacerbate these issues and can lead to structural damage of moisture-sensitive assemblies, such as the rim joist. WUFI 2D hygrothermal simulation software was used to analyze the differences between an uninsulated open-core concrete block wall and one with a CCSPU fill. This research was expected to show that such an insulation retrofit could be carried out with a positive impact on moisture behavior, rather than the negative impact customary with interior insulation strategies. However, the hygrothermal simulations were unsuccessful and yielded physically unrealistic results (Goldberg and Harmon 2014),10 so it was not possible to draw any conclusions from the WUFI 2D simulations with regard to the hygothermal impacts of filling masonry block wall cores.
Despite the lack of simulation results, the insulation retrofit approach proposed in this research is fully expected to reduce moisture issues in a number of ways:
10 Subsequent research submitted for publication after this project was completed demonstrated that WUFI 2D could not be validated by experimental data.

44
• An external WSP installed behind the exterior insulation will block capillary and bulk water flow from wet soil and cladding in contact with the rim joist and top of the foundation wall.
• An LWA or CCSPU core fill undoubtedly eliminates convection currents and associated moisture transport. To the extent that these flows can transport water vapor from the bottom of the cores to condense on the AG core interior surfaces, elimination of this transport mechanism can only improve the AG hygrothermal and structural performance of a masonry block wall (by reducing freeze/thaw thermal cycling that can produce spalling, etc.).
• Exterior insulation will warm the top of the foundation wall and rim joist, reducing the risk of condensation and adsorption on the interior assembly surfaces while improving inward drying potential. Because hygrothermal simulation results did not support these hypotheses (but were of questionable validity), further experimental work is needed to validate them.
In conclusion, despite the limitations found with the simulations used for hollow-core masonry block walls experiencing natural convection currents, the data presented show that the proposed insulation retrofit strategy involving core fills and shallow exterior insulation can successfully address some of the major challenges in the basement retrofit market. The full package of improvements can provide significant energy savings and improve occupant thermal comfort to a great degree. It should also reduce moisture risks by addressing some of the major wetting pathways inherent with hollow-core masonry block walls. Moreover, the approach avoids major excavation and interior demolition work, substantially reducing retrofit costs. The standard full-depth exterior insulation approach, which offers similar benefits in terms of energy savings, hygrothermal performance, and thermal comfort, was estimated to cost roughly twice as much as the combined CCSPU core fill and shallow exterior insulation. This suggests that such a retrofit could be accomplished affordably, with an acceptable payback period for the homeowner.

45
References
ElSherbiny, S.M.; Raithby, G.D.; Hollands, K.G.T. (1982). “Heat Transfer by Natural Convection Across Vertical and Inclined Air Layers.” ASME Transactions, 104, 96–102.
Goldberg, L.F. (1999). The Foundation Test Facility, Research Report, ESDP, University of Minnesota. Accessed January 2015:t http://www.buildingfoundation.umn.edu/ftf.htm.
Goldberg L.F.; Czernik, D.C.; Lively, R.S. (1996). Foundation Test Facility
Experimental Results: 1995/96 Test Period System Data, Minnesota Building Research Center, University of Minnesota.
Goldberg, L.F.; Harmon, A.C. (2014). Cold Climate Foundation Retrofit Experimental Hygrothermal Performance: Cloquet Residential Research Facility Laboratory Results. Golden, CO: National Renewable Energy Laboratory, in review.
Goldberg, L.F.; Huelman, P.H. (2005). Minnesota Energy Code Building Foundation Rule:
Amendment Proposal Development Project Final Report, Project Research Report. Accessed January 2015:
http://www.buildingfoundation.umn.edu/FinalReportWWW/default.htm, ESDP, University of Minnesota.
Goldberg, L.F.; Huelman, P.H.; Gatland, S.D. (2010). “A Prototype Universal Building Envelope Hygrothermal Performance Standard for Successful Net-Zero Energy Building Design. Presented at ASHRAE Buildings XI Conference. Accessed January 2015: http://web.ornl.gov/sci/buildings/2012/2010%20B11%20papers/53_Goldberg.pdf.
Goldberg, L.F.; Steigauff, B. (2013). Cold Climate Foundation Retrofit Energy Savings: The Simulated Energy and Experimental Hygrothermal Performance of Cold Climate Foundation Wall Insulation Retrofit Measures-Phase I, Energy Simulation. Golden, CO: National Renewable Energy Laboratory. Accessed January 2015: http://apps1.eere.energy.gov/buildings/publications/pdfs/building_america/cold_climate_foundation_retrofit.pdf.
Gossard D.; Lartigue B.; Sambou, V. (2011). “Nusselt Number Correlations for Laminar Convection in Three-Dimensional Air-Filled Cavities.” Journal of Building Physics, 35 (4), 327–337.
Kehrer, M.; Christian, J. (2012). Measurement of Exterior Foundation Insulation to Assess Durability in Energy Saving Performance. Oak Ridge, TN: Oak Ridge National Laboratory. Accessed January 2015: http://info.ornl.gov/sites/publications/Files/Pub36100.pdf.
Kunzel, H.W. (1995). Simultaneous Heat and Moisture Transport in Building Components – One and Two-Dimensional Calculation Using Simple Parameters. Research Report, Fraunhofer-Institut für Bauphysik, ISBN 3-8167-4103-7.

46
Labs, K.; Carmody, J.; Sterling, R.;, Shen, L.; Huang, Y.; Parker, D. (1988). Building Foundation Design Handbook. Oak Ridge, TN: Oak Ridge National Laboratory.
MacArthur, J.W; Meixel, G.D., Jr.; Shen, L.S. (1983). “Application of Numerical Methods for Predicting Energy Transport in Earth-Contact Systems.” Applied Energy, 13, (2) 121–156.
McBride, M.F. (2013). “Natural Convection in Below Grade Open Cell Concrete Block Walls.” Proceedings of ASHRAE Conference, Thermal Performance of the Exterior Envelopes of Whole Buildings XII, Clearwater Beach, FL.
Mosiman, G.; Wagner, R.; Schirber, T. (2013), Excavationless Exterior Foundation Insulation Exploratory Study. Golden, CO: National Renewable Energy Laboratory. Accessed January 2015: http://www.nrel.gov/docs/fy13osti/56163.pdf.
Mundt-Petersen, S.O.; Harderup, L.E. (2013). “Validation of a One-Dimensional Transient Heat and Moisture Calculation Tool under Real Conditions.” Proceedings ASHRAE Conference, Thermal Performance of the Exterior Envelopes of Whole Buildings XII, Clearwater Beach, FL.
Shipp, P.H. (1983). “Natural Convection Within Masonry Block Walls.” ASHRAE Transactions, 89 (1B) 405–419.
Ueno, K.; Lstiburek, J. (2012). Measure Guideline: Hybrid Foundation Insulation Retrofits. Golden, CO: National Renewable Energy Laboratory. Accessed January 2015: http://apps1.eere.energy.gov/buildings/publications/pdfs/building_america/measure_guide_hybrid_found.pdf.

47
Appendix A: Foundation Survey Form

48
Appendix B: Hollow-Core Masonry Block Modeling
Currently reported modeling of steady-state, 3-D, high Rayleigh number, high vertical aspect ratio buoyant flows in enclosed air-filled cavities is generally limited to cases where the opposing face temperatures are isothermal (that is, uniform with height) and the flow is laminar, for example Gossard et al. (2011). These authors report that “The number of studies dealing with convection in 3-D cavities remains low, due to the high computational resource requirements for the numerical resolution of convection equations.” In the case of the hollow-core masonry block foundation walls in actual buildings, these difficulties are compounded for the following reasons:
• Any foundation wall has multiple cores, each subject to different thermal boundary conditions that require each cavity to be modeled separately.
• The interior and exterior face vertical temperatures are not uniform with height. The exterior wall in particular is subject to significant vertical temperature gradients in both the heating and cooling seasons.
• The flow is not laminar in general, because the temperature gradients across the core can be very large, particularly for uninsulated walls.
• The flow is highly transient, mainly as a function of the diurnal ambient temperature variation.
• The Rayleigh number of the flow in the masonry block cores considered in this project is of order 10,6 whereas Gossard et al. report 3-D Rayleigh number correlations of order 105 at a maximum.
• Rayleigh number correlations in the range of interest have been reported for 2-D steady-state analyses, again with isothermal interior and exterior cavity faces. For example, ElSherbiny et al. (1982) report correlations for Rayleigh numbers up to 2 × 10⁷ and aspect ratios (cavity height/cavity width) between 5 and 110 (the maximum aspect ratio of the masonry block cores considered is 9.25). Thus, it was concluded that the only feasible approach to modeling the cores was to use a 2-D, steady-state CFD simulation that would achieve convergence based on the reported studies. An attempt was made to carry out a 3-D CFD simulation of a masonry block core, but as expected, this simulation failed to yield a steady-state result. The solution oscillated about mean temperature and velocity fields but never converged to a time-invariant, steady-state condition. The CFD program used (ALGOR) may have been inadequate to the task. Some authors (for example, Gossard et al. 2011) report using codes that are far more sophisticated and robust than ALGOR.
• The second difficulty is that only steady-state simulations are possible whereas the seasonal heat transfer through a masonry block core is transient on both diurnal and monthly scales. It is already known from previous experimental work (Goldberg 1999) that the seasonal heat transfer through an uninsulated hollow masonry block wall is 4% greater than that through an uninsulated poured concrete wall of the same thickness under calorimetric conditions (constant interior temperature for all comparison cases). The increase in heat transfer is a direct result of the buoyant cavity flows in the wall cores. This was confirmed by filling the cores with an LWA that yielded a seasonal heat transfer

49
12% lower than that of the concrete wall. This resulted from the elimination of the cavity flows and the thermal conductivity of the lightweight aggregate being less than that of concrete. Thus, the question was whether a steady-state buoyant cavity simulation can adequately model the actual transient behavior.
• Shipp (1983) reported that “The presence of two-dimensional conduction augmented by free convective airflow within the block wall is (experimentally) demonstrated. Due to these thermal bypass mechanisms, the concentric arc heat flow approximation overestimated basement wall resistance and underestimated the effect of eliminating internal convection. The differences, however, are insufficient to warrant modifying present methods for estimating basement wall heat loss.” The 2-D CFD modeling approach is far more sophisticated than the simple analytic methods discussed by Shipp and the essence of these methods is effective in transient simulations (that is, representing the elements of the system by thermal parameters only, for example, MacArthur et al. 1983). Thus, it was decided to proceed with a 2-D CFD steady-state approach.
• The particular CFD program used was ALGOR. This was used in an informal manner to ascertain whether the solutions obtained could yield interior surface heat flow results that even approached those measured experimentally on a seasonal transient basis. Hence, the simulations focused on determining the simulated interior heat flow, not on the temperature and velocity details of the flow fields within the cores. Thus the general parameters of the simulations were:
o Turbulence model: none
o Grid independence study: not undertaken
o Validation: comparison with published steady-state data for hollow masonry block wall—validation successful
o Grid size: tetrahedral grid with a generating dimension of 27.94 mm
o Convergence norms: temperature < 0.0001°C; velocity < 0.0001 m/s
o Boundary conditions: interior horizontal: isothermal natural convection with temperature = 20°C and heat transfer coefficient = 6.13 w/m2.k interior vertical: isothermal natural convection with temperature = 20°C and heat transfer coefficient = 8.29 w/m2.k ambient: isothermal natural convection with temperature = –23.7°C and heat transfer coefficient = 34 w/m2.k deep ground: isothermal Dirichlet with temperature = 7.78°C
• Examples of the methodology are given in Figures B.1 through B.10; the full range of air core cases modeled is given in Table B.1 (cases without air cores do not require CFD modeling). Figure B.1 shows the solid model of a masonry block wall with a full-height air core without any concrete fill or insulation and a 2-ft AG exposure when exposed to an exterior ambient temperature of –23.7°C (ASHRAE winter design conditions for Minneapolis, Minnesota), and an interior temperature of 20°C.

50
Table B.1. Steady-State CFD 2-D Air Core Convection Results
AG Height
(ft)
Porous Concrete Fill Height
(%)
Amount of Insulation
(%)
Design Conditions
Core Fill Material
Total Surface Heat Flow
(W/unit length)
Interior Surface Total
Heat Flow (W/unit length)
Heat Flow
Closure Error
Specified Thermal Conductivity of
Air Core (W/m.K)
2
0 0 Winter Air 0.737884422 –13.30475621 5.5% 0.193168441 50
(upper half) Winter CCSPU –0.125914933 –9.743913012 1.3% 0.263452183
Vermiculite –0.172687855 –10.64267839 1.6% 0.263028941
33 0 Winter Air 0.296337033 –19.24946508 1.5% 0.431927534 50
(upper half) Winter CCSPU 0.008926755 –12.93264311 0.1% 0.285083649 Vermiculite 0.074654623 –13.49299678 0.6% 0.272499492
4
0 0 Winter Air 2.023631115 –15.06251046 13.4% 0.18932555 50
(upper half) Winter CCSPU 0.841015468 –10.76724686 7.8% 0.212652392
Vermiculite 0.900465967 –11.80232838 7.6% 0.210258678
33 0 Winter Air 5.10148184 –17.86178812 28.6% 0.190408642 50
(upper half) Winter CCSPU 1.156017746 –16.50794917 7.0% 0.354226131 Vermiculite 1.243940745 –17.18490755 7.2% 0.351035926
Notes: Total surface heat flow: summation of the heat flow through all the bounding surface of the simulation domain, interior, exterior, and deep ground. Interior surface total heat flow: the amount of heat flow through all the interior surfaces; that is, the wall and slab.

51
• Figures B.2 through B.4, B.6, B.7, B.9, and B.10 share a common format. The contours are plotted on a vertical cutting plane that passes through the vertical center of the core. The green and red lines indicate the vertical (Z) and horizontal axes (X), respectively, on the cutting plane. The temperature and velocity fields are represented by flooded contours; namely, where the space between the contour lines at discrete value are filled (or flooded) with an interpolated gradient of colors.
• Figures B.2 and B.3 show the flooded temperature and vertical velocity component contours, respectively, on the core centerline (the wall exterior is shown by a slice of the soil block adjacent to the wall). The full height recirculating loop is clearly evident in Figure B.3 (positive flow adjacent to the interior face, negative flow adjacent to the exterior face). The resulting temperature distribution is given in Figure B.2. These figures demonstrate how the convective loop transports warm air to the top of the wall, where it is readily lost to the ambient surroundings through the exposed AG wall. Without the buoyant cavity flow, the resulting temperature profiles are completely different, as shown for purely diffusive heat transfer through the wall in Figure B.4.
• A three-segment core fill system modeled is shown in Figure B.5 with the same boundary conditions used for Figure B.1, again for a wall with a 2-ft AG exposure. In this case, the lower third of the core is filled with concrete and the upper third is filled with CCSPU. The air core separates the two solid fills. Figure B.7 reveals a fairly weak convective loop with a maximum vertical velocity component of 0.23 m/s compared with the much greater strength (shown in Figure B.3) of 0.60 m/s. The resulting temperature field (Figure B.6) shows a rather thin layer of cold air (below freezing) adjacent to the exterior face. The difference between the diffusion-only heat transfer in the CCSPU core and the impact of the buoyant cavity flow on that temperature distribution is quite evident.
• Finally, the phenomenology of a fully open core in a masonry block wall with a 4-ft AG exposure is reported in Figures B.8 through B.10. The strength of the convective loop shown in Figure B.10 is just slightly greater than that of the 2-ft AG case with a maximum vertical velocity component of 0.61 m/s; the 2-ft and 4-ft temperature distributions are similar (Figures B.2 and B.10, respectively).

52
Figure B.1. Solid model for 2-ft AG, full air core

53
Figure B.2. Two-foot AG, full air core: flooded temperature contours

54
Figure B.3. Two-foot AG, full air core: flooded vertical velocity component contours

55
Figure B.4. Two-foot AG, full air core: diffusive wall heat transfer only flooded temperature contours

56
Figure B.5. Solid model for 2-ft AG, 33% concrete fill, upper 50% of air core filled with CCSPU

57
Figure B.6. Two-foot AG, 33% concrete fill, upper 50% of air core filled with CCSPU: flooded temperature contours

58
Figure B.7. Two-foot AG, 33% concrete fill, upper 50% of air core filled with CCSPU: flooded vertical velocity component contours

59
Figure B.8. Solid model for 4-ft AG, full air core
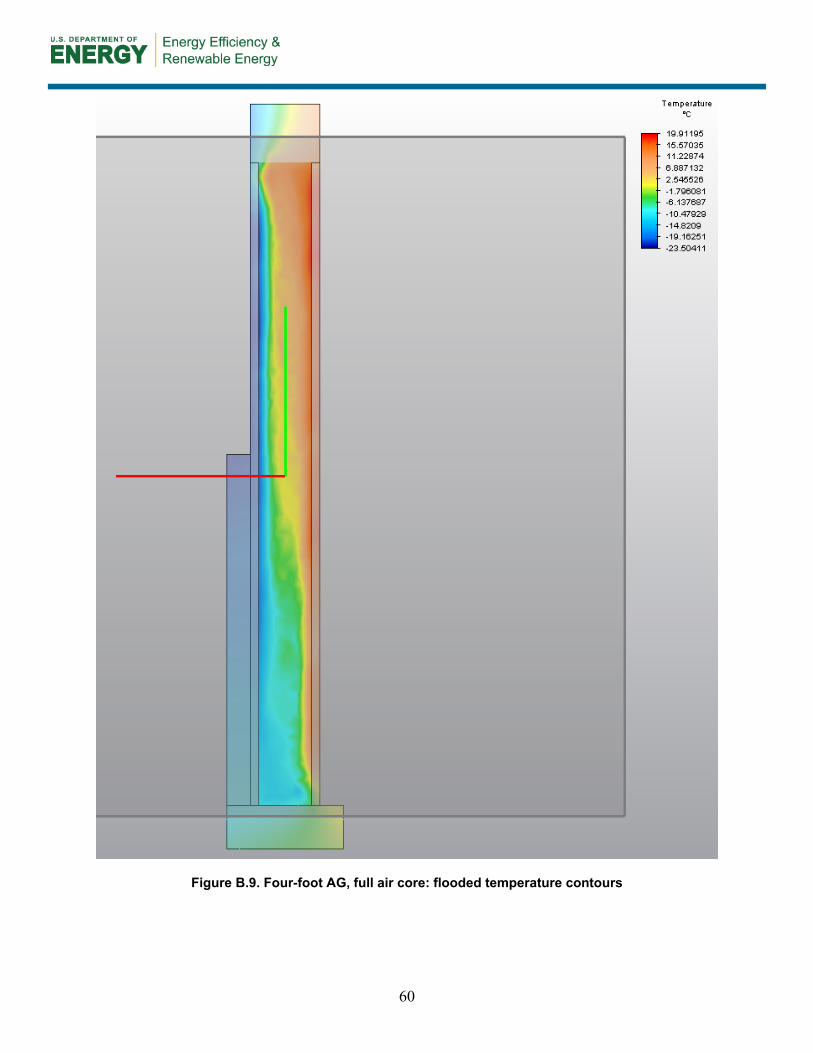
60
Figure B.9. Four-foot AG, full air core: flooded temperature contours

61
Figure B.10. Four-foot AG, full air core: flooded vertical velocity component contours

62
The purpose of the simulations was to generate an equivalent thermal conductivity (RHS column in Table B.1) for the air core that when used in a diffusion-only program (such as the BUFETS code used in the BEM). The interior surface heat transfer simulated by the diffusion only (that is, no advective thermal transport at all) and CFD (in which advective transport is included) codes are identical when subjected to the identical boundary conditions described above. This was achieved by iterating the diffusion-only model (using exactly the same solid models as used in the CFD simulations, except that the air cores have diffusive heat transport only), until the difference between the interior surface heat transfers (wall and slab) for the two analyses was less than 0.03% at worst. Also of note in Table B.1 are the reported heat flow closure errors. These indicate the extent to which steady-state convergence was realized. A fairly wide range of values from 0.1% to 28.6% was achieved; most cases were lower than 8%. The two large error cases (13.4% and 28.6%) both occurred with the 4-ft AG exposure wall. In this case, the Rayleigh number is higher than the 2-ft AG wall case (because the average interior/exterior cavity face temperature difference is higher), which results in a lower degree of convergence. This is indicative of the difficulty reported in the cited literature of performing high Rayleigh number buoyant cavity flow analysis.
The resulting equivalent thermal conductivity was used in a 3-D representation of a masonry block wall segment (a single standard 10-in. wide stretcher block with two air cores) with diffusion-only heat transfer and an AG wall exposure reduced to 1.5 ft to comply with the experimental wall configuration as shown in Figure B.11. A baseline or reference was calculated with the masonry block cores filled with concrete to establish the reference interior surface heat flow. Then each core case (whether open or filled with insulation) was simulated with the cores assigned the effective air thermal conductivity determined from the CFD analysis. The ratio of the interior heat flow generated by the cores with the effective CFD thermal conductivity to that of the solid wall was calculated and this ratio is termed the steady-state interior heat transfer ratio. In this experimental case, the simulated steady-state interior heat transfer ratio of the total interior surface (wall and slab) heat transfer was 0.78 compared to the seasonal experimentally measured ratio discussed previously of 1.04, an unacceptably large discrepancy.
Assigning the cores the thermal properties of the LWA used in the seasonal experiment yielded an interior surface heat transfer ratio of 0.86, compared to the measured seasonal ratio of 0.88. Finally, the thermal resistance ratio of a hollow-core to a fine-sand-filled-core masonry block wall measured by Shipp was 0.94. The ratio simulated with the steady-state methodology described above was 0.98.
It was concluded that the steady-state approach to deriving wall core effective conductivities is satisfactory for use in a transient/seasonal analysis, provided that the heat transport within the wall is diffusive only, in agreement with Shipp. However, the steady-state model is completely ineffective for transient/seasonal buoyant cavity flows in masonry block walls. With the sole exception of the case reported in Figure B.1, in which the experimental seasonal interior heat transfer ratio of 1.04 could be used to generate the equivalent air core thermal conductivity, all the other air core effective conductivities were erroneous. These cases could not be included in the study.

63
Figure B. 11. Solid model for 1-½-ft AG, 3-D wall segment consisting of a single standard 10-in. wide stretcher block with two air cores

64
To assess the cause of the large steady-state discrepancy, a transient CFD simulation of Figure B.11 was conducted for a real-time period of a few hours using the boundary conditions discussed above with the entire field at an initial temperature of 0°C. Clearly this does not represent the annual cyclic steady-state condition of the soil temperatures around a basement (that was not possible to achieve because of the intractable amount of computation time required). The exercise was simply intended to examine the value of the velocities obtained under transient conditions compared with those achieved under steady-state conditions. The transient calculation revealed significantly higher maximum vertical velocities, generally 2 to 3 times larger than the converged steady-state values. This explains the discrepancy, in that a wall core that never reaches thermal equilibrium under transient boundary conditions experiences greater convective loop strengths, and thus transfers larger amounts of heat out of the wall core through the AG exterior surface. As the seasonal experimental data show, these heat transfers exceed those of an equivalent solid wall.

65
Appendix C: Hygrothermal Modeling Results (WUFI 2D)
Introduction WUFI 2D is a commercial, 2-D hygrothermal simulation program developed by the Fraunhofer-Insitut für Bauphysik, Germany. The program is based on a report prepared by Kunzel (1995) (in turn, based on his Ph.D. thesis) that describes a two-variable, differential conservation equation set in which the transport properties are temperature and RH. No explicit conservation balance for liquid water is represented as a function of the RH via a material sorption isotherm. The energy conservation equation includes diffusive thermal transport only; advection is ignored. The moisture transport equation includes direct water vapor diffusion and indirect liquid water diffusion as a function of the RH via empirically determined “liquid conduction coefficients.”
When applied to AG structures, this simplified physical approach to hygrothermal analysis is effective in 1-D (Mundt-Petersen and Harderup 2013), when there is no explicit bulk water transport and where advective airflows (such as those arising from infiltration) can be represented as point or area sources or sinks that either add or remove heat and water vapor from the system. However, this approach has not been explicitly demonstrated to be valid when applied to earth contact heat and mass transport in which at least two dimensions are required to effectively model a foundation wall/slab system for at least the following reasons:
• It is limited to building enclosure components that can be rigorously represented by diffusive thermal, vapor, and liquid flows. Hollow-core masonry blocks cannot be rigorously represented by diffusion-only transport mechanisms in the cores where buoyant cavity flows can be very significant (see Appendix B).
• Significant advective bulk water may flow through the soil and through cracks in the wall and slab system that cannot be represented as sources and sinks within the computation domain.
• Reliance on first-order empirical coefficients to represent bulk water diffusion in soils as a function of RH is problematic, because soils in general are always saturated and the rate of diffusion is a function of the hydraulic conductivity and the gradient of the pore pressure (Darcy’s Law).
o In this context—that is, despite the above objections—the WUFI 2D methodology has been applied to the two uninsulated, full-height hollow-core masonry block configurations investigated in this report; namely, those with 2-ft and 4-ft AG wall exposures (see Figures B.1 and B.8 in Appendix B). A soil material model was deployed with estimated transport coefficients based on previous research (Goldberg 2012). Further, as WUFI 2D cannot in any way account for buoyant convective flows in the hollow masonry block cores, these cores were modeled using still air thermal and vapor transport parameters.
o With these limitations, the purpose of the exercise was to determine whether there is any vapor coupling between the hollow cores and a sealed rim-joist cavity and whether this coupling can be reduced by filling the hollow cores with CCSPU. In other words, whether it is indeed true that filling hollow masonry block cores (even in

66
the less stringent condition in which buoyant cavity flows are ignored) reduces the vapor coupling of the walls to the rim-joist cavity.11
o The interior temperature boundary conditions are in compliance with ASHRAE/ANSI standard 160 while a Minneapolis, Minnesota, Typical Meteorological Year 3 climate data are used for the ambient conditions. Figures C.1 and C.6 depict the 2-ft and 4-ft AG simulation models respectively. Of crucial importance is that the rim-joist cavity is vapor sealed with a 6-mil polyethylene membrane isolating the cavity from the interior conditions and the floor sealing the cavity from above is exposed to the interior temperature and humidity boundary conditions. Further, there is no vapor retarder or waterproofing membrane between the sill plate and wall or on the exposed top wall surface.
Discussion of Results • The salient results for the 2-ft AG wall are shown in Figures C.2–C.5. These figures
contain an animation sequence that depicts the MCs in components of the upper half of the wall for a side-by-side comparison of the cases in which the cores are open (left-hand side) and are filled with CCSPU (right-hand side). Note that (1) the results are shown for the second year of the simulation, because the first year was used for conditioning the soil; and (2) the simulation year starts on October 1. The MCs are shown by flooded blue contours with the MC increasing with darkness.
• At the beginning of the second year in Figure C.2, the floor and the sill plate in the CCSPU wall rim-joist cavity show higher MCs than in the air-core wall, while the bond beam masonry blocks and interior face shells of the hollow blocks have about the same MC. The exterior face shell shows a higher MC in the air-core wall than the CCSPU wall. As the animation unfolds through Figure C.3 to Figure C.4, it is clear that the MC in the sill plate and rim board is significantly higher in the CCSPU wall than in the air-core wall. Finally, the last frame of the animation (Figure C.5) shows that the system had somewhat dried out, leaving a residual MC in the sill plate of the CCSPU wall.
• A similar animation sequence is shown for the 4-ft AG exposure wall (depicted in Figure C.6) in Figures C.7–C.10. The same pattern observed for the 2-ft wall is repeated with the maximum MC reached in the rim board and sill plate at 2/24 with the MC of the CCSPU wall components exceeding those of the air-core wall.
11 This is also being investigated experimentally at the University of Minnesota’s Cold Climate Research Facility.

67
Figure C.1. Two-foot AG wall simulation model

68
Figure C.2. Comparison of 2-ft AG upper wall MC contours with
the cores filled with air and CCSPU on October 1/year 1
Figure C.3. Comparison of 2-ft AG upper wall MC contours with
the cores filled with air and CCSPU on November 11/year 1

69
Figure C.4. Comparison of 2-ft AG upper wall MC contours with
the cores filled with air and CCSPU on February 24/year 2
Figure C.5. Comparison of 2-ft AG upper wall MC contours with
the cores filled with air and CCSPU on July 17/year 2
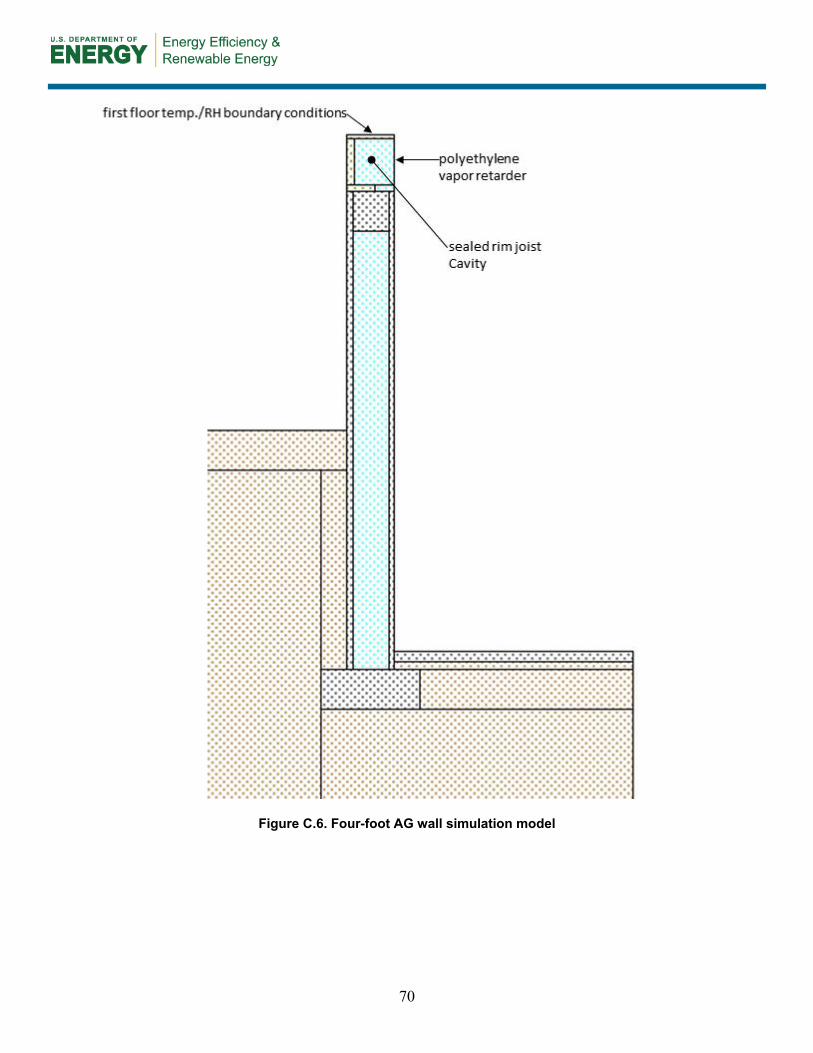
70
Figure C.6. Four-foot AG wall simulation model

71
Figure C.7. Comparison of 4-ft AG upper wall MC contours with
the cores filled with air and CCSPU on October 1/year 2
Figure C.8 Comparison of 4-ft AG upper wall MC contours with
the cores filled with air and CCSPU on November 11/year 2

72
Figure C.9. Comparison of 4-ft AG upper wall MC contours with
the cores filled with air and CCSPU on February 24/year 2
Figure C.10. Comparison of 4-ft AG upper wall MC contours with
the cores filled with air and CCSPU on July 17/year 2

73
These two simulated animation sequences reveal the following:
• The moisture flows from the interior, through the horizontal floor, into the sealed rim-joist cavity where it condenses mainly on the interior surfaces of the band joist and the sill plate (the cold surfaces). It then diffuses from the sill plate into the solid bond beam masonry block and then to the interior and exterior face shells. The moisture then is transferred to the cores or continues to diffuse downward through the face shells.
• The diffusion rate into the air core from the interior wall surfaces is higher than that into the CCSPU core; thus, the amount of water stored in the CCSPU wall rim-joist cavity components is greater over time. In terms of the WUFI 2D material properties used in the simulation, the vapor permeability of a still air layer is about 593 times greater than that for CCSPU.
According to these simulations, in a CCSPU-filled core wall, under the given simulation boundary conditions, the moisture transport direction is from the rim-joist cavity into the wall, not the reverse (which has been the common perception and intuitive expectation to date). This observation also applies to an air-filled core in circumstances where buoyant cavity flows are ignored. This may not be true when buoyant cavity flows are included. In particular, during the heating season, the convective loop can transport moisture from a wet footing to condense on the AG sections of the wall, thus providing a source for moisture diffusion into the rim-joist cavity.
This phenomenology is shown in more detail in Figures C.11–C.13 for the 2-ft AG wall and in Figures C.14–C.18 for the 4-ft AG wall. A discussion follows each set of figures.
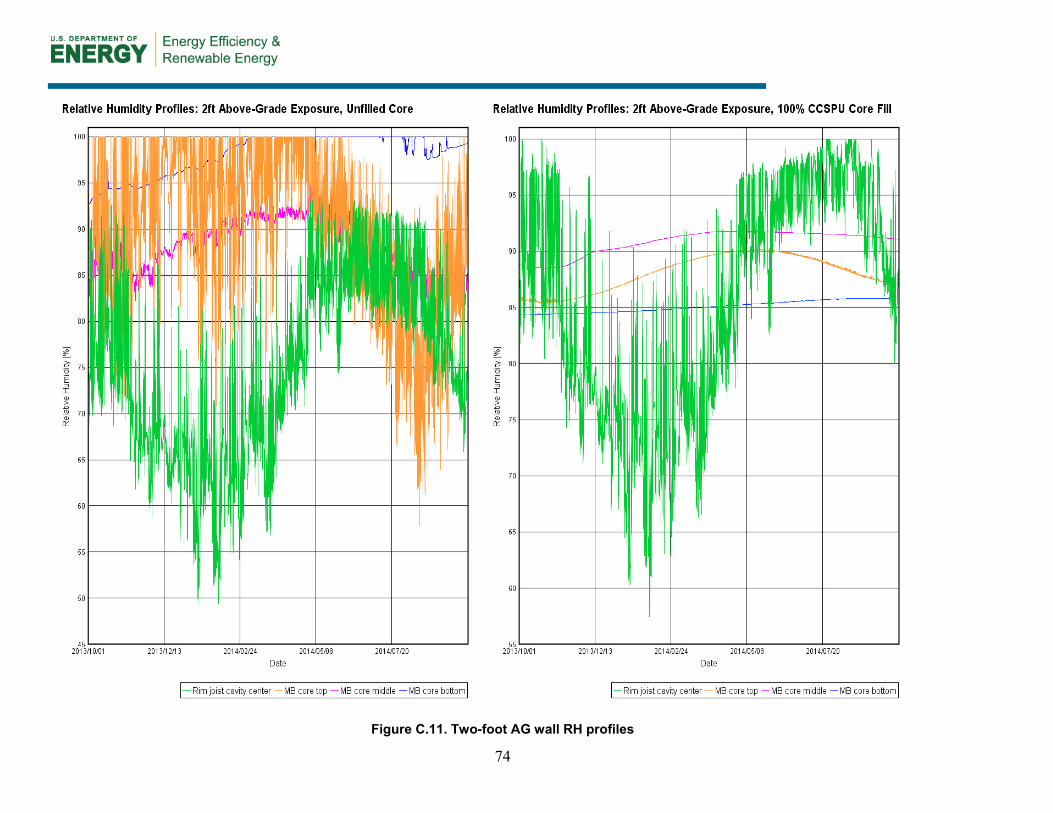
74
Figure C.11. Two-foot AG wall RH profiles

75
Figure C.12. Two-foot AG wall RH profiles on the rim-joist cavity condensing surfaces

76
Figure C.13. Two-foot AG wall MC profiles

77
Figure C.14. Two-foot AG wall temperature profiles

78
Figure C.11 reveals that the RH profiles (blue, violet, and orange) in the CCSPU core are smooth; those in the air core are oscillatory in response to the diurnal ambient temperature variation (particularly the orange profile at the top of the wall). The seasonal variation at the top of the air core reflects the ambient conditions, where 100% RH arises during winter, because of the cold temperatures yielding dry air that is saturated at very low absolute humidities. Of significant interest is the saturated RH (100%) prevailing at the bottom of the air-core cavity after February 24, while in the CCSPU core fill, the bottom RH is less than about 86% over the entire year. At midheight, the air core experiences an annual sinusoidal RH oscillation (violet) while the CCSPU core shows a minor variation. Thus in the presence of buoyant convective flow in the air core, it is reasonable to expect that the high humidity prevailing at the base of the core would be advected to the AG section of the wall where it would condense and freeze during the heating season. Upon melting, it could provide a significant moisture source for the rim-joist cavity during spring and early summer, thus reversing the simulated moisture transport behavior simulated during this period when the cavity flow is ignored. The mean rim-joist air cavity RH is higher with a CCSPU core than with an air core, in concordance with Figure C.1.
Again in agreement with Figure C.1, Figure C.11 shows that at every time during the year, the RHs above the rim-joist cavity condensing surfaces (rim board and sill plate) are higher in the CCSPU core wall than in the air-core cavity wall. On average, the mean annual RH above these surfaces is about 82% for the air-core wall and 92% for the CCSPU core wall.
Figure C.13 shows that the rim board and sill plate interior surfaces have significantly higher MCs in the CCSPU wall compared to the air-core wall. The MC for the air-core wall has a range of about 11%–18%, while that for CCSPU core is simulated to be 20%–116% with an average of about 72%. The simulated moisture contents for the air-core wall are physically reasonable and less than the average wood fiber saturation MC of 30% on a dry mass basis. However, those simulated for the CCSPU significantly exceed 30%, indicating prodigious amounts of surface water. Further, a dry basis MC exceeding 100% on the rim board interior face for the CCSPU wall is questionable and does not seem physically reasonable.12 These simulated data pose serious questions about the physical validity of the WUFI 2D program.
The MCs on the top and bottom faces of the bond beam blocks are similar in magnitude for both the air and CCSPU cores, which, again is surprising given the much higher MC of the sill plate interior surface on the CCSPU wall (60%–93%) compared with that on the air-core wall (14%–16.5%). What is consistent, though, is that for the CCSPU wall, the top face MC (violet) is generally higer than that of the lower face, indicating moisture flow downward from the rim-joist cavity. The reverse is true for the air-core wall (lower face has the higher MC), which suggests that for most of the year from October 1 through about July 1, moisture flow is upward toward the rim-joist cavity. This detail is not consistent with the overall trend shown by the animation in Figure B.1 for the air-core wall, but it may be an artifact of the midwall location of MC plots. The left-hand side of Figure C.4, for example, appears to show the reverse MC gradient over the outer 60% of the wall width and the same gradient as the CCSPU wall over the inner 40% of the width.
Finally, Figure C.14 shows almost identical rim-joist cavity air temperature profiles for both the CCSPU and air-core walls. The temperatures in the center of the cores at the top are similar, while at
12 A consequence of the absence of a separate water mass conservation balance.

79
the middle and bottom, the CCSPU and air cores have about the same mean annual temperatures (amplitudes in the CCSPU core are larger and more symmetric). It is interesting to note that from October 1 through March 24 (spanning the heating season), the air-core wall has approximately the same temperatures at the bottom and middle of the wall. This indicates buoyant cavity flow that in this case is being artificially emulated BG by the higher air thermal conductivity used by WUFI to represent air spaces.
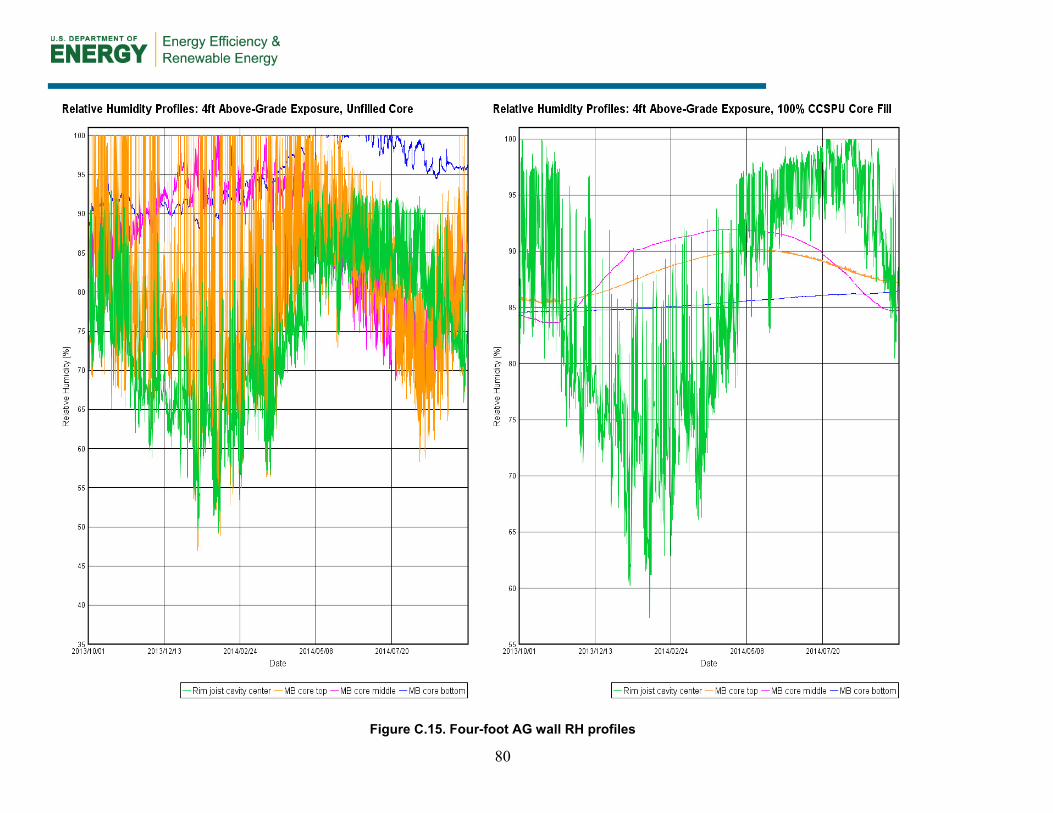
80
Figure C.15. Four-foot AG wall RH profiles

81
Figure C.16. Four-foot AG wall RH profiles on the rim-joist cavity condensing surfaces

82
Figure C.17. Four-foot AG wall MC profiles

83
Figure C.18. Four-foot AG wall temperature profiles

84
The essential details of the hygrothermal phenomenology for the 4-ft AG wall shown in Figure C.4 are very similar to those discussed for the 2-ft AG wall discussed for Figure C.3 and thus will not be repeated. Rather, attention focuses on the differences that arise from the additional AG exposure.
In Figure C.4.1, the midwall air core RH now also reveals the same transient characteristics as the RH at the top of the wall, because of its much closer coupling to the ambient conditions. For the CCSPU core, the maximum magnitude is about the same, but the larger coupling to the ambient shows a much stronger seasonal variation.
The RH profiles pertaining to the rim-joist cavity condensing surfaces are little changed from the 2-ft AG case (Figure C.16). The corresponding MC profiles (Figured C.17) also show little change. The same anomalously high MC simulated for the CCSPU wall with a 2-ft AG exposure is present for the 4-ft AG wall. However, in this case, the MC gradient anomaly across the air-core bond-beam block is absent and the upper face MC is mostly larger than the lower face (Figure C.17, left-hand side), consistent with a downward diffusion of moisture from the rim-joist cavity to the air core.
Figure C.18 shows similar seasonal temperature variations at all three vertical measurement locations for both the air and CCSPU cores. In the case of the air core, the equality of the bottom and midwall temperature profiles from October 1 through March 24 (see Figure C.14) has disappeared and temperature variations consistent with purely diffusive energy transport are visible (bottom core temperatures warmer during the winter and cooler during the summer).
Conclusions
The simulation results are questionable in the light of the expected physical behavior of the system foundation wall system simulated. For this reason, no definite conclusions can be drawn except to state that the use of WUFI 2D to model BG foundation walls will require considerably more research and validation before it can be used in this application. The ultimate determination of their validity will be determined by experiments (such as those currently underway at the Cloquet Residential Research Facility) that measure directly the coupling between the cores of hollow masonry block walls and a vapor-sealed rim-joist cavity.

85
Appendix D: Space Temperature Modeling Additional Results
Figure D.1. AG surface temperature, 2-ft AG with 33% concrete fill
Figure D.2. BG surface temperature, 2-ft AG with 33% concrete fill
0
5
10
15
20
25
30AG
Sur
face
Tem
pera
ture
(C)
2-ft AG, 33% concrete fill
Air Core CCSPU Core LWA Core (Ref. Case)
0
5
10
15
20
25
30
BG S
urfa
ce T
empe
ratu
re (C
)
2-ft AG, 33% concrete fill
Air Core CCSPU Core LWA Core (Ref. Case)

86
Figure D.3. Basement zone air temperature, 2-ft AG with 33% concrete fill
Figure D.4. AG surface temperature, 4-ft AG with 33% concrete fill
0
5
10
15
20
25
30
Zone
Air
Tem
pera
ture
(C)
2-ft AG, 33% concrete fill
Air Core CCSPU Core LWA Core (Ref. Case)
0
5
10
15
20
25
30
AG S
urfa
ce T
empe
ratu
re (C
)
4-ft AG, 33% concrete fill
CCSPU Core LWA Core (Ref. Case)

87
Figure D.5. BG surface temperature, 4-ft AG with 33% concrete fill
Figure D.6. Basement zone air temperature, 4-ft AG with 33% concrete fill
0
5
10
15
20
25
30
BG S
urfa
ce T
empe
ratu
re (C
)
4-ft AG, 33% concrete fill
CCSPU Core LWA Core (Ref. Case)
0
5
10
15
20
25
30
Zon
e Ai
r Tem
pera
ture
(C)
4-ft AG, 33% concrete fill
CCSPU Core LWA Core (Ref. Case)

DOE/GO-102015-4538 ▪ May 2015