Embed Size (px)
Citation preview
metabolites
H
OH
OH
Article
Innovative Alcoholic Drinks Obtained byCo-Fermenting Grape Must and Fruit Juice
Daniela Fracassetti 1 , Paolo Bottelli 1, Onofrio Corona 2, Roberto Foschino 1 andIleana Vigentini 1,*
1 Department of Food, Environmental and Nutritional Sciences, Università degli Studi di Milano,Via G. Celoria 2, 20133 Milan, Italy; [email protected] (D.F.); [email protected] (P.B.);[email protected] (R.F.)
2 Department of Agricultural, Food and Forest Sciences, University of Palermo, Viale delle Scienze,90128 Palermo, Italy; [email protected]
* Correspondence: [email protected]; Tel.: +39-0250319165; Fax: +39-0250319128
Received: 20 April 2019; Accepted: 27 April 2019; Published: 30 April 2019�����������������
Abstract: In this study, Cabernet Sauvignon and Chardonnay musts, and fruit juices from cherry,kiwi, peach, and strawberry were co-fermented with Saccharomyces cerevisiae EC1118 and Torulasporadelbrueckii UMY196 at two different proportions (80:20 (v/v) and 60:40 (v/v)). The most pleasantfruit-based drink was obtained with Cabernet Sauvignon must and kiwi juice in a proportion of60:40 and fermented with T. delbrueckii. This beverage was produced in higher volume to simulate ascale-up, and the aromatic profile, sensory description, and consumer acceptability were determined.The most powerful odorants of the kiwi-based drink were ethyl octanoate, phenylethanal, ethylhexanoate, vinyl-guaiacol, benzaldehyde, and nonanal, for which the odor activity values were 21.1,3.3, 2.6, 2.2, 1.9, and 1.6, respectively. These findings were in accordance with the sensory analysis,since the emerged descriptors were fruity (ethyl octanoate), honey and floral (phenylethanal), appleand peach (ethyl hexanoate), and citrus (nonanal). The consumers judged the kiwi-based drinkacceptable (67%) and 39% of them would buy it. The reliable fermentation of a grape must/fruit juicewas demonstrated. The kiwi-based drink represents an innovative and pleasant beverage with apositive impact on sustainability as its production can limit the loss of fresh fruits, as well as contributeto the enological field.
Keywords: fruit wines; food innovation; yeasts; secondary metabolites; grape must; kiwi juice
1. Introduction
Innovation in the sector of alcoholic beverages using sustainable approaches is a challenge fromboth environmental and productive points of view. Indeed, possible solutions consider several aspectsincluding waste re-conversion or re-use, social impact (i.e., reduction of food loss, production oflow-alcohol beverages), and economic advantage (i.e., decrease in wine consumption, unsold wine).Wine is an alcoholic beverage obtained by yeast fermentation of a purely grape must of Vitis viniferavine species. The art of winemaking started back ca. 6000–5800 before Christ (BC) during the earlyNeolithic Period in Georgia in the South Caucasus region [1], while alternative alcoholic beveragesfrom hawthorn fruit, rice, and honey mead were already produced as early as ca. 7000 BC in ancientChina [2]. The resulting alcoholic products from fruits other than grapes are called “fruit wines” andthey show differences in taste, nutritive values, and health benefits [3].
In the last 15 years, global wine consumption went up and down [4]. Europe is consuming lessand less wine, while the wine consumption in young producing areas is still growing. New alternativewines are appearing on the market and they are cheap and easy-drinking. Examples are the “flavored”
Metabolites 2019, 9, 86; doi:10.3390/metabo9050086 www.mdpi.com/journal/metabolites

Metabolites 2019, 9, 86 2 of 16
wines (red lollipop, peach, grapefruit, mandarin, or black currant) with medium alcohol content (from8% to 10.5%) obtained by blending wines and fruit juices or flavoring wines with artificial or naturalaromas. The main consumers of these products are younger people between 18 and 34 years old, with33% drinking flavored wines as an aperitif.
Fruit wines are produced from fruit juices other than grape, such as apples, apricots, berries,cherries, plums, strawberries, oranges, mangoes, bananas, and pineapples [5,6], as well asautochthonous Brazilian fruits [7]. Moreover, the production implies the use of fruit juice concentrates,which allows increasing ethanol yield and taste, aroma, and functional features [8]. The productionof alcoholic beverages obtained from the co-fermentation of grape must and fruit juice is yet to beinvestigated. Advantages of this approach are ascribable to an ever-growing rate of global foodconsumption, whereby the food supply production needs to fulfil all requests in a sustainable way interms of environmental soundness, social equity, and economic feasibility. The formulation of newmixed-fruit alcoholic beverages could represent a reduction in fruit surplus and post-harvest fruit loss,and it could positively contribute to the economy of the existing wine industry. The reduction of foodloss and wastes is gaining increasing importance [9] for increasing the food chain sustainability, evenwith the production of novel foods. The fermentation of fruit juices using selected yeasts can yieldfinal products enriched in novel bio-functional compounds not found in traditional wines [3].
This study aimed to investigate, from microbial, chemical, and sensory points of view,the co-fermentation of grape musts and fruit juices obtained from cherries, kiwi, peaches, andstrawberries. Alcoholic fermentations were carried out inoculating either Saccharomyces cerevisiae orthe non-Saccharomyces species, Torulaspora delbrueckii, in four blends of grape musts (Chardonnayand Cabernet Sauvignon) and juices in different proportions. Consumer acceptability was alsoevaluated. The novel products could be produced using the surplus of some agriculture systems, suchas spring/summer fruits and grape.
2. Results and Discussion
2.1. Flask Trials
2.1.1. Fermentation Trends and Chemical Composition
The trend of alcoholic fermentation (AF) was monitored for each must/fruit juice mix. T. delbrueckiishowed a lower fermentative vigor in comparison to S. cerevisiae (Figure 1) as previously found in grapemust fermentation [10]. S. cerevisiae started the AF in 24 h, producing the following averages: (i) fromCabernet musts/fruit-based mixes, 10.90 ± 0.40 and 12.55 ± 0.70 g CO2/L in 80:20 and 60:40 proportions,respectively; (ii) from Chardonnay musts/fruit-based mixes, 12.35 ± 0.95 and 13.55 ± 0.08 g CO2/Lin 80:20 and 60:40 proportions, respectively. The AF started in 48 h with T. delbrueckii reachingsimilar values of CO2/L as the corresponding S. cerevisiae trials: (i) from Cabernet musts/fruit-basedmixes, 10.49 ± 3.35 and 13.84 ± 4.39 g CO2/L in 80:20 and 60:40 proportions, respectively; (ii) fromChardonnay musts/fruit-based mixes, 11.55 ± 2.73 and 13.26 ± 2.16 g CO2/L in 80:20 and 60:40proportions, respectively. While the AF carried out with S. cerevisiae ended in 3–10 days, depending onthe grape/fruit-based mix, T. delbrueckii completed the AF in a longer time (9–33 days) (Figure 1). S.cerevisiae showed a comparable fermentative profile for all types of fruit. In the case of T. delbrueckii, thefermentative trend with kiwi was significantly slower, regardless of the grape–kiwi juice proportion andcombination. Since all inocula were standardized at the same cell concentration (1× 10⁶ colony-formingunits (CFU)/mL) (data not shown), this result needs further investigation.

Metabolites 2019, 9, 86 3 of 16
Metabolites 2019, 9, x 3 of 16
Figure 1. Alcoholic fermentation trends for the trials in flasks of different combinations must/fruit
juice inoculated with Saccharomyces cerevisiae EC1118 (S. c.) and Torulaspora delbrueckii UMY196 (T. d.).
Error bars indicate the standard deviation among replicates.
The residual sugars were about 3 g/L, except for the kiwi-based drinks obtained with Cabernet
Sauvignon must and fermented with T. delbrueckii (Table 1). A higher content of residual sugars and
a slower fermentation can have a positive impact on the aromatic profile [10]. The ethanol yield was
comparable between T. delbrueckii and S. cerevisiae (Table S2, Supplementary Materials); this is of
interest for the production of quality wines where the former species could be used as a starter culture
[11].
Table 1. Chemical parameters determined for fermentation trial with grape must/kiwi juice
fermented with Saccharomyces cerevisiae EC1118 (S. c.) and Torulaspora delbrueckii UMY196 (T. d.).
Must Proportion * Sugar (g/L) Ethanol (v/v) Total Acidity
(g Tartaric Acid/L)
Fermenting Yeast S. c. T. d. S. c. T. d. S. c. T. d.
Cabernet
Sauvignon
80:20 T0 180 ± 17 196 ± 18 - - 7.8 ± 0.3 7.5 ± 0.3
EF 0.80 ± 0.0 71 ± 2 10.8 ± 0.5 6.5 ± 0.3 8.6 ± 0.7 11.5 ± 0.7
60:40 T0 153 ± 14 169 ± 16 - - 9.5 ± 0.4 10.1 ± 0.4
EF 0.10 ± 0.0 52 ± 17 9.6 ± 0.3 7.0 ± 1.3 11.0 ± 0.2 15.0 ± 0.5
Chardonnay
80:20 T0 147 ± 14 160 ± 15 - - 9.3 ± 0.4 9.2 ± 0.4
EF 0.15 ±0.07 0.33 ± 0.00 8.7 ± 0.2 9.1 ± 0.1 10.2 ± 0.4 13.9 ± 0.5
60:40 T0 127 ± 12 135 ± 13 - - 11.1 ± 0.4 11.4 ± 0.5
EF 0.05 ± 0.02 3.2 ± 2.6 7.6 ± 0.1 7.4 ± 0.3 12.2 ± 0.2 16.3 ± 0.3
* The proportion is related to must/kiwi juice (v/v). T0: concentrations of chemical parameters in kiwi
juice/must; EF: concentrations of chemical parameters in grape/kiwi drink at the end of alcoholic
fermentation.
Figure 1. Alcoholic fermentation trends for the trials in flasks of different combinations must/fruit juiceinoculated with Saccharomyces cerevisiae EC1118 (S. c.) and Torulaspora delbrueckii UMY196 (T. d.). Errorbars indicate the standard deviation among replicates.
The residual sugars were about 3 g/L, except for the kiwi-based drinks obtained with CabernetSauvignon must and fermented with T. delbrueckii (Table 1). A higher content of residual sugars anda slower fermentation can have a positive impact on the aromatic profile [10]. The ethanol yieldwas comparable between T. delbrueckii and S. cerevisiae (Table S2, Supplementary Materials); this isof interest for the production of quality wines where the former species could be used as a starterculture [11].
Table 1. Chemical parameters determined for fermentation trial with grape must/kiwi juice fermentedwith Saccharomyces cerevisiae EC1118 (S. c.) and Torulaspora delbrueckii UMY196 (T. d.).
Must Proportion * Sugar (g/L) Ethanol (v/v) Total Acidity(g Tartaric Acid/L)
Fermenting Yeast S. c. T. d. S. c. T. d. S. c. T. d.
CabernetSauvignon
80:20T0 180 ± 17 196 ± 18 - - 7.8 ± 0.3 7.5 ± 0.3EF 0.80 ± 0.0 71 ± 2 10.8 ± 0.5 6.5 ± 0.3 8.6 ± 0.7 11.5 ± 0.7
60:40T0 153 ± 14 169 ± 16 - - 9.5 ± 0.4 10.1 ± 0.4EF 0.10 ± 0.0 52 ± 17 9.6 ± 0.3 7.0 ± 1.3 11.0 ± 0.2 15.0 ± 0.5
Chardonnay80:20
T0 147 ± 14 160 ± 15 - - 9.3 ± 0.4 9.2 ± 0.4EF 0.15 ±0.07 0.33 ± 0.00 8.7 ± 0.2 9.1 ± 0.1 10.2 ± 0.4 13.9 ± 0.5
60:40T0 127 ± 12 135 ± 13 - - 11.1 ± 0.4 11.4 ± 0.5EF 0.05 ± 0.02 3.2 ± 2.6 7.6 ± 0.1 7.4 ± 0.3 12.2 ± 0.2 16.3 ± 0.3
* The proportion is related to must/kiwi juice (v/v). T0: concentrations of chemical parameters in kiwi juice/must; EF:concentrations of chemical parameters in grape/kiwi drink at the end of alcoholic fermentation.
Metabolites 2019, 9, 86 4 of 16
At the end of AF, the concentrations of sugar, ethanol, and organic acids, as well as the pH andtotal acidity, were determined; the characteristics of all final products are summarized in Table A1 andFigure A1 (Appendix A). The decrease in tartaric acid found for the cherry-, peach-, and kiwi-baseddrinks could be due to either salification or precipitation phenomena [12]. A drop of malic acid wasdetected particularly for the cherry-based drinks. This finding needs further investigation since thecontribution of S. cerevisiae in malic acid decrease can be excluded because it lacks a specific system formalic acid transport. An increase in total acidity was found, especially in trials where T. delbrueckiiwas inoculated. This could be due to the higher concentrations of succinic acid responsible for anincrease in titratable acidity during fermentation [13]. T. delbrueckii was a higher producer of succinicacid than S. cerevisiae during the fermentation of must [11]; further studies will be carried out to clarifythe behavior of T. delbrueckii during the co-fermentation of grape must and fruit juice.
2.1.2. Sensory Analysis
The beverages obtained from co-fermenting Cabernet Sauvignon and cherry juice were particularlyunpleasant with both yeasts (scores of overall acceptability <0.5/10) (Figure S1A, SupplementaryMaterials) due to the note of “chemical–medicinal” flavors. Drinks produced with Chardonnayand cherry juice received a better overall acceptability score, albeit still low (3/10) (Figure S1B,Supplementary Materials).
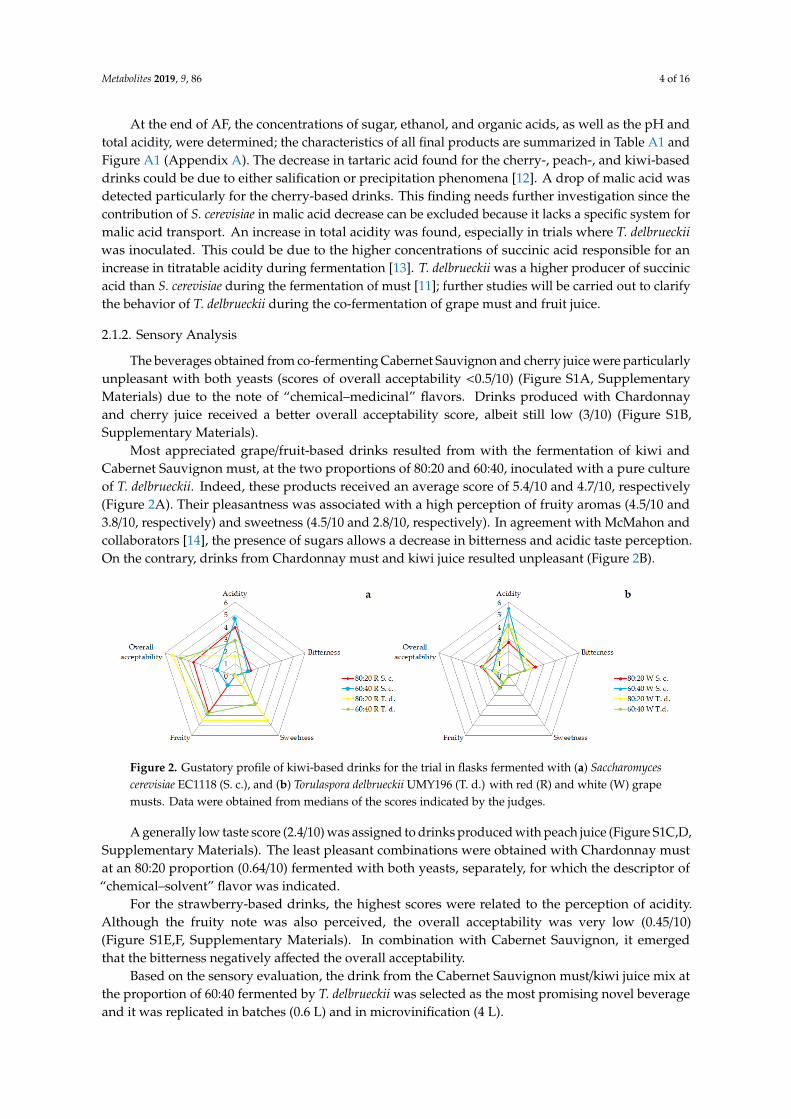
Most appreciated grape/fruit-based drinks resulted from with the fermentation of kiwi andCabernet Sauvignon must, at the two proportions of 80:20 and 60:40, inoculated with a pure cultureof T. delbrueckii. Indeed, these products received an average score of 5.4/10 and 4.7/10, respectively(Figure 2A). Their pleasantness was associated with a high perception of fruity aromas (4.5/10 and3.8/10, respectively) and sweetness (4.5/10 and 2.8/10, respectively). In agreement with McMahon andcollaborators [14], the presence of sugars allows a decrease in bitterness and acidic taste perception.On the contrary, drinks from Chardonnay must and kiwi juice resulted unpleasant (Figure 2B).
Metabolites 2019, 9, x 4 of 16
At the end of AF, the concentrations of sugar, ethanol, and organic acids, as well as the pH and
total acidity, were determined; the characteristics of all final products are summarized in Table A and
Figure A (Appendix). The decrease in tartaric acid found for the cherry-, peach-, and kiwi-based
drinks could be due to either salification or precipitation phenomena [12]. A drop of malic acid was
detected particularly for the cherry-based drinks. This finding needs further investigation since the
contribution of S. cerevisiae in malic acid decrease can be excluded because it lacks a specific system
for malic acid transport. An increase in total acidity was found, especially in trials where T. delbrueckii
was inoculated. This could be due to the higher concentrations of succinic acid responsible for an
increase in titratable acidity during fermentation [13]. T. delbrueckii was a higher producer of succinic
acid than S. cerevisiae during the fermentation of must [11]; further studies will be carried out to clarify
the behavior of T. delbrueckii during the co-fermentation of grape must and fruit juice.
2.1.2. Sensory Analysis
The beverages obtained from co-fermenting Cabernet Sauvignon and cherry juice were
particularly unpleasant with both yeasts (scores of overall acceptability <0.5/10) (Figure S1A,
Supplementary Materials) due to the note of “chemical–medicinal” flavors. Drinks produced with
Chardonnay and cherry juice received a better overall acceptability score, albeit still low (3/10)
(Figure S1B, Supplementary Materials).
Most appreciated grape/fruit-based drinks resulted from with the fermentation of kiwi and
Cabernet Sauvignon must, at the two proportions of 80:20 and 60:40, inoculated with a pure culture
of T. delbrueckii. Indeed, these products received an average score of 5.4/10 and 4.7/10, respectively
(Figure 2A). Their pleasantness was associated with a high perception of fruity aromas (4.5/10 and
3.8/10, respectively) and sweetness (4.5/10 and 2.8/10, respectively). In agreement with McMahon and
collaborators [14], the presence of sugars allows a decrease in bitterness and acidic taste perception.
On the contrary, drinks from Chardonnay must and kiwi juice resulted unpleasant (Figure 2B).
Figure 2. Gustatory profile of kiwi-based drinks for the trial in flasks fermented with (a) Saccharomyces
cerevisiae EC1118 (S. c.), and (b) Torulaspora delbrueckii UMY196 (T. d.) with red (R) and white (W)
grape musts. Data were obtained from medians of the scores indicated by the judges.
A generally low taste score (2.4/10) was assigned to drinks produced with peach juice (Figures
S1C,D, Supplementary Materials). The least pleasant combinations were obtained with Chardonnay
must at an 80:20 proportion (0.64/10) fermented with both yeasts, separately, for which the descriptor
of “chemical–solvent” flavor was indicated.
For the strawberry-based drinks, the highest scores were related to the perception of acidity.
Although the fruity note was also perceived, the overall acceptability was very low (0.45/10) (Figures
S1E,F, Supplementary Materials). In combination with Cabernet Sauvignon, it emerged that the
bitterness negatively affected the overall acceptability.
Based on the sensory evaluation, the drink from the Cabernet Sauvignon must/kiwi juice mix at
the proportion of 60:40 fermented by T. delbrueckii was selected as the most promising novel beverage
and it was replicated in batches (0.6 L) and in microvinification (4 L).
Figure 2. Gustatory profile of kiwi-based drinks for the trial in flasks fermented with (a) Saccharomycescerevisiae EC1118 (S. c.), and (b) Torulaspora delbrueckii UMY196 (T. d.) with red (R) and white (W) grapemusts. Data were obtained from medians of the scores indicated by the judges.
A generally low taste score (2.4/10) was assigned to drinks produced with peach juice (Figure S1C,D,Supplementary Materials). The least pleasant combinations were obtained with Chardonnay mustat an 80:20 proportion (0.64/10) fermented with both yeasts, separately, for which the descriptor of“chemical–solvent” flavor was indicated.
For the strawberry-based drinks, the highest scores were related to the perception of acidity.Although the fruity note was also perceived, the overall acceptability was very low (0.45/10)(Figure S1E,F, Supplementary Materials). In combination with Cabernet Sauvignon, it emergedthat the bitterness negatively affected the overall acceptability.
Based on the sensory evaluation, the drink from the Cabernet Sauvignon must/kiwi juice mix atthe proportion of 60:40 fermented by T. delbrueckii was selected as the most promising novel beverageand it was replicated in batches (0.6 L) and in microvinification (4 L).
Metabolites 2019, 9, 86 5 of 16
2.2. Batch Experiment
2.2.1. Alcoholic Fermentation Trend
The Cabernet Sauvignon/kiwi blend had the chemical characteristics shown in Table 2. The yeastinoculum resulted similar to the one performed during the preparation of flasks (5.8 ± 1.6 × 10⁶ vs.6.2 ± 1.6 × 10⁶ CFU/mL). A higher amount of g CO2/L was developed in 48 h during the fermentationin batch in comparison to the fermentation in flask (28.5 ± 5.4 vs. 8.97 ± 0.53 g CO2/L produced intwo days). The faster alcoholic fermentation could be due to the sampling, which was carried out byopening the bottles, leading to a possible aeration of must. This could favor the synthesis of essentialfatty acids and sterols required for yeast replication [15] and, consequently, the fermentation ratecould increase.
Table 2. Chemical parameters determined for batch fermentation with Cabernet Sauvignon must/kiwijuice 40:60 (v/v) fermented with Torulaspora delbrueckii UMY196.
Chemical Parameter Must/Kiwi Juice Kiwi-Based Drink
Sugar (g/L) 190.1 ± 8.0 31.1 ± 8.8Ethanol (v/v) - 7.6 ± 0.4
pH 3.2 ± 0.0 3.2 ± 0.1Total acidity (g tartaric acid/L) 10.2 ± 0.3 14.9 ± 1.4
Tartaric acid (g/L) 1.70 ± 0.06 1.66 ± 0.05Malic acid (g/L) 2.58 ± 0.39 3.00 ± 0.22Lactic acid (g/L) n.d. n.d.Acetic acid (g/L) n.d. 0.21 ± 0.06Citric acid (g/L) 6.03 ± 0.22 5.86 ± 0.14
Succinic acid (g/L) n.d. 1.83 ± 0.11
The trial was carried out in triplicate (volume: 0.6 L); n.d.: not detected.
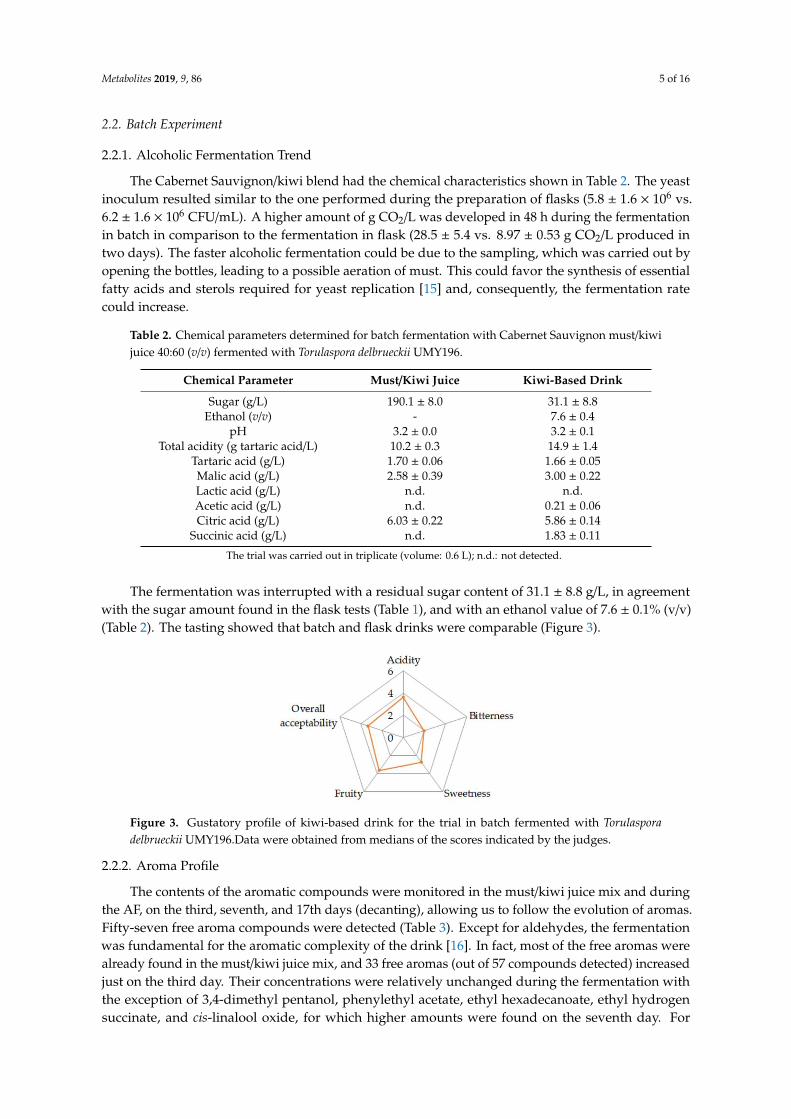
The fermentation was interrupted with a residual sugar content of 31.1 ± 8.8 g/L, in agreementwith the sugar amount found in the flask tests (Table 1), and with an ethanol value of 7.6 ± 0.1% (v/v)(Table 2). The tasting showed that batch and flask drinks were comparable (Figure 3).
Metabolites 2019, 9, x 5 of 16
2.2. Batch Experiment
2.2.1. Alcoholic Fermentation Trend
The Cabernet Sauvignon/kiwi blend had the chemical characteristics shown in Table 2. The yeast
inoculum resulted similar to the one performed during the preparation of flasks (5.8 ± 1.6 × 10⁶ vs. 6.2
± 1.6 × 10⁶ CFU/mL). A higher amount of g CO2/L was developed in 48 h during the fermentation in
batch in comparison to the fermentation in flask (28.5 ± 5.4 vs. 8.97 ± 0.53 g CO2/L produced in two
days). The faster alcoholic fermentation could be due to the sampling, which was carried out by
opening the bottles, leading to a possible aeration of must. This could favor the synthesis of essential
fatty acids and sterols required for yeast replication [15] and, consequently, the fermentation rate
could increase.
The fermentation was interrupted with a residual sugar content of 31.1 ± 8.8 g/L, in agreement with
the sugar amount found in the flask tests (Table 1), and with an ethanol value of 7.6 ± 0.1% (v/v) (Table
2). The tasting showed that batch and flask drinks were comparable (Figure 3).
Table 2. Chemical parameters determined for batch fermentation with Cabernet Sauvignon
must/kiwi juice 40:60 (v/v) fermented with Torulaspora delbrueckii UMY196.
Chemical Parameter Must/Kiwi Juice Kiwi-Based Drink
Sugar (g/L) 190.1 ± 8.0 31.1 ± 8.8
Ethanol (v/v) - 7.6 ± 0.4
pH 3.2 ± 0.0 3.2 ± 0.1
Total acidity (g tartaric acid/L) 10.2 ± 0.3 14.9 ± 1.4
Tartaric acid (g/L) 1.70 ± 0.06 1.66 ± 0.05
Malic acid (g/L) 2.58 ± 0.39 3.00 ± 0.22
Lactic acid (g/L) n.d. n.d.
Acetic acid (g/L) n.d. 0.21 ± 0.06
Citric acid (g/L) 6.03 ± 0.22 5.86 ± 0.14
Succinic acid (g/L) n.d. 1.83 ± 0.11
The trial was carried out in triplicate (volume: 0.6 L); n.d.: not detected.
Figure 3. Gustatory profile of kiwi-based drink for the trial in batch fermented with Torulaspora
delbrueckii UMY196.Data were obtained from medians of the scores indicated by the judges.
2.2.2. Aroma Profile
The contents of the aromatic compounds were monitored in the must/kiwi juice mix and during
the AF, on the third, seventh, and 17th days (decanting), allowing us to follow the evolution of
aromas. Fifty-seven free aroma compounds were detected (Table 3). Except for aldehydes, the
fermentation was fundamental for the aromatic complexity of the drink [16]. In fact, most of the free
aromas were already found in the must/kiwi juice mix, and 33 free aromas (out of 57 compounds
detected) increased just on the third day. Their concentrations were relatively unchanged during the
fermentation with the exception of 3,4-dimethyl pentanol, phenylethyl acetate, ethyl hexadecanoate,
Figure 3. Gustatory profile of kiwi-based drink for the trial in batch fermented with Torulasporadelbrueckii UMY196.Data were obtained from medians of the scores indicated by the judges.
2.2.2. Aroma Profile
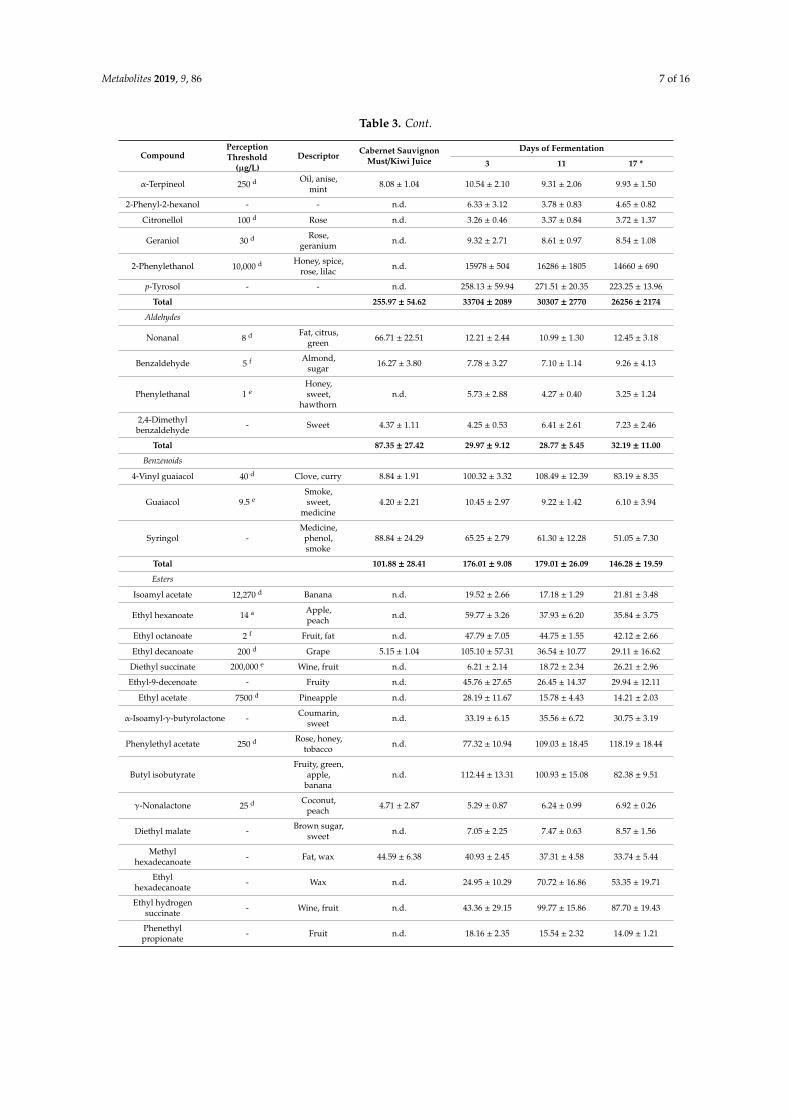
The contents of the aromatic compounds were monitored in the must/kiwi juice mix and duringthe AF, on the third, seventh, and 17th days (decanting), allowing us to follow the evolution of aromas.Fifty-seven free aroma compounds were detected (Table 3). Except for aldehydes, the fermentationwas fundamental for the aromatic complexity of the drink [16]. In fact, most of the free aromas werealready found in the must/kiwi juice mix, and 33 free aromas (out of 57 compounds detected) increasedjust on the third day. Their concentrations were relatively unchanged during the fermentation withthe exception of 3,4-dimethyl pentanol, phenylethyl acetate, ethyl hexadecanoate, ethyl hydrogensuccinate, and cis-linalool oxide, for which higher amounts were found on the seventh day. For
Metabolites 2019, 9, 86 6 of 16
some of the free aromas, the slight decreases observed may be caused by the bottle opening for thesampling and, except for aldehydes and acids, they were not statistically significant. The most powerfulodorants of the kiwi-based drink were ethyl octanoate, phenylethanal, ethyl hexanoate, vinyl-guaiacol,benzaldehyde, and nonanal, for which the odor activity values (OAVs) were 21.1, 3.3, 2.6, 2.2, 1.9,and 1.6, respectively. Ethyl octanoate and ethyl hexanoate are esters derived from the enzymaticactivity of yeasts, confirming that the use of T. delbrueckii can improve the aromatic profile as occurs inwines [10,16,17]. Comparing the aromatic composition of wines obtained from Cabernet Sauvignongrapes and one of two kiwi fruit juices and purees [18,19], we can hypothesize that phenylethanal andnonanal derive from kiwi juice, as they were not present in Cabernet Sauvignon wines analyzed bythe cited authors. All the other compounds originated from the fermentative activity of yeasts, sincevarietal aromas specific to the Cabernet Sauvignon variety were not detected. This highlights that kiwijuice can positively influence the aromatic profile of the final grape/kiwi-based drink.
Table 3. Evolution of free aromatic compounds determined for the batch fermentation with CabernetSauvignon must/kiwi juice 60:40 (v/v) fermented with Torulaspora delbrueckii UMY196.
CompoundPerceptionThreshold
(µg/L)Descriptor Cabernet Sauvignon
Must/Kiwi JuiceDays of Fermentation
3 11 17 *
Acids
Isobutyric acid 2300 cRancid,butter,cheese
4.12 ± 1.04 89.77 ± 78.06 n.d. n.d.
Isopentanoic acid 33 e Sweat,rancid n.d. 100.72 ± 95.63 35.92 ± 2.95 36.41 ± 6.74
Pentanoic acid 17 d Sweat n.d. 3.84 ± 0.94 3.00 ± 1.25 2.00 ± 0.59
Hexanoic acid 420 c Sweat 32.02 ± 11.50 603.73 ± 57.96 465.00 ± 51.79 388.51 ± 33.64
trans-2-Hexenoicacid - Must, fat 25.31 ± 8.52 42.69 ± 10.35 35.55 ± 5.43 27.84 ± 2.18
Octanoic acid 500 c Cheese,sweat 13.13 ± 0.87 563.38 ± 15.85 479.39 ± 43.96 455.36 ± 29.24
Decanoic acid 1000 d Rancid, fat n.d. 319.58 ± 32.81 155.78 ± 41.90 112.86 ± 54.34
9-Decenoic acid 2 d Fat n.d. 112.98 ± 64.23 79.20 ± 14.41 71.54 ± 33.18
2-Methylbutanoicacid 33 d Cheese,
sweat n.d. 130.16 ± 21.04 125.10 ± 16.46 89.07 ± 21.52
2-Butenoic acid - Milky 52.51 ± 9.48 72.45 ± 8.05 76.33 ± 22.06 60.12 ± 8.34
Total 127.09 ± 31.41 2039.31 ± 384.93 1455.26 ± 200.20 1243.71 ± 189.78
Alcohols
Isobutanol 40,000 dWine,
solvent,bitter
60.27 ± 9.53 138.66 ± 17.84 94.70 ± 18.77 76.05 ± 7.76
3-Penten-2-ol - Green, vinyl 7.70 ± 1.42 32.98 ± 15.11 32.91 ± 7.54 27.04 ± 6.73
1-Pentanol - Balsamic n.d. 10.62 ± 1.70 6.72 ± 1.80 5.83 ± 0.96
1-Hexanol 1110 g Resin,flower, green 48.55 ± 15.96 396.08 ± 70.77 328.74 ± 23.61 351.68 ± 56.33
2-Hexanol - Resin,flower, green 20.77 ± 5.06 29.54 ± 3.40 26.19 ± 4.83 24.54 ± 0.64
3-Ethoxy-1-propanol - Fruit n.d. 184.45 ± 28.60 169.08 ± 4.77 152.96 ± 19.25
cis-3-Hexen-1-ol 400 e Grass 29.70 ± 10.07 35.87 ± 2.94 25.83 ± 0.50 20.34 ± 2.47
2-Ethyl-1-decanol - Fat 25.65 ± 4.03 20.32 ± 14.26 2.21 ± 0.48 2.29 ± 0.21
4-Hepten-1-ol - Green,grassy odor n.d. 4.66 ± 4.47 4.54 ± 2.23 5.25 ± 0.92
Isoamyl alcohol 30,000 d Spirit,alcoholic 52.30 ± 6.27 16569 ± 1348 12909 ± 860 11224 ± 953
2-Methyl-4-octanol - Cucumber n.d. 4.85 ± 1.19 2.72 ± 0.89 4.28 ± 0.44
2,3-Butanediol - Fruit, onion n.d. 2.49 ± 1.62 11.07 ± 2.17 10.71 ± 0.78
Linalool 15 d Flower,lavender n.d. 8.39 ± 4.80 2.59 ± 0.55 2.78 ± 0.40
3,4-Dimethylpentanol - - 2.95 ± 1.24 2.23 ± 0.25 107.98 ± 11.40 92.08 ± 15.65
Metabolites 2019, 9, 86 7 of 16
Table 3. Cont.
CompoundPerceptionThreshold
(µg/L)Descriptor Cabernet Sauvignon
Must/Kiwi JuiceDays of Fermentation
3 11 17 *
α-Terpineol 250 d Oil, anise,mint 8.08 ± 1.04 10.54 ± 2.10 9.31 ± 2.06 9.93 ± 1.50
2-Phenyl-2-hexanol - - n.d. 6.33 ± 3.12 3.78 ± 0.83 4.65 ± 0.82
Citronellol 100 d Rose n.d. 3.26 ± 0.46 3.37 ± 0.84 3.72 ± 1.37
Geraniol 30 d Rose,geranium n.d. 9.32 ± 2.71 8.61 ± 0.97 8.54 ± 1.08
2-Phenylethanol 10,000 d Honey, spice,rose, lilac n.d. 15978 ± 504 16286 ± 1805 14660 ± 690
p-Tyrosol - - n.d. 258.13 ± 59.94 271.51 ± 20.35 223.25 ± 13.96
Total 255.97 ± 54.62 33704 ± 2089 30307 ± 2770 26256 ± 2174
Aldehydes
Nonanal 8 d Fat, citrus,green 66.71 ± 22.51 12.21 ± 2.44 10.99 ± 1.30 12.45 ± 3.18
Benzaldehyde 5 f Almond,sugar 16.27 ± 3.80 7.78 ± 3.27 7.10 ± 1.14 9.26 ± 4.13
Phenylethanal 1 eHoney,sweet,
hawthornn.d. 5.73 ± 2.88 4.27 ± 0.40 3.25 ± 1.24
2,4-Dimethylbenzaldehyde - Sweet 4.37 ± 1.11 4.25 ± 0.53 6.41 ± 2.61 7.23 ± 2.46
Total 87.35 ± 27.42 29.97 ± 9.12 28.77 ± 5.45 32.19 ± 11.00
Benzenoids
4-Vinyl guaiacol 40 d Clove, curry 8.84 ± 1.91 100.32 ± 3.32 108.49 ± 12.39 83.19 ± 8.35
Guaiacol 9.5 eSmoke,sweet,
medicine4.20 ± 2.21 10.45 ± 2.97 9.22 ± 1.42 6.10 ± 3.94
Syringol -Medicine,
phenol,smoke
88.84 ± 24.29 65.25 ± 2.79 61.30 ± 12.28 51.05 ± 7.30
Total 101.88 ± 28.41 176.01 ± 9.08 179.01 ± 26.09 146.28 ± 19.59
Esters
Isoamyl acetate 12,270 d Banana n.d. 19.52 ± 2.66 17.18 ± 1.29 21.81 ± 3.48
Ethyl hexanoate 14 a Apple,peach n.d. 59.77 ± 3.26 37.93 ± 6.20 35.84 ± 3.75
Ethyl octanoate 2 f Fruit, fat n.d. 47.79 ± 7.05 44.75 ± 1.55 42.12 ± 2.66
Ethyl decanoate 200 d Grape 5.15 ± 1.04 105.10 ± 57.31 36.54 ± 10.77 29.11 ± 16.62
Diethyl succinate 200,000 e Wine, fruit n.d. 6.21 ± 2.14 18.72 ± 2.34 26.21 ± 2.96
Ethyl-9-decenoate - Fruity n.d. 45.76 ± 27.65 26.45 ± 14.37 29.94 ± 12.11
Ethyl acetate 7500 d Pineapple n.d. 28.19 ± 11.67 15.78 ± 4.43 14.21 ± 2.03
α-Isoamyl-γ-butyrolactone - Coumarin,sweet n.d. 33.19 ± 6.15 35.56 ± 6.72 30.75 ± 3.19
Phenylethyl acetate 250 d Rose, honey,tobacco n.d. 77.32 ± 10.94 109.03 ± 18.45 118.19 ± 18.44
Butyl isobutyrateFruity, green,
apple,banana
n.d. 112.44 ± 13.31 100.93 ± 15.08 82.38 ± 9.51
γ-Nonalactone 25 d Coconut,peach 4.71 ± 2.87 5.29 ± 0.87 6.24 ± 0.99 6.92 ± 0.26
Diethyl malate - Brown sugar,sweet n.d. 7.05 ± 2.25 7.47 ± 0.63 8.57 ± 1.56
Methylhexadecanoate - Fat, wax 44.59 ± 6.38 40.93 ± 2.45 37.31 ± 4.58 33.74 ± 5.44
Ethylhexadecanoate - Wax n.d. 24.95 ± 10.29 70.72 ± 16.86 53.35 ± 19.71
Ethyl hydrogensuccinate - Wine, fruit n.d. 43.36 ± 29.15 99.77 ± 15.86 87.70 ± 19.43
Phenethylpropionate - Fruit n.d. 18.16 ± 2.35 15.54 ± 2.32 14.09 ± 1.21

Metabolites 2019, 9, 86 8 of 16
Table 3. Cont.
CompoundPerceptionThreshold
(µg/L)Descriptor Cabernet Sauvignon
Must/Kiwi JuiceDays of Fermentation
3 11 17 *
Total 54.46 ± 10.28 675.03 ± 189.51 679.92 ± 122.45 634.95 ± 122.37
Furanoids
cis-Linalool oxide - Flower n.d. 1.96 ± 0.50 197.44 ± 27.48 175.09 ± 4.73
Ketones
6-Methyl-2-heptanone - Soap n.d. 8.16 ± 4.18 6.73 ± 4.97 6.01 ± 1.16
Norisoprenoids
3-Hydroxy-β-damascone - Apple, tea,tobacco 11.31 ± 6.25 146.28 ± 106.57 65.23 ± 30.63 87.69 ± 8.09
Thiols
3-(Methylthio)-propanol 1000 b Sweet,potato n.d. 51.62 ± 8.23 63.92 ± 6.73 53.89 ± 6.25
The trial was carried out in triplicate. * Sampling at the end of fermentation; n.d.: not detected. References: a [20];b [21]; c [22]; d [23]; e [24]; f [25]; g [26].
Twenty glycosylated aroma compounds were detected and are listed in Table 4. Theirconcentrations decreased from the beginning of AF, in particular those of benzyl alcohol, 2-hexanal,4-vinyl guaicol, and 3-oxo-α-ionol. Our findings suggest that the strain of T. delbrueckii used for the AFcould perform a glycosidase activity, as reported in the literature [27]. Further investigation will becarried out to confirm this activity.
Table 4. Evolution of glycosylated aromatic compounds determined for the batch fermentation withCabernet Sauvignon must/kiwi juice 60:40 (v/v) fermented with Torulaspora delbrueckii UMY196.
CompoundPerceptionThreshold
(µg/L)Descriptor Cabernet Sauvignon
Must/Kiwi JuiceDays of Fermentation
3 11 17 *
Acids
Nonanoic acid - Green, fat 20.20 ± 1.22 11.13 ± 1.23 17.10 ± 2.61 17.89 ± 3.22
Geranic acid - Green, floral 28.77 ± 9.87 26.22 ± 10.76 21.65 ± 10.08 20.65 ± 2.81
Total 48.97 ± 11.09 37.25 ± 11.99 38.75 ± 12.69 38.54 ± 6.03
Alcohols
3-Penten-2-ol - Green, vinyl 41.32 ± 2.79 41.41 ± 4.60 30.93 ± 9.42 38.67 ± 6.20
1-Hexanol 1110 c Resin,flower, green 34.95 ± 4.95 33.81 ± 1.92 32.93 ± 5.49 28.73 ± 1.36
2-Hexanol - Resin,flower, green 27.31 ± 2.96 24.95 ± 0.83 25.61 ± 5.46 26.56 ± 3.20
3-Octanol - Moss, nut,mushroom 79.09 ± 4.60 98.55 ± 4.14 99.64 ± 2.55 106.25 ± 2.74
Linalool 15 a Flower,lavender 12.10 ± 2.69 11.09 ± 1.49 10.19 ± 0.78 7.87 ± 3.44
α-Terpineol 250 a Oil, anise,mint 9.34 ± 1.07 7.99 ± 0.71 9.21 ± 0.40 10.16 ± 1.85
Nerol - Sweet 112.53 ± 5.18 125.19 ± 8.13 130.25 ± 4.49 131.72 ± 13.58
Benzyl alcohol - Sweet,flower 334.71 ± 13.38 113.71 ± 6.47 110.66 ± 8.20 78.00 ± 9.63
8-Hydroxygeraniol - - 8.34 ± 1.82 8.38 ± 1.22 8.55 ± 0.63 16.24 ± 3.92
Total 659.69 ± 39.46 465.08 ± 29.51 457.97 ± 37.41 444.20 ± 45.92
Aldehydes
2-Hexanal - Grass, tallow,fat 164.99 ± 19.71 42.11 ± 7.92 34.88 ± 8.33 33.52 ± 5.48
Nonanal 8 a Fat, citrus,green 4.31 ± 1.16 3.08 ± 0.19 2.45 ± 0.57 12.78 ± 2.33
Benzaldehyde 5 b Almond,sugar 9.22 ± 2.66 4.09 ± 2.22 2.63 ± 0.61 2.52 ± 0.91
Metabolites 2019, 9, 86 9 of 16
Table 4. Cont.
CompoundPerceptionThreshold
(µg/L)Descriptor Cabernet Sauvignon
Must/Kiwi JuiceDays of Fermentation
3 11 17 *
Total 178.51 ± 23.54 49.28 ± 10.34 39.96 ± 9.52 48.82 ± 8.72
Benzenoids
4-Vinyl guaiacol 40a Clove, curry 154.10 ± 36.96 84.51 ± 13.28 100.87 ± 10.01 95.61 ± 5.82
Eugenol - Clove, honey 14.20 ± 2.32 17.10 ± 2.98 16.96 ± 1.85 17.52 ± 0.27
Syringol -Medicine,
phenol,smoke
49.85 ± 19.09 31.19 ± 8.11 58.55 ± 22.44 44.61 ± 9.42
Total 218.16 ± 58.37 132.80 ± 24.36 176.38 ± 34.29 157.73 ± 15.52
Norisoprenoids
3-oxo-α-damascone - Apple 35.24 ± 11.16 39.86 ± 1.83 38.49 ± 3.05 37.47 ± 3.72
3-Oxo-α-ionol - Spice, tea,tobacco 118.34 ± 32.57 83.13 ± 27.57 81.43 ± 2.23 70.78 ± 8.83
Total 153.58 ± 58 123.00 ± 29.39 119.92 ± 5.28 108.25 ± 12.55
Furanoids
cis-Linalool oxide - Flower 11.18 ± 1.72 11.34 ± 1.09 12.41 ± 0.24 12.26 ± 0.82
The trial was carried out in triplicate. * Sampling at the end of fermentation; n.d.: not detected. References: a [23];b [25]; c [26].
2.3. Microvinification
2.3.1. Fermentation Trend and Chemical Composition
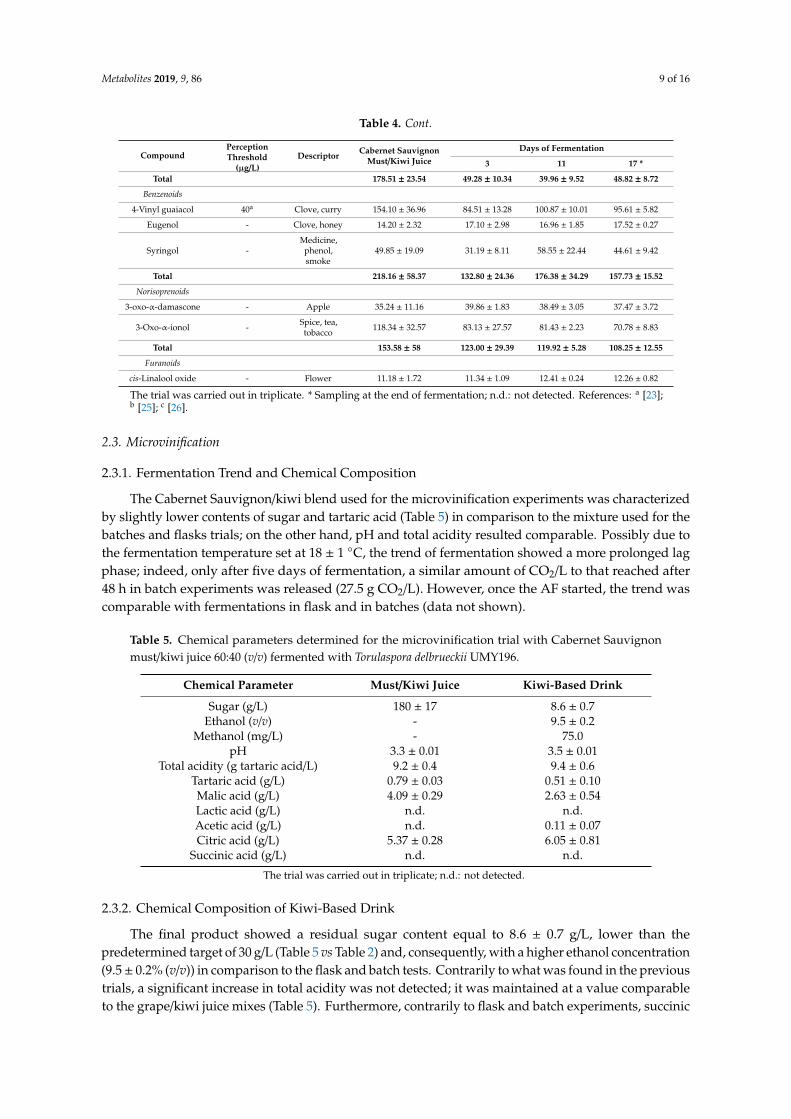
The Cabernet Sauvignon/kiwi blend used for the microvinification experiments was characterizedby slightly lower contents of sugar and tartaric acid (Table 5) in comparison to the mixture used for thebatches and flasks trials; on the other hand, pH and total acidity resulted comparable. Possibly due tothe fermentation temperature set at 18 ± 1 ◦C, the trend of fermentation showed a more prolonged lagphase; indeed, only after five days of fermentation, a similar amount of CO2/L to that reached after48 h in batch experiments was released (27.5 g CO2/L). However, once the AF started, the trend wascomparable with fermentations in flask and in batches (data not shown).
Table 5. Chemical parameters determined for the microvinification trial with Cabernet Sauvignonmust/kiwi juice 60:40 (v/v) fermented with Torulaspora delbrueckii UMY196.
Chemical Parameter Must/Kiwi Juice Kiwi-Based Drink
Sugar (g/L) 180 ± 17 8.6 ± 0.7Ethanol (v/v) - 9.5 ± 0.2
Methanol (mg/L) - 75.0pH 3.3 ± 0.01 3.5 ± 0.01
Total acidity (g tartaric acid/L) 9.2 ± 0.4 9.4 ± 0.6Tartaric acid (g/L) 0.79 ± 0.03 0.51 ± 0.10Malic acid (g/L) 4.09 ± 0.29 2.63 ± 0.54Lactic acid (g/L) n.d. n.d.Acetic acid (g/L) n.d. 0.11 ± 0.07Citric acid (g/L) 5.37 ± 0.28 6.05 ± 0.81
Succinic acid (g/L) n.d. n.d.
The trial was carried out in triplicate; n.d.: not detected.
2.3.2. Chemical Composition of Kiwi-Based Drink
The final product showed a residual sugar content equal to 8.6 ± 0.7 g/L, lower than thepredetermined target of 30 g/L (Table 5 vs Table 2) and, consequently, with a higher ethanol concentration(9.5± 0.2% (v/v)) in comparison to the flask and batch tests. Contrarily to what was found in the previoustrials, a significant increase in total acidity was not detected; it was maintained at a value comparableto the grape/kiwi juice mixes (Table 5). Furthermore, contrarily to flask and batch experiments, succinic
Metabolites 2019, 9, 86 10 of 16
acid failed to be produced. The concentration of methanol was 75 mg/L, lower than the law limit forwine fixed as 200 mg/L by the European Community [28].
2.3.3. Sensory Analysis
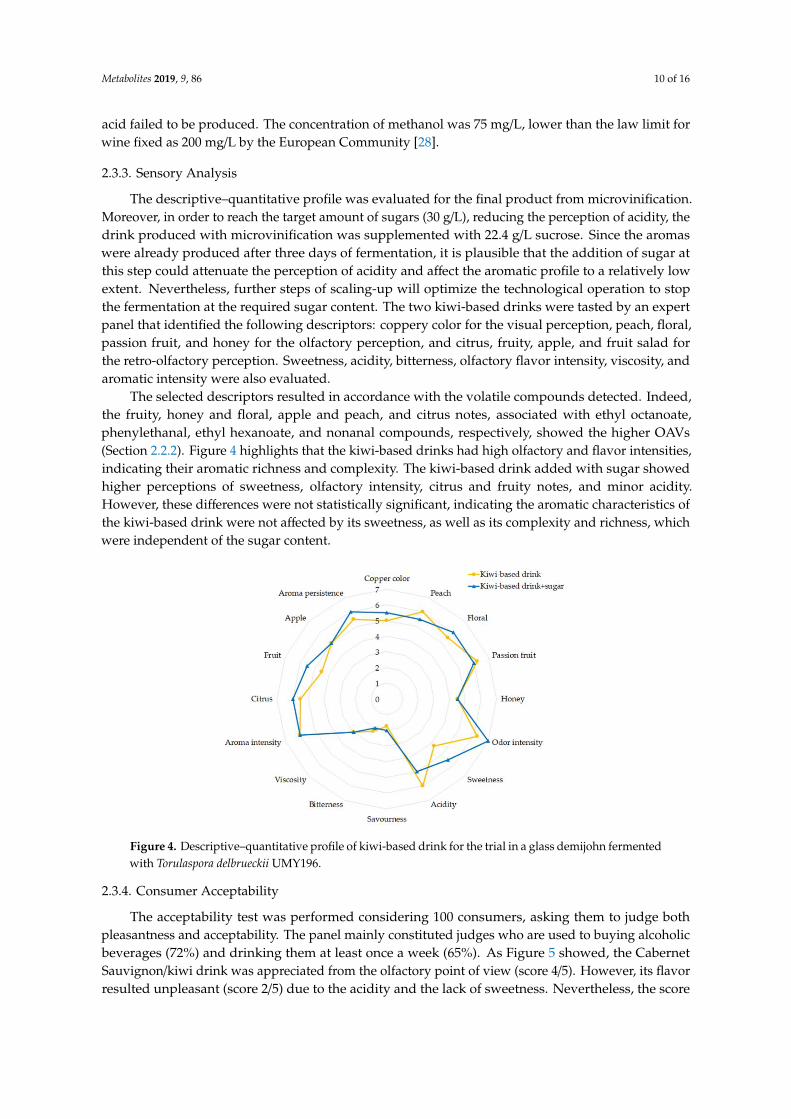
The descriptive–quantitative profile was evaluated for the final product from microvinification.Moreover, in order to reach the target amount of sugars (30 g/L), reducing the perception of acidity, thedrink produced with microvinification was supplemented with 22.4 g/L sucrose. Since the aromaswere already produced after three days of fermentation, it is plausible that the addition of sugar atthis step could attenuate the perception of acidity and affect the aromatic profile to a relatively lowextent. Nevertheless, further steps of scaling-up will optimize the technological operation to stopthe fermentation at the required sugar content. The two kiwi-based drinks were tasted by an expertpanel that identified the following descriptors: coppery color for the visual perception, peach, floral,passion fruit, and honey for the olfactory perception, and citrus, fruity, apple, and fruit salad forthe retro-olfactory perception. Sweetness, acidity, bitterness, olfactory flavor intensity, viscosity, andaromatic intensity were also evaluated.
The selected descriptors resulted in accordance with the volatile compounds detected. Indeed,the fruity, honey and floral, apple and peach, and citrus notes, associated with ethyl octanoate,phenylethanal, ethyl hexanoate, and nonanal compounds, respectively, showed the higher OAVs(Section 2.2.2). Figure 4 highlights that the kiwi-based drinks had high olfactory and flavor intensities,indicating their aromatic richness and complexity. The kiwi-based drink added with sugar showedhigher perceptions of sweetness, olfactory intensity, citrus and fruity notes, and minor acidity.However, these differences were not statistically significant, indicating the aromatic characteristics ofthe kiwi-based drink were not affected by its sweetness, as well as its complexity and richness, whichwere independent of the sugar content.
Metabolites 2019, 9, x 10 of 16
of the kiwi-based drink were not affected by its sweetness, as well as its complexity and richness,
which were independent of the sugar content.
Figure 4. Descriptive–quantitative profile of kiwi-based drink for the trial in a glass demijohn
fermented with Torulaspora delbrueckii UMY196.
2.3.4. Consumer Acceptability
The acceptability test was performed considering 100 consumers, asking them to judge both
pleasantness and acceptability. The panel mainly constituted judges who are used to buying alcoholic
beverages (72%) and drinking them at least once a week (65%). As Figure 5 showed, the Cabernet
Sauvignon/kiwi drink was appreciated from the olfactory point of view (score 4/5). However, its
flavor resulted unpleasant (score 2/5) due to the acidity and the lack of sweetness. Nevertheless, the
score of global pleasantness was 3/5 as an average. In general, 67% of consumers considered the
product acceptable and 39% stated they would buy it.
Mean
Mean±SD
Mean±1,96*SD
Visual pleasantness
Olfactory pleasantness
Flavour pleasantness
Global pleasantness
0
1
2
3
4
5
6
Figure 5. Box and wisker plot of the consumer acceptability test obtained for the kiwi-based drink for
the trial in a glass demijohn fermented with Torulaspora delbrueckii UMY196.
3. Materials and Methods
3.1. Preparation of Fruit Juices and Musts
Figure 4. Descriptive–quantitative profile of kiwi-based drink for the trial in a glass demijohn fermentedwith Torulaspora delbrueckii UMY196.
2.3.4. Consumer Acceptability
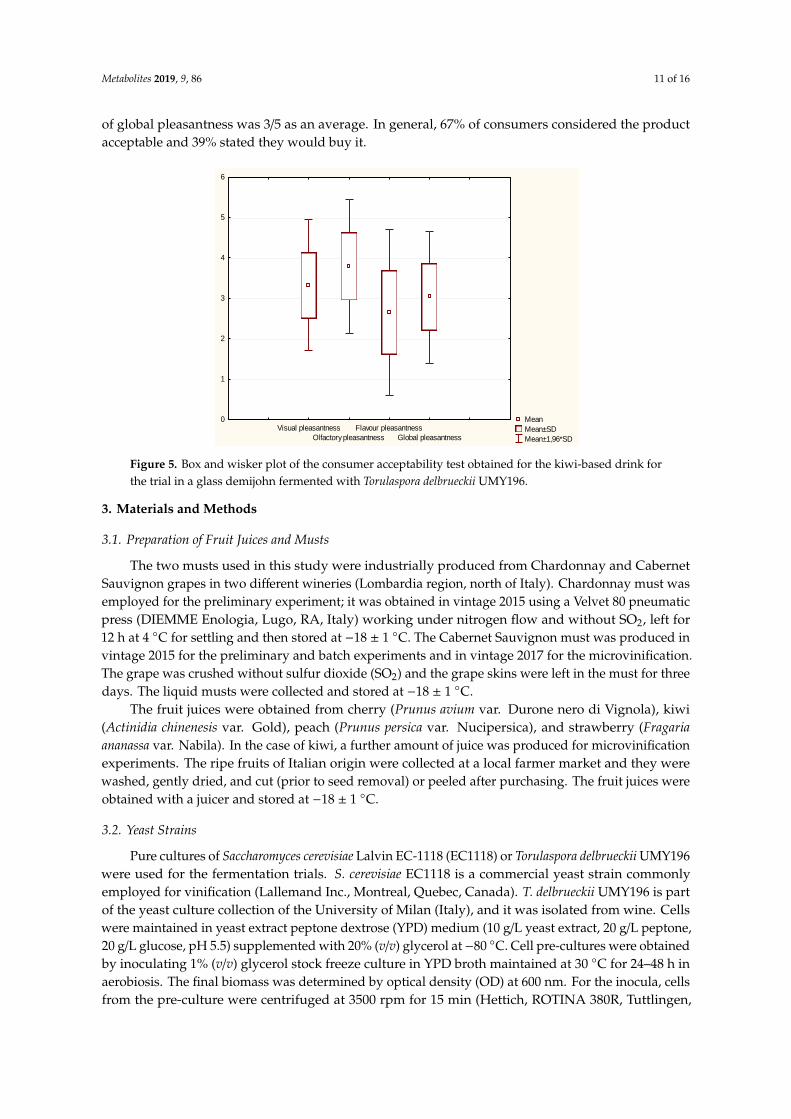
The acceptability test was performed considering 100 consumers, asking them to judge bothpleasantness and acceptability. The panel mainly constituted judges who are used to buying alcoholicbeverages (72%) and drinking them at least once a week (65%). As Figure 5 showed, the CabernetSauvignon/kiwi drink was appreciated from the olfactory point of view (score 4/5). However, its flavorresulted unpleasant (score 2/5) due to the acidity and the lack of sweetness. Nevertheless, the score
Metabolites 2019, 9, 86 11 of 16
of global pleasantness was 3/5 as an average. In general, 67% of consumers considered the productacceptable and 39% stated they would buy it.
Metabolites 2019, 9, x 10 of 16
of the kiwi-based drink were not affected by its sweetness, as well as its complexity and richness,
which were independent of the sugar content.
Figure 4. Descriptive–quantitative profile of kiwi-based drink for the trial in a glass demijohn
fermented with Torulaspora delbrueckii UMY196.
2.3.4. Consumer Acceptability
The acceptability test was performed considering 100 consumers, asking them to judge both
pleasantness and acceptability. The panel mainly constituted judges who are used to buying alcoholic
beverages (72%) and drinking them at least once a week (65%). As Figure 5 showed, the Cabernet
Sauvignon/kiwi drink was appreciated from the olfactory point of view (score 4/5). However, its
flavor resulted unpleasant (score 2/5) due to the acidity and the lack of sweetness. Nevertheless, the
score of global pleasantness was 3/5 as an average. In general, 67% of consumers considered the
product acceptable and 39% stated they would buy it.
Mean
Mean±SD
Mean±1,96*SD
Visual pleasantness
Olfactory pleasantness
Flavour pleasantness
Global pleasantness
0
1
2
3
4
5
6
Figure 5. Box and wisker plot of the consumer acceptability test obtained for the kiwi-based drink for
the trial in a glass demijohn fermented with Torulaspora delbrueckii UMY196.
3. Materials and Methods
3.1. Preparation of Fruit Juices and Musts
Figure 5. Box and wisker plot of the consumer acceptability test obtained for the kiwi-based drink forthe trial in a glass demijohn fermented with Torulaspora delbrueckii UMY196.
3. Materials and Methods
3.1. Preparation of Fruit Juices and Musts
The two musts used in this study were industrially produced from Chardonnay and CabernetSauvignon grapes in two different wineries (Lombardia region, north of Italy). Chardonnay must wasemployed for the preliminary experiment; it was obtained in vintage 2015 using a Velvet 80 pneumaticpress (DIEMME Enologia, Lugo, RA, Italy) working under nitrogen flow and without SO2, left for12 h at 4 ◦C for settling and then stored at −18 ± 1 ◦C. The Cabernet Sauvignon must was produced invintage 2015 for the preliminary and batch experiments and in vintage 2017 for the microvinification.The grape was crushed without sulfur dioxide (SO2) and the grape skins were left in the must for threedays. The liquid musts were collected and stored at −18 ± 1 ◦C.
The fruit juices were obtained from cherry (Prunus avium var. Durone nero di Vignola), kiwi(Actinidia chinenesis var. Gold), peach (Prunus persica var. Nucipersica), and strawberry (Fragariaananassa var. Nabila). In the case of kiwi, a further amount of juice was produced for microvinificationexperiments. The ripe fruits of Italian origin were collected at a local farmer market and they werewashed, gently dried, and cut (prior to seed removal) or peeled after purchasing. The fruit juices wereobtained with a juicer and stored at −18 ± 1 ◦C.
3.2. Yeast Strains
Pure cultures of Saccharomyces cerevisiae Lalvin EC-1118 (EC1118) or Torulaspora delbrueckii UMY196were used for the fermentation trials. S. cerevisiae EC1118 is a commercial yeast strain commonlyemployed for vinification (Lallemand Inc., Montreal, Quebec, Canada). T. delbrueckii UMY196 is partof the yeast culture collection of the University of Milan (Italy), and it was isolated from wine. Cellswere maintained in yeast extract peptone dextrose (YPD) medium (10 g/L yeast extract, 20 g/L peptone,20 g/L glucose, pH 5.5) supplemented with 20% (v/v) glycerol at −80 ◦C. Cell pre-cultures were obtainedby inoculating 1% (v/v) glycerol stock freeze culture in YPD broth maintained at 30 ◦C for 24–48 h inaerobiosis. The final biomass was determined by optical density (OD) at 600 nm. For the inocula, cellsfrom the pre-culture were centrifuged at 3500 rpm for 15 min (Hettich, ROTINA 380R, Tuttlingen,
Metabolites 2019, 9, 86 12 of 16
Germany), collected, and washed once with 0.9% (w/v) NaCl. The grape/fruit musts were inoculated at0.1 ± 0.05 OD 600 nm corresponding to about 1 × 10⁶ CFU/mL.
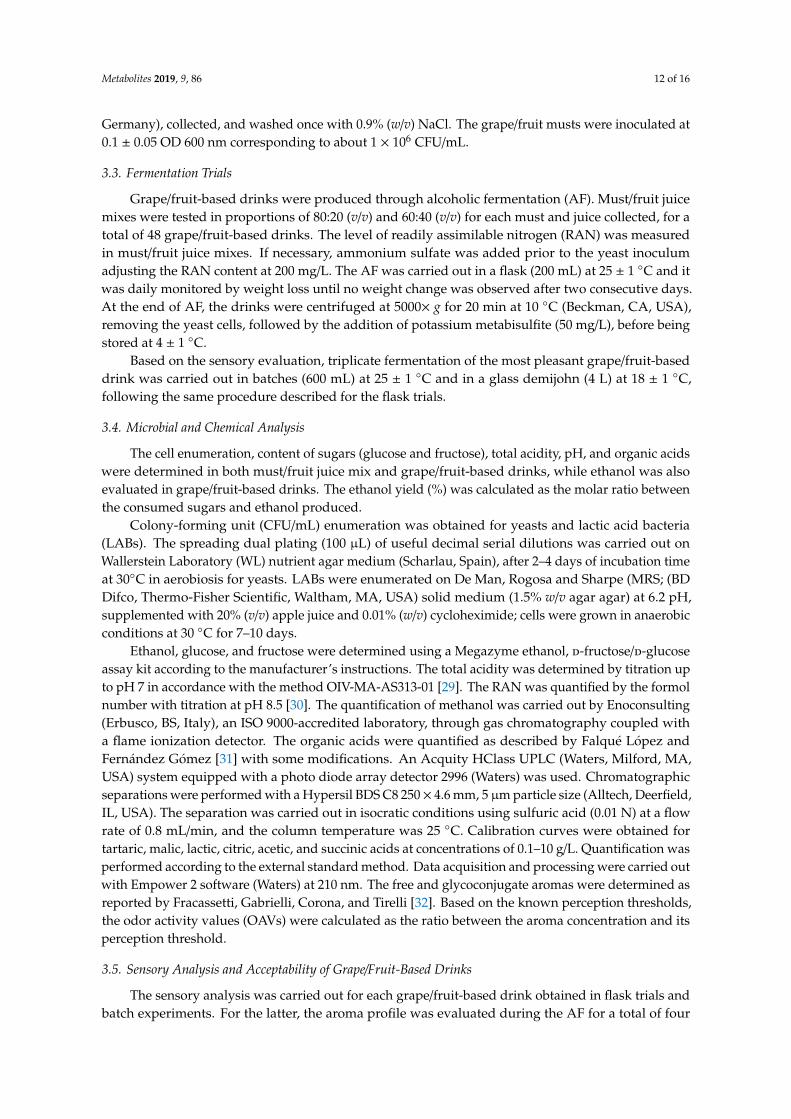
3.3. Fermentation Trials
Grape/fruit-based drinks were produced through alcoholic fermentation (AF). Must/fruit juicemixes were tested in proportions of 80:20 (v/v) and 60:40 (v/v) for each must and juice collected, for atotal of 48 grape/fruit-based drinks. The level of readily assimilable nitrogen (RAN) was measuredin must/fruit juice mixes. If necessary, ammonium sulfate was added prior to the yeast inoculumadjusting the RAN content at 200 mg/L. The AF was carried out in a flask (200 mL) at 25 ± 1 ◦C and itwas daily monitored by weight loss until no weight change was observed after two consecutive days.At the end of AF, the drinks were centrifuged at 5000× g for 20 min at 10 ◦C (Beckman, CA, USA),removing the yeast cells, followed by the addition of potassium metabisulfite (50 mg/L), before beingstored at 4 ± 1 ◦C.
Based on the sensory evaluation, triplicate fermentation of the most pleasant grape/fruit-baseddrink was carried out in batches (600 mL) at 25 ± 1 ◦C and in a glass demijohn (4 L) at 18 ± 1 ◦C,following the same procedure described for the flask trials.
3.4. Microbial and Chemical Analysis
The cell enumeration, content of sugars (glucose and fructose), total acidity, pH, and organic acidswere determined in both must/fruit juice mix and grape/fruit-based drinks, while ethanol was alsoevaluated in grape/fruit-based drinks. The ethanol yield (%) was calculated as the molar ratio betweenthe consumed sugars and ethanol produced.
Colony-forming unit (CFU/mL) enumeration was obtained for yeasts and lactic acid bacteria(LABs). The spreading dual plating (100 µL) of useful decimal serial dilutions was carried out onWallerstein Laboratory (WL) nutrient agar medium (Scharlau, Spain), after 2–4 days of incubation timeat 30◦C in aerobiosis for yeasts. LABs were enumerated on De Man, Rogosa and Sharpe (MRS; (BDDifco, Thermo-Fisher Scientific, Waltham, MA, USA) solid medium (1.5% w/v agar agar) at 6.2 pH,supplemented with 20% (v/v) apple juice and 0.01% (w/v) cycloheximide; cells were grown in anaerobicconditions at 30 ◦C for 7–10 days.
Ethanol, glucose, and fructose were determined using a Megazyme ethanol, d-fructose/d-glucoseassay kit according to the manufacturer’s instructions. The total acidity was determined by titration upto pH 7 in accordance with the method OIV-MA-AS313-01 [29]. The RAN was quantified by the formolnumber with titration at pH 8.5 [30]. The quantification of methanol was carried out by Enoconsulting(Erbusco, BS, Italy), an ISO 9000-accredited laboratory, through gas chromatography coupled witha flame ionization detector. The organic acids were quantified as described by Falqué López andFernández Gómez [31] with some modifications. An Acquity HClass UPLC (Waters, Milford, MA,USA) system equipped with a photo diode array detector 2996 (Waters) was used. Chromatographicseparations were performed with a Hypersil BDS C8 250× 4.6 mm, 5 µm particle size (Alltech, Deerfield,IL, USA). The separation was carried out in isocratic conditions using sulfuric acid (0.01 N) at a flowrate of 0.8 mL/min, and the column temperature was 25 ◦C. Calibration curves were obtained fortartaric, malic, lactic, citric, acetic, and succinic acids at concentrations of 0.1–10 g/L. Quantification wasperformed according to the external standard method. Data acquisition and processing were carried outwith Empower 2 software (Waters) at 210 nm. The free and glycoconjugate aromas were determined asreported by Fracassetti, Gabrielli, Corona, and Tirelli [32]. Based on the known perception thresholds,the odor activity values (OAVs) were calculated as the ratio between the aroma concentration and itsperception threshold.
3.5. Sensory Analysis and Acceptability of Grape/Fruit-Based Drinks
The sensory analysis was carried out for each grape/fruit-based drink obtained in flask trials andbatch experiments. For the latter, the aroma profile was evaluated during the AF for a total of four
Metabolites 2019, 9, 86 13 of 16
samplings. Qualitative sensory analysis and the test of consumer acceptance were carried out for theexperiment in a glass demijohn.
For flask and batch experiments, a panel of eight experienced judges (five females, three males)was enrolled. The scored descriptors included acidity, sweetness, bitterness, fruitiness, and the overallacceptability using a 10-cm line scale.
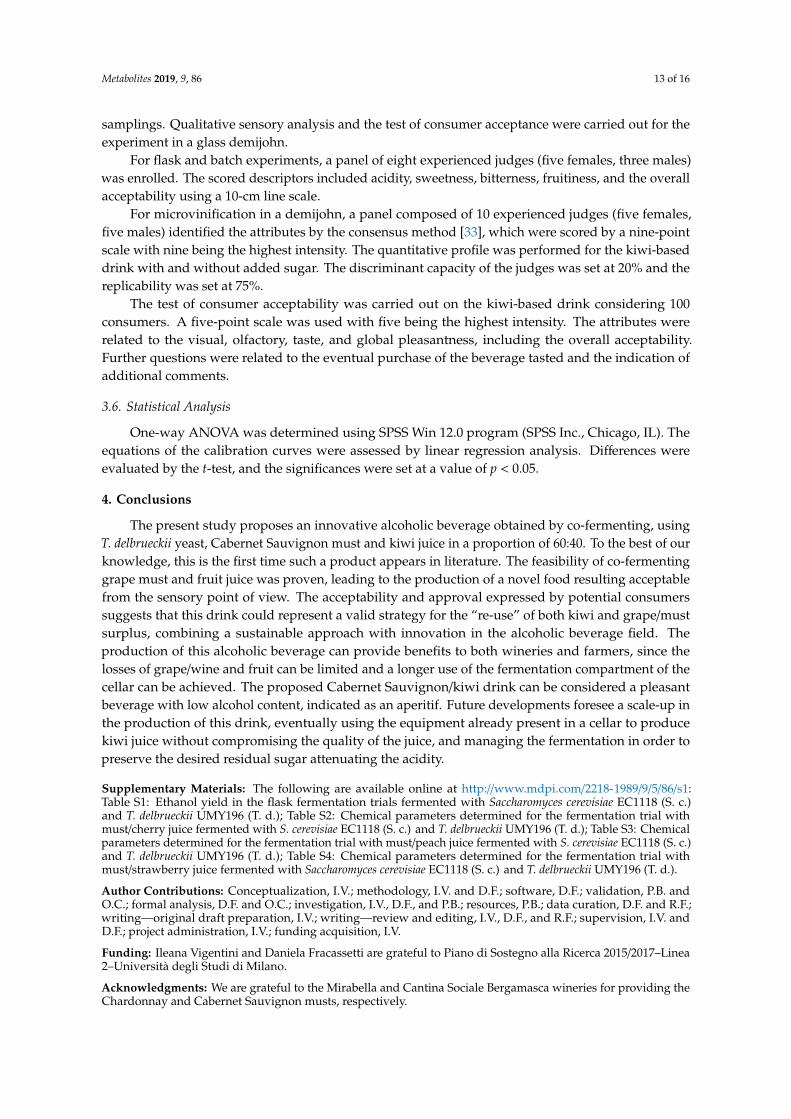
For microvinification in a demijohn, a panel composed of 10 experienced judges (five females,five males) identified the attributes by the consensus method [33], which were scored by a nine-pointscale with nine being the highest intensity. The quantitative profile was performed for the kiwi-baseddrink with and without added sugar. The discriminant capacity of the judges was set at 20% and thereplicability was set at 75%.
The test of consumer acceptability was carried out on the kiwi-based drink considering 100consumers. A five-point scale was used with five being the highest intensity. The attributes wererelated to the visual, olfactory, taste, and global pleasantness, including the overall acceptability.Further questions were related to the eventual purchase of the beverage tasted and the indication ofadditional comments.
3.6. Statistical Analysis
One-way ANOVA was determined using SPSS Win 12.0 program (SPSS Inc., Chicago, IL). Theequations of the calibration curves were assessed by linear regression analysis. Differences wereevaluated by the t-test, and the significances were set at a value of p < 0.05.
4. Conclusions
The present study proposes an innovative alcoholic beverage obtained by co-fermenting, usingT. delbrueckii yeast, Cabernet Sauvignon must and kiwi juice in a proportion of 60:40. To the best of ourknowledge, this is the first time such a product appears in literature. The feasibility of co-fermentinggrape must and fruit juice was proven, leading to the production of a novel food resulting acceptablefrom the sensory point of view. The acceptability and approval expressed by potential consumerssuggests that this drink could represent a valid strategy for the “re-use” of both kiwi and grape/mustsurplus, combining a sustainable approach with innovation in the alcoholic beverage field. Theproduction of this alcoholic beverage can provide benefits to both wineries and farmers, since thelosses of grape/wine and fruit can be limited and a longer use of the fermentation compartment of thecellar can be achieved. The proposed Cabernet Sauvignon/kiwi drink can be considered a pleasantbeverage with low alcohol content, indicated as an aperitif. Future developments foresee a scale-up inthe production of this drink, eventually using the equipment already present in a cellar to producekiwi juice without compromising the quality of the juice, and managing the fermentation in order topreserve the desired residual sugar attenuating the acidity.
Supplementary Materials: The following are available online at http://www.mdpi.com/2218-1989/9/5/86/s1:Table S1: Ethanol yield in the flask fermentation trials fermented with Saccharomyces cerevisiae EC1118 (S. c.)and T. delbrueckii UMY196 (T. d.); Table S2: Chemical parameters determined for the fermentation trial withmust/cherry juice fermented with S. cerevisiae EC1118 (S. c.) and T. delbrueckii UMY196 (T. d.); Table S3: Chemicalparameters determined for the fermentation trial with must/peach juice fermented with S. cerevisiae EC1118 (S. c.)and T. delbrueckii UMY196 (T. d.); Table S4: Chemical parameters determined for the fermentation trial withmust/strawberry juice fermented with Saccharomyces cerevisiae EC1118 (S. c.) and T. delbrueckii UMY196 (T. d.).
Author Contributions: Conceptualization, I.V.; methodology, I.V. and D.F.; software, D.F.; validation, P.B. andO.C.; formal analysis, D.F. and O.C.; investigation, I.V., D.F., and P.B.; resources, P.B.; data curation, D.F. and R.F.;writing—original draft preparation, I.V.; writing—review and editing, I.V., D.F., and R.F.; supervision, I.V. andD.F.; project administration, I.V.; funding acquisition, I.V.
Funding: Ileana Vigentini and Daniela Fracassetti are grateful to Piano di Sostegno alla Ricerca 2015/2017–Linea2–Università degli Studi di Milano.
Acknowledgments: We are grateful to the Mirabella and Cantina Sociale Bergamasca wineries for providing theChardonnay and Cabernet Sauvignon musts, respectively.
Metabolites 2019, 9, 86 14 of 16
Conflicts of Interest: The authors declare no conflicts of interest.
Appendix A
Table A1. Summary of the chemical parameters (residual sugars, ethanol, pH, total acidity, organicacid profile) for the must/fruit-based drink. The data related to organic acids are reported in Figure A1.
Fruit-Based Drink Chemical Characteristic of the Final Product
Cherry-based drinks(Table S2)
Residual sugars: <1.0 ± 0.0 g/L in all the combinations.Ethanol: It was the highest compared to the others investigated combinations, reaching the maximum in
combination with Cabernet Sauvignon 80:20 (12.7 ± 0.1% (v/v) for S. cerevisiae and 12.3 ± 0.7% (v/v) for T. delbrueckii).pH: 3.27 ± 0.02 to 3.54 ± 0.00.
Total acidity: Higher in beverages produced with T. delbrueckii.Organic acids: Malic acid decreased during the alcoholic fermentation, although it was the major organic acid in thedrinks produced. Acetic acid was found only in the drinks fermented with T. delbrueckii (maximum 1.8 ± 0.0 g/L in
the 80:20 mix with Cabernet Sauvignon).
Kiwi-based drinks(Table 1)
Residual sugars: Higher in the mixes Cabernet Sauvignon fermented by T. delbrueckii (71 ± 2 g/L and 52 ± 17 g/L for80:20 and 60:40 combinations, respectively).
Ethanol: 6.5 ± 0.3% (v/v) and 7.0 ± 1.3% (v/v) for mixes 80:20 and 60:40, respectively, fermented by T. delbrueckii incomparison to the respective fermented drinks with S. cerevisiae (10.8 ± 0.5% (v/v) for 80:20 and 9.6 ± 0.3% (v/v) for
60:40.pH: Slightly higher in drinks fermented with T. delbrueckii (3.13 ± 0.08 to 3.50 ± 0.01) in the mix 60:40 with
Chardonnay must.Total acidity: 11.5 ± 0.7 to 16.3 ± 0.3 g tartaric acid/L in the tests with T. delbrueckii.
Organic acids: The most abundant was citric acid, deriving from kiwi juice. Succinic acid was detected at the end offermentation, while acetic acid was found only in drinks based on Chardonnay must and fermented by T. delbrueckii.
Peach-based drinks(Table S3)
Residual sugars: <1.0 ± 0.0 g/L in all the combinations.Ethanol: Higher in the 80:20 combinations for both musts and yeasts used.
pH: Slightly higher in drinks fermented with T. delbrueckii (3.30 ± 0.01 to 3.72 ± 0.01) in the mix 60:40 withChardonnay must.
Total acidity: Slight differences between drinks fermented with S. cerevisiae and T. delbrueckii.Organic acids: Both tartaric and malic acids decreased during the fermentation. The drinks contained succinic acid
(highest amount 1.40 ± 0.23 g/L), as well as acetic acid (highest amount 0.98 ± 0.03 g/L).
Strawberry-based drinks(Table S4)
Residual sugars: <2.5 ± 1.5 g/L, except for the trial with Cabernet Sauvignon must at the proportion 80:20 fermentedby T. delbrueckii in which the residual sugar was 44 ± 5 g/L.
Ethanol: From 4.4 ± 1.0% (v/v) in the trial with Chardonnay must at the proportion 60:40 fermented by T. delbrueckiito 9.9 ± 0.9% (v/v) in the test with Cabernet Sauvignon must at the proportion 80:20 fermented by S. cerevisiae. Thehigher concentrations were detected in drinks obtained from mixes with Cabernet Sauvignon, attributable to the
higher sugar content.pH: No significant differences among the different combinations must/strawberry juice (range 2.97 ± 0.00 to
3.22 ± 0.02).Total acidity: Higher in the fermented mixes with T. delbrueckii.
Organic acids: A significant decrease in tartaric acid occurred. Acetic acid was in the range 1.3 ± 0.0 g/L to2.4 ± 0.3 g/L, except for the drinks based on Chardonnay must and fermented with T. delbrueckii.
Metabolites 2019, 9, x 14 of 16
(Table S3) pH: Slightly higher in drinks fermented with T. delbrueckii (3.30 ± 0.01 to 3.72 ± 0.01) in the mix 60:40
with Chardonnay must.
Total acidity: Slight differences between drinks fermented with S. cerevisiae and T. delbrueckii.
Organic acids: Both tartaric and malic acids decreased during the fermentation. The drinks contained
succinic acid (highest amount 1.40 ± 0.23 g/L), as well as acetic acid (highest amount 0.98 ± 0.03 g/L).
Strawberry-
based drinks
(Table S4)
Residual sugars: <2.5 ± 1.5 g/L, except for the trial with Cabernet Sauvignon must at the proportion
80:20 fermented by T. delbrueckii in which the residual sugar was 44 ± 5 g/L.
Ethanol: From 4.4 ± 1.0% (v/v) in the trial with Chardonnay must at the proportion 60:40 fermented by
T. delbrueckii to 9.9 ± 0.9% (v/v) in the test with Cabernet Sauvignon must at the proportion 80:20
fermented by S. cerevisiae. The higher concentrations were detected in drinks obtained from mixes with
Cabernet Sauvignon, attributable to the higher sugar content.
pH: No significant differences among the different combinations must/strawberry juice (range 2.97 ±
0.00 to 3.22 ± 0.02).
Total acidity: Higher in the fermented mixes with T. delbrueckii.
Organic acids: A significant decrease in tartaric acid occurred. Acetic acid was in the range 1.3 ± 0.0 g/L
to 2.4 ± 0.3 g/L, except for the drinks based on Chardonnay must and fermented with T. delbrueckii.
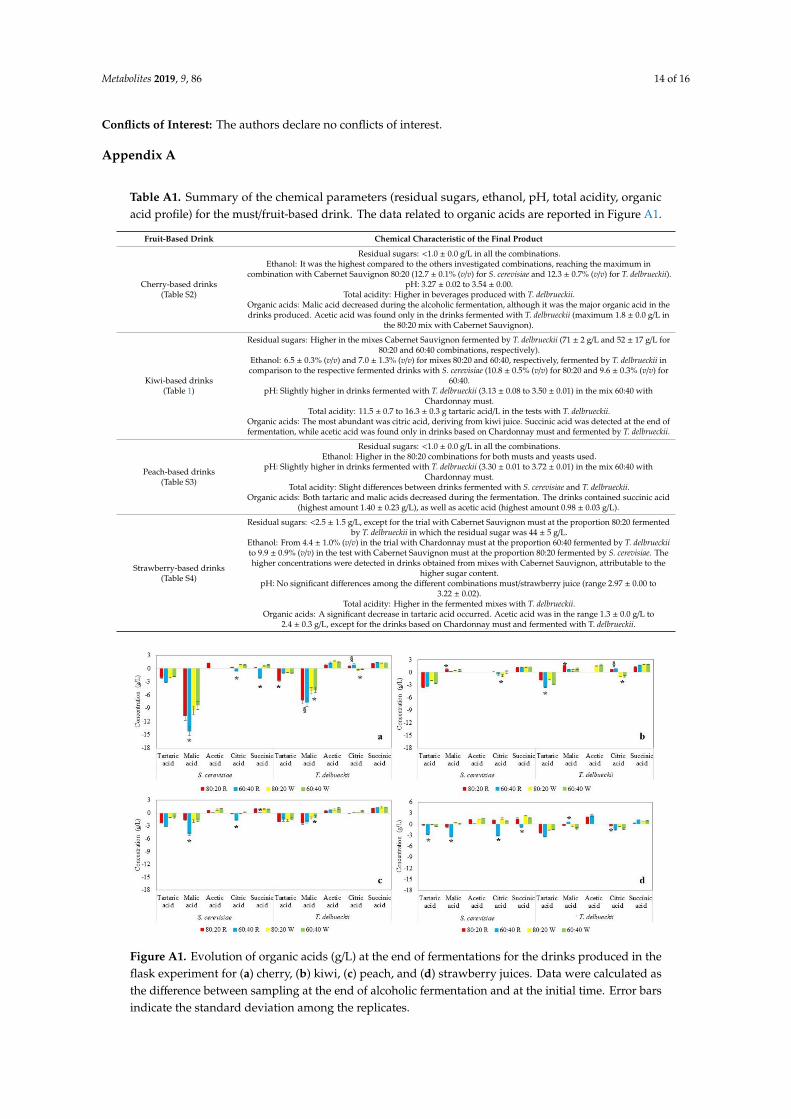
Figure A: Evolution of organic acids (g/L) at the end of fermentations for the drinks produced in the
flask experiment for (a) cherry, (b) kiwi, (c) peach, and (d) strawberry juices. Data were calculated as
the difference between sampling at the end of alcoholic fermentation and at the initial time. Error bars
indicate the standard deviation among the replicates.
References
1. McGovern, P.E.; Jalabadze, M.; Batiuk, S.; Callahan, M.P.; Smith, K.E.; Hall, G.R.; Kvavadze, E.; Maghradze,
D.; Rusishvili, N.; Bouby, L.; et al. Early Neolithic wine of Georgia in the South Caucasus. Proc. Natl. Acad.
Sci. USA 2017, 114, E10309–E10318.
2. McGovern, P.E.; Zhang, J.; Tang, J.; Zhang, Z.; Hall, G.R.; Moreau, R.A.; Nunez, A.; Butrym, E.D.; Richards,
M.P.; Wang, C.; et al. Fermented beverages of pre- and proto-historic China. Proc. Natl. Acad. Sci. USA 2004,
101, 17593–17598.
3. Jagtap, U.B.; Bapat, V.A. Wines from fruits other than grapes: Current status and future prospectus. Food
Biosci. 2015, 9, 80–96
4. State of the viticulture world market. April 2018. Available online:
http://www.oiv.int/public/medias/5958/oiv-state-of-the-vitiviniculture-world-market-april-2018.pdf
(accessed on 19 March 2019).
5. Swami, S.B.; Thakor, N.J.; Divate, A.D. Fruit Wine Production: A Review. J. Food Res. Technol. 2014, 2, 93–
100.
Figure A1. Evolution of organic acids (g/L) at the end of fermentations for the drinks produced in theflask experiment for (a) cherry, (b) kiwi, (c) peach, and (d) strawberry juices. Data were calculated asthe difference between sampling at the end of alcoholic fermentation and at the initial time. Error barsindicate the standard deviation among the replicates.
Metabolites 2019, 9, 86 15 of 16
References
1. McGovern, P.E.; Jalabadze, M.; Batiuk, S.; Callahan, M.P.; Smith, K.E.; Hall, G.R.; Kvavadze, E.; Maghradze, D.;Rusishvili, N.; Bouby, L.; et al. Early Neolithic wine of Georgia in the South Caucasus. Proc. Natl. Acad.Sci. USA 2017, 114, E10309–E10318. [CrossRef]
2. McGovern, P.E.; Zhang, J.; Tang, J.; Zhang, Z.; Hall, G.R.; Moreau, R.A.; Nunez, A.; Butrym, E.D.;Richards, M.P.; Wang, C.; et al. Fermented beverages of pre- and proto-historic China. Proc. Natl. Acad.Sci. USA 2004, 101, 17593–17598. [CrossRef] [PubMed]
3. Jagtap, U.B.; Bapat, V.A. Wines from fruits other than grapes: Current status and future prospectus. Food Biosci.2015, 9, 80–96. [CrossRef]
4. State of the Viticulture World Market. April 2018. Available online: http://www.oiv.int/public/medias/5958/
oiv-state-of-the-vitiviniculture-world-market-april-2018.pdf (accessed on 19 March 2019).5. Swami, S.B.; Thakor, N.J.; Divate, A.D. Fruit Wine Production: A Review. J. Food Res. Technol. 2014, 2, 93–100.6. Kosseva, M.R.; Joshi, V.K.; Panesar, P.S. Science and Technology of Fruit Wine Production, 2nd ed.; Kosseva, M.R.,
Joshi, V.K., Panesar, P.S., Eds.; Elsevier: London, UK, 2016.7. Duarte, F.W.; Dias, D.R.; Oliveira, J.M.; Teixeira, J.A.; de Almeida e Silva, J.B.; Schwan, R.F. Characterization
of different fruit wines made from cacao, cupuassu, gabiroba, jaboticaba and umbu. LWT Food Sci. Technol.2010, 43, 1564–1572. [CrossRef]
8. Coelho, E.; Vilanova, M.; Genisheva, A.; Oliveira, J.M.; Teixeira, J.A.; Domingues, L. Systematic approach forthe development of fruit wines from industrially processed fruit concentrates, including optimization offermentation parameters, chemical characterization and sensory evaluation. LWT Food Sci. Technol. 2015, 62,1043–1052. [CrossRef]
9. Lipinski, B.; Hanson, C.; Lomax, J. Reducing food loss and waste. In Installment of “Creating a SustainableFood Future”; Working Paper; World Resources Institute: Washington, DC, USA, 2013. Available online:http://www.worldresourcesreport.org (accessed on 20 March 2019).
10. Belda, I.; Navascués, E.; Marquina, D.; Santos, A.; Calderon, F.; Benito, S. Dynamic analysis of physiologicalproperties of Torulaspora delbrueckii in wine fermentations and its incidence on wine quality. Appl. Microbiol.Biotechnol. 2015, 99, 1911–1922. [CrossRef]
11. Benito, S. The impact of Torulaspora delbrueckii yeast in winemaking. Appl. Microbiol. Biotechnol. 2018, 102,3081–3094. [CrossRef]
12. Redzepovic, S.; Orlic, S.; Majdak, A.; Kozina, B.; Volschenk, H.; Viljoen-Bloom, M. Differential malic aciddegradation by selected strains of Saccharomyces during alcoholic fermentation. Int. J. Food Microbiol. 2003,83, 49–61. [CrossRef]
13. Chidi, B.S.; Bauer, F.F.; Rossouw, D. Organic acid metabolism and the impact of fermentation practices onwine acidity: A review. S. Afr. J. Enol. Vitic. 2018, 39, 1–15. [CrossRef]
14. McMahon, K.M.; Diako, C.; Aplin, J.; Mattinson, D.S.; Culver, C.; Ross, C.F. Trained and consumer panelevaluation of sparkling wines sweetened to brut or demi sec residual sugar levels with three different sugars.Food Res. Int. 2017, 99, 173–185. [CrossRef]
15. Ribéreau-Gayon, J.; Glories, Y.; Maujean, A.; Dubourdieu, D. Handbook of Enology. The Microbiology of Wineand Vinifications, Volume 2, 3rd ed.; Wiley: New York, NY, USA, 2006.
16. Sumby, K.M.; Grbin, P.R.; Jiranek, V. Microbial modulation of aromatic esters in wine: Current knowledgeand future prospects. Food Chem. 2010, 121, 1–16. [CrossRef]
17. Vigentini, I.; Maghradze, D.; Petrozziello, M.; Bonello, F.; Mezzapelle, V.; Valdetara, F.; Failla, O.; Foschino, R.Indigenous Georgian wine-associated yeasts and grape cultivars to edit the wine quality in a precisionoenology perspective. Front. Microbiol. 2016, 7, 352. [CrossRef] [PubMed]
18. López, R.; Ferreira, V.; Hernández, P.; Cacho, J.F. Identification of impact odorants of young red wines madewith Merlot, Cabernet Sauvignon and Grenache grape varieties: A comparative study. J. Sci. Food Agric.1999, 79, 1461–1467. [CrossRef]
19. Jordán, M.J.; Margaría, C.A.; Shaw, P.E.; Goodner, K.L. Aroma active components in aqueous kiwi fruitessence and kiwi fruit puree by GC-MS and multidimensional GC/GC-O. J. Agric. Food Chem. 2002, 50,5386–5390. [CrossRef] [PubMed]
20. Dragone, G.; Mussatto, S.I.; Oliveira, J.M.; Teixeira, J.A. Characterisation of volatile compounds in analcoholic beverage produced by whey fermentation. Food Chem. 2009, 112, 929–935. [CrossRef]
Metabolites 2019, 9, 86 16 of 16
21. Escudero, A.; Campo, E.; Farina, L.; Cacho, J.; Ferreira, V. Analytical characterization of the aroma of fivepremium red wines. Insights into the role of odor families and the concept of fruitiness of wines. J. Agric.Food Chem. 2007, 55, 4501–4510. [CrossRef] [PubMed]
22. Francis, I.L.; Newton, J.L. Determining wine aroma from compositional data. Aust. J. Grape Wine Res. 2005,11, 114–126. [CrossRef]
23. Gamero, A.; Ferreira, V.; Pretorius, I.S.; Querol, A. Wine, beer and cider: Unrevelling the aroma profile.In Molecular Mechanisms in Yeast Carbon Metabolism; Piskur, J., Compagno, C., Eds.; Springer: Berlin/Hidelberg,Germany, 2014; pp. 261–297.
24. Gómez-Míguez, M.J.; Cacho, J.F.; Ferreira, V.; Vicario, I.M.; Heredia, F.J. Volatile components of Zalema whitewines. Food Chem. 2007, 100, 1464–1473. [CrossRef]
25. Moreno, J.A.; Zea, L.; Moyano, L.; Medina, M. Aroma compounds as markers of the changes in sherry winessubjected to biological ageing. Food Control 2005, 16, 333–338. [CrossRef]
26. Peinado, R.A.; Mauricio, J.C.; Moreno, J. Aromatic series in sherry wines with gluconic acid subjected todifferent biological aging conditions by Saccharomyces cerevisiae var. capensis. Food Chem. 2006, 94, 232–239.[CrossRef]
27. Hernández-Orte, P.; Cersosimo, M.; Loscos, N.; Cacho, J.; Garcia-Moruno, E.; Ferreira, V. The developmentof varietal aroma from non-floral grapes by yeasts of different genera. Food Chem. 2008, 107, 1064–1077.[CrossRef]
28. European Community. Regulation (EC) No 110/2008 of the European Parliament and of the council onthe definition, presentation, labelling and the protection of geographical indications of spirit drinks andrepealing Council Regulation (EEC) No. 1576/89. Off. J. Eur. Union 2008, L 39/16, 16–54.
29. Resolution Oeno 551-2015. Compendium of International Methods of Analysis—OIV. Method OIV-MA-AS313-01for the Determination of Total Acidity. Available online: http://www.oiv.int/en/technical-standards-and-documents/methods-of-analysis/compendium-of-international-methods-of-analysis-of-wines-and-musts-2-vol (accessed on 29 April 2019).
30. Cavaglioni, A.; Ferrari, S. Confronto tra alcuni metodi per la determinazione dell’azoto prontamenteassimilabile. Vignevini 2002, 11, 119–123.
31. Falqué López, E.; Fernández Gómez, E. Simultaneous determination of the major organic acids, sugars,glycerol, and ethanol by HPLC in grape musts and white wines. J. Chromatogr. Sci. 1996, 34, 254–257.[CrossRef]
32. Fracassetti, D.; Gabrielli, M.; Corona, O.; Tirelli, A. Characterisation of Vernaccia Nera (Vitis vinifera L.) grapesand wine. S. Afr. J. Enol. Vitic. 2017, 38, 72–81.
33. ISO 11035:1994. Sensory Analysis—Identification and Selection of Descriptors for Establishing a Sensory Profile by aMultidimensional Approach; ISO: Geneva, Switzerland, 1994.
© 2019 by the authors. Licensee MDPI, Basel, Switzerland. This article is an open accessarticle distributed under the terms and conditions of the Creative Commons Attribution(CC BY) license (http://creativecommons.org/licenses/by/4.0/).


![Innovative Alcoholic Drinks Obtained by Co-Fermenting ... · autochthonous Brazilian fruits [7]. Moreover, the production implies the use of fruit juice concentrates, which allows](https://img.dokumen.tips/doc/110x75/6014851d929fb84d5157d2c2/innovative-alcoholic-drinks-obtained-by-co-fermenting-autochthonous-brazilian.jpg)