Embed Size (px)
Citation preview
Innovation Framework for New Developments
A case study
SPATIAL PLANNING & URBAN DESIGN
Speaker: Laura Peacock, Oxfordshire County Council
@UrbanismNextEU #UNextEU
Walking the talk…
Our journey to redefine modellingLaura Peacock – Manager of Innovation Hub Oxfordshire County Council
MIMAS : Modelling Infrastructure & Mobility as a Service
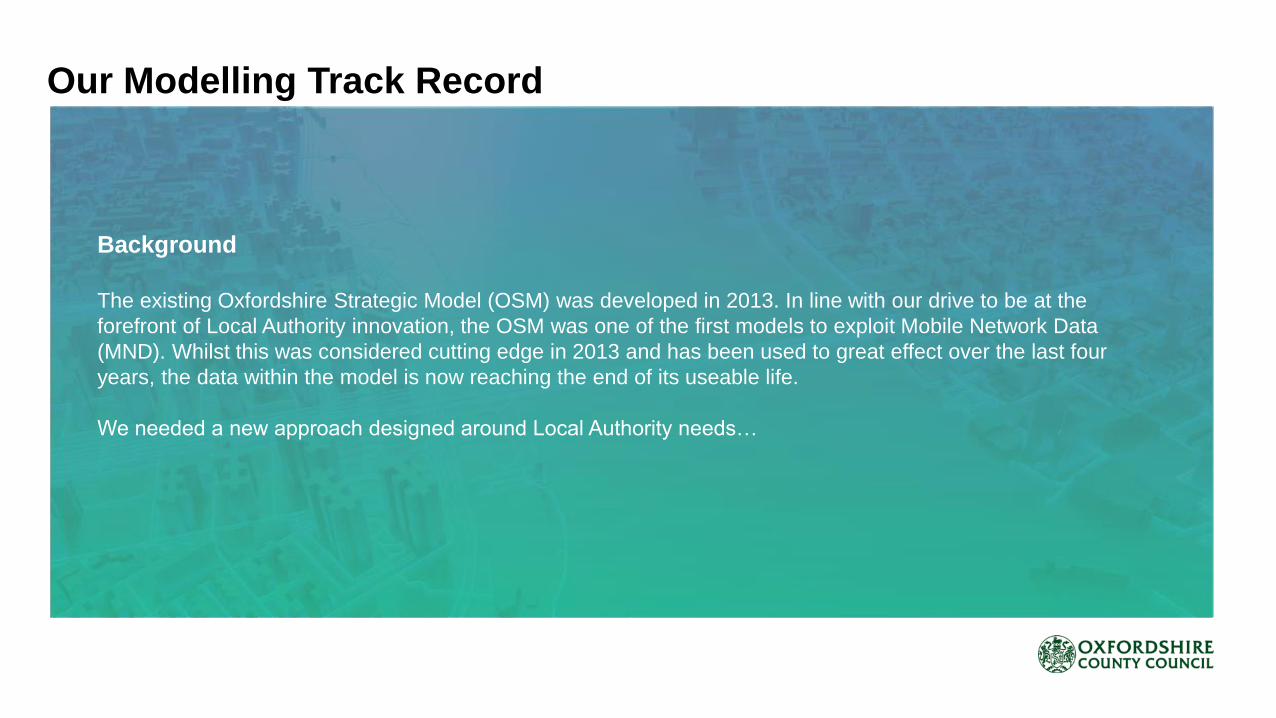
Background
The existing Oxfordshire Strategic Model (OSM) was developed in 2013. In line with our drive to be at the
forefront of Local Authority innovation, the OSM was one of the first models to exploit Mobile Network Data
(MND). Whilst this was considered cutting edge in 2013 and has been used to great effect over the last four
years, the data within the model is now reaching the end of its useable life.
We needed a new approach designed around Local Authority needs…
Our Modelling Track Record
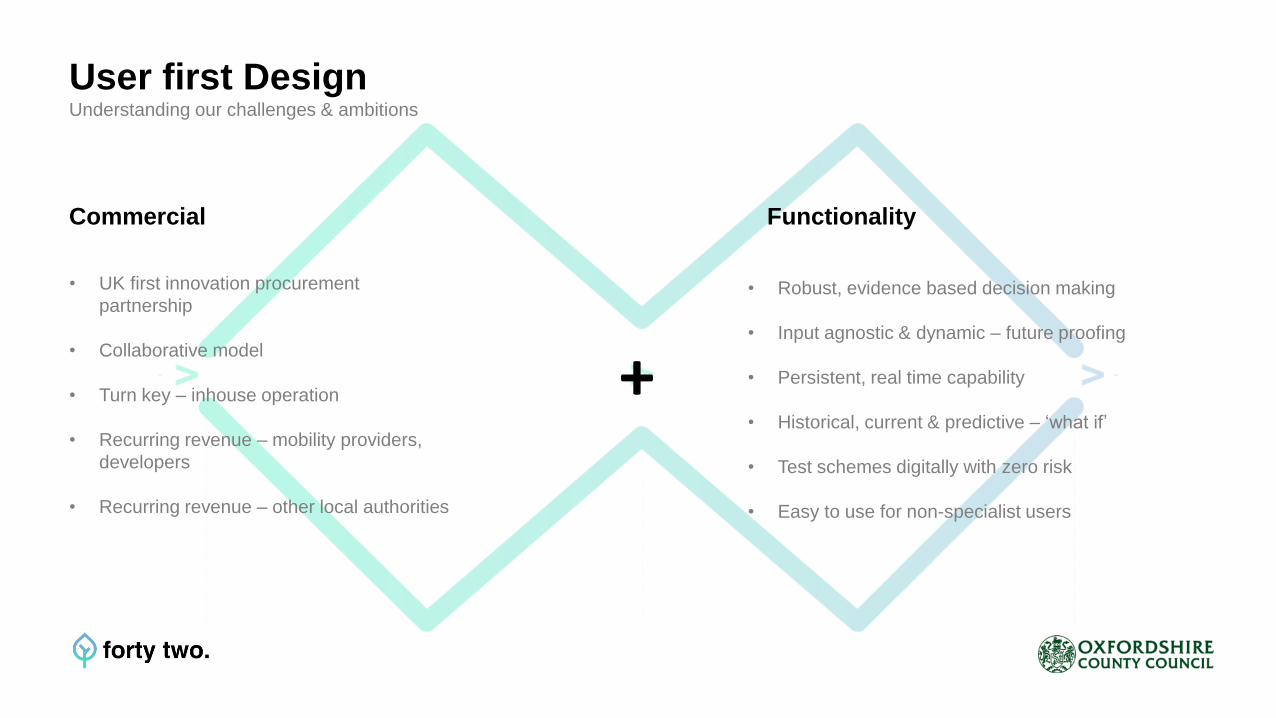
• UK first innovation procurement
partnership
• Collaborative model
• Turn key – inhouse operation
• Recurring revenue – mobility providers,
developers
• Recurring revenue – other local authorities
Commercial
• Robust, evidence based decision making
• Input agnostic & dynamic – future proofing
• Persistent, real time capability
• Historical, current & predictive – ‘what if’
• Test schemes digitally with zero risk
• Easy to use for non-specialist users
Functionality
User first DesignUnderstanding our challenges & ambitions
+
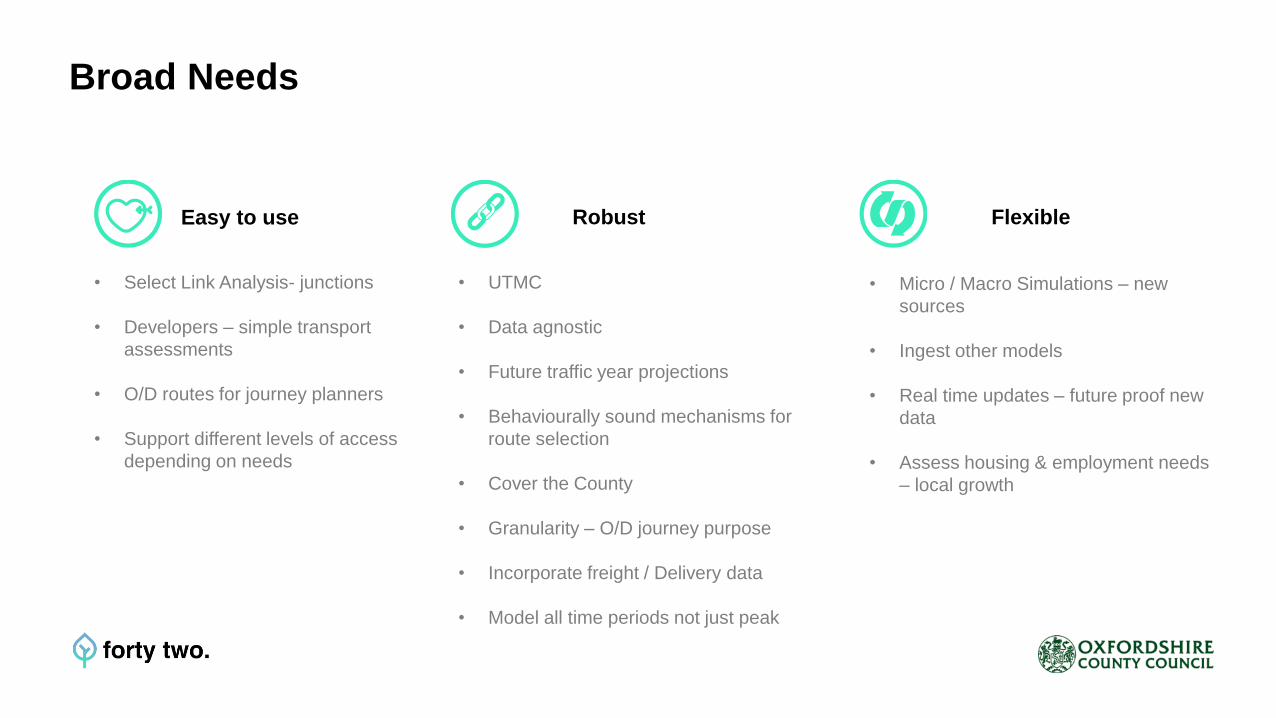
Easy to use Robust Flexible
• Select Link Analysis- junctions
• Developers – simple transport
assessments
• O/D routes for journey planners
• Support different levels of access
depending on needs
• UTMC
• Data agnostic
• Future traffic year projections
• Behaviourally sound mechanisms for
route selection
• Cover the County
• Granularity – O/D journey purpose
• Incorporate freight / Delivery data
• Model all time periods not just peak
• Micro / Macro Simulations – new
sources
• Ingest other models
• Real time updates – future proof new
data
• Assess housing & employment needs
– local growth
Broad Needs
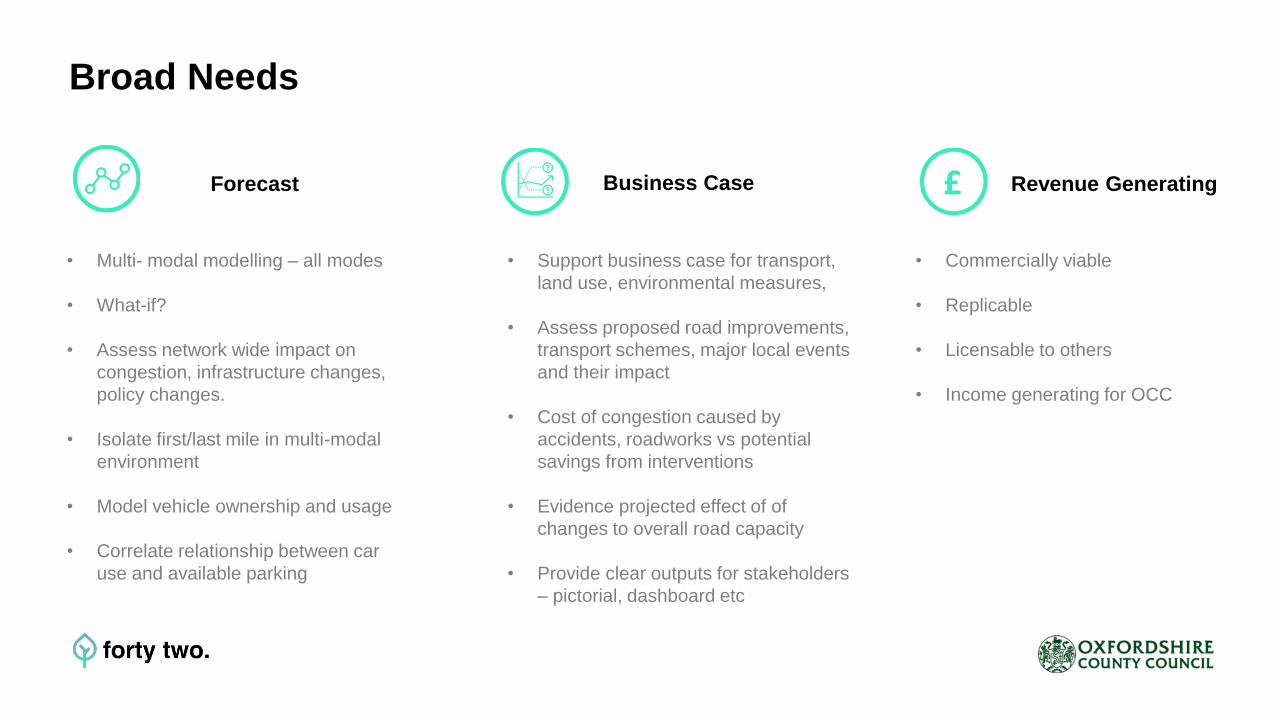
Business Case Revenue GeneratingForecast
• Multi- modal modelling – all modes
• What-if?
• Assess network wide impact on
congestion, infrastructure changes,
policy changes.
• Isolate first/last mile in multi-modal
environment
• Model vehicle ownership and usage
• Correlate relationship between car
use and available parking
• Support business case for transport,
land use, environmental measures,
• Assess proposed road improvements,
transport schemes, major local events
and their impact
• Cost of congestion caused by
accidents, roadworks vs potential
savings from interventions
• Evidence projected effect of of
changes to overall road capacity
• Provide clear outputs for stakeholders
– pictorial, dashboard etc
• Commercially viable
• Replicable
• Licensable to others
• Income generating for OCC
Broad Needs
£
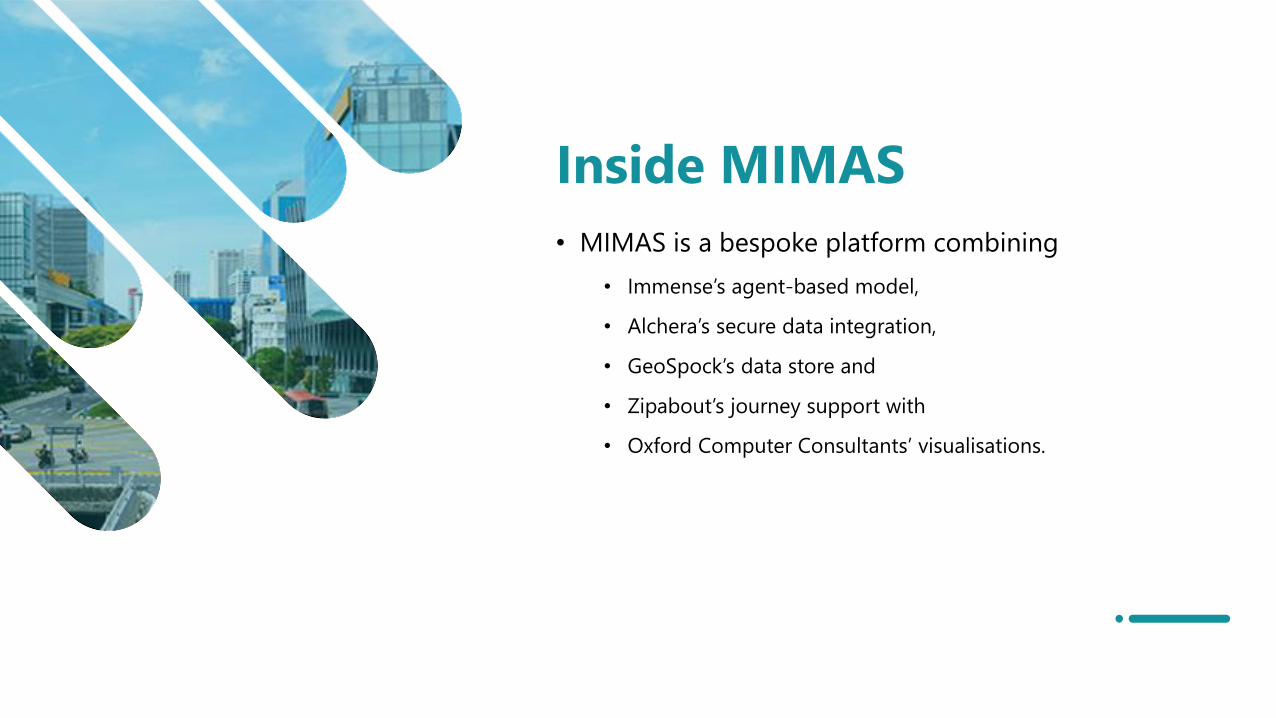
Inside MIMAS
• MIMAS is a bespoke platform combining
• Immense’s agent-based model,
• Alchera’s secure data integration,
• GeoSpock’s data store and
• Zipabout’s journey support with
• Oxford Computer Consultants’ visualisations.
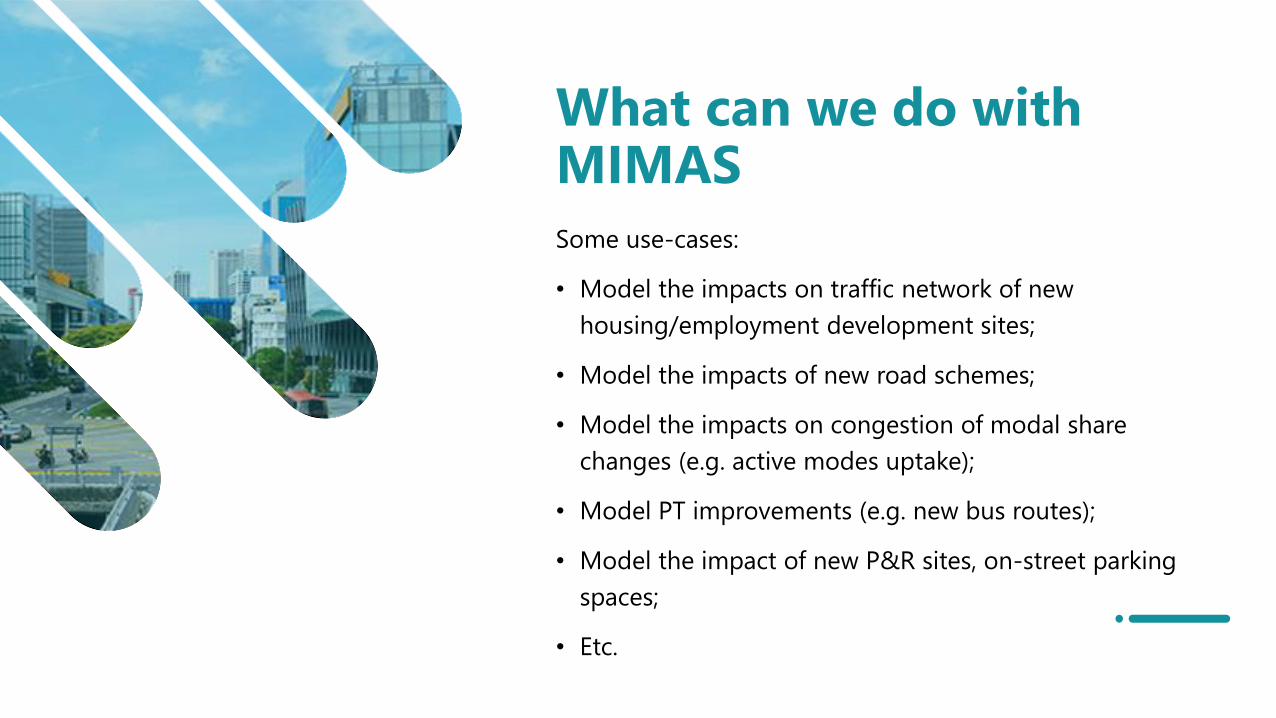
What can we do with MIMAS
Some use-cases:
• Model the impacts on traffic network of new
housing/employment development sites;
• Model the impacts of new road schemes;
• Model the impacts on congestion of modal share
changes (e.g. active modes uptake);
• Model PT improvements (e.g. new bus routes);
• Model the impact of new P&R sites, on-street parking
spaces;
• Etc.
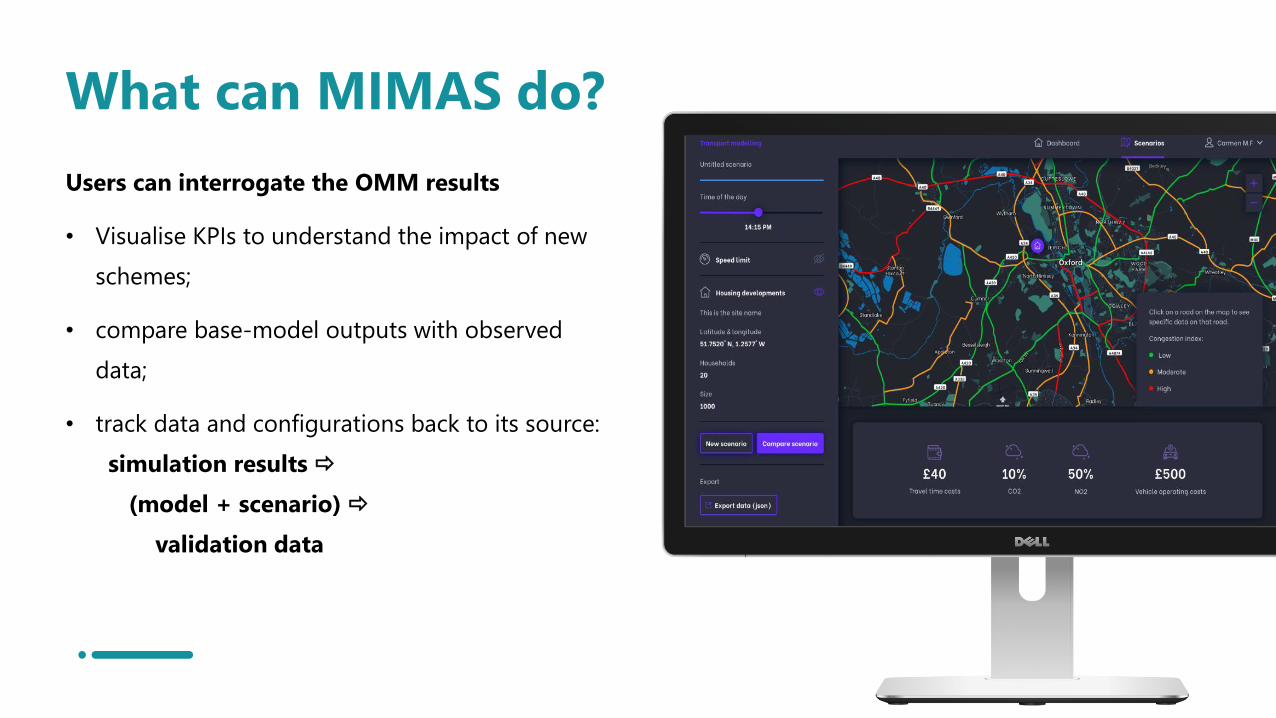
What can MIMAS do?
Users can interrogate the OMM results
• Visualise KPIs to understand the impact of new
schemes;
• compare base-model outputs with observed
data;
• track data and configurations back to its source:
simulation results
(model + scenario)
validation data
Data used to develop OMM
• Travel demand based on 2019 Mobile Network Telefonica data (MND);
• Pedestrian and cyclist data extracted from STRAVA Metro;
• Supply data derived from open source dataset and enriched with premium datasets;
• Public Transport data: timetables provided by Alchera and additional missing information
extracted from the existing EMME model;
• Cal/Val data: journey times, traffic counts (MCC), INRIX speed data, provided by Oxfordshire
County Council.
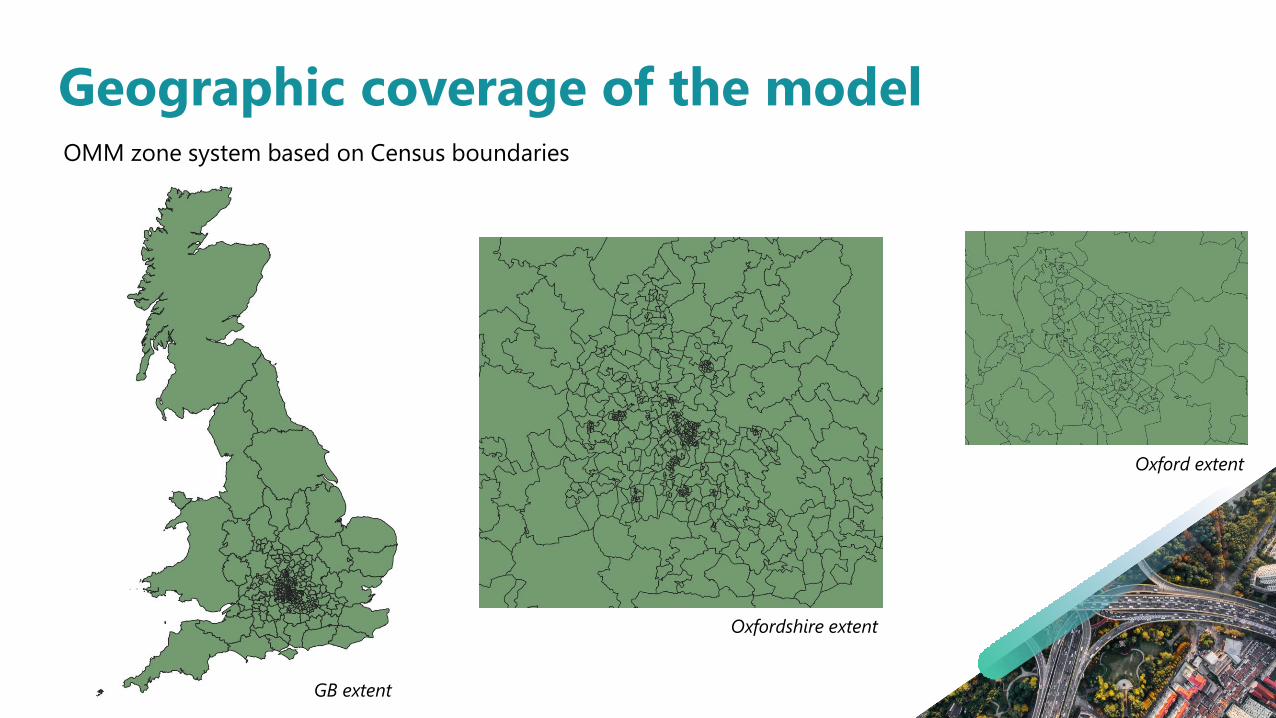
Geographic coverage of the modelOMM zone system based on Census boundaries
GB extent
Oxfordshire extent
Oxford extent
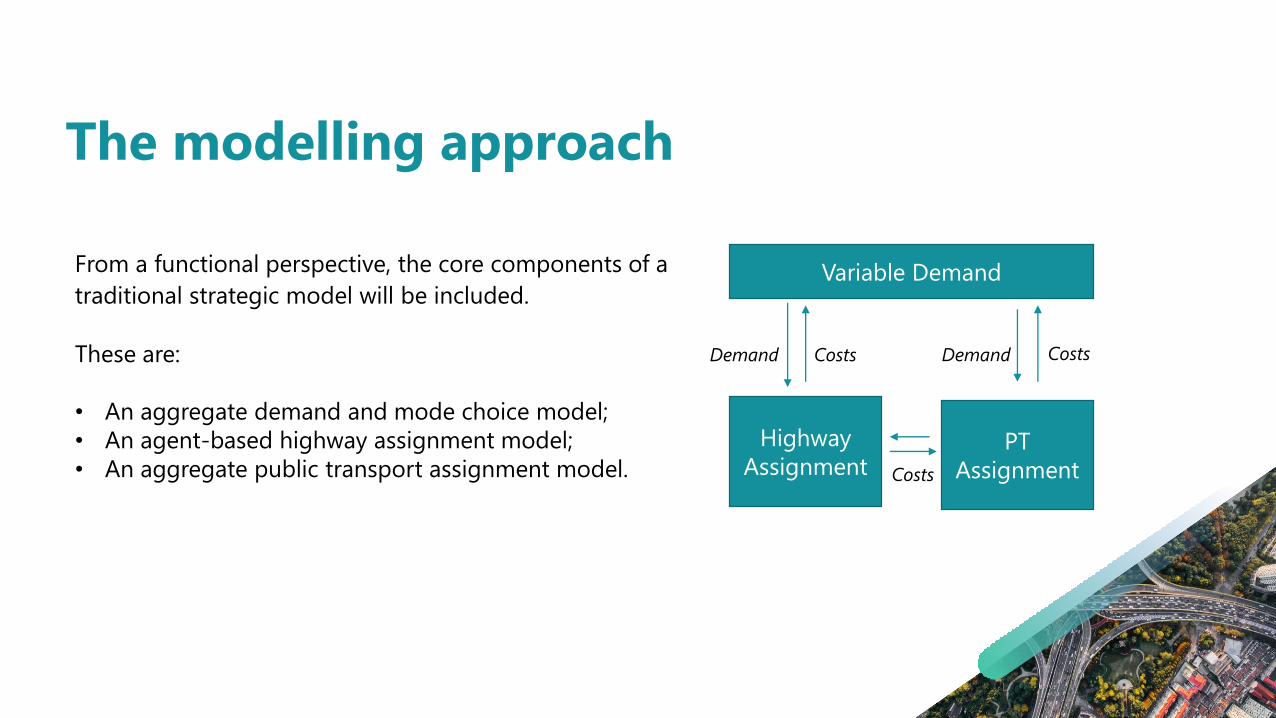
The modelling approach
From a functional perspective, the core components of a
traditional strategic model will be included.
These are:
• An aggregate demand and mode choice model;
• An agent-based highway assignment model;
• An aggregate public transport assignment model.
Demand Demand
Costs
Costs Costs
Variable Demand
PT
Assignment
Highway
Assignment
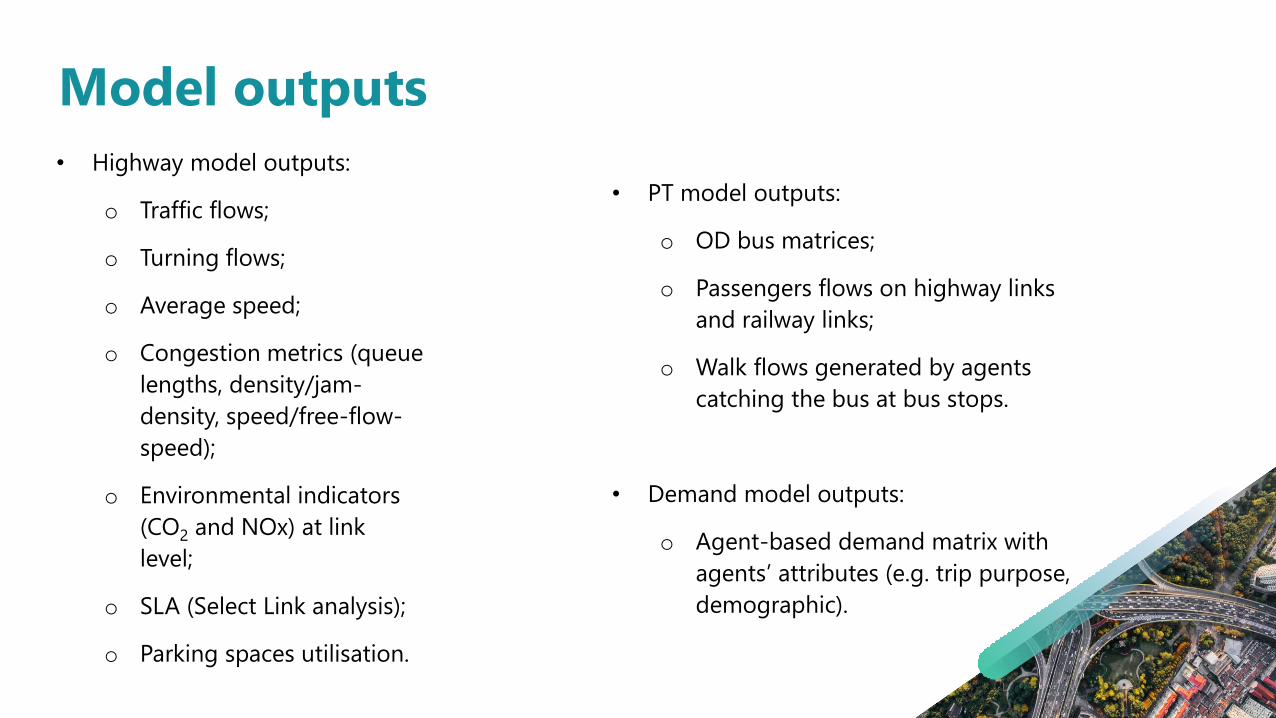
Model outputs
• Highway model outputs:
o Traffic flows;
o Turning flows;
o Average speed;
o Congestion metrics (queue
lengths, density/jam-
density, speed/free-flow-
speed);
o Environmental indicators
(CO2 and NOx) at link
level;
o SLA (Select Link analysis);
o Parking spaces utilisation.
• PT model outputs:
o OD bus matrices;
o Passengers flows on highway links
and railway links;
o Walk flows generated by agents
catching the bus at bus stops.
• Demand model outputs:
o Agent-based demand matrix with
agents’ attributes (e.g. trip purpose,
demographic).

Modes/vehicle types/trip purposes/times of day modelled
• Modes: highway, PT, P&R modes. Active modes in demand model (unused) and
not assigned to the network;
• Vehicle types: car, LGV, HGV, buses;
• Trip purposes: HBW, HBO, NHBW, NHBO, Education trips;
• Times of day modelled: 24 hrs.

• Model being developed according to TAG
• Base year: 2019
• Forecast year: 2035 do-minimum
• Temporal coverage: 24 hrs
• Spatial coverage: Oxfordshire
OMM : facts

Model update
Figure 3: traffic flows – initial network calibration
Figure 2: traffic flows – initial network calibration
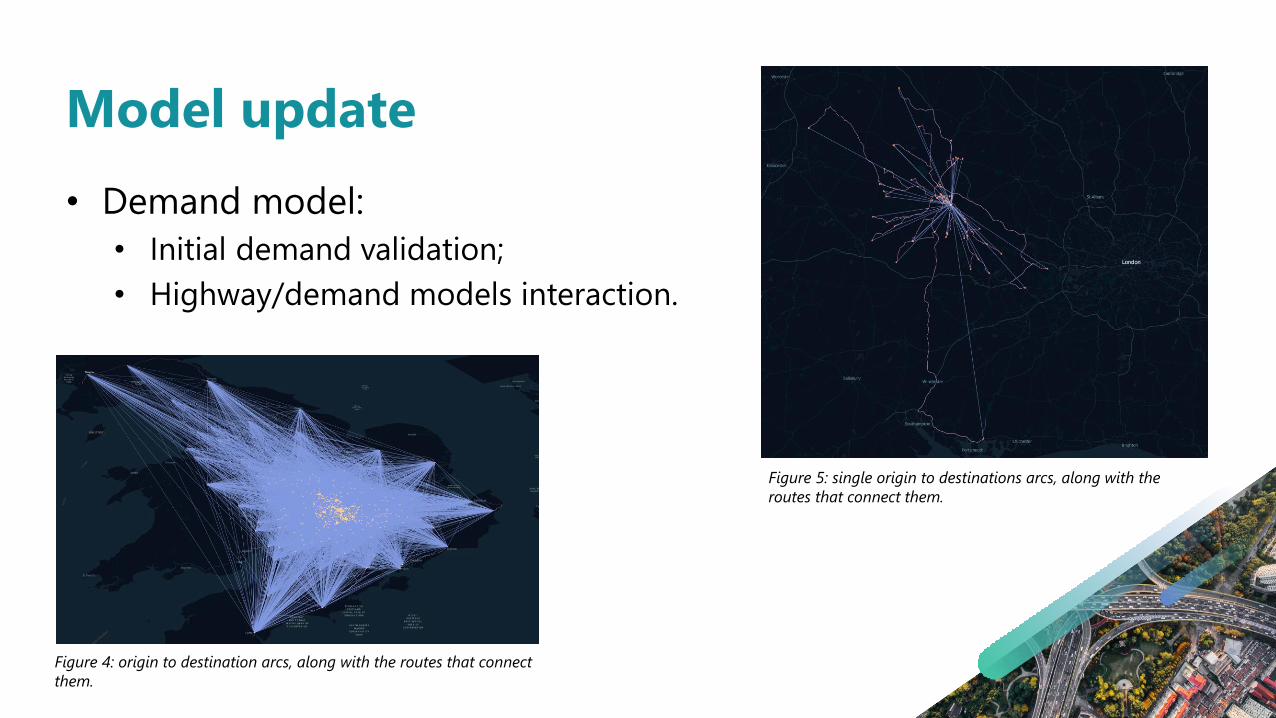
• Demand model:
• Initial demand validation;
• Highway/demand models interaction.
Model update
Figure 4: origin to destination arcs, along with the routes that connect
them.
Figure 5: single origin to destinations arcs, along with the
routes that connect them.
• April 2021:
• Software development completed;
• Beta version released at the end of April;
• May-July 2021:
• Cal/val activities;
• Q4 2021:
• Calibrated OMM model release.
OMM development timelines

THANK YOU