Embed Size (px)
Citation preview

The Crescent Textile Mills Limited
2 0 1 5A n n u a l R e p o r t

2 0 1 5A n n u a l R e p o r t 1

2 2 0 1 5A n n u a l R e p o r t
Contents
Company InformationVision and ValuesManagement Structure / Organization ChartKey FiguresInvestor GuideGraphical Representations Directors' ReportKey Operating and Financial DataPerformance IndicatorsVertical AnalysisHorizontal AnalysisStatement of ComplianceReview Report to the Members on Statement of ComplianceAuditors' Report to the MembersBalance SheetProfit and Loss AccountStatement of Comprehensive IncomeCash Flow StatementStatement of Changes in EquityNotes to the Financial StatementsPattern of ShareholdingNotice of Annual General MeetingProxy Form
456778
1034353637384142444647484950
104108115
32 0 1 5A n n u a l R e p o r t

Company Information
Board of Director
Audit Committee
HR & R Committee
Chief Financial Officer
Corporate Secretary
Head of Internal Audit
Auditors
Legal Advisor
Stock Exchange Listing
Mr. Muhammad Rafi Mr. Muhammad AnwarMr. Ahmad ShafiMr. Khalid BashirMr. Khurram Mazhar KarimMr. Muhammad ArshadMr. Muhammad Asif (Nominee NIT)Mr. Nasir Shafi
Mr. Khalid BashirMr. Khurram Mazhar KarimMr. Nasir Shafi
Mr. Khalid BashirMr. Ahmad ShafiMr. Nasir Shafi
Mr. Sadiq Saleem
Mr. Naseer Ahmad Chaudhary
Mr. Kashif Saleem
Riaz Ahmed & CompanyChartered Accountants
Syed Masroor Ahmad
The Crescent Textile Mills Limited is a listed Companyand its shares are traded on all three Stock Exchangesin Pakistan.
The Company's shares are quoted in leading dailiesunder textile composite sector.
ChairmanChief Executive OfficerDirectorDirectorDirectorDirectorDirectorDirector
ChairmanMemberMember
ChairmanMemberMember
Advocate
Bankers
Mills & Head Office
Registered Office
Share Registrar
Al Baraka Bank (Pakistan) LimitedAllied Bank LimitedBurj Bank LimitedHabib Bank LimitedMCB Bank LimitedNational Bank of PakistanNIB Bank LimitedStandard Chartered Bank (Pakistan) LimitedThe Bank of PunjabUnited Bank Limited
Sargodha Road,Faisalabad, PakistanT: + 92-41-111-105-105F: + 92-41-111-103-104E: [email protected]
45-A, Off: Zafar Ali Road, Gulberg-V,Lahore, PakistanT: + 92-42-111-245-245F: + 92-42-111-222-245E: [email protected]
Crescent Group (Pvt) Ltd.,10th Floor, BOP Tower, 10-B,Block E-2, Main Boulevard, Gulberg,Lahore, PakistanT: + 92-42-35783801-2F: + 92-42-35783811E: [email protected]
www.ctm.com.pk
4 2 0 1 5A n n u a l R e p o r t
Vision and Values
Vision
Values
To be the preferred choice of customers through innovative products and solutions and be a leading contributor to the economy by enhancing value for stakeholders.
IntegrityInnovationCustomer CentricityCommitmentTeamworkQuality
52 0 1 5A n n u a l R e p o r t

Man
agem
ent S
truc
ture
/ Or
gani
zatio
n Ch
art
Boar
d of
Dire
ctor
s
Hum
an R
esou
rce
and
Rem
uner
atio
n Co
mm
ittee
Head
of I
nter
nal A
udit
Audi
t Com
mitt
ee
Chie
f Exe
cutiv
e Of
ficer
Exec
utiv
e Di
rect
or
Proc
essin
gTe
xtile
Electr
ical
Proces
sing
& Lab
Electr
ical
Spinn
ing &We
aving
Powe
rGe
nerati
onUti
lities
Proces
sing
Home
Textile
Tex
tile BTex
tile ATex
tile C
Engin
eering
Finan
ce
Inform
ation
Techn
ology
Accoun
ts& Cos
t
Treasu
ry
Marke
ting
Export
Produc
tion
Plann
ing &Con
trol
Comme
rcial
Grey
Procur
ement
Servi
ces Invent
oryHu
man
Resou
rceBu
ying
Qualit
y
6 2 0 1 5A n n u a l R e p o r t

Key Figures
Gross Profit(Rs. in million)
Other Expenses(Rs. in million)
Finance Cost(Rs. in million)
Bank Borrowings(Rs. in million)
Contribution to national exchequers(Rs. in million)
Net Worth(Rs. in million)
Current ratio(Times)
Debt equity ratio(Times)
1,513
63
429
5,302
258
3,450
0.81
1.54
1,375
67
472
5,369
214
3,078
0.76
1.74
2015 2014
72 0 1 5A n n u a l R e p o r t
Learn about Investing at www. jamapunji.pk
• Stock trading simulator (based on live feed from KSE)• Knowledge center• Risk profiler • Financial Calculator• Subscription to Alerts (event notifications, corporate and regulatory actions)• Jamapunji application for mobile device • Online Quizzes
Investor Guide

Graphical Representations
YearsAdmin, distribution & others Finance cost
Taxation Share of associate loss
Transferred to retained earnings
Share capital andreserves
Surplus on revaluationof operating fixed assets
Current liabilities
Non current liabilities
28%
18%1%
53%
2015 2014
Shareholders’ Equity and Liabilities
Assets
Analysis of Profit and Loss Account
Other operating incomeGross profit
Share of associate profit
2015 2014
Property, plant andequipment
Investments
Inventories
Trade debts
Other assets
33% 35%
24%14%
19%8%
0 200 400 600 800
1,000 1,200 1,400 1,600 1,800 2,000
2015 2014
Rs. i
n m
illio
n
Sources of Earnings
0
500
1,000
1,500
2,000
2015 2014
Rs. i
n m
illio
n
Years
Utilization of Earnings
8
945
429
138
222
873
472
104
239
1,513
193
1,375
361
26%
19%1%
54%
10%21%
12% 24%
2 0 1 5A n n u a l R e p o r t
27
48
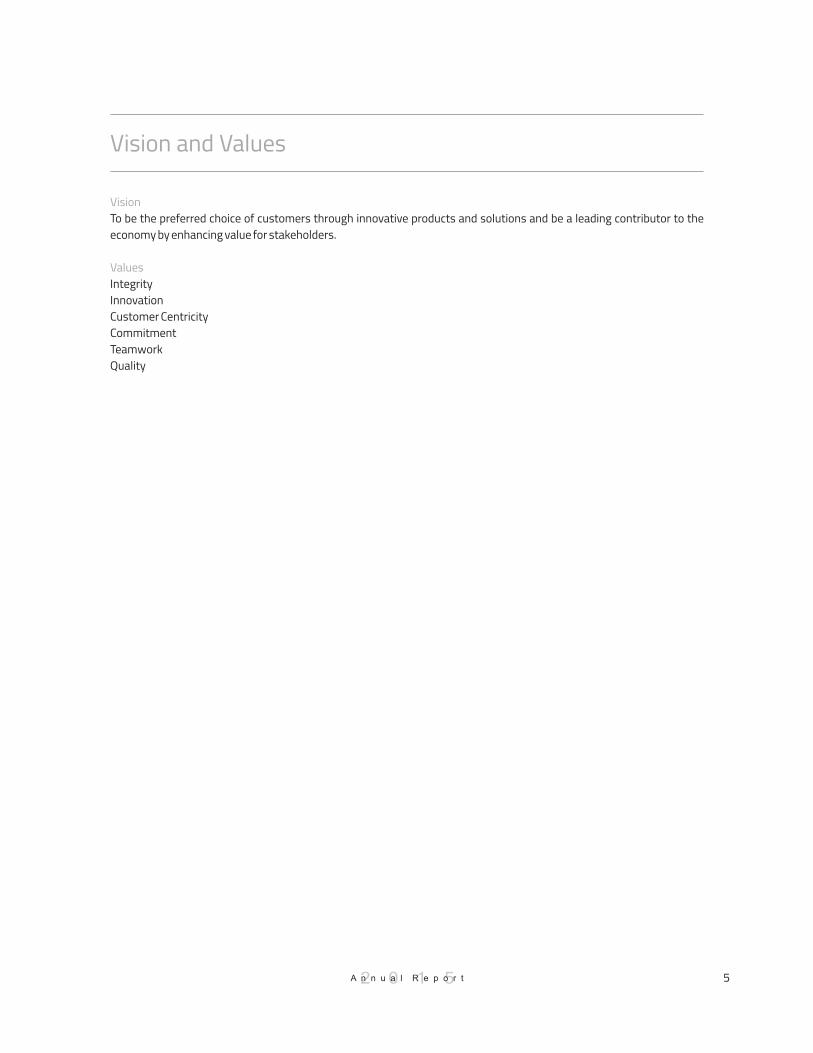
Purchase of raw material and finished productsFuel and PowerSalaries, wages and other benefits
Taxes and dutiesFinance costOthers
Cost Break up
Utilization of Available / Generated Cash
20142015
Investing Activities Financing Activities
Cash and Cash Equivalents
Graphical Representations
2015
99%
1%2%
9
49%
12%
9%
2%
4%
24%
2014
55%
13%
7%
2%4%
19%
98%
2 0 1 5A n n u a l R e p o r t

10 2 0 1 5A n n u a l R e p o r t
Directors' Report
Financial performance of company
ProfitabilityCompany maintained its profitability despite decline in Other Income by Rs.167.415 mil l ion and after absorbing increased cost of energy due higher tariff, GIDC and increase in minimum wage and rise pay of other cadres impact of Rs.166.080 million (higher by 18.38%) over the same period of last year. This performance was well supported by enhancement in gross margins which improved by 10% and bottom line was further improved through saving in finance cost by 9.2% on comparative basis.
Improvement in gross margins was achieved against lower input costs (raw materials, semi goods), saving in fuel and power costs and after hefty decline in local sales revenues along with attrition in margins due over supplied local market. On the basis of improved profitability earnings per share was slightly down (from Rs. 4.68 achieved in FY14 to Rs. 3.97 in FY15) despite 25% increase equity of the company.
Shareholders' value has uplifted by Rs.372 million, higher by 12.1%, over same period of last year through un
Financial position
appropr iated prof i t , premium received on issue of right, and gain accrued on investments held by the company. Equity of the company was increased from 49,209,923 shares to 61,512,404 through issuance of Right Shares subscribed during the year. Major portion of the shares was held by sponsors (67.58%) as on June 30,2015 including directors and their s p o u s e s ( 6 . 1 1 % ) , a s s o c i a t e d companies (33.64%) and family members (27.84%) with general p u b l i c 2 3 . 9 5 % . O t h e r m a j o r shareholders were NIT and Joint Stock Companies holding 6.23% and 1.29% respectively.
Directors' Reportfor the year ended June 30, 2015
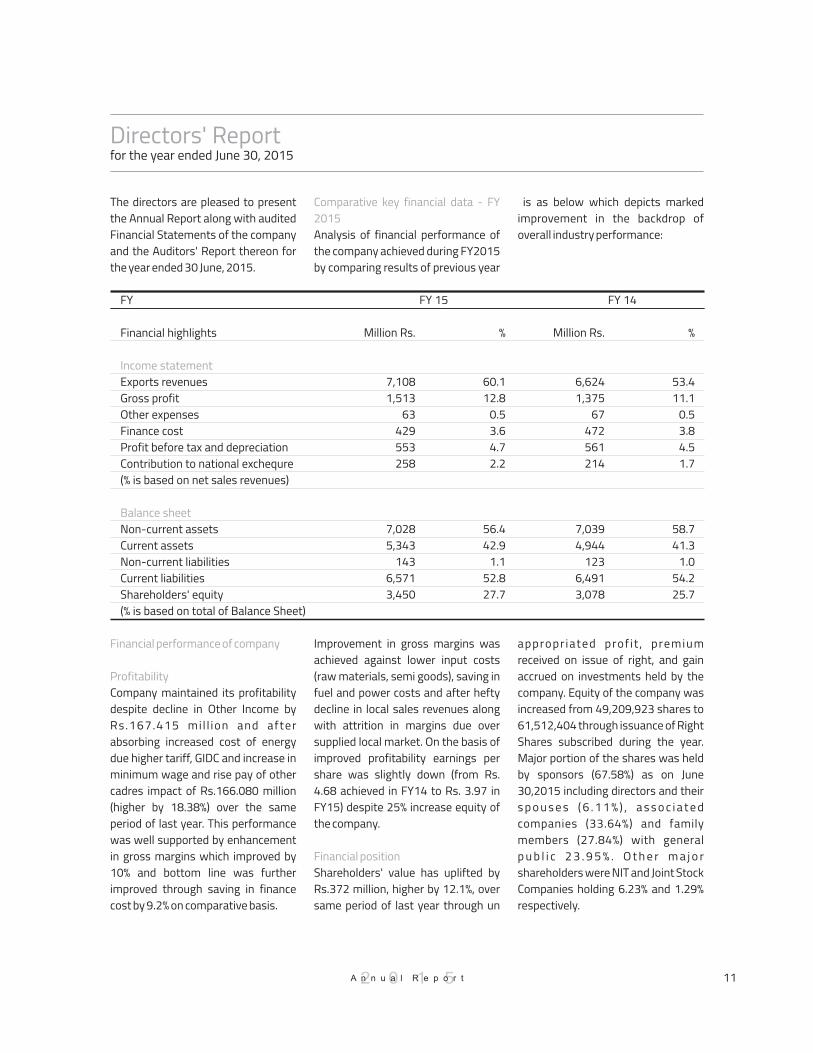
Comparative key financial data - FY 2015Analysis of financial performance of the company achieved during FY2015 by comparing results of previous year
The directors are pleased to present the Annual Report along with audited Financial Statements of the company and the Auditors' Report thereon for the year ended 30 June, 2015.
is as below which depicts marked improvement in the backdrop of overall industry performance:
Million Rs.
6,624 1,375 67 472 561 214
7,039 4,944 123 6,491 3,078
%
53.4 11.1 0.5 3.8 4.5 1.7
58.7 41.3 1.0 54.2 25.7
FY
Financial highlights
Exports revenues Gross profit Other expenses Finance cost Profit before tax and depreciation Contribution to national exchequre (% is based on net sales revenues)
Non-current assets Current assets Non-current liabilities Current liabilities Shareholders' equity (% is based on total of Balance Sheet)
Income statement
Balance sheet
FY 15
Million Rs.
7,108 1,513 63 429 553 258
7,028 5,343 143 6,571 3,450
%
60.1 12.8 0.5 3.6 4.7 2.2
56.4 42.9 1.1 52.8 27.7
FY 14
112 0 1 5A n n u a l R e p o r t

Directors' Reportfor the year ended June 30, 2015
for various business activities remained normal as planned and envisaged in annual budgets approved by the Board. Funds movement through various activities was achieved as below:
During the year operating activities generated Rs.103.741 million after paying mark up to banks and taxes and dividend payments, as against Rs.433.977 million in same period of last year due blockade of funds in GST Refunds and in increased trade debts.
For funding of CapEx requirement company obtained medium term loan of Rs.100 million from Pak Libya Holding (Pvt.) Co. Limited and also issued Right Shares @Rs.15/ share (including Rs.5/ share as premium) for Rs.184.537 million which were fully subscribed and funds received as per schedule. So, after paying due installments of long term loans and lease rentals a net cash of Rs.117.189 million was available from financing activities as against Rs.707.155 million was used for retiring bank borrowings during last year. Hence, short term borrowings of the company remained controlled and at previous year's reduced level on close of current financial year.
Company used Rs.222.670 million, net of dividend receipts and sale proceeds of operating assets, for property, plant and equipment as against receipts of Rs.273.957 million (net utilization) from these activities from sale of mainly property, plant
Cash from operating activities:
Cash from financing activities:
Cash used in investing activities:
Current liabilities increased as provision of Rs.147.332 million against GIDC was made due matter remained under contention at court of law. Contingencies mainly included bank guarantees issued by banks in favour of SNGP and financial commitments were made on account of contracts executed for capital expenditure for Rs.104.951 million and letters of credit opened for Rs.144.275 million for import of goods till the date of balance sheet.
Non-current assets of the company didn't observe any significant change as company remained focused on streamlining its spinning operations per the shifting plan of Unit 1 and 2, already approved by the Board, in the building vacated through relocation of weaving in Hattar. Therefore, no major additions to property, plant and equipment was made during the year. The implementation of this plan was cost saving in construction of new building as old structure found unsuitable and dangerous for carrying out operations under it. Another aspect was to rationalize processes of these units through better and efficient use of resources.
Current assets showed an increase of Rs.399.051 million due mainly an increase in trade debts on account enhanced shipments in last quarter and sales tax refunds remained blocked by the Govt due funds constraints.
Funds generation and utilization during the year was smooth and stable as its availability and utilization
Cash flow
and equipment during corresponding year.
Economy witnessed muted upturn during FY15 and GDP growth was highest in last 06 years; which was mainly contributed by industrial and service sector. Overall growth remained slackened as unfavourable e c o n o m i c c o n d i t i o n s h o w e d moderate performance owing to lower crop affected by floods and weather conditions. Overall growth remained entangled into political and security issues involving NWA and Karachi operations. The major shift in paradigm occurred after the tragic incident of APS on December 16,2014; which expedited execution of high risk and terror culprits under NAP (National Action Plan).
The economy faced many upheavals during the year and confronted various obstructions including disruption business activities due to floods, security and political issues. As focus of the economic managers remained concentrated to tackle these issues so, these circumstances remained responsible for drag economic indicators as achieved in table below:
Review of economy and industry:
Macroeconomic indicators portrayed divergent picture
12 2 0 1 5A n n u a l R e p o r t

Directors' Reportfor the year ended June 30, 2015
Trade deficit widened due vapid performance of exports and despite limiting import growth on low global oil prices. Exports of the country suffered in the context of low global commodities prices, strengthened PKR and low competitiveness due to a higher mix of low value added goods. But Current Account Deficit shrank on strong growth in remittances and foreign aid received during the year.
Exports for the year remained lower and stagnant as exports of textile group slipped by 1.78% as compared to last year. The decline in textile was underpinned by lower value goods; which diluted by 59.41% thus overshadowing the growth exhibited by value added goods exports. Growth in value added goods was s u p p o r t e d b y k n i t w e a r a n d readymade garments increasing 6% and 5% over the same period of last year. Conversely, restricted exports of
Exports stumbled on low commodity prices and weak demand:
cotton yarn and cotton cloth (cumulatively down by 9.86% as compared to last year) dragged overall exports as absence of China's stock piling policy and higher production of cotton in India kept Pakistani exports subdued due limiting its market. Receipt of GSP+ status provided slight support to value added segment but full potential couldn't be realized due weak EU economy. Yarn remained under pressure due to intense competition and lower demand both in domestic and export market as China limiting its imports and Indian yarn flooded local market with excess supply. Thus yarn segment continued to suffer as a result of oversupply; which suppressed margins and volumes both and impacted financial performance of spinning segment. Along with this the industry had to face burden of higher energy cost emanating from gas curtailment and higher tariff; which was partially mitigated by subsequent reduction in
furnace oil prices.
Despite depression faced by the industry the operating efficiency of the company was achieved full to its capacity with improved levels of production and sales in all its segments achieved during the year except a decline in local sale of fabric. Decline in fabric sale was mainly attributed to reduction in number of looms; which were sold during last year and weaving operations were totally abandoned in Faisalabad. So, weaving operations were only restricted to Hattar where company shifted mostly newest looms to save energy cost and improved capacity utilization. Production level in processing was down by 3.45% from previous year due some gas curtailment effects in winter but couldn't hinder the thrust of home textile segment as its performance remained afloat.
Operational performance review of the company:
13
Major indicators of economy
GDP Industrial growth Exports (Textile exports ) Imports Remittances Current account balance CPI Exch. rate FX reserves
Unit
% %
Billion US$ Billion US$ Billion US$ Billion US$ Billion US$
% PKR Vs US$ Billion US$
FY15
4.20 3.60 23.90 13.48 46.00 18.50 (2.30) 4.50
101.80 18.71
FY14
4.00 4.50 25.10 13.72 45.10 15.80 (2.90) 8.60 99.00 14.70
Var. (%)
5.00 (20.00) (4.78) (1.75) 2.00 17.09 (20.69) (47.67) 2.83 27.28
2 0 1 5A n n u a l R e p o r t

Directors' Reportfor the year ended June 30, 2015
Segmental performance:
Spinning:Considering overall depressing margins in spinning the performance of this segment of the company was quite satisfactory as lower power and input costs helped in attaining 92% capacity utilization as against 91% during last year. Under consistent bearish conditions raw materials inventory was maintained at reduced level along with regular import of polyester from China at competitive prices; which benefited in reducing input cost to some extent. Weaker up stream demand and escalated over head cost kept performance of this segment under consistent pressure. However, performance of this segment was not affected much as
change in strategy worked and insulated its margins from these affects.
To mitigate losses of this segment company changed its strategy of selling yarn to some extent and comparatively used more for value added segment. Keeping in view the market conditions and trend efforts were made to produce different mix of blended yarn to lessen the attrition in margins and to absorb capacity utilization cost. Weaker upstream demand and lack of import by China led to pressure on prices and contracted margin on yarn sales as local prices dropped to an average rate of Rs.291.61/ Kg as against 337.11/ Kg achieved during last year. Similarly, export market was also not
much different as drop 18.55% in average price was more than drop witnessed in local prices.
Decline in selling prices affected top line growth of this segment; which was down by 10.47% as against 10.06% in cost of sales of this segment resulting squeeze in gross margins. Its margins were down by 16.16% in comparison to same period of last year as continued pressure on selling prices and rise in salaries and wages due minimum wage had negatively impacted. Positive impact of inputs cost couldn't reflect in margins of spinning as domestic market was sluggish due oversupply situation.
14
Segment wise performance in terms of production level as compared to last year was achieved as below:
Segment
Yarn Weaving Processing Home textile Power generation
UM
KgsMtrsMtrsMtrs
KwHs
FY 15
21,617 8,176 24,400 20,253 69,506
FY 14
20,583 9,934
25,272 17,817 53,243
Qty in 000
Var (%)
5.0 (17.7) (3.5) 13.7 30.5
Comparison raw materials rates and selling prices with previous year's rates as below depicts the wholepicture of this segment:
Spinning Raw material prices: Cotton - Local Cotton - Imp (SS) Polyester/ Viscose Sale rates: Local Export
UM
Md Md Kg
Kg Kg
FY 15
5,337 6,283 146
292 263
FY 14
6,904 7,850 167
337 323
Rate/ Rs.
Var (%)
(22.7) (20.0) (12.7)
(13.5) (18.6)
2 0 1 5A n n u a l R e p o r t

Contraction in gross margins of spinning was 16% higher as compared to last year because decline in selling prices outpaced the decline in input costs alongside impact of minimum wage rate (increased by Rs95.541 mi l l ion i .e . 20.60% higher to corresponding period wages cost) and administrative cost (rose from 66.18 million to Rs.93.44 million i.e. higher
by 41.2% from corresponding period). Fuel and power and finance cost provided some respite due decline in furnace oil prices late during the year and lower mark up rates respectively. These cost were lower by 8.2% (decreased from Rs.1,175.51 million to Rs.1,079.56 million) and 10.2% (decreased from Rs.250.45 million to Rs.224.88 million) respectively over
same period Weak performance of spinning segment required to make some adjustment in its utilization pattern during year which tilted slightly towards in house use as depicted below from trend of last 6 years:
Directors' Reportfor the year ended June 30, 2015
15
Overall financial performance of spinning was achieved as below as against results of the corresponding year:Million Rs.
%
(10.5) (10.1) (16.0) 12.8 (31.6) 10.5
(10.2) (40.7)
9.9 (73)
Spinning
Sales Cost of sales Gross margin Operating cost Profit from operations Other income Finance cost Profit before tax Taxation Net profit after tax
FY 15
6,339.743 5,926.126 413.617 195.825 217.792 102.634 224.876
95.55 68.997 26.553
%
100.0 93.5 6.5 3.1 3.4 1.6 3.5 1.5 1.1 0.4
FY 14
7,081.385 6,589.233 492.152 173.550 318.602 92.855 250.451 161.006 62.786
98.22
%
100.0 93.1 6.9 2.5 4.5
1.3 3.5 2.3 0.9 1.4
Var Inc/ (dec)
(741.6) (663.1) (78.5)
22.28 (100.8) 9.8 (25.6) (65.5) 6.2 (71.7)
Sales composition of spinning for the year 2015 in comparison to last year was as below:Million Rs.
Var %
(3.8) (8.9) (11.5) (10.5)
Spinning
Export Inter segment sale Local Total sales revenues
FY 15 Million Rs.
272.8261722.091
4,344.826 6,339.743
%
4.327.268.5
100.0
Million Rs.
283.7421890.423
4,907.220 7,081.385
%
4.026.769.3
100.0
FY 14
2 0 1 5A n n u a l R e p o r t

Directors' Reportfor the year ended June 30, 2015
16
Weaving:Weaving operations at Faisalabad were closed early in FY15 and it only restricted to Hattar where 96 air jet looms started working gradually upon shifting from Faisalabad. The shifting and installation process completed during 1st quarter of FY15 and ended close of the year with average number of looms worked at 90 as against installed 113 looms working achieved d u r i n g l a s t y e a r . H o w e v e r , performance of this segment was comparatively better as it achieved major jump in gross margins which
was higher by Rs.90.09 million from last year and rose from Rs.20.72 million to Rs.110.81 million over last year.
T h e r e a s o n f o r s u c h h u g e improvement in gross margins was that the decline in input cost of weaving was much steeper than selling prices. Fabric production during the year was lower as it reduced to 8.176 million from 9.924 million linear meters achieved during last year mainly due reduced capacity utilization of looms. Effects of decline
in selling prices were subsided to some extent as 91% sales revenues of fabric were based its in house use. On the other hand all around decline in input, operating and finance cost had positively supported performance of this segment but ultimately bottom line result was muted as other income substantially reduced by Rs.160.32 million (declined from Rs.193.45 million to Rs.33.13 million over last year) which was derived from gain on sale of looms and ancillary machinery of this segment.
Prices of yarn incurred and recovered through fabric transferred for processing are compared as below:Rate/ Rs.
Var (%)
(14.3) (23.9) (34.1) (4.5) 3.5
Weaving
Yarn purchase rates Sale rates: Local Inter transfer Export
UM
Kg
Mtr Mtr Mtr
FY 15
317.8232
83158.8
239
FY 14
370.8305126
166.3231
Yarn (000 Kgs)%
353346515950
Year
201520142013201220112010
Available for use
23,60622,37823,04419,97622,49125,064
Sold
15,40314,89312,491
9,8029,205
12,581
%
656754494150
Used in Weaving
8,2037,485
10,55310,17413,28612,483
2 0 1 5A n n u a l R e p o r t

Directors' Reportfor the year ended June 30, 2015
17
Financial results of weaving segment are compared with last year are as below:Million Rs.
%
(28.9) (10.1) 434.9 (28.8)
(235.9) (82.9) (39.0)
(23) (58.6) (15.3)
Weaving
Sales Cost of sales Gross margin Operating cost Operating profit/ (loss) Other income Finance cost Profit before tax Taxation Net profit after tax
FY 15
4,439.187 4,328.377 110.810
45.901 64.909 33.133 54.119 43.923 4.155
39.768
%
100.0 97.5 2.5 1.0 1.5 0.7 1.2 1.0 0.1 0.9
FY 14
6,242.833 6,222.117
20.716 64.477
(47.761) 193.453
88.670 57.022 9.999
47.023
%
100.0 99.7 0.3 1.0
(0.8) 3.1 1.4 0.9 0.2 0.8
Var Inc/ (dec)
(1,803.6) (1,893.7)
90.1 (18.58) 112.67
(160.3) (34.6) (13.1) (5.9) (7.21)
Sales composition of weaving for the year 2015 in comparison to last year was as below:Million Rs.
Var %
(36.5) (87.3)
(21.1) (28.9)
Weaving
Export Local Inter segment sale Total sales revenues
FY 15 Million Rs.
320.246 78.349
4,040.592 4,439.187
%
7.21.8
91.0100.0
Million Rs.
504.686 618.112 5,120.035
6,242.833
%
4.069.326.7
100.0
FY 14
Sales revenue of weaving were down by 28.9% as compared to same period last year mainly due production capacity was reduced and also average rate earned couldn't achieve mainly market conditions were not suitable as oversupply situation was persistent throughout the year.
In the wake of depressed local market
conditions for fabric most of the weaving output was utilized for value added segment in processing and home textiles requirements which yielded improved revenues and margins for the company. It not only lessen losses of weaving segment but also resulted in increasing exports revenues of value added segments with better margins on ever rising
export demand.
Fabric util ization pattern was altogether different from past years due improved requirement for processing. This has depicted below in comparison to past 06 years trend:
2 0 1 5A n n u a l R e p o r t

Processing and home textiles:On improved export orders with availability of gas and the addition of coal steam boiler the performance of these segments was satisfactory and better production levels were achieved and reflected in exports; which was higher 11.6% as compared to last year. The production of home textiles, both from in house and outside source, increased by 13.7% (went up from 17.817 million linear meters to 20.253 million linear meters from same period of last year) but in processing it went down slightly by 3.5% over last year (decreased from 25.272 million linear meters to 24.400 million linear meters).
Similar trend was witnessed in average rate per meter for processing
and home textiles as it showed slight down trend in processing (reduced f r o m U S $ 1 . 9 2 / m e t e r t o US$1.88/meter) and a stable price was realized in home textiles (improved from US$2.46/ meter to US$2.59/ meter) over the rates of last year. To meet increased demand of fabric for value added segments the company procured mostly outside weaved fabric; which not only fulfilled gap of fabric due reduced air jet looms capacity but also saved substantial revenue as conversion cost of fabric per meter was lower by 11.4% due abundant capacity available in the market. Enhanced shipment was also achieved through outsourcing of processing and stitching of processed fabric as this cost showed an increase of 61.5% (increased from Rs.189.438 million to Rs.305.960 million over last
year).
Increased shipments, better selling r a t e s a n d l o w e r c o n ve r s i o n , processing and stitching costs for these segments helped in improving gross margin which rose to 14.3% as against 13.8% achieved during last year. Increase in cost of sales except fuel and power was mostly recorded on higher shipments but rise in salaries and wages was due minimum wage impact. Fuel and power was lower on reduced energy cost despite rise in gas tariff. Stable distribution, operating and finance costs improved profitability of these segments but bottom line was checked with higher taxation which rose by 107.1% and net after tax profit remained at of previous year's level.
Directors' Reportfor the year ended June 30, 2015
18
Fabric (000 Mtrs)%
906068797671
Year
201520142013201220112010
Available for use
7,96710,22219,15317,41020,09024,125
Sold
7994,0396,0673,7224,7887,006
%
104032212429
Used in processing
7,1686,183
13,08713,68815,30217,119
2 0 1 5A n n u a l R e p o r t

Directors' Reportfor the year ended June 30, 2015
19
Quantitative data and prices of inputs and shipments of these segments in comparison to last yearwere recorded as below:
Var (%)
27.5 (31.7) 61.5
(47.6) 2.3 17.4
(11.4) 11.0
(11.4) (2.1) 5.3
0.3 23.9
Process and home textiles
Quantity / Rs. (in 000):
(Purchases) Outside weaving Fabric purchase Processing & stitching cost
(Sales- Local/ Exports) Processed fabric/Grey- Local Processed fabric- Export Home textiles- Export
Cost (Price / Mtr.) Outside weaving Fabric purchase
O/s Wvg Charges (Rate/ Mtr.) Processed fabric- Export Home textiles- Export
Exports (Million) Processed fabric Home textiles
UM
MtrMtrRs.
MtrMtrMtr
Rs.Rs.
Rs.US$US$
US$US$
FY 15
17,569 4,474 305,960
2,963 4,359 20,260
23.24 170.11
23.24 1.88 2.59
8,215.667 52,521.330
FY 14
13,775 6,554 189,438
5,656 4,261 17,251
26.24 153.22
26.24 1.92 2.46
8,188.72042,377.928
Utilization of processed fabric for value addition also remained on the
rise and focus to increase revenues through enhanced usage in home
textiles for the same improved in comparison last 06 years as below:
Processed fabric (000 Mtrs)%
787668646569
Year
201520142013201220112010
Available for use
28,70323,63730,00626,63731,12235,477
Sold
6,2145,7479,6759,718
11,01111,026
%
222432363531
Used in home textiles
22,48917,89120,33116,91920,11124,451
2 0 1 5A n n u a l R e p o r t
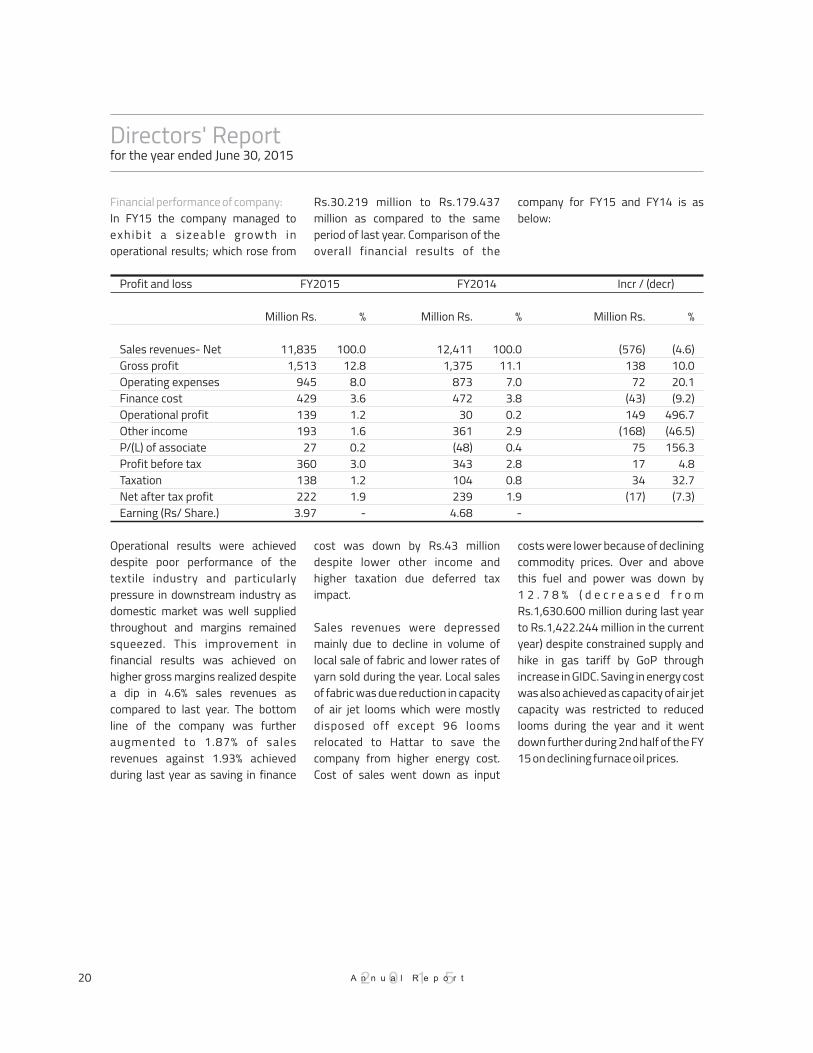
company for FY15 and FY14 is as below:
Rs.30.219 million to Rs.179.437 million as compared to the same period of last year. Comparison of the overall financial results of the
Financial performance of company:In FY15 the company managed to exhib i t a s izeable growth in operational results; which rose from
Directors' Reportfor the year ended June 30, 2015
20
Profit and loss
Sales revenues- NetGross profitOperating expensesFinance costOperational profitOther incomeP/(L) of associateProfit before taxTaxationNet after tax profitEarning (Rs/ Share.)
FY2015
Million Rs.
11,8351,513
945429139193
273601382223.97
%
100.012.8
8.03.61.21.60.23.01.21.9
-
FY2014 Incr / (decr)
Million Rs.
(576)138
72(43)149
(168)751734
(17)
%
(4.6)10.020.1(9.2)
496.7(46.5)156.3
4.832.7(7.3)
Million Rs.
12,4111,375
873472
30361(48)3431042394.68
%
100.011.1
7.03.80.22.90.42.80.81.9
-
costs were lower because of declining commodity prices. Over and above this fuel and power was down by 1 2 . 7 8 % ( d e c r e a s e d f r o m Rs.1,630.600 million during last year to Rs.1,422.244 million in the current year) despite constrained supply and hike in gas tariff by GoP through increase in GIDC. Saving in energy cost was also achieved as capacity of air jet capacity was restricted to reduced looms during the year and it went down further during 2nd half of the FY 15 on declining furnace oil prices.
cost was down by Rs.43 million despite lower other income and higher taxation due deferred tax impact.
Sales revenues were depressed mainly due to decline in volume of local sale of fabric and lower rates of yarn sold during the year. Local sales of fabric was due reduction in capacity of air jet looms which were mostly disposed off except 96 looms relocated to Hattar to save the company from higher energy cost. Cost of sales went down as input
Operational results were achieved despite poor performance of the textile industry and particularly pressure in downstream industry as domestic market was well supplied throughout and margins remained squeezed. This improvement in financial results was achieved on higher gross margins realized despite a dip in 4.6% sales revenues as compared to last year. The bottom line of the company was further augmented to 1.87% of sales revenues against 1.93% achieved during last year as saving in finance
2 0 1 5A n n u a l R e p o r t

Finance cost (Rs Mln) Short term loans: SBP Refinance FCY Loans (US$) Cash Finance Sub. Ttl. Long Term Loans G Ttl. Exchange Loss/ (Gain) Other G Ttl. (Net Cost)
2015 M Up 101
105 96
302 29
331 89
9 429
% 5.4 3.5 12.4 5.4
11.0 5.6 - - 8.7
Used 1,562 836 2,769 5,167 400 5,567
- -
5,567
M Up 121 15
330 466 41
507 (45) 10 472
% 7.7 1.8
11.9 9.0
10.2 9.1 - - 9.1
M Up (20)
90 (234) (164) (12) (176) 134 (1) (43)
% ( 16.5)
600 (70.9)
(35.2) (29.3) (34.7) 297.8(10.0) (9.2)
2014 Var Used
1,850 2,990
776 5,615 268 5,883
- -
5,883
Directors' Reportfor the year ended June 30, 2015
21
Comparison of energy cost with previous year's results is as below:%
(5.9) 5.9
12.5 (2.6) (44.4) (47.9) (6.1)
(42.5) 132.4
36.5 (41.3) 140.4 (3.3)
(12.2) (9.2)
Fuel and power cost:Gas (Kwhs 000) Million Rs. Rate/ Rs. Mix (%) WAPDA (Kwhs 000) Million Rs. Rate/ Rs. Mix (%) HFO (Kwhs 000) Million Rs. Rate/ Rs. Mix (%) Overall (Kwhs 000) Million Rs. Rate/ Rs.
2015 39,881 411.42
10.32 37
29,644 380.79
12.84 27
39,402 535.50 13.59 36
108,927 1,327.71
12.19
2014 42,363 388.66 9.17 38
53,326 731.25 13.67 47
16,951 392.38 23.15 15
112,640 1,512.29
13.43
Var (2,482) 22.77 1.15 (1)
(23,682) 350.46 (0.83) (20) 22,451 143.12
(9.56) 21
(3,713) (184.58)
(1.24)
Aforesaid analysis was indicative of major saving in fuel and power cost accrued from use of furnace oil which resulted in reducing overall energy cost by Rs.184.580 million over last year. Energy rate was thus lower by Rs.1.24/KwH and 9.2% down from the rate of last year. Jump in usage of furnace oil was 132.4% as its proportion in energy was enhanced by 140.4% over same period of last year.
Operating cost of the company was
generally in control except an increase in freight and shipments and in salaries and wages by Rs.41.698 mil l ion and Rs.52.262 mil l ion respectively over the cost of last year. Other income remained lower during the year owing one time major impact of gain on sale of machinery booked by the company during last year.
Finance cost went down by Rs.43 million (decrease of 9.2% over the cost of same period last year) despite an
increase in average utilization of borrowings during last year due decrease in average mark up rates from 8.46% to 7.90% during current year which helped in keeping the same under control. Saving in finance cost was relatively muted as company got hit of Rs.88.870 million due exchange fluctuations during 1st quarter of the FY 15. Comparison of finance cost with previous year's cost has shown in following table:
2 0 1 5A n n u a l R e p o r t

Directors' Reportfor the year ended June 30, 2015
22
Profit, dividend and accumulated free reserves:
Future prospectus and sustainability of the company:
Including previous year's profit the company had Rs.2,585.358 million of revenue reserves and out of the same Rs.61.512 million were utilized towards payment of final dividend @Rs.1.25/ Share on 49,209,923 shares fully paid during the current year as approved by the members in Annual General Meeting of the company held on October 30,2014. These reserves were further boosted with profitability, gain on fair value of investments and premium on right issue during the year and were up by Rs.249.155 million to close reserves at Rs.2,834.538 million available for distribution at the end of financial year 2015. Thus net increase of 9.63% was recorded in the value of shareholders in FY2015.
To sustain in a very competitive and difficult business environment the industry is currently facing the company has been undertaking various steps for its sustainability with consistent growth in its assets base for improved earnings and sustained profitability and to add value to its shareholders.
For achieving aforesaid goal it needs to initiate some visible steps besides other measureable objectives which could demonstrate such attainment in the future periods like:
-
-
-
-
approved Budget which will not only strengthen its assets bases but will improve its competitive edge through premium in value and quality of its products.
through practical steps it is our conscious approach to lessen the burden of borrowings of the company so that maximum return on assets is achieved for the shareholders by saving through financial cost. To exhibit this approach the company has sold its land at Pindi Bhattian as was approved by the members in their meeting held on October 30,2014 for Rs.144.150 million during Jul,2015. This has been disclosed with current assets as 'Non Current assets held for sale for Rs.84.314 million' in the financial statements of FY2015. The revenues from sale proceeds of land wi l l subside both borrowings and finance cost.
Taking advantage of the situation of declining oil cost the company has resorted to maximum use of furnace oil for energy generation as it has edge over industry for altering its options to various resources of energy between gas, WAPDA and HFO use.
a)
Other steps which the company is using for improved performance in FY16 are:
Business risks and opportunities:Current business environment is not risk free as every business decision involves some risks and rewards particularly in textile industry which is not only affected through local risks but definitely is prone to international as well as major products and goods are exported worldwide. Pakistan is particularly confronting this situation from regional competitors like India, China and Bangladesh.
Risks are mostly emanating from estimate and assumptions which are the underlying on historical basis for preparation of financial statements but actual results may differ some time if such basis are revised due some significant changes in the future periods. Operational and commercial risks attached are mainly due to constraint energy supply to the
Efforts are being made through lowering input costs and improving prices and margins to avert loss areas like it happened to achieve in yarn segment where other have barely achieved any profitability.
Improve products quality, relationship with customers through a permanent liaising, a c h i e v e e m p l o y e e s ' satisfaction and keep clean e n v i r o n m e n t a n d transparency in financial r e p o r t s t h r o u g h g o o d g o v e r n a n c e u n d e r t h e capable guidance of our worthy board.
Maximize productions levels for gradual increase in vo lumes and revenues growth.
company has embarked upon a CapEx plan of Rs.800 million for i ts d i f ferent segments of processes in FY16 out of the
2 0 1 5A n n u a l R e p o r t

FY 2015 Million Rs.
2014
11,835 9,5922,243
1,070
258
89
429
10
388 2,243
12,411 10,243
2,168
903
214
62
472
12
505 2,168
Directors' Reportfor the year ended June 30, 2015
23
industry particularly lack of gas in the winter which not only hinders exports volumes but also increases fixed cost burden to curtail growth of the company. Company's earnings are g r e a t l y i n f l u e n c e d t h r o u g h commodities prices and finance cost which are currently at lowest levels. Any fluctuation in future will definitely affect its earning capability and also its growth. To mitigate effects of these changes which are inevitable various measures are undertaken during the course of business.
These measures include guidance of the Board and Committees which oversee the performance of company through regular quarterly meetings
and take necessary decisions on various operational and strategical matters. Management is focused to implement under approved policies and procedures to achieve desired results which are then monitored and discussed in those meetings. Similarly the tough and difficult business environment may prove blessing in disguise for those who hold strength and consolidate on the opportunities through a consistent vendors and customer base. In that situation business with weak footings are weeded out of market and businesses having sound financial position take advantage through improved cost and better price due to their commitment and performance.
Contribution to Economy and Value Addition:Company contributed a substantial amount of Rs.206 million to National Ex Chequer during the year by way of taxes, levies and duties. In terms of value addition to foreign exchange it contributed US$70.103 million by repatriating through exports during year under review.
Total value addition to the economy during the year 2015 was Rs.2,243 million as against Rs.2,168 during preceding year, detailed distribution of the same has been reflected in the table as below:
Statement of Value Added
Net Wealth Generated
To Employees
To Government
To shareholders
To Providers of Finance
To Society
Retained within the business for future growth
Wealth Distributed
Total revenueBought-in-material and services
Salaries, wages and other benefits
Taxes and duties
Dividend*
Finance cost
Donation toward health and education
Retained earnings and depreciation
* Dividend recommended by BOD subsequent to year end.
2 0 1 5A n n u a l R e p o r t

Directors' Reportfor the year ended June 30, 2015
24
There was substantial increase during the year towards employees earning which remained 18.5% higher (rose from Rs.903 million to Rs.1,070 million and taxes and duties were up by 21% (increased from Rs.214 million to Rs.258 million) over last year. Contr ibut ion towards Foreign Exchange Reserves of the country was boosted by exporting textiles worth of US$69.763 million as against US$64.401 million earned during last year. Thus an increase in exports of the company was recorded by 8.3% in comparison to last year.
Sustainability:Alhamdulillah the company has completed 66 years of its existence with successful, responsible and rewarding business entrepreneur for all its stakeholders. Company contributes every year to these
avenues without any default and committed to take the lead in every coming year for the well being of all a s s o c i a t e d i n c l u d i n g G o v t , employees, bankers, shareholders and the society at large.
It conducts its business operations in a manner that it not only fulfills expectations and interest of all the stakeholders but simultaneously also discharges its social obligation as well towards the society without any fear and fever to particular class of citizen as a responsible citizen.
In its commitment to serve and facilitate the society the company contributes directly and indirectly to various programs undertaken by various communities of the society. Our commitment is firm on our belief
Corporate social responsibility:
that such contributions pave the way in uplift and add value to the under privileged class of society. We contribute to various programs i n c l u d i n g e d u c a t i o n , h e a l t h , environment, promotion of sports and relief/ rehabilitation activities carried by Govt and Semi Govt organization:
Most of underprivileged class of the society suffers due lack means and can't contribute to the society's betterment by imparting primary education. In persuit of this very basic right of citizens of the country the company contributes directly by paying the cost of construction of building and annual support expenses of 02 Primary Schools run by The Citizen Foundation (TCF) in vicinity of Faisalabad and Chiniot. Indirectly the
Education:
2 0 1 5A n n u a l R e p o r t
Distribution of Wealth
EmployeesGovernmentShareholders
Providers of financeSocietyRetained within the business
2015 2014
42%
10%3%
22%
0%
23%
48%
12%4%
19%
0%
17%

Directors' Reportfor the year ended June 30, 2015
2 0 1 5A n n u a l R e p o r t
running elementary schools and rehabilitation centres for the deprived
and handicapped class of the society.company provides financial support to various welfare organization
people. These institutions provide treatment to cancer patients and for rehabilitation of blindness and kidney health care. Contributions made both in kind by arranging laboratory and treatment apparatus and equipments and through regular funding in shape of monthly and annual donations.
To ensure health and safety of its employees at workplace employees are protected by occupational safety through implementation various rules and procedures while performing on the jobs. Adequate training and awareness programs are carried for the employees for technical and sensitive activities before they actually start work. Trained and professional tutors supervise this job in the 'Training Centre' established by the company. New appointed
employees are familiarized with rules and regulations through visits of plant, IT Training, awareness campaigns and using on job safety instruments. A full fledge fire fighting d e p a r t m e n t i s l o o k i n g a f t e r immediate fire hazardous. For immediate treatment of minor injuries employees are provided first aid within operational environment. Medical officer is hired annually for checkup and for providing basic health treatment to employees engaged in plant operat ional activities.
Company also contributed towards the rehabi l i tat ion of IDPs of Waziristan and flood affected people by providing contributions through var ious Govt and Semi Govt Organizations .
Contributions are made annually and throughout the year based on evaluation criteria set by the management on the basis of regular feedback and annual review of their performance. Selection of such organizations is made purely on merit with deserving back ground and across the country.
Cognizant of this very vital aspect the company provides financial support reputable and trusted institutions where underprivileged classes of the society are given free treatment. Most of these institutions have special programs for very costly and s c a r c e t r e a t m e n t f o r t h e rehabilitation of impaired and handicapped people deserving
H e a l t h , r e h a b i l i t a t i o n a n d environment:
25

To maintain healthy and cordial environment amongst employees the company sponsors a football team and provides regular practice and coaching facilities to the team m e m b e r s . T h e C re sTe x t e a m participates in various tournaments across the country and has been winning accolades, prizes and trophies. Team members are paid salary and provided full kit and ground facilities within the mills premises. For healthy activities annual sports programs are followed and matches of different sports are organized amongst zonal teams of the company representing whole of employment force which enables them to interact and provides opportunity to perform in extracurricular activities to demonstrate their potentials and abilities.
In order to keep environment clean, pollution and noise free company conducts its business operations in a c c o r d a n c e w i t h l o c a l a n d international standards and remains c o m m i t t e d t o p u r s u e s u c h requirements. It collaborates and fulf i l ls requirements of local authorities and ensures to minimize the hazardous effects of its activities on natural and human environments. Besides establishing and maintaining strict health and safety standards in its operational activities it entails into environmental friendly activities through land escaping of i ts surroundings by expending sizeable amount to the horticultural activities inc luding part ic ipat ion of i ts employees and departments through c o n t i n u o u s m o n i t o r i n g o f housekeeping standards.
As a responsible and sustainable organization since its inception company has always endeavors to distinguish itself not only as an opportunity employer for the community by remunerating well and a l s o c o n s i s t e n t l y d e l i v e r e d r e a s o n a b l e r e t u r n s t o t h e shareholders . Employees are provided opportunities for growth and progress with residential facilities and are encouraged to participate in recreation activities with safe, healthy and compulsory group insurance for death and disability compensation. Subsidized food from canteen and cafeteria, medical first aid with ambulance faci l ity have been arranged for workmen besides availing benefits of Social Security and EOBI schemes where company contributes monthly of all its insured employees. Health Insurance facility from a reputable Insurance Company has been arranged for employees not covered in aforesaid schemes.
a)
b)
c)
Business and operations of the company are certified for compliance of international standards and regulatory requirements from national and international agencies. It
Contribution to Social work and philanthropies: Likewise of previous years donations were given to 25 ( as against 19 in previous year) g e n u i n e , r e p u t a b l e a n d trustworthy charitable, social and welfare organizations who are engaged in helping and improving health and socio economic conditions of the poor and needy organs of the society. Company also contributed directly and indirectly to the Flood Effectees and IDPs of NWA to help them in difficult times to subside their miseries and for discharge of its responsibilities on humanitarian
grounds and for fu l f i l l ing commitments to noble cause.
Company is very concerned c o n s c i o u s a b o u t c l e a n environment regularly obtains certification from Environmental Protection Agencies for its plant which generates effluents and gases. It ensures and protects its operational facilities through installation of required safety equipments to fu l f i l l th is commitment. Company had installed ETP (Effluent Treatment Plant) for water being discharged from its fabric processing facilities.
Company has maintained health and safety measures at the workplace to ensure that employees are protected by occupational safety rules and procedures while performing jobs. Adequate training and awareness about technical jobs are given to all employees in the 'Training Centre' established by t h e c o m p a n y . T h e y a r e familiarized with rules and regulations through visits of plant, IT Training, awareness campaigns and using on job safety instruments. A full fledge fire fighting department is looking after immediate fire hazardous.
Environmental protection:
Occupational health and safety:
Directors' Reportfor the year ended June 30, 2015
2 0 1 5A n n u a l R e p o r t26

Directors' Reportfor the year ended June 30, 2015
2 0 1 5A n n u a l R e p o r t
ISO 9001:2008 Quality Management SystemsISO 14001:2004 Environment Management SystemsOCS 100 Product Standards, Organic Content StandardGOTS Product Standards, Global Organic TextilesOeko-Tex 100 Product Standards, Human Ecology for FabricOeko-Tex 100 Product Standards, Human Ecology for Home TextilesNordic Ecolabelling Nordic Ecolabelling of TextilesCmIA Cotton Made in AfricaSupima World's finest cottonEgyptian Cotton Egyptian cotton Trade Mark CertificationBCI Better Cotton InitiativeSA 8000 Social accountability SEDEX Audit Data Bank for sharing with customers
Relations with personnel and the community: The company has a long and established history of keeping its cordial relations across at all levels w i t h m u t u a l t r u s t , r e s p e c t , cooperation and confidence. This ensures and improves ultimate efficiency of the company. Under a defined and documented criteria in line with national and international laws people are recruited and hired. This is demonstrated at all levels beyond any racism, cast, sex or religion criteria and respects human r i g hts et h i cs a n d s ta n d ards . Appropriate opportunity is afforded to the workmen in participating CBA activities and elect representatives of their choice under free and fair environment.
Every year through a demand notice raised by CBA company pays incentive bonuses besides profit bonus, bears
Hajj expenses of 06 employees with 15 days paid holidays, allows matern i ty leaves to females employees, distributes cycle, fan, s e w i n g m a c h i n e s o n e a s y installments and has arranged FP Shop/ Utility Stores, School Bus and Canteen facil it ies. To address grievances of employees a Work Council has established which conducts regular meetings. Company is also maintaining Workers Welfare Funds for needy / distressed employees.
Under the terms of agreement executed each year with CBA employees are provided financial aid for marriage of daughters and funeral expenses and also some kind of financial help to very needy cases. Company has been provid ing residential facilities to all its essential employment with free provision of utilities according to cadre and status.
To perform religious and sports affairs the company has mosque, club and ground inside its mills colony. For learning and growth of employees in-house and outside training courses are arranged at the time of hiring and then during job.
To keep work friendly environment company has set procedures, rules and regulations which regulate e m p l o y m e n t o f a l l c a d r e s . Harmonious working environment and cordial industrial relations prevailed during the year. The operations of the company were carried out keeping in view the dignity, respect, support, protection as per national and international standards set to meet the working environment. All workmen performed their duties and jobs at standard hours and if they were required to put extra workings to meet exigencies and to fill man power shortage they were compensated and
has been achieving and obtaining third party certifications through the
accredited agencies for following product, services, management and
environmental systems standards:
27

Directors' Reportfor the year ended June 30, 2015
2 0 1 5A n n u a l R e p o r t
paid as per the legal criteria. There were no such complaints of any work abuse or not fulfilling requirements by the company. They were provided usual working environment and relations remained cordial.
Company countered successfully the constrained energy resources by having option of both in house and outside energy and gas facilities. Looking at the main bottleneck for its smooth operations the company dispensed with most of air jet looms with dislocation of some of efficient looms at Hattar (KP) which not only saved it from more energy prone segment but also enabled it to use available energy resources more efficiently. This was done without compromising on the volume of business and keeping availability of required and cheaper option of fabric to the value added segments from market. Throughout the year no shutdowns were witnessed in any segments except due to routine overhaul and maintenance rather efforts were made to optimize the use of gas and energy through steady plant operations by monitoring of efficient utilization of energy by installing gauges and meters to avoid energy losses. Employees' retirement benefits:Company established an 'Employees' Provident Fund Trust' to manage and c o n t r o l i t s f i n a n c i a l a f f a i r s independently. Trust is recognized under Income Tax Laws and its income and contributions are exempt from tax. It receives subscription from employees with equal contribution f rom company. The va lue of
Efficient energy utilization:
investments of fund as per unaudited accounts on close of financial year, w e r e R s . 1 , 0 8 3 . 3 9 3 m i l l i o n (Rs.967.595 million audited accounts of Financial Year 2014).
To meet ever growing business challenges and ensure timely and accurate MIS for online monitoring of o p e r a t i o n a l a n d f i n a n c i a l performance the company ERP functions is upgraded and maintained to fulfill this aspect of business. IT is equipped with newly designed software and hardware requirements for smooth flow of information. OF (ERP System) remained in functioning with newest version and catered m a n a g e m e n t i n f o r m a t i o n requirement for smooth availability of monthly, quarterly, half yearly and annual requirements besides online MIS for timely and accurate decision making. Working of other ERP solutions for HR and Inventory management (Stores and spares) was smooth as linkage of these systems provided error and hastle free ERP environment.
Key advantages of the systems implemented so far are:OF enables compilation of financial statements with monthly reporting of segmental results for management to exercise better control over the affairs of the different segments and also keep watch an overall performance of the company. This on line system up dates the flow of financial information which integrates and disseminates the data for decision making.
Purchase and Inventory System (PIS) provides real time information flow,
ERP and IT development:
r e d u c e s t h e e f f o r t s , a v o i d s duplication and facilitates physical stores reconciliation and monitoring. It gives up date carrying value of the store and spares inventory and facilitates users to run and plan plant operations smoothly.
Human Resource Management (HRM) system is helpful to maintain and update human resource data and payroll processing very efficiently with a push of button. Ever since its implementation along with swiping of employees attendance is facilitating hiring, recruiting, transfers, relieving and payroll preparation. This error free and online system avoids d u p l i c a t i o n a n d d e l a y s i n disbursement of payroll or other dues of employees.
Besides aforesaid online monitoring systems the flow of specific and micro level MIS is also monitored and updated through LAN and Portal arrangement. This is very helpful for smooth operations of the company's affairs. Now top and different tears of the management interact with each other through business and work friendly software ASANA which is practiced and followed through the company for smooth work flow and implementation of different tasks. IT departments is oversees by the q u a l i f i e d p r o f e s s i o n a l s w h o continuously work to provide due support at all levels for smooth flow of business information with appropriate codes and passwords for various workstations and users to ensure safety and security of MIS. Regular backups are taken and records are kept at separate place besides updating at work place for
28

Directors' Reportfor the year ended June 30, 2015
2 0 1 5A n n u a l R e p o r t
real time flow of MIS.
Company has established an internal audit department under supervision of HIA (Head of Internal Audit) who is a qualified Chartered Accounts and his team of senior and junior auditors and directly reports to the Chief Executive and takes guidance from the Internal Audit Committee of the Board. HIA ensures to implement the approved annual audit plan is then monitored by the Chief Executive and Executive Director. Internal Audit Department functions independently reviews and monitors various internal control systems, policies and various regulations framed for this purpose.
Audit reports and findings are regularly discussed with the Chief Executive and Executive Director after completion of audit along with Zonal Heads of relevant segment for implementation after evaluation and resolution of internal audit findings. All such reports are submitted to the Internal Audit Committee of the Board for taking required guidance and decisions in view of priority of the issues highlighted in the audit reports.
During FY16 the company has planned to import various machinery items under BMR to update and improve its plant efficiencies and for that purpose an investment of Rs.800 million is envisaged in different segments. For this purpose required LCs and funding arrangements are in process so the newest and efficient machines are installed in shortest possible time for elevation of
Internal Audit and review system:
Future business plan:
company's growth. With improved profitability and sustained growth in company's business required BMR will be carried out in all segments along with due focus on availability of energy resources at competitive cost.
Pakistan's share of global textile trade has dropped from 2.20% to 1.80% during last five years and may go d o w n f u r t h e r i f i t r e m a i n s uncompetitive in the region with lower power supply and high cost of doing business and lack of desired relief in Taxes. To improve trade deficit the GoP is planning to introduce export promotion package to boost exports. Given the global state of economy which continues to volatile some concrete steps are needed for sustained up stick of the economy. Constra ined gas supply, non realization of GST/ Income Tax Refunds and implication of GST on s u p p l y c h a i n a r e t h e o t h e r impediments which are hindering growth of value added segments of the industry.
USDA has forecasted lowest global cotton output in last 06 years owing to declining output in India, China and USA. The local output of cotton is also likely to decline 12% from that of last year. At the same time global economic outlook is also slowing in confluence to declining currency outlook. Pak cotton prices have declined in recent times 18% against 3% decline of international prices on weak demand. Similarly, on weak demand and oversupply weigh on margin and prices of yarn so, under mix and divergent business outlook
Future business outlook:
the performance of the industry is looking cloudy and hazy. On the other hand decline in commodity prices particularly of oil prices and mark up rates may trigger the growth engine as energy cost on furnace oil is likely to give support to it.
To surmount these challenges and business uncertainties surrounding to the industry we are confident that though mitigating strategies, cost economies and consolidation to our base we shall continue to present some improved performance in future periods also.
During the year company posted a net after tax profit of Rs.221.694 million (against Rs.239.019 million during preceding year) and with EPS of Rs.3.97 (against Rs.4.68 during last year). Board of Directors have recommended cash dividend @ 14.5% i.e. Rs. 1.45 per share (2014: 1.25 per share) to be paid after approval by the shareholders in AGM.
To ensure transparency and good g o v e r n a n c e i n o u r b u s i n e s s performance for our all stakeholders we remain compliant to the best practices of business, code of corporate governance, code of conduct which are applied at all levels of management across the company.
a)
Appropriations:
Corporate governance:
29
Evaluation and performanceBoard has clear idea to its goals and having means to achieve these targets for evaluating performance and effectiveness of the company. Board carries the

Directors' Reportfor the year ended June 30, 2015
2 0 1 5A n n u a l R e p o r t
c)
d)
e)
f)
g)
b)
responsibility for policies, ethos a n d d i r e c t i o n s o f t h e organization, the obligations and co nt r a c t s w h i c h co m p a ny undertakes. Board has defined system and controls to monitor for professional standards and c o r p o r a t e v a l u e s , w h i c h promoted integrity of Board and the company. Thus performance of the company is clear reflective of feasible and pragmatic decisions and policies set out by the Board for the company. Following major functions of company evaluates performance of the Board:
-
-
-
-
-
-
It is therefore, critical for the Board to review strengths and weakness on regular basis and develop strategies to address any limitations if identified.
In line with the requirement of
Evaluat ion of the Board's performance:
E n h a n c e v a l u e o f t h e shareholders.
Implementation of Code of Corporate Governance.
I m p r o v e f i n a n c i a l performance of company.
Fulfillment of regulatory requirements.
Consistent BMR and up gradation of manufacturing facilities.
Employees turnover and retention.
code of corporate governance board has devised criteria to judge its annual performance with globally implemented designed mechanism on the basis of its composition, scope and o r g a n i z a t i o n . I t a l s o encompasses its functions, responsibilities at the same m o n i t o r i n g o f c o m p a n y ' s performance. The criterion is circulated in the form of a questionnaire with each of the member to participate by filling it up for compiling of the same by the Corporate Secretary. Any such weak and divergent opinion is identified for discussion in the next board meeting to formulate the strategy for improvement of board's performance.
As per the code of corporate governance positions these two portfolios are held separately with clear distinction their role and responsibilities of the same.
All sensitive information relating and affecting share price of the company is immediately notified to the stock exchanges of the company for dissemination of the same to the members of the company.
Stock exchanges are regularly updated on trading of company's shares by the directors, spouses and their children with those
Offices of the Chairman and the Chief Executive:
Disseminat ion of mater ia l information:
Trading in shares by directors andexecutives:
transacted by the executives of the company also.
Throughout the year quarterly f inancial statements were circulated to the board duly signed by the Chief Executive and the Chief Financial Officer. These f i n a n c i a l s t a t e m e n t s a r e reviewed by the Audit Committee of and are placed before the board for consideration and approval of the same. Quarterly and annual f inancial statements were a p p r o v e d , p u b l i s h e d a n d circulated to the members within required period. Half yearly statements were reviewed by the external auditors and were approved and circulated to the members in required time frame. S imi lar ly, annual f inancia l statements of the company were audited by the external auditors and were approved and circulated as per stipulated time period. These financial statements are then immediately affixed on the website of the company for review of interested parties.
All the Board meetings are conducted in compliance with the code of corporate governance. For convening of board meeting a seven clear days notice along with the agenda items to be discussed in the meeting are intimated through post as well as t h r o u g h e m a i l . A l l t h e participating directors express their free and due opinion and
Quarterly and annual financial statements:
Board and committee meetings and recording of proceedings:
30
Directors' Reportfor the year ended June 30, 2015
h)
The Board is fully aware of the importance of local and international p r i n c i p l e s o f b e s t c o r p o r a t e governance. All periodic financial statements were circulated to the
Best Corporate Practices:
board duly endorsed by the Chief Executive Officer and the Chief Financial Officer for approval and then circulation. Quarterly financial statements duly approved by the Board were circulated and placed on the website of the company within stipulated period. These financial statements included review of the period involved and future plans of the company with analysis so that the stakeholders remain updated and well informed about the prospects of the company.
The company complies with the Code o f Co r p o r a t e G ove r n a n c e a s contained in the Listing Regulations of the Stock Exchanges. The role of the Board is primarily to protect and enhance shareholders long term value. To fulfill the same it is responsible for overall corporate governance of the company including approval of strategic policies, defining and monitoring management's goals
Corporate Governance:
and ensuring the integrity of internal c o n t r o l s a n d m a n a g e m e n t information system. It also approves and monitors financial and other reporting. The Board has formally delegated the responsibility for administration and operation of the company to the Chief Executive. Following committees have been constituted to work under the guidance of the Board:
The company adheres to the best ethical standards in the conduct of business. Accordingly, Code of Conduct of the company has been approved by the Board of Directors and placed on the website of the company.
Code of Conduct:
decision are made through consensus. Where directors have vested interest in any matter of the company this disclosed and notified accordingly. Minutes of the meetings are recorded on each item of the agenda with c o m m e n t s f r o m e a c h participating directors and circulated to them well within required time period for this purpose.
Details of the related party transaction are placed before the audit committee and upon its recommendation these are approved by the board.
R e v i e w o f r e l a t e d p a r t y transactions:
-
-
Internal Audit Committee; and
H u m a n R e s o u r c e a n d Remuneration Committee.
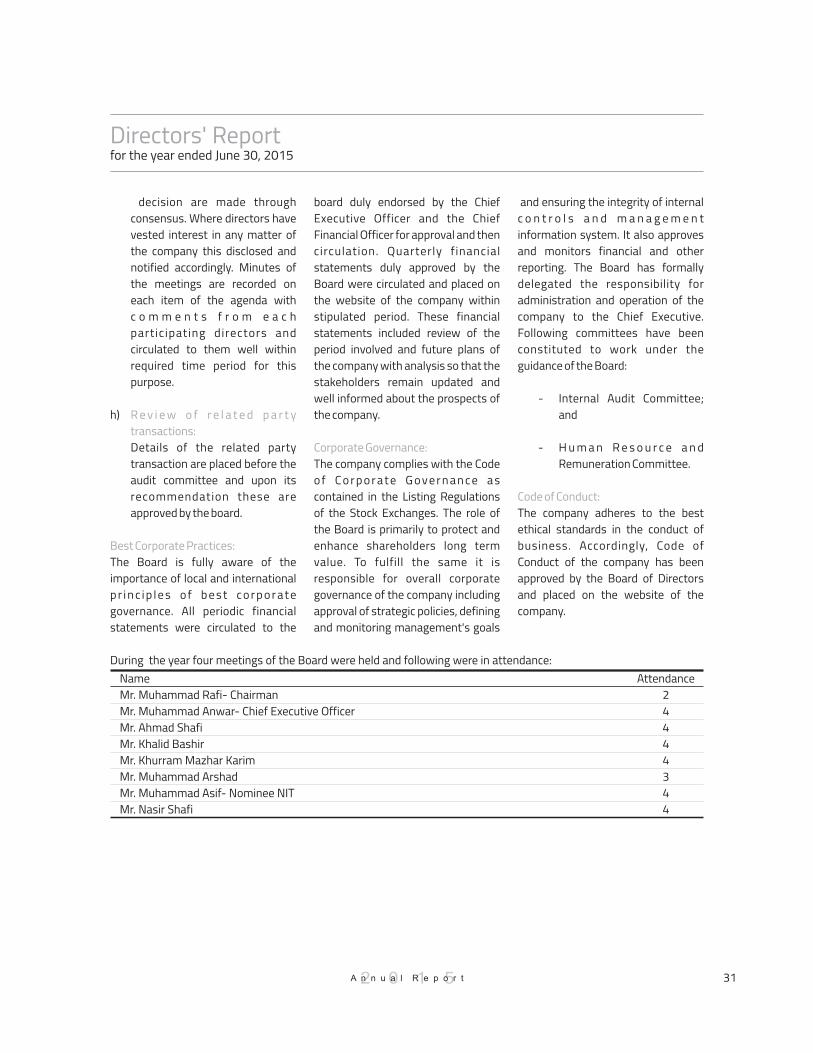
NameMr. Muhammad Rafi- ChairmanMr. Muhammad Anwar- Chief Executive OfficerMr. Ahmad ShafiMr. Khalid BashirMr. Khurram Mazhar KarimMr. Muhammad ArshadMr. Muhammad Asif- Nominee NITMr. Nasir Shafi
Attendance2444434 4
During the year four meetings of the Board were held and following were in attendance:
2 0 1 5A n n u a l R e p o r t 31

Directors' Reportfor the year ended June 30, 2015
2 0 1 5A n n u a l R e p o r t
every quarter to review interim and annual financial statements of the company, business plans and internal audit reports prior to the approval of the Board. The committee comprises of three non executive members including the Chairman. It also recommends to the Board for
appointment of external auditors and advises on establishment and maintenance of framework of internal control and ethical standards for the management of the company. During the year five meetings of the committee were held and following were in attendance:
Leave of absence was granted to the directors who could not attend the Board meetings.
The committee meets at least once in
Audit Committee:
Terms of reference:
Mr. Khalid Bashir- Non executive director (Chairman) Mr. Khurram Mazhar Karim- Non executive directorMr. Nasir Shafi- Non executive director
545
Directors' statement:
Directors of the company are pleased to state that:
Human Resource and Remuneration (HR&R) Committee:
Terms of reference:
Training of the Board:
The Committee comprises of three members and two of them are non executive members including the Chairman. It reviews HR related matters of company and during the year one meeting of committee was held and all the members were present in the said meeting.
As per requirements of the regulatory framework all the directors fulfill the criterion as per the Code of Corporate Governance and are well conversant to their responsibilities due to their standing as Board member of the c o m p a n y a n d a l s o o f o t h e r companies. One of the directors has already completed training course as per requirement of the code from the recognized body for this purpose.
a.
b.
c.
d.
F i n a n c i a l s t a t e m e n t s prepared by company's management present fairly its state of affairs, results of its operations, cash flows and changes in equity;
Proper books of accounts have been maintained;
Appropriate accounting p o l i c i e s h a v e b e e n consistently appl ied in preparation of financial statements and accounting estimates are based on reasonable and prudent judgment;
I n t e r n a t i o n a l F i n a n c i a l Reporting Standards, as applicable in Pakistan, have been followed in preparation of financial statements and
e.
f.
g.
h.
i.
any departure there from has been adequately disclosed;
System of internal control is sound in design and has been effectively implemented and monitored;
The company has sound potentials to continue as going concern;
There has been no material d e p a r t u r e f r o m b e s t p r a c t i ce s o f co r p o r a t e governance;
I n f o r m a t i o n a b o u t outstanding taxes and levies is given in Notes to Accounts; and
Statement of value of investments in respect of employees' retirement plan has been given in Note 42 of the financial statements.
32

2 0 1 5A n n u a l R e p o r t 33
Directors' Reportfor the year ended June 30, 2015
Related party transactions:
Post balance Sheet Events:
Observation of external auditors:
Transactions undertaken with related parties during the financial year have been ratified by the Audit Committee and approved by the Board.
There was no significant balance sheet event which needs mention in Directors' Report.
The auditors have qualified their opinion with respect to equity method of adjustment Rs.27.070 million accounted for in the carrying amount of investment in t h e a s s o c i a t e d c o m p a n y, Crescent Bahuman Limited (CBL) made on the basis of unaudited financial statements for the year e n d e d J u n e 3 0 , 2 0 1 5 . A s explained in note 15 of these financial statements, the audited financial statements of Crescent Bahuman Limited were not
available and were still under audit at the time of authorization for issue. However, we do not a n t i c i p a t e a n y m a t e r i a l adjustment arising out of that matter.
A statement showing the pattern of shareholding of the company as at June 30,2015 is included in these financial statements. Company's shares are listed on all the Stock Exchanges of Pakistan. Company has a free float of 46.93% shares and remaining are closely held by the sponsors, investment / banking companies, insurance companies and other corporate bodies.
The auditors Messrs Riaz Ahmad & Co., Chartered Accountants, retire and offer themselves for re-appointment for the year 2016.
Pattern of shareholding:
Auditors:
Key operating financial highlights:
Acknowledgements:
Financial data of the last six years is attached.
On behalf of the Board I would like t o p l a c e o n r e c o r d t h e appreciation of efforts of our management, core business team and the employees which have been demonstrated in achieving these results of the company. For the performance we exhibited in FY15 we also owe this to the commitment of our vendors, customers and bankers who reposed their confidence and continued their support despite very odd internal and external business circumstances. It has been and always remains our enduring commitment to all s takeholders to de l iver a relentless performance in line with our past glory and without compromising to our reputation of good governance.
For and on behalf of the Board of Directors
(Muhammad Anwar)Chief Executive Officer

Key Operating and Financial Data
Summary of Profit and Loss Account
Summary of Balance Sheet
Summary of Cash Flow Statement
SalesGross profitProfit from operationsShare of profit / (loss) from associateProfit / (loss) before taxation Profit / (loss) after taxation
Property, plant and equipmentStock in tradeTrade debtsCurrent assetsNon-Current assets held for saleTotal assets
Shareholders equitySurplus on revaluation of operating fixed assetsLong term financingTrade and other payablesShort term borrowingsCurrent liabilitiesTotal equity and liabilities
Cash and cash equivalents at the beginning of the yearNet cash from / (used in) operating activitiesNet cash (used in) / from investing activitiesNet cash from / (used in) financing activitiesNet increase / (decrease) in Cash and cash equivalentsCash and cash equivalents at the end of the year
(Rupees in million)
11,835 1,513
761 27
360 222
4,140 1,338 2,567
5,343 84
12,455
3,450 2,291
111 1,191 5,079
6,571 12,455
7
104 (223)
117
(2)
5
2015 201020112012
10,863 1,457
910 120 463 345
3,981 1,047 2,580 4,203
10,989
2,672 1,640
656 521
4,840 6,011
10,989
19
453 (56)
(400)
(3)
16
14,759 1,365
659 (145)
(13) (113)
4,035 1,658 3,392 5,827
12,616
2,513 1,640
567 1,319 5,936 7,896
12,616
16
(601)(302)
905
2
19
12,729 1,514
866 (123)
(18) (117)
3,905 1,550 4,173
6,615
13,213
2,442 1,640
499 2,501 5,598
8,632 13,213
19
599 (104)(489)
6
25
2013
13,262 1,488
802 29
247 112
4,468 1,541 2,476 5,104
12,543
2,826 2,291
287 1,070 5,568 7,139
12,543
25
379 (110)(288)
(19)
6
2014
12,411 1,375
863 (48) 343 239
4,176 1,490 2,248 4,944
11,983
3,078 2,291
123 1,026 5,082 6,491
11,983
6
434 274
(707)
1
7
34 2 0 1 5A n n u a l R e p o r t
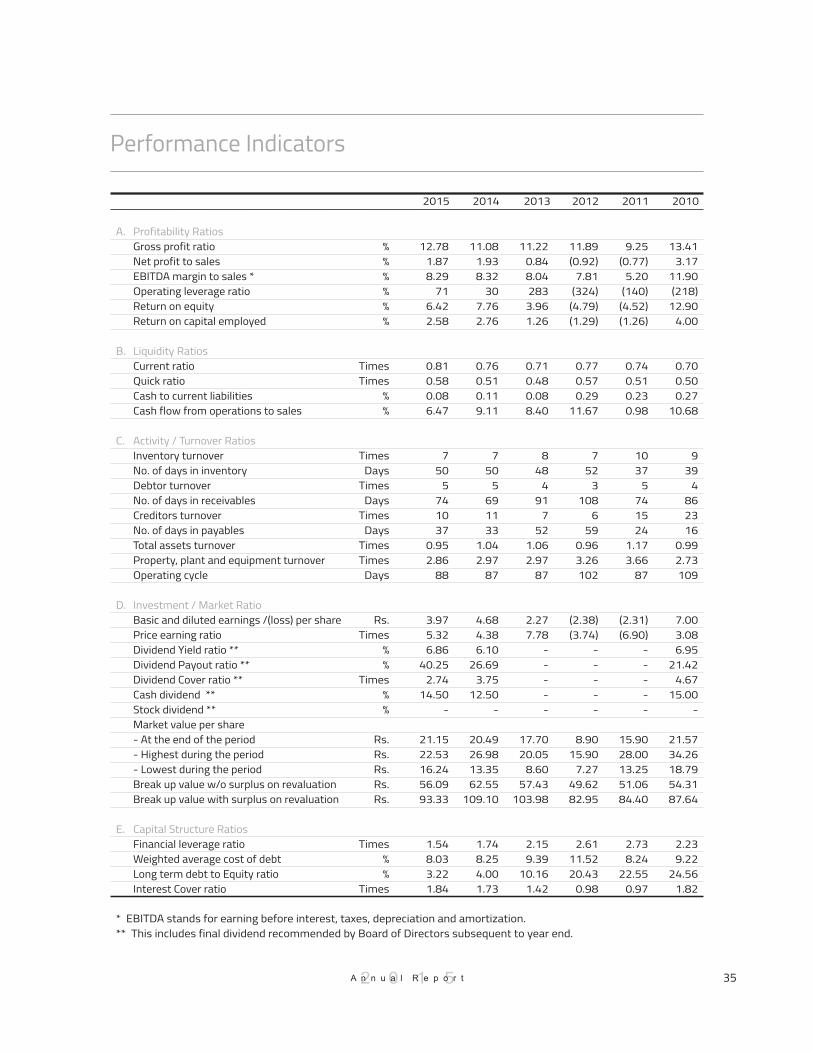
Performance Indicators
A.
B.
C.
D.
E.
2010
13.41 3.17
11.90 (218)
12.90 4.00
0.70 0.50 0.27
10.68
9 39
4 86 23 16
0.99 2.73 109
7.00 3.08 6.95
21.42 4.67
15.00 -
21.57 34.26 18.79 54.31 87.64
2.23 9.22
24.56 1.82
9.25 (0.77)
5.20 (140) (4.52) (1.26)
0.74 0.51 0.23 0.98
10 37
5 74 15 24
1.17 3.66
87
(2.31) (6.90)
- - - - -
15.90 28.00 13.25 51.06 84.40
2.73 8.24
22.55 0.97
2011
11.89 (0.92)
7.81 (324) (4.79) (1.29)
0.77 0.57 0.29
11.67
7 52
3 108
6 59
0.96 3.26 102
(2.38) (3.74)
- - - - -
8.90 15.90
7.27 49.62 82.95
2.61 11.52 20.43
0.98
2012
11.22 0.84 8.04 283 3.96 1.26
0.71 0.48 0.08 8.40
8 48
4 91
7 52
1.06 2.97
87
2.27 7.78
- - - - -
17.70 20.05
8.60 57.43
103.98
2.15 9.39
10.16 1.42
2013
12.78 1.87 8.29
71 6.42 2.58
0.81 0.58 0.08 6.47
7 50
5 74 10 37
0.95 2.86
88
3.97 5.32 6.86
40.25 2.74
14.50 -
21.15 22.53 16.24 56.09 93.33
1.54 8.03 3.22 1.84
2015
11.08 1.93 8.32
30 7.76 2.76
0.76 0.51 0.11 9.11
7 50
5 69 11 33
1.04 2.97
87
4.68 4.38 6.10
26.69 3.75
12.50 -
20.49 26.98 13.35 62.55
109.10
1.74 8.25 4.00 1.73
2014
%%%%%%
TimesTimes
%%
TimesDays
TimesDays
TimesDays
TimesTimes
Days
Rs.Times
%%
Times%%
Rs.Rs.Rs.Rs.Rs.
Times%%
Times
* EBITDA stands for earning before interest, taxes, depreciation and amortization.** This includes final dividend recommended by Board of Directors subsequent to year end.
352 0 1 5A n n u a l R e p o r t
Profitability Ratios
Liquidity Ratios
Activity / Turnover Ratios
Investment / Market Ratio
Capital Structure Ratios
Gross profit ratioNet profit to salesEBITDA margin to sales *Operating leverage ratioReturn on equityReturn on capital employed
Current ratioQuick ratioCash to current liabilities Cash flow from operations to sales
Inventory turnoverNo. of days in inventoryDebtor turnoverNo. of days in receivablesCreditors turnoverNo. of days in payablesTotal assets turnoverProperty, plant and equipment turnoverOperating cycle
Basic and diluted earnings /(loss) per sharePrice earning ratioDividend Yield ratio **Dividend Payout ratio **Dividend Cover ratio **Cash dividend **Stock dividend **Market value per share - At the end of the period- Highest during the period- Lowest during the periodBreak up value w/o surplus on revaluationBreak up value with surplus on revaluation
Financial leverage ratioWeighted average cost of debtLong term debt to Equity ratioInterest Cover ratio

Vertical Analysis
Balance Sheet (Rs. in million)
Total assets
Total equity and liabilities
Profit and Loss Account (Rs. in million)
Property, plant and equipmentIntangible assetsInvestment in associateLong term investmentsLong term loans and advancesLong term deposits and prepayments Deferred income tax assetStores, spare parts and loose toolsStock in tradeTrade debtsLoans and advancesShort term deposits and prepaymentsAccrued interestOther receivablesShort term investmentsCash & bank balancesNon-Current assets held for sale
Issued, subscribed and paid up share capitalReservesShareholders’ equitySurplus on revaluation of operating fixed assetsLong term financingLiabilities against assets subject to finance leaseDeferred liabilityTrade and other payablesAccrued mark-up Short term borrowingsCurrent portion of non-current liabilitiesProvision for taxation
SalesCost of salesGross profitDistribution costAdministrative expensesOther expensesOther incomeProfit from operationsFinance costShare of profit / (loss) from associateProfit / (loss) before taxationTaxationProfit / (loss) after taxation
For the last six financial years 2015
4,140 -
338 2,541
4 5 -
177 1,338 2,567
418 23
5 744
66 5
84
615 2,835 3,450
2,291 100
11 32
1,191 85
5,079 112 104
11,835 10,322
1,513 648 234
63 193 761 429
27 360 138 222
12,455
12,455
33.2 -
2.7 20.4
0.0 0.0
- 1.4
10.7 20.6
3.4 0.2 0.0 6.0 0.5 0.0 0.7
4.9 22.8 27.7 18.4
0.8 0.1 0.3 9.6 0.7
40.8 0.9 0.8
100.0 87.2 12.8
5.5 2.0 0.5 1.6 6.4 3.6 0.2 3.0 1.2 1.9
100
100
2012 2011 2010 %%%
3,905 4
329 2,287
3 7
63 152
1,550 4,173
267 41
4 353
50 25
492 1,950 2,442 1,640
401 98
- 2,501
145 5,598
267 121
12,729 11,215
1,514 629 200
13 194 866 761
(123) (18)
99 (117)
13,213
13,213
4,035 -
452 2,255
3 3
42 160
1,658 3,392
309 67
3 182
37 19
492 2,021 2,513 1,640
512 55
- 1,319
141 5,936
350 151
14,759 13,395
1,365 641 203
41 179 659 527
(145) (13) 100
(113)
12,616
12,616
3,981 -
618 255
1,929 3 -
170 1,047 2,580
225 6 -
109 50 16
492 2,180 2,672 1,640
656 - 9
521 107
4,840 452
91
10,863 9,407 1,457
470 182
79 185 910 567 120 463 119 345
10,989
10,989
36.2 -
5.6 2.3
17.6 0.0
- 1.5 9.5
23.5 2.0 0.1
- 1.0 0.5 0.1
4.5 19.8 24.3 14.9
6.0 -
0.1 4.7 1.0
44.0 4.1 0.8
100.0 86.6 13.4
4.3 1.7 0.7 1.7 8.4 5.2 1.1 4.3 1.1 3.2
100
100
32.0 -
3.6 17.9
0.0 0.0 0.3 1.3
13.1 26.9
2.4 0.5 0.0 1.4 0.3 0.1
3.9 16.0 19.9 13.0
4.1 0.4
- 10.5
1.1 47.0
2.8 1.2
100.0 90.8
9.2 4.3 1.4 0.3 1.2 4.5 3.6
(1.0) (0.1)
0.7 (0.8)
100
100
29.6 0.0 2.5
17.3 0.0 0.1 0.5 1.2
11.7 31.6
2.0 0.3 0.0 2.7 0.4 0.2
3.7 14.8 18.5
12.4 3.0 0.7
- 18.9
1.1 42.4
2.0 0.9
100.0 88.1 11.9
4.9 1.6 0.1 1.5 6.8 6.0
(1.0) (0.1)
0.8 (0.9)
100
100
2013 %
4,468 2
358 2,553
4 7
47 124
1,541 2,476
305 25
5 566
56 6
492 2,334 2,826
2,291 210
77 -
1,070 161
5,568 221 119
13,262 11,774
1,488 686 187
19 206 802 584
29 247 135 112
12,543
12,543
35.6 0.0 2.9
20.4 0.0 0.1 0.4 1.0
12.3 19.7
2.4 0.2 0.0 4.5 0.4 0.0
3.9 18.6 22.5 18.3
1.7 0.6
- 8.5 1.3
44.4 1.8 0.9
100.0 88.8 11.2 5.2 1.4 0.1 1.6 6.0 4.4 0.2 1.9 1.0 0.8
100
100
2014 %
4,176 -
311 2,540
3 7 2
157 1,490 2,248
364 21
4 571
82 7
492 2,586 3,078
2,291 79 44
- 1,026
97 5,082
164 122
12,411 11,036
1,375 611 195
67 361 863 472 (48) 343 104 239
11,983
11,983
34.8 -
2.6 21.2
0.0 0.1 0.0 1.3
12.4 18.8
3.0 0.2 0.0 4.8 0.7 0.1
4.1 21.6 25.7 19.1
0.7 0.4
- 8.6 0.8
42.4 1.4 1.0
100.0 88.9 11.1
4.9 1.6 0.5 2.9 7.0 3.8
(0.4) 2.8 0.8 1.9
100
100
%
36 2 0 1 5A n n u a l R e p o r t

Horizontal Analysis
Balance Sheet (Rs. in million)
Total assets
Total equity and liabilities
Profit and Loss Account (Rs. in million)
Property, plant and equipmentIntangible assetsInvestment in associateLong term investmentsLong term loans and advancesLong term deposits and prepayments Deferred income tax assetStores, spare parts and loose toolsStock in tradeTrade debtsLoans and advancesShort term deposits and prepaymentsAccrued interestOther receivablesShort term investmentsCash & bank balancesNon-Current assets held for sale
Issued, subscribed and paid up share capitalReservesShareholders’ equitySurplus on revaluation of operating fixed assetsLong term financingLiabilities against assets subject to finance leaseDeferred liabilityTrade and other payablesAccrued mark-up Short term borrowingsCurrent portion of non-current liabilitiesProvision for taxation
SalesCost of salesGross profitDistribution costAdministrative expensesOther expensesOther incomeProfit from operationsFinance costShare of profit / (loss) from associateProfit / (loss) before taxationTaxationProfit / (loss) after taxation
For the last six financial years 2015 % 2014
4,176 -
311 2,540
3 7 2
157 1,490 2,248
364 21
4 571
82 7
492 2,586 3,078 2,291
79 44
- 1,026
97 5,082
164 122
12,411 11,036
1,375 611 195
67 361 863 472 (48) 343 104 239
11,983
11,983
(6.5) (100.0)
(13.1) (0.5)
(25.0) -
(95.7) 26.6 (3.3) (9.2) 19.3
(16.0) (20.0)
0.9 46.4 16.7
- 10.8
8.9 -
(62.4) (42.9)
(4.1) (39.8)
(8.7) (25.8)
2.5
(6.4) (6.3) (7.6)
(10.9) 4.3
252.6 75.2
7.6 (19.2)
(265.5) 39
(23.0) 113.5
(4.5)
(4.5)
% 2012 2011
3,905 4
329 2,287
3 7
63 152
1,550 4,173
267 41
4 353
50 25
492 1,950 2,442 1,640
401 98
- 2,501
145 5,598
267 121
12,729 11,215
1,514 629 200
13 194 866 761
(123) (18)
99 (117)
13,213
13,213
(3.2) 100.0 (27.1)
1.4 10.0
177.8 48.8 (5.1) (6.5) 23.0
(13.6) (38.9)
42.6 94.1 33.5 34.9
- (3.5) (2.8) (0.0)
(21.7) 79.4
89.7 3.0
(5.7) (23.8) (19.9)
(13.8) (16.3)
10.9 (1.9) (1.4)
(68.2) 8.4
31.5 44.4
(15.2) 33.7 (1.0)
3.1
4.7
4.7
4,035 -
452 2,255
3 3
42 160
1,658 3,392
309 67
3 182
37 19
492 2,021 2,513 1,640
512 55
- 1,319
141 5,936
350 151
14,759 13,395
1,365 641 203
41 179 659 527
(145) (13) 100
(113)
12,616
12,616
1.4 -
(26.9) 783.8 (99.9) (10.9) 100.0
(5.7) 58.3 31.5 37.6
1,027 100.0
66.2 (24.7)
12.9
- (7.3) (6.0) (0.0)
(22.0) 100.0
(100.0) 152.9
31.9 22.6
(22.4) 66.2
35.9 42.4 (6.3) 36.3 11.5
(48.1) (3.1)
(27.6) (7.0)
(220.8) (102.9)
(15.8) (132.9)
14.8
14.8
3,981 -
618 255
1,929 3 -
170 1,047 2,580
225 6 -
109 50 16
492 2,180 2,672 1,640
656 - 9
521 107
4,840 452
91
10,863 9,407 1,457
470 182
79 185 910 567 120 463 119 345
10,989
10,989
(4.8) -
27.3 12.0
6.4 27.5
(100.0) (2.5) 11.3
0.7 (6.1)
318.8 (100.0)
76.8 (23.8) (13.3)
- 23.2 18.2
0.0 (40.8)
- 100.0
65.5 (39.8)
(0.9) 26.6 23.9
1.0 2.5
(7.5) 19.7
8.1 (79.1) (26.5)
2.4 (30.5) (27.4)
94.3 99.7 92.5
1.6
1.6
2013
4,468 2
358 2,553
4 7
47 124
1,541 2,476
305 25
5 566
56 6
492 2,334 2,826 2,291
210 77
- 1,070
161 5,568
221 119
13,262 11,774
1,488 686 187
19 206 802 584
29 247 135 112
12,543
12,543
14.4 (50.0)
8.8 11.6 33.3
- (25.4) (18.4)
(0.6) (40.7)
14.2 (39.0)
25 60.3 12.0
(76.0)
- 19.7 15.7 39.7
(47.6) (21.4)
(57.2) 11.0 (0.5)
(17.2) (1.7)
4.2 5.0
(1.7) 9.1
(6.5) 46.2
6.2 (7.4)
(23.3) (123.6) (1,472)
36.4 (195.7)
(5.1)
(5.1)
% % % 2010 %
4,140 -
338 2,541
4 5 -
177 1,338 2,567
418 23
5 744
66 5
84
615 2,835 3,450 2,291
100 11 32
1,191 85
5,079 112 104
11,835 10,322
1,513 648 234
63 193 761 429
27 360 138 222
12,455
12,455
(0.9)
8.7 0.0
33.3 (28.6) (100) 12.7
(10.2) 14.2 14.8
9.5 25.0 30.3
(19.5) (28.6)
100
25.0 9.6
12.1 -
26.6 (75.0)
100 16.1
(12.4) (0.1)
(31.7) (14.8)
(4.6) (6.5) 10.0
6.1 20.0 (6.0)
(46.5) (11.8)
(9.2) (156.3)
5 32.7 (7.3)
3.9
3.9
372 0 1 5A n n u a l R e p o r t

Statement of Compliancewith Best Practices of Code of Corporate Governance
This statement is being presented to comply with the Code of Corporate Governance contained in Listing Regulations of Karachi, Lahore and Islamabad Stock Exchanges for the purpose of establishing a framework of good governance, whereby a listed company is managed in compliance with the best Practices of Corporate Governance.
Company has applied the principles contained in the CCG in the following manner:
1 Company encourages representation of independent non-executive Directors and directors representing minority interests on its Board of Directors. Since there was no contestant for independent director so shareholders didn't elect. At present Board includes:
CategoryExecutive Directors
Non-Executive Directors
NameMr. Ahmad ShafiMr. Muhammad AnwarMr. Khalid BashirMr. Khurram Mazhar KarimMr. Muhammad ArshadMr. Muhammad AsifMr. Muhammad RafiMr. Nasir Shafi
2
3
4
5
6
7
8
Directors have confirmed that none of them is serving as a Director in more than seven listed companies, including this company (excluding the listed subsidiaries of listed holding companies where applicable).
All resident Directors of company are registered as taxpayers and none of them has defaulted in payment of any loan to a banking company, a DFI or an NBFI or, being a member of a stock exchange, has been declared as a defaulter by that stock exchange.
No casual vacancy has occurred in the Board during the year.
Company has prepared a 'Code of Conduct' and has ensured that appropriate steps have been taken to disseminate it throughout the company along with its supporting policies and procedures.
Board has developed a vision/mission statement, overall corporate strategy and significant policies of the company. A complete record of particulars of significant policies along with dates on which they were approved or amended has been maintained.
All the powers of the Board have been duly exercised and decisions on material transactions, including appointment and determination of remuneration and terms and conditions of employment of the CEO and have been taken by the board / shareholders.
Meetings of the Board were presided over by the Chairman and the Board meets at least once in every quarter. Written notices of the Board meetings, along with agenda and working papers, were circulated at least seven days before the meetings. The minutes of the meetings were appropriately recorded and circulated.
38 2 0 1 5A n n u a l R e p o r t

9
10
11
12
13
14
15
16
17
18
19
20
21
The Board of Director of the company arranged appropriate training programs for its Directors during the year.
Board has approved the terms of appointment and remuneration including terms and conditions of employment of Chief Financial Officer (CFO), Corporate Secretary and Head of Internal Audit.
Directors' report for this year has been prepared in compliance with the requirements of the CCG and fully describes the salient matters required to be disclosed.
Financial Statements of the company were duly endorsed by CEO and CFO before approval by the Board.
Directors, CEO and Executives do not hold any interest in the shares of the company other than that disclosed in the pattern of shareholding.
Company has complied with all corporate and financial reporting requirements of the CCG.
Board has formed an Audit Committee. It comprises three members, all of them are non-executive Directors including Chairman of the Committee.
Meetings of the audit committee were held at least once in every quarter prior to approval of interim and final results of company and as required by the CCG. The terms of reference of the Committee have been formed and advised to the Committee for compliance.
Board has formed a Human Resource and Remuneration Committee. It comprises three members and two of them are non-executive Directors including the Chairman of the Committee.
Board has set-up an effective internal audit function manned by suitably qualified and experienced personnel who are conversant with policies and procedures of the company.
Statutory auditors of the company have confirmed that they have been given a satisfactory rating under the Quality Control Review program of the ICAP, that they or any of the partners of the firm, their spouses and minor children do not hold shares of the company and that the firm and all its partners are in compliance with International Federation of Accountants (IFAC) guidelines on code of ethics as adopted by the ICAP.
Statutory auditors or the persons associated with them have not been appointed to provide other services except in accordance with the listing regulations and the auditors have confirmed that they have observed IFAC guidelines in this regard.
The 'closed period', prior to the announcement of interim/final results, and business decisions, which may materially affect the market price of company's securities, was determined and intimated to directors, employees and stock exchanges.
Statement of Compliancewith Best Practices of Code of Corporate Governance
392 0 1 5A n n u a l R e p o r t

22
23
Material/price sensitive information has been disseminated among all market participants at once through stock exchanges.
We confirm that all other material principles contained in CCG have been complied with.
(Muhammad Anwar)Chief Executive Officer
On behalf of the Board
Statement of Compliancewith Best Practices of Code of Corporate Governance
40 2 0 1 5A n n u a l R e p o r t

RIAZ AHMAD & COMPANYChartered Accountants
Name of engagement partner:Mubashar MehmoodDate: October 03, 2015Faisalabad
Review Report to the Members on Statement of Compliancewith the Code of Corporate Governance
We have reviewed the enclosed Statement of Compliance with the best practices contained in the Code of Corporate Governance (the Code) prepared by the Board of Directors of THE CRESCENT TEXTILE MILLS LIMITED ("the Company") for the year ended 30 June 2015 to comply with the requirements of Listing Regulations of the respective Stock Exchanges where the Company is listed.
The responsibility for compliance with the Code is that of the Board of Directors of the Company. Our responsibility is to review, to the extent where such compliance can be objectively verified, whether the Statement of Compliance reflects the status of the Company's compliance with the provisions of the Code and report if it does not and to highlight any non-compliance with the requirements of the Code. A review is limited primarily to inquiries of the Company's personnel and review of various documents prepared by the Company to comply with the Code.
As a part of our audit of financial statements we are required to obtain an understanding of the accounting and internal control systems sufficient to plan the audit and develop an effective audit approach. We are not required to consider whether the Board of Directors' statement on internal control covers all risks and controls or to form an opinion on the effectiveness of such internal controls, the Company's corporate governance procedures and risks.
The Code requires the Company to place before the Audit Committee, and upon recommendation of the Audit Committee, place before the Board of Directors for their review and approval its related party transactions distinguishing between transactions carried out on terms equivalent to those that prevail in arm's length transactions and transactions which are not executed at arm's length price and recording proper justification for using such alternate pricing mechanism. We are only required and have ensured compliance of this requirement to the extent of the approval of the related party transactions by the Board of Directors upon recommendation of the Audit Committee. We have not carried out any procedures to determine whether the related party transactions were undertaken at arm's length price or not.
Based on our review, nothing has come to our attention which causes us to believe that the Statement of Compliance does not appropriately reflect the Company's compliance, in all material respects, with the best practices contained in the Code as applicable to the Company for the year ended 30 June 2015.
As stated in paragraph no. 1 of the Statement of Compliance, there is no independent director on the Board of Directors of the Company which is required by clause (i) (b) of the Code.
412 0 1 5A n n u a l R e p o r t

Auditors' Report to the Members
We have audited the annexed balance sheet of THE CRESCENT TEXTILE MILLS LIMITED ("the Company") as at 30 June 2015 and the related profit and loss account, statement of comprehensive income, cash flow statement and statement of changes in equity together with the notes forming part thereof, for the year then ended and we state that we have obtained all the information and explanations which, to the best of our knowledge and belief, were necessary for the purposes of our audit.
It is the responsibility of the Company's management to establish and maintain a system of internal control, and prepare and present the above said statements in conformity with the approved accounting standards and the requirements of the Companies Ordinance, 1984. Our responsibility is to express an opinion on these statements based on our audit.
We conducted our audit in accordance with the auditing standards as applicable in Pakistan. These standards require that we plan and perform the audit to obtain reasonable assurance about whether the above said statements are free of any material misstatement. An audit includes examining, on a test basis, evidence supporting the amounts and disclosures in the above said statements. An audit also includes assessing the accounting policies and significant estimates made by management, as well as, evaluating the overall presentation of the above said statements. We believe that our audit provides a reasonable basis for our opinion and, after due verification, we report that:
(a) as disclosed in Note 15 to the financial statements, the equity method adjustment of Rupees 27.070 million in the carrying amount of investment in the associate, Crescent Bahuman Limited has been made on the basis ofits un-audited financial statements for the year ended 30 June 2015;
Except for the effect of adjustments, if any, that might have been determined to be necessary, had the auditedfinancial statements of the associate been available, we report that:
(b) in our opinion, proper books of account have been kept by the Company as required by the Companies Ordinance,1984;
(c) in our opinion:
i) the balance sheet and profit and loss account together with the notes thereon have been drawn up in conformitywith the Companies Ordinance, 1984, and are in agreement with the books of account and are further inaccordance with accounting policies consistently applied;
ii) the expenditure incurred during the year was for the purpose of the Company's business; and
iii) the business conducted, investments made and the expenditure incurred during the year were in accordancewith the objects of the Company;
42 2 0 1 5A n n u a l R e p o r t
Auditors' Report to the Members
(d) in our opinion and to the best of our information and according to the explanations given to us, the balance sheet,profit and loss account, statement of comprehensive income, cash flow statement and statement of changes inequity together with the notes forming part thereof conform with approved accounting standards as applicablein Pakistan, and, give the information required by the Companies Ordinance, 1984, in the manner so requiredand respectively give a true and fair view of the state of the Company's affairs as at 30 June 2015 and of theprofit, its comprehensive income, its cash flows and changes in equity for the year then ended; and
(e) in our opinion, Zakat deductible at source under the Zakat and Ushr Ordinance, 1980 (XVIII of 1980), wasdeducted by the Company and deposited in the Central Zakat Fund established under Section 7 of thatOrdinance.
RIAZ AHMAD & COMPANYChartered Accountants
Name of engagement partner:Mubashar MehmoodDate: October 03, 2015Faisalabad
432 0 1 5A n n u a l R e p o r t
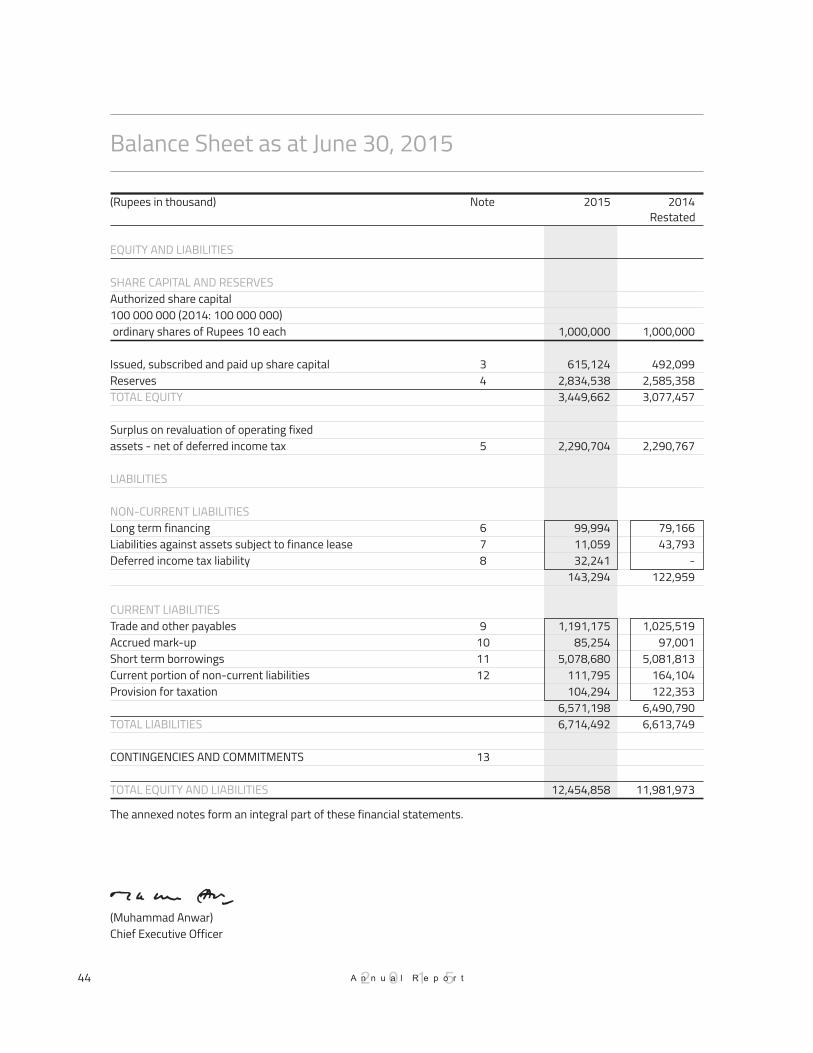
Balance Sheet as at June 30, 2015
2015 2014Note(Rupees in thousand)
(Muhammad Anwar)Chief Executive Officer
44
EQUITY AND LIABILITIES
SHARE CAPITAL AND RESERVES
TOTAL EQUITY
LIABILITIES
NON-CURRENT LIABILITIES
CURRENT LIABILITIES
TOTAL LIABILITIES
TOTAL EQUITY AND LIABILITIES
Authorized share capital100 000 000 (2014: 100 000 000) ordinary shares of Rupees 10 each
Issued, subscribed and paid up share capitalReserves
Surplus on revaluation of operating fixedassets - net of deferred income tax
Long term financingLiabilities against assets subject to finance leaseDeferred income tax liability
Trade and other payablesAccrued mark-up Short term borrowingsCurrent portion of non-current liabilitiesProvision for taxation
CONTINGENCIES AND COMMITMENTS
1,000,000
492,099 2,585,358 3,077,457
2,290,767
79,166 43,793
- 122,959
1,025,519 97,001
5,081,813 164,104 122,353
6,490,790 6,613,749
11,981,973
1,000,000
615,124 2,834,538 3,449,662
2,290,704
99,994 11,059 32,241
143,294
1,191,175 85,254
5,078,680 111,795 104,294
6,571,198 6,714,492
12,454,858
34
5
678
9101112
13
The annexed notes form an integral part of these financial statements.
2 0 1 5A n n u a l R e p o r t
Restated
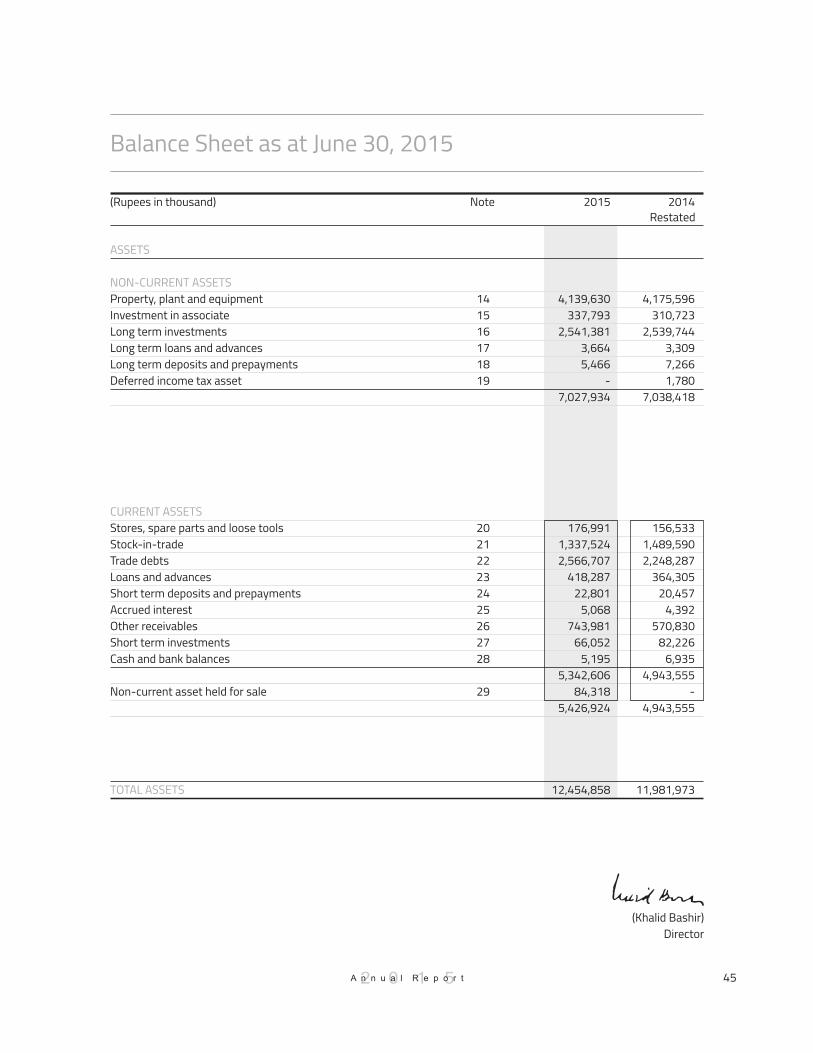
Balance Sheet as at June 30, 2015
45
(Khalid Bashir)Director
ASSETS
NON-CURRENT ASSETS
CURRENT ASSETS
TOTAL ASSETS
Property, plant and equipmentInvestment in associateLong term investmentsLong term loans and advancesLong term deposits and prepayments Deferred income tax asset
Stores, spare parts and loose toolsStock-in-tradeTrade debtsLoans and advancesShort term deposits and prepaymentsAccrued interestOther receivablesShort term investmentsCash and bank balances
Non-current asset held for sale
4,175,596 310,723
2,539,744 3,309 7,266 1,780
7,038,418
156,533 1,489,590 2,248,287
364,305 20,457
4,392 570,830
82,226 6,935
4,943,555 -
4,943,555
11,981,973
4,139,630 337,793
2,541,381 3,664 5,466
- 7,027,934
176,991 1,337,524 2,566,707
418,287 22,801
5,068 743,981
66,052 5,195
5,342,606 84,318
5,426,924
12,454,858
141516171819
20 21 22 23 24 25 26 27 28
29
2 0 1 5A n n u a l R e p o r t
2015 2014Note(Rupees in thousand)Restated

Profit and Loss Accountfor the Year Ended June 30, 2015
(Muhammad Anwar)Chief Executive Officer
46
(Khalid Bashir)Director
SalesCost of salesGross profit
Distribution costAdministrative expensesOther expenses
Other incomeProfit from operations
Finance costShare of profit / (loss) from associateProfit before taxation
TaxationProfit after taxation
Earnings per share - basic and diluted (rupees)
12,411,497 (11,036,060)
1,375,437
(610,760) (195,553)
(66,587) (872,900)
502,537
360,727 863,264
(472,319) (47,521) 343,424
(104,405) 239,019
4.68
11,834,775 (10,321,726)
1,513,049
(648,384) (233,786)
(62,825) (944,995)
568,054
193,312 761,366
(428,514) 27,070
359,922
(138,228) 221,694
3.97
3031
323334
35
36
37
38
The annexed notes form an integral part of these financial statements.
2 0 1 5A n n u a l R e p o r t
2015 2014Note(Rupees in thousand)Restated

2015 2014(Rupees in thousand)
Statement of Comprehensive Incomefor the Year Ended June 30, 2015
(Muhammad Anwar)Chief Executive Officer
47
(Khalid Bashir)Director
Profit after taxation
Other comprehensive income
Items that will not be reclassified subsequently to profit or loss
Items that may be reclassified subsequently to profit or loss:
Surplus arising on remeasurement of available for saleinvestments to fair value
Other comprehensive income for the year
Total comprehensive income for the year
239,019
-
12,706
12,706
251,725
221,694
-
27,461
27,461
249,155
The annexed notes form an integral part of these financial statements.
2 0 1 5A n n u a l R e p o r t
Restated

Cash Flow Statementfor the Year Ended June 30, 2015
CASH FLOWS FROM OPERATING ACTIVITIES
CASH FLOWS FROM INVESTING ACTIVITIES
CASH FLOWS FROM FINANCING ACTIVITIES
Cash generated from operationsFinance cost paid Income tax paidDividend paid Workers' profit participation fund paidNet (increase) / decrease in long term loans and advancesNet decrease / (increase) in long term deposits and prepaymentsNet cash generated from operating activities
Capital expenditure on property, plant and equipmentProceeds from sale of property, plant and equipmentDividend receivedNet cash (used in) / from investing activities
Proceeds from issuance of right sharesProceeds from long term financingRepayment of long term financingRepayment of liabilities against assets subject to finance leaseShort term borrowings - netNet cash from / (used in) financing activities
Net (decrease) / increase in cash and cash equivalents
Cash and cash equivalents at the beginning of the year
Cash and cash equivalents at the end of the year (note 28)
2015 2014
1,131,125 (535,830) (150,252)
(1) (11,557)
652 (160)
433,977
(76,508) 325,446
25,019 273,957
- -
(191,299) (29,907)
(485,949) (707,155)
779
6,156
6,935
766,007 (439,469) (155,610)
(58,937) (9,695)
(355) 1,800
103,741
(247,464) 12,160 12,634
(222,670)
184,537 100,000
(130,350) (33,865)
(3,133) 117,189
(1,740)
6,935
5,195
39
Note(Rupees in thousand)
(Muhammad Anwar)Chief Executive Officer
The annexed notes form an integral part of these financial statements.
48
(Khalid Bashir)Director
2 0 1 5A n n u a l R e p o r t

Statement of Changes in Equityfor the Year Ended June 30, 2015
(Muhammad Anwar)Chief Executive Officer
Fair value GeneralDividend
equalizationUnappropriated
profit Sub total TOTALPremium
on issue ofrihgt shares
SHARECAPITAL
TOTALEQUITY
REVENUE RESERVES
RESERVES
Balance as at June 30, 2013
Balance as at June 30, 2014
Balance as at June 30, 2015
Transfer from surplus on revaluationof operating fixed assets on accountof incremental depreciation - net ofdeferred income tax
Profit for the yearOther comprehensive income for the year Total comprehensive income for the year
Transaction with owners - Final dividendfor the year ended June 30, 2014 at therate of Rupees 1.25 per share
Transaction with owners - 25% rightshares issued during the year at premiumof Rupees 5 per share
Transfer from surplus on revaluationof operating fixed assets on accountof incremental depreciation - net ofdeferred income tax
Profit for the yearOther comprehensive income for the year Total comprehensive income for the year
The annexed notes form an integral part of these financial statements.
421,863
-
- 12,706 12,706
434,569
-
61,512
-
- 27,461 27,461
523,542
1,773,643
-
- - -
1,773,643
-
-
-
- - -
1,773,643
30,000
-
- - -
30,000
-
-
-
- - -
30,000
108,102
25
239,019 -
239,019
347,146
(61,512)
-
25
221,694 -
221,694
507,353
1,911,745
25
239,019 -
239,019
2,150,789
(61,512)
-
25
221,694 -
221,694
2,310,996
2,333,608
25
239,019 12,706
251,725
2,585,358
(61,512)
61,512
25
221,694 27,461
249,155
2,834,538
2,825,707
25
239,019 12,706
251,725
3,077,457
(61,512)
184,537
25
221,694 27,461
249,155
3,449,662
421,863
-
- 12,706 12,706
434,569
-
-
-
- 27,461 27,461
462,030
-
-
- - -
-
-
61,512
-
- - -
61,512
492,099
-
- - -
492,099
-
123,025
-
- - -
615,124
(Rupees in thousand)
49
(Khalid Bashir)Director
Sub total
CAPITAL RESERVES
2 0 1 5A n n u a l R e p o r t

50 2 0 1 5A n n u a l R e p o r t
Notes to theFinancial Statements

Notes to the Financial Statements
THE COMPANY AND ITS ACTIVITIES
SUMMARY OF SIGNIFICANT ACCOUNTING POLICIES
Basis of preparation
Statement of compliance
Accounting convention
Critical accounting estimates and judgments
Useful lives, patterns of economic benefits and impairments
Inventories
The Crescent Textile Mills Limited (the Company) is a public limited company incorporated in Pakistan under the Companies Act, 1913 (Now Companies Ordinance, 1984). The registered office of the Company is situated at 45-A, Off: Zafar Ali Road, Gulberg-V, Lahore. Its shares are quoted on all the Stock Exchanges in Pakistan. The Company is engaged in the business of textile manufacturing comprising of spinning, combing, weaving, dyeing, bleaching, printing, stitching, buying, selling and otherwise dealing in yarn, cloth and other goods and fabrics made from raw cotton and synthetic fiber(s) and to generate, accumulate, distribute, supply and sale of electricity. The Company also operates a cold storage unit.
The significant accounting policies applied in the preparation of these financial statements are set out below. These policies have been consistently applied to all years presented, unless otherwise stated:
These financial statements have been prepared in accordance with approved accounting standards as applicable in Pakistan. Approved accounting standards comprise of such International Financial Reporting Standards (IFRS) issued by the International Accounting Standards Board (IASB) as are notified under the Companies Ordinance, 1984, provisions of and directives issued under the Companies Ordinance, 1984. In case requirements differ, the provisions or directives of the Companies Ordinance, 1984 shall prevail.
These financial statements have been prepared under the historical cost convention, except for the freehold and leasehold land measured at revalued amounts and certain financial instruments carried at fair value.
The preparation of financial statements in conformity with the approved accounting standards requires the use of certain critical accounting estimates. It also requires the management to exercise its judgment in the process of applying the Company's accounting policies. Estimates and judgments are continually evaluated and are based on historical experience and other factors, including expectations of future events that are believed to be reasonable under the circumstances. The areas where various assumptions and estimates are significant to the Company's financial statements or where judgments were exercised in application of accounting policies are as follows:
Estimates with respect to residual values and useful lives and pattern of flow of economic benefits are based on the analysis of the management of the Company. Further, the Company reviews the value of assets for possible impairment on annual basis. Any change in the estimates in the future might affect the carrying amount of respective item of property, plant and equipment, with a corresponding effect on the depreciation charge and impairment.
Net realizable value of inventories is determined with reference to currently prevailing selling prices less estimated expenditure to make sales.
1.
2.
2.1
a)
b)
c)
for the Year Ended June 30, 2015
512 0 1 5A n n u a l R e p o r t

Notes to the Financial Statements
Taxation
Provision for doubtful debts
Impairment of investment in equity method accounted for associated company
Amendments to published approved standards and interpretation that are effective in current year and are relevant to the Company
In making the estimates for income tax currently payable by the Company, the management takes into account the current income tax law and the decisions of appellate authorities on certain issues in the past.
The Company reviews its receivable balances against any provision required for any doubtful balances on an ongoing basis. The provision is made while taking into consideration expected recoveries, if any.
In making an estimate of recoverable amount of the Company's investment in equity method accounted for associated company, the management considers future cash flows.
Following amendments to published approved standards and interpretation are mandatory for the Company's accounting periods beginning on or after July 01, 2014:
IAS 32 (Amendments) 'Financial Instruments: Presentation' (effective for annual periods beginning on or after January 01, 2014). Amendments have been made to clarify certain aspects because of diversity in application of the requirements on offsetting, focused on four main areas: the meaning of 'currently has a legally enforceable right of set-off'; the application of simultaneous realization and settlement; the offsetting of collateral amounts and the unit of account for applying the offsetting requirements.
IAS 36 (Amendments) ‘Impairment of Assets’ (effective for annual periods beginning on or after January 01, 2014). Amendments have been made in IAS 36 to reduce the circumstances in which the recoverable amount of assets or cash-generating units is required to be disclosed, clarify the disclosures required and to introduce an explicit requirement to disclose the discount rate used in determining impairment (or reversals) where recoverable amount (based on fair value less costs of disposal) is determined using a present value technique.
IFRIC 21 'Levies' (effective for annual periods beginning on or after January 01, 2014). The interpretation provides guidance on when to recognize a liability for a levy imposed by a government, both for levies that are accounted for in accordance with IAS 37 'Provisions, Contingent Liabilities and Contingent Assets' and those where the timing and amount of the levy is certain. The Interpretation identifies the obligating event for the recognition of a liability as the activity that triggers the payment of the levy in accordance with the relevant legislation.
On December 12, 2013, IASB issued Annual Improvements to IFRSs: 2010 – 2012 Cycle, incorporating amendments to seven IFRSs more specifically in IFRS 8 'Operating Segments' and IAS 24 ‘Related Party Disclosures’, which are considered relevant to the Company's financial statements. These amendments are effective for annual periods beginning on or after July 01, 2014. The amendments to IFRS 8 require an entity to disclose the judgments made by the management in applying the aggregation criteria to operating segments, including a description of the operating segments aggregated and the economic indicators assessed in determining whether the operating segments have ‘similar economic characteristics’. Further, the amendment to IFRS 8 clarifies that a reconciliation of the total of the reportable segments’ assets to the entity’s assets should only be provided if the segment assets are regularly provided to the chief operating decision-maker. The amendments to IAS 24 clarify that a management entity providing key management personnel services to a
d)
for the Year Ended June 30, 2015
52 2 0 1 5A n n u a l R e p o r t

Notes to the Financial Statements
reporting entity is a related party of the reporting entity. Consequently, the reporting entity must disclose as related party transactions the amounts incurred for the service paid or payable to the management entity for the provision of key management personnel services. However, disclosure of the components of such compensation is not required.
The application of the above amendments and interpretation does not result in any impact on profit or loss, other comprehensive income / (loss) and total comprehensive income / (loss).
There are other amendments to published standards that are mandatory for accounting periods beginning on or after July 01, 2014 but are considered not to be relevant or do not have any significant impact on the Company's financial statements and are therefore not detailed in these financial statements.
Following standards and amendments to existing standards have been published and are mandatory for the Company's accounting periods beginning on or after July 01, 2015 or later periods:
IFRS 9 'Financial Instruments' (effective for annual periods beginning on or after January 01, 2018). A finalized version of IFRS 9 which contains accounting requirements for financial instruments, replacing IAS 39 ‘Financial Instruments: Recognition and Measurement’. Financial assets are classified by reference to the business model within which they are held and their contractual cash flow characteristics. The 2014 version of IFRS 9 introduces a 'fair value through other comprehensive income' category for certain debt instruments. Financial liabilities are classified in a similar manner to under IAS 39, however there are differences in the requirements applying to the measurement of an entity's own credit risk. The 2014 version of IFRS 9 introduces an 'expected credit loss' model for the measurement of the impairment of financial assets, so it is no longer necessary for a credit event to have occurred before a credit loss is recognized. It introduces a new hedge accounting model that is designed to be more closely aligned with how entities undertake risk management activities when hedging financial and non-financial risk exposures. The requirements for the derecognition of financial assets and liabilities are carried forward from IAS 39. The management of the Company is in the process of evaluating the impacts of the aforesaid standard on the Company’s financial statements.
IFRS 12 ‘Disclosures of Interests in Other Entities’ (effective for annual periods beginning on or after January 01, 2015). This standard includes the disclosure requirements for all forms of interests in other entities, including joint arrangements, associates, special purpose vehicles and other off-balance sheet vehicles. This standard is not expected to have a material impact on the Company’s financial statements.
IFRS 13 ‘Fair Value Measurement’ (effective for annual periods beginning on or after January 01, 2015). This standard aims to improve consistency and reduce complexity by providing a precise definition of fair value and a single source of fair value measurement and disclosure requirements for use across IFRSs. The requirements, which are largely aligned between IFRSs and US GAAP, do not extend the use of fair value accounting but provide guidance on how it should be applied where its use is already required or permitted by other standards within IFRSs or US GAAP. This standard is not expected to have a material impact on the Company’s financial statements.
Amendments to published standards that are effective in current year but not relevant to the Company
Standards and amendments to published standards that are not yet effective but relevant to the Company
e)
f)
for the Year Ended June 30, 2015
2 0 1 5A n n u a l R e p o r t 53

Notes to the Financial Statements
Amendments to IFRS 12 (effective for annual periods beginning on or after January 01, 2015) provide additional transition relief in by limiting the requirement to provide adjusted comparative information to only the preceding comparative period. Also, amendments to IFRS 12 eliminate the requirement to provide comparative information for periods prior to the immediately preceding period.
Amendments to IAS 28 (effective for annual periods beginning on or after January 01, 2016) to clarify the treatment of the sale or contribution of assets from an investor to its associates or joint venture, as follows: require full recognition in the investor’s financial statements of gains and losses arising on the sale or contribution of assets that constitute a business (as defined in IFRS 3 ‘Business Combinations’); require the partial recognition of gains and losses where the assets do not constitute a business, i.e. a gain or loss is recognized only to the extent of the unrelated investors’ interests in that associate or joint venture. These requirements apply regardless of the legal form of the transaction, e.g. whether the sale or contribution of assets occur by an investor transferring shares in a subsidiary that holds the assets (resulting in loss of control of the subsidiary), or by the direct sale of the assets themselves. The management of the Company is in the process of evaluating the impacts of the aforesaid amendments on the Company’s financial statements.
Amendments to IFRS 12 and IAS 28 (effective for annual periods beginning on or after January 01, 2016) to address issues that have arisen in the context of applying the consolidation exception for investment entities by clarifying the following points: the exemption from preparing consolidated financial statements for an intermediate parent entity is available to a parent entity that is a subsidiary of an investment entity, even if the investment entity measures all of its subsidiaries at fair value; a subsidiary that provides services related to the parent’s investment activities should not be consolidated if the subsidiary itself is an investment entity; when applying the equity method to an associate or a joint venture, a non-investment entity investor in an investment entity may retain the fair value measurement applied by the associate or joint venture to its interests in subsidiaries; and an investment entity measuring all of its subsidiaries at fair value provides the disclosures relating to investment entities required by IFRS 12. The management of the Company is in the process of evaluating the impacts of the aforesaid amendments on the Company’s financial statements.
IFRS 15 ‘Revenue from Contracts with Customers’ (effective for annual periods beginning on or after January 01, 2017). IFRS 15 provides a single, principles based five-step model to be applied to all contracts with customers. The five steps in the model are: identify the contract with the customer; identify the performance obligations in the contract; determine the transaction price; allocate the transaction price to the performance obligations in the contracts; and recognize revenue when (or as) the entity satisfies a performance obligation. Guidance is provided on topics such as the point in which revenue is recognized, accounting for variable consideration, costs of fulfilling and obtaining a contract and various related matters. New disclosures about revenue are also introduced. The management of the Company is in the process of evaluating the impacts of the aforesaid standard on the Company’s financial statements.
IAS 1 (Amendments) ‘Presentation of Financial Statements’ (effective for annual periods beginning on or after January 01, 2016). Amendments have been made to address perceived impediments to preparers exercising their judgement in presenting their financial reports by making the following changes: clarification that information should not be obscured by aggregating or by providing immaterial information, materiality consideration apply to the all parts of the financial statements, and even when a standard requires a specific disclosure, materiality consideration do apply; clarification that the list of the line items to be presented in these statements can be disaggregated and aggregated as relevant and additional guidance on subtotals in these statements and
for the Year Ended June 30, 2015
2 0 1 5A n n u a l R e p o r t54

Notes to the Financial Statementsfor the Year Ended June 30, 2015
clarification that an entity’s share of other comprehensive income of equity-accounted associates and joint ventures should be presented in aggregate as single line items based on whether or not it will subsequently be reclassified to profit or loss; and additional examples of possible ways of ordering the notes to clarify that understandability and comparability should be considered when determining the order of the notes and to demonstrate that the notes need not be presented in the order so far listed in IAS 1. However, the amendments are not expected to have a material impact on the Company’s financial statements.
IAS 16 (Amendments) 'Property, Plant and Equipment' (effective for annual periods beginning on or after January 01, 2016). The amendments clarify that a depreciation method that is based on revenue that is generated by an activity that includes the use of an asset is not appropriate for property, plant and equipment; and add guidance that expected future reductions in the selling price of an item that was produced using an asset could indicate the expectation of technological or commercial obsolescence of the asset, which, in turn, might reflect a reduction of the future economic benefits embodied in the asset. However, the amendments are not expected to have a material impact on the Company’s financial statements.
There are other standard and amendments to published standards that are mandatory for accounting periods beginning on or after July 01, 2015 but are considered not to be relevant or do not have any significant impact on the Company's financial statements and are therefore not detailed in these financial statements.
The Company operates a recognized provident fund for all its permanent employees. Equal monthly contributions are made to the fund both by the Company and the employees at the rate of 6.25 percent of the basic salary plus cost of living allowance. Obligation for contributions to defined contribution plan is recognized as an expense in the profit and loss account as and when incurred. Employees are eligible under the scheme on completion of prescribed qualifying period of service.
Leases, where the Company has substantially all the risks and rewards of ownership of assets are classified as finance leases. At inception, finance leases are recorded at the lower of present value of minimum lease payments under the lease agreement and the fair value of the assets. The related rental obligations, net of finance cost, are included in liabilities against assets subject to finance lease. The liabilities are classified as current and non-current depending upon the timing of the payment. Each lease payment is allocated between the liability and finance cost so as to achieve a constant rate on the balance outstanding. The interest element of the rental is charged to profit and loss account over the lease term.
Provisions are recognized when the Company has a legal or constructive obligation as a result of past events and it is probable that an outflow of resources embodying economic benefits will be required to settle the obligations and a reliable estimate of the amount can be made.
Dividend distribution to the Company's shareholders is recognized as a liability in the Company's financial statements in the period in which the dividends are declared and other appropriations are recognized in the period in which these are approved by the Board of Directors.
Standard and amendments to published standards that are not yet effective and not considered relevant to the Company
Employees retirement benefits
Liabilities against assets subject to finance lease
Provisions
Dividend and other appropriations
g)
2.2
2.3
2.4
2.5
2 0 1 5A n n u a l R e p o r t 55

Notes to the Financial Statementsfor the Year Ended June 30, 2015
Taxation
Current
Deferred
Provision for current tax is based on the taxable income for the year determined in accordance with the prevailing law for taxation of income. The charge for current tax is calculated using prevailing tax rates or tax rates expected to apply to the profit for the year, if enacted. The charge for current tax also includes adjustments, where considered necessary, to provision for tax made in previous years arising from assessments framed during the year for such years.
Deferred tax is accounted for using the balance sheet liability method in respect of all temporary differences arising from differences between the carrying amount of assets and liabilities in the financial statements and the corresponding tax bases used in the computation of the taxable profit. Deferred tax liabilities are generally recognized for all taxable temporary differences and deferred tax assets to the extent that it is probable that taxable profits will be available against which the deductible temporary differences, unused tax losses and tax credits can be utilized.
Deferred tax is calculated at the rates that are expected to apply to the period when the differences reverse based on tax rates that have been enacted or substantively enacted by the balance sheet date. Deferred tax is charged or credited in the profit and loss account, except to the extent that it relates to items recognised in other comprehensive income or directly in equity. In this case the tax is also recognised in other comprehensive income or directly in equity, respectively.
2.6
Property, plant and equipment
Operating fixed assets and depreciation
2.7
2.7.1
Cost / Revalued amountFixed assets are stated at cost less accumulated depreciation and any identified impairment loss, except freehold land which is stated at revalued amount less any identified impairment loss and leasehold land which is stated at revalued amount less accumulated depreciation and any identified impairment loss. Capital work-in-progress is stated at cost less any identified impairment loss. Cost of operating fixed assets consists of historical cost, borrowing cost pertaining to the erection / construction period of qualifying assets and directly attributable costs of bringing the assets to working condition.
Valuations are performed frequently enough to ensure that the fair value of a revalued asset does not differ materially from its carrying amount.
Subsequent costs are included in the asset's carrying amount or recognized as a separate asset, as appropriate, only when it is probable that future economic benefits associated with the item will flow to the Company and the cost of the item can be measured reliably. All other repair and maintenance costs are charged to profit and loss account during the period in which they are incurred.
a)
2 0 1 5A n n u a l R e p o r t56

Any revaluation surplus is credited to surplus on revaluation of operating fixed assets except to the extent that it reverses a revaluation decrease of the same asset previously recognized in profit and loss account, in which case the increase is recognized in profit and loss account. A revaluation deficit is recognized in profit and loss account, except to the extent that it offsets an existing surplus on the same asset recognized in surplus on revaluation of operating fixed assets.
An annual transfer from surplus on revaluation of operating fixed assets to unappropriated profit is made for the difference between depreciation based on the revalued carrying amount of the assets and depreciation based on the assets original cost. Upon disposal, any revaluation reserve relating to the particular asset being sold is transferred to retained earnings. All transfers from surplus on revaluation of operating fixed assets are net of applicable deferred taxation.
Depreciation on operating fixed assets is charged from the month in which an asset is acquired while no depreciation is charged for the month in which the asset is disposed of.
Depreciation is charged to profit and loss account on reducing balance method, except leasehold land on which depreciation is charged on straight line method to write off the cost of operating fixed assets over their expected useful lives at the rates mentioned in Note 14.1. The residual values and useful lives are reviewed by the management, at each financial year-end and adjusted if impact on depreciation is significant.
An item of property, plant and equipment is de-recognized upon disposal or when no future economic benefits are expected from its use or disposal. Any gain or loss arising on de-recognition of the asset is included in the profit and loss account in the year the asset is de-recognized.
Depreciation
De-recognition
b)
c)
Notes to the Financial Statementsfor the Year Ended June 30, 2015
2 0 1 5A n n u a l R e p o r t
Assets subject to finance lease
Assets subject to operating lease
Non-current assets held for sale
These are initially recognized at lower of present value of minimum lease payments under the lease agreements and fair value of assets. Subsequently, these assets are stated at cost less accumulated depreciation and any identified impairment loss. Assets so acquired are depreciated over their expected useful lives. Depreciation of leased assets is charged to profit and loss account.
Depreciation on additions to leased assets is charged from the month in which an asset is acquired while no depreciation is charged for the month in which the asset is disposed of.
Leases, where a significant portion of the risks and rewards of ownership are retained by the lessor are classified as operating leases. Payments made under operating leases (net of any incentives received from the lessor) are charged to profit and loss account on a straight line basis over the lease term.
Non-current assets classified as held for sale when their carrying amount is to be recovered principally through a sale transaction and a sale is considered highly probable. They are stated at the lower of carrying amount and fair value less costs to sell.
2.7.2
2.7.3
2.8
57

Intangible assets
Investments
Investments at fair value through profit or loss
Held-to-maturity investments
Intangible assets represent the cost of computer software acquired and are stated at cost less accumulated amortization and any identified impairment loss.
Amortization is charged to profit and loss account on straight line basis so as to write off the cost of an asset over its estimated useful life. Amortization is charged from the month in which the asset is acquired or capitalized while no amortization is charged for the month in which the asset is disposed of. Intangible assets are amortized over a period of three years.
The Company assesses at each balance sheet date whether there is any indication that intangible assets may be impaired. If such indication exists, the carrying amounts of such assets are reviewed to assess whether they are recorded in excess of their recoverable amount. When carrying value exceeds the respective recoverable amount, assets are written down to their recoverable amounts and resulting impairment is recognized in profit and loss account currently. The recoverable amount is the higher of an asset's fair value less cost to sell and value in use. When an impairment loss is recognized, the amortization charge is adjusted in the future periods to allocate the asset's revised carrying amount over its estimated useful life.
Classification of an investment is made on the basis of intended purpose for holding such investment. Management determines the appropriate classification of its investments at the time of purchase and re-evaluates such designation on regular basis.
Investments are initially measured at fair value plus transaction costs directly attributable to acquisition, except for “Investment at fair value through profit or loss” which is initially measured at fair value.
The Company assesses at the end of each reporting period whether there is any objective evidence that investments are impaired. If any such evidence exists, the Company applies the provisions of IAS 39 'Financial Instruments: Recognition and Measurement' to all investments, except investment in an associate, which is tested for impairment in accordance with the provisions of IAS 36 'Impairment of Assets'.
Investments classified as held-for-trading and those designated as such are included in this category. Investments are classified as held-for-trading if these are acquired for the purpose of selling in the short term. Gains or losses on investments held-for-trading are recognized in profit and loss account.
Investments with fixed or determinable payments and fixed maturity are classified as held-to-maturity when the Company has the positive intention and ability to hold to maturity. Investments intended to be held for an undefined period are not included in this classification. Other long-term investments that are intended to be held to maturity are subsequently measured at amortized cost. This cost is computed as the amount initially recognized minus principal repayments, plus or minus the cumulative amortization, using the effective interest method, of any difference between the initially recognized amount and the maturity amount. For investments carried at amortized cost, gains and losses are recognized in profit and loss account when the investments are de-recognized or impaired, as well as through the amortization process.
2.9
2.10
2.10.1
2.10.2
Notes to the Financial Statementsfor the Year Ended June 30, 2015
2 0 1 5A n n u a l R e p o r t58

Available for sale investments
Quoted
Unquoted
Investment in associate
Inventories
Stores, spare parts and loose tools
Stock-in-trade
Investments intended to be held for an indefinite period of time, which may be sold in response to need for liquidity, or changes to interest rates or equity prices are classified as available for sale. After initial recognition, investments which are classified as available for sale are measured at fair value. Gains or losses on available for sale investments are recognized directly in statement of other comprehensive income until the investment is sold, de-recognized or is determined to be impaired, at which time the cumulative gain or loss previously reported in statement of other comprehensive income is included in profit and loss account. These are sub-categorized as under:
For investments that are actively traded in organized capital markets, fair value is determined by reference to stock exchange quoted market bids at the close of business on the balance sheet date.
The investments that do not have a quoted market price in an active market and whose fair value cannot be reliably measured, subsequent to after initial recognition are carried at cost less any identified impairment loss.
The Company’s investment in its associate is accounted for under the equity method of accounting. An associate is an entity in which the Company has significant influence and which is neither a subsidiary nor a joint venture. Under the equity method, the investment in the associate is carried in the balance sheet at cost plus post-acquisition changes in the Company’s share of net assets of the associate. Goodwill relating to an associate is included in the carrying amount of the investment and is not amortized. The profit and loss account reflects the share of the results of operations of the associate. Where there has been a change recognized directly in the equity of the associate, the Company recognizes its share of any changes and discloses this, when applicable, in the statement of changes in equity.
The reporting dates of the associate and the Company are identical and the associate’s accounting policies conform to those used by the Company for like transactions and events in similar circumstances.
Inventories, except for stock in transit and waste materials, are stated at lower of cost and net realizable value. Net realizable value signifies the estimated selling price in the ordinary course of business less the estimated costs of completion and the estimated costs necessary to make a sale. Cost is determined as follows:
Usable stores, spare parts and loose tools are valued principally at moving average cost, while items considered obsolete are carried at nil value. Items-in-transit are stated at invoice amount plus other charges paid thereon.
Stock of raw materials, except for stock-in-transit, is valued principally at the lower of weighted average cost and net realizable value.
Stocks-in-transit are valued at cost comprising invoice value plus other charges paid thereon.
2.10.3
2.10.4
2.11
Notes to the Financial Statementsfor the Year Ended June 30, 2015
2 0 1 5A n n u a l R e p o r t 59

Cost of work-in-process and finished goods comprises of cost of direct materials, labour and appropriate manufacturing overheads.
Stock of waste materials is stated at net realizable value.
Cash and cash equivalents comprise cash in hand, cash at banks on current accounts and other short term highly liquid instruments that are readily convertible into known amounts of cash and which are subject to insignificant risk of changes in values.
Revenue is recognized to the extent that it is probable that the economic benefits will flow to the Company and the revenue can be reliably measured. Following specific recognition criteria must also be met before revenue is recognized:
Revenue from the sale of goods is recognized when the significant risks and rewards of ownership of the goods have passed to the buyer, usually on the delivery of the goods. Revenue from sale of electricity is recognized at the time of transmission.
Revenue is recognized as interest accrues (using the effective interest method that is the rate that exactly discounts estimated future cash receipts through the expected life of the financial instrument to the net carrying amount of the financial asset).
Dividend on equity instruments is recognized when right to receive the dividend is established.
Revenue is recognized when rent is accrued.
Financial instruments carried on the balance sheet include investments, deposits, trade debts, loans and advances, interest accrued, other receivables, cash and bank balances, long term financing, liabilities against assets subject to finance lease, short term borrowings, accrued mark-up and trade and other payables etc. Financial assets and liabilities are recognized when the Company becomes a party to contractual provisions of the instrument. Initial recognition is made at fair value plus transaction costs directly attributable to acquisition, except for "financial instruments at fair value through profit or loss" which are initially measured at fair value. The particular measurement methods adopted are disclosed in the individual policy statements associated with each item.
A financial asset (or, where applicable a part of a financial asset or part of a group of similar financial assets) is derecognized where:
Cash and cash equivalents
Revenue recognition
Sale of goods and electricity
Interest income
Dividends
Rental income
Financial instruments
De-recognition of financial assets
2.12
2.13
2.14
Notes to the Financial Statementsfor the Year Ended June 30, 2015
2 0 1 5A n n u a l R e p o r t60

Borrowings
Trade debts
Loans and receivables
Borrowings are recognized initially at fair value and are subsequently stated at amortized cost. Any difference between the proceeds and the redemption value is recognized in the profit and loss account over the period of the borrowings using the effective interest method.
Trade debts originated by the Company are recognized and carried at original invoice amount less an allowance for any uncollectible amounts. Known bad debts are written off and provision is made against debts considered doubtful when collection of the full amount is no longer probable.
Loans and receivables are non-derivative financial assets with fixed or determinable payments that are not quoted in an active market. Such assets are carried at amortized cost using the effective interest method. Gains and losses are recognized in profit and loss account when the loans and receivables are de-recognized or impaired, as well as through the amortization process.
2.15
2.16
2.17
Notes to the Financial Statementsfor the Year Ended June 30, 2015
the rights to receive cash flows from the asset have expired;
the Company retains the right to receive cash flows from the asset, but has assumed an obligation to pay them in full without material delay to a third party under a 'pass-through' arrangement; or
the Company has transferred its rights to receive cash flows from the asset and either (a) has transferred substantially all the risks and rewards of the asset or (b) has neither transferred nor retained substantially all the risks and rewards of the asset, but has transferred control of the asset.
Where the Company has transferred its rights to receive cash flows from an asset and has neither transferred nor retained substantially all the risks and rewards of the asset nor transferred control of the asset, the asset is recognised to the extent of the Company’s continuing involvement in the asset. Continuing involvement that takes the form of a guarantee over the transferred asset is measured at the lower of the original carrying amount of the asset and the maximum amount of consideration that the Company could be required to repay. Where continuing involvement takes the form of a written and / or purchased option (including a cash-settled option or similar provision) on the transferred asset, the extent of the Company’s continuing involvement is the amount of the transferred asset that the Company may repurchase, except that in the case of a written put option (including a cash-settled option or similar provision) on an asset measured at fair value, the extent of the Company’s continuing involvement is limited to the lower of the fair value of the transferred asset and the option exercise price.
-
-
-
De-recognition of financial liabilitiesA financial liability is de-recognized when the obligation under the liability is discharged or cancelled or expired.
Where an existing financial liability is replaced by another from the same lender on substantially different terms, or the terms of an existing liability are substantially modified, such an exchange or modification is treated as a derecognition of the original liability and the recognition of a new liability, and the difference in the respective carrying amounts is recognized in profit and loss account.
2 0 1 5A n n u a l R e p o r t 61

Notes to the Financial Statementsfor the Year Ended June 30, 2015
Trade and other payables
Derivative financial instruments
Borrowing cost
Impairment
Financial assets
Assets carried at amortized cost
Available for sale financial assets
Liabilities for trade and other amounts payable are initially recognized at fair value, which is normally the transaction cost.
The Company uses derivative financial instruments such as forward currency contracts and forward currency swaps to hedge its risks associated with interest rate and foreign currency fluctuations. Such derivative financial instruments are initially recognized at fair value on the date on which a derivative contract is entered into and are subsequently remeasured at fair value. Derivatives are carried as assets when the fair value is positive and as liabilities when the fair value is negative.
Any gains or losses arising from changes in fair value on derivatives during the year that do not qualify for hedge accounting are taken directly to profit and loss account.
The fair value of forward currency contracts is calculated by reference to current forward exchange rates for contracts with similar maturity profiles. The fair value of cross currency swap contracts is determined by reference to market values for similar instruments.
If the forecast transaction or firm commitment is no longer expected to occur, amounts previously recognized in equity are transferred to profit and loss account. If the hedging instrument expires or is sold, terminated or exercised without replacement or rollover, or if its designation as a hedge is revoked, amounts previously recognized in equity remain in equity until the forecast transaction or firm commitment occurs.
Interest, mark-up and other charges on long term finances are capitalized up to the date of commissioning of respective qualifying assets acquired out of the proceeds of such long term finances. All other interest, mark-up and other charges are recognized in profit and loss account.
The Company assesses at the end of each reporting period whether there is an objective evidence that a financial asset or group of financial assets is impaired.
If there is objective evidence that an impairment loss on loans and receivables carried at amortized cost has been incurred, the amount of the loss is measured as the difference between the asset’s carrying amount and the present value of estimated future cash flows (excluding future credit losses that have not been incurred) discounted at the financial asset’s original effective interest rate (i.e. the effective interest rate computed at initial recognition). The carrying amount of the asset is reduced either directly or through use of an allowance account. The amount of the loss is recognized in profit and loss account.
If an available for sale asset is impaired, an amount comprising the difference between its cost and its current fair value, less any impairment loss previously recognized in profit and loss, is transferred from equity to the profit and
2.18
2.19
2.20
2.21
a)
2 0 1 5A n n u a l R e p o r t62

loss account. Reversals in respect of equity instruments classified as available for sale are not recognized in profit and loss account. Reversals of impairment losses on debt instruments are reversed through profit or loss, if the increase in fair value of the instrument can be objectively related to an event occurring after the impairment loss was recognized in profit and loss account.
The carrying amounts of the Company's non-financial assets are reviewed at each balance sheet date to determine whether there is any indication of impairment. If such indication exists, the recoverable amount of such asset is estimated. An impairment loss is recognized wherever the carrying amount of the asset exceeds its recoverable amount. Impairment losses are recognized in profit and loss account. A previously recognized impairment loss is reversed only if there has been a change in the estimates used to determine the asset's recoverable amount since the last impairment loss was recognized. If that is the case, the carrying amount of the asset is increased to its recoverable amount. That increased amount cannot exceed the carrying amount that would have been determined, net of depreciation, had no impairment loss been recognized for the asset in prior years. Such reversal is recognized in profit and loss account.
Financial assets and financial liabilities are set off and the net amount is reported in the financial statements when there is legal enforceable right to set off and the Company intends either to settle on a net basis or to realize the assets and to settle the liabilities simultaneously.
These financial statements are presented in Pak Rupees, which is the Company’s functional currency. All monetary assets and liabilities denominated in foreign currencies are translated into Pak Rupees at the rates of exchange prevailing at the balance sheet date, while the transactions in foreign currencies during the year are initially recorded in functional currency at the rates of exchange prevailing at the transaction date. All non-monetary items are translated into Pak Rupees at exchange rates prevailing on the date of transaction or on the date when fair values are determined. Exchange gains and losses are recorded in the profit and loss account.
Segment reporting is based on the operating (business) segments of the Company. An operating segment is a component of the Company that engages in business activities from which it may earn revenues and incur expenses, including revenues and expenses that relate to the transactions with any of the Company's other components. An operating segment's operating results are reviewed regularly by the Chief Executive Officer to make decisions about resources to be allocated to the segment and assess its performance, and for which discrete financial information is available.
Segment results that are reported to the Chief Executive Officer include items directly attributable to a segment as well as those that can be allocated on a reasonable basis. Those income, expenses, assets, liabilities and other balances which cannot be allocated to a particular segment on a reasonable basis are reported as unallocated.
The Company has five reportable business segments. Spinning (Producing different quality of yarn using natural and artificial fibres), Weaving (Producing different quality of greige fabric using yarn), Processing and Home Textile (Processing greige fabric for production of printed and dyed fabric and manufacturing of home textile articles), Power Generation (Generating and distributing power) and Cold Storage (Making of ice and warehousing of perishable goods).
Non-financial assets
Off setting
Foreign currencies
Segment reporting
b)
2.22
2.23
2.24
Notes to the Financial Statementsfor the Year Ended June 30, 2015
2 0 1 5A n n u a l R e p o r t 63

Notes to the Financial Statementsfor the Year Ended June 30, 2015
Transactions among the business segments are recorded at arm's length prices using admissible valuation methods. Inter segment sales and purchases are eliminated from the total.
ISSUED, SUBSCRIBED AND PAID UP SHARE CAPITAL3.
Ordinary shares of Rupees 10 eachfully paid in cash
Ordinary shares of Rupees 10 eachissued as fully paid bonus shares
197,811
294,288 492,099
320,836
294,288 615,124
2015 2014(Rupees in thousand)
32 083 617
29 428 787
61 512 404
19 781 136
29 428 787
49 209 923
2015 2014(Number of Shares)
2 0 1 5A n n u a l R e p o r t
Movement during the year3.1
As at 01 July
Ordinary shares of Rupees 10 eachissued during the year as fully paidright shares
492,099
- 492,099
492,099
123,025 615,124
49 209 923
12 302 481
61 512 404
49 209 923
-
49 209 923
2015 2014(Rupees in thousand)
2015 2014(Number of Shares)
Ordinary shares of the Company held by related parties:3.2
The Crescent Textile Mills Limited-Employees Provident Fund-TrusteeCrescent Cotton Mills Limited Crescent FoundationCrescent Steel and Allied Products LimitedPremier Insurance LimitedShakarganj Limited (formerly Shakarganj Mills Limited)
4 565 6843 352 3431 288 576
452 379 427 500
5 89810 092 380
4 875 0482 681 8751 030 861
452 379 262 000
5 8989 308 061
2015 2014(Number of Shares)
64

Notes to the Financial Statementsfor the Year Ended June 30, 2015
RESERVES4.2015 2014
Restated(Rupees in thousand)
This reserve can be utilized by the Company only for the purposes specified in section 83(2) of the Companies Ordinance, 1984.
This represents the unrealized gain on remeasurement of available for sale investments at fair value and is not available for distribution. This will be transferred to profit and loss account on realization. Reconciliation of fair value reserve is as under:
4.1
4.2
Composition of reserves is as follows:
Capital reserve
Revenue reserves
Premium on issue of right shares (Note 4.1)Fair value reserve (Note 4.2)
Dividend equalization reserveGeneral reserveUnappropriated profit
61,512 462,030 523,542
30,000 1,773,643
507,353 2,310,996 2,834,538
- 434,569 434,569
30,000 1,773,643
347,146 2,150,789 2,585,358
2 0 1 5A n n u a l R e p o r t 65
Balance as at July 01Add: Fair value adjustment during the yearBalance as at June 30
434,569 27,461
462,030
421,863 12,706
434,569
2015 2014(Rupees in thousand)

Notes to the Financial Statementsfor the Year Ended June 30, 2015
2015 2014(Rupees in thousand)
SURPLUS ON REVALUATION OF OPERATINGFIXED ASSETS - NET OF DEFERRED INCOME TAX
Surplus on revaluation of operating fixed assets as at July 01Transferred to unappropriated profit in respect of incrementaldepreciation charged during the year - net of deferredincome tax Related deferred income tax liability
5.
2,291,047
25 4
29 2,291,018
280
38
(4) 314
2,290,704
2,291,075
25 3
28 2,291,047
229
54
(3) 280
2,290,767
Less:
Deferred income tax liability as at July 01Adjustment of deferred income tax liability due to re-assessment at year endIncremental depreciation charged during the yeartransferred to profit and loss account
This represents surplus resulting from revaluation of freehold land and leasehold land carried out on June 30, 2013 by Messrs Hamid Mukhtar and Company (Private) Limited, an independent valuer enrolled on panel of the State Bank of Pakistan (SBP) as per the basis stated in Note 14.1.1 to the financial statements. Previously revlaution was carried out on June 30, 2007 by an independent valuer.
5.1
2 0 1 5A n n u a l R e p o r t66
6. LONG TERM FINANCING
Financing from banking companies - secured (Note 6.1)Less: Current portion shown under current liabilities (Note 12)
209,517 130,351
79,166
179,167 79,173 99,994

Notes to the Financial Statementsfor the Year Ended June 30, 2015
Habib BankLimited
Allied BankLimited
Habib BankLimited
Habib BankLimited
MCB BankLimited
United Bank Limited
Pak Libya HoldingCompany (Private)Limited
SBP refinance ratefor LTF-EOP plus
2%
SBP refinance ratefor LTF-EOP plus
2%
SBP refinance ratefor LTF-EOP plus
3%
SBP refinance ratefor LTF-EOP plus
3%
6 months KIBORplus 2% withoutany floor or cap
3 months KIBORplus 1.25 % without
any floor or cap
3 months KIBORplus 2.75 % without
any floor or cap
-
4,594
2,917
13,796
18,386
39,474
100,000
179,167
37,781
13,784
8,750
22,993
55,157
71,052
-
209,517
10 equal halfyearly
installments
12 equal halfyearly
installments
12 equal halfyearly
installments
12 equal halfyearly
installments
8 equal halfyearly
installments
19 equalquarterly
installments
16 equalquarterly
installments
January 23,2010
February 23,2010
March 03,2010
June 08,2011
January 27,2012
February 29,2012
January 02,2016
Quarterly
Quarterly
Quarterly
Quarterly
Half yearly
Quarterly
Quarterly
Joint pari passu charge over fixedand current assets of the Company.
Joint pari passu charge over fixedand current assets of the Company.
Joint pari passu charge over fixedand current assets of the Company.
Joint pari passu charge over fixedand current assets of the Company.
Joint pari passu charge over fixedand current assets of the Company.
Joint pari passu charge over fixedand current assets of the Company.
Joint pari passu charge over fixedand current assets of the Company.
6.1 Lender 2015 2014 Rate ofinterest per
annum
Number ofinstallments
Date ofrepayment of
first installment
Interestpayable
Security
(Rupees in thousand)
47,068 3,387
43,681 32,622 11,059
LIABILITIES AGAINST ASSETS SUBJECT TO FINANCE LEASE
Future minimum lease paymentsLess: Un-amortized finance chargePresent value of future minimum lease paymentsLess: Current portion shown under current liabilities (Note 12)
2015 2014(Rupees in thousand)
7.
89,931 12,385 77,546 33,753 43,793
2 0 1 5A n n u a l R e p o r t 67

Notes to the Financial Statementsfor the Year Ended June 30, 2015
The minimum lease payments have been discounted at an implicit interest rate of six months KIBOR plus 2.75% per annum (2014: six months KIBOR plus 2.75% per annum). The implicit interest rate used to arrive at the present value of minimum lease payments ranges from 9.83% to 12.87% (2014: 12.87% to 13.16% ) per annum. Since the implicit interest rate is linked with KIBOR so the amount of minimum lease payments and finance charge may vary from period to period. Taxes, repairs and insurance costs are to be borne by the Company. These are secured against the leased assets.
7.1
Minimum lease payments and their present values are regrouped as under:7.2
2015 2014
Not later thanone year
Later than oneyear and not later
than five years
Not later thanone year
Later than oneyear and not later
than five years
41,881 8,128
33,753
48,050 4,257
43,793
11,502 443
11,059
35,566 2,944
32,622
Future minimum lease paymentsLess: Un-amortized finance chargePresent value of future minimum lease payments
(Rupees in thousand)
2015 2014(Rupees in thousand)
DEFERRED INCOME TAX LIABILITY
Taxable temporary differences
Deductible temporary differences
TRADE AND OTHER PAYABLES
Tax depreciation allowanceTax on investment in associateSurplus on revaluation of operating fixed assets
Unused tax losses
Creditors (Note 9.1)Accrued liabilitiesAdvances from customersRetention money payableIncome tax deducted at sourceSales tax deducted at sourceUnclaimed dividend Payable to Employees' Provident Fund TrustWorkers' profit participation fund (Note 9.2)Other payables
8.
9.
- - - -
- -
566,740 392,689
35,323 557
3,687 4,615 6,788
145 12,429
2,546 1,025,519
137,279
6,853 302
144,434
(112,193) 32,241
594,979 550,724
8,297 2,542 2,555 3,947 9,363
- 14,559
4,209 1,191,175
2 0 1 5A n n u a l R e p o r t68
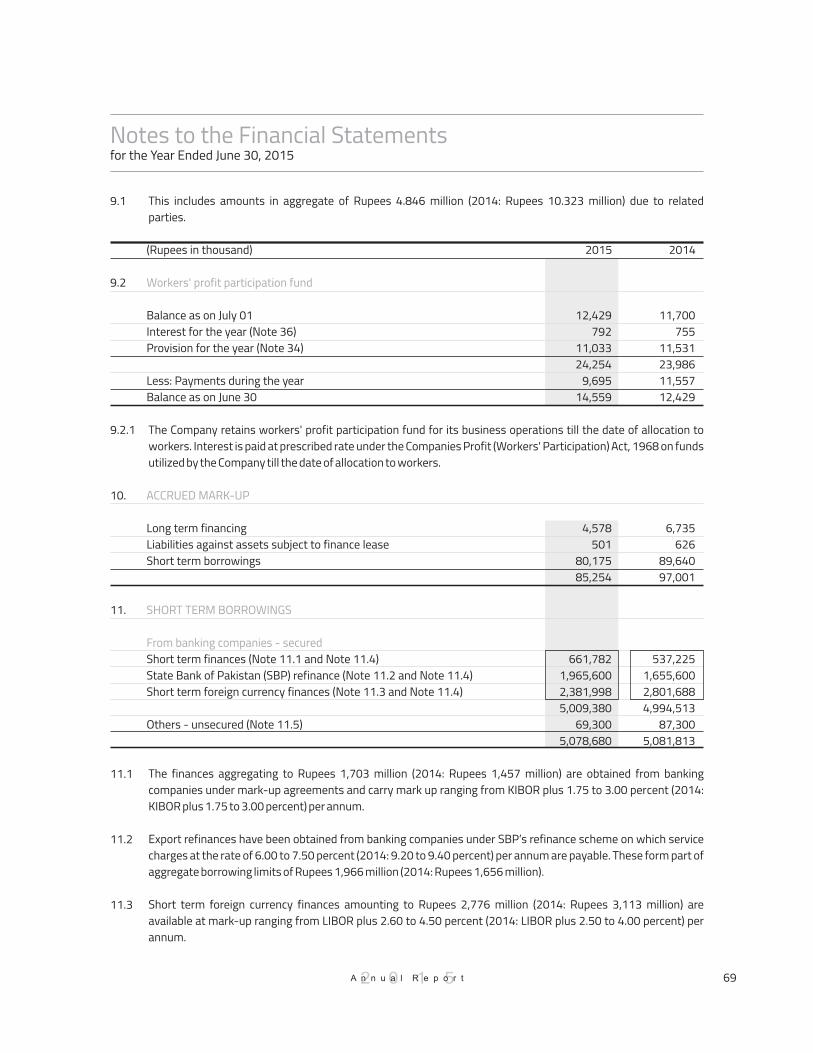
Notes to the Financial Statementsfor the Year Ended June 30, 2015
2015 2014(Rupees in thousand)
The Company retains workers' profit participation fund for its business operations till the date of allocation to workers. Interest is paid at prescribed rate under the Companies Profit (Workers' Participation) Act, 1968 on funds utilized by the Company till the date of allocation to workers.
9.2.1
12,429 792
11,033 24,254
9,695 14,559
Workers' profit participation fund
Balance as on July 01Interest for the year (Note 36)Provision for the year (Note 34)
Less: Payments during the yearBalance as on June 30
9.2
11,700 755
11,531 23,986 11,557 12,429
4,578 501
80,175 85,254
661,782 1,965,600 2,381,998 5,009,380
69,300 5,078,680
ACCRUED MARK-UP
SHORT TERM BORROWINGS
From banking companies - secured
Long term financingLiabilities against assets subject to finance leaseShort term borrowings
Short term finances (Note 11.1 and Note 11.4)State Bank of Pakistan (SBP) refinance (Note 11.2 and Note 11.4)Short term foreign currency finances (Note 11.3 and Note 11.4)
Others - unsecured (Note 11.5)
10.
11.
6,735 626
89,640 97,001
537,225 1,655,600 2,801,688 4,994,513
87,300 5,081,813
The finances aggregating to Rupees 1,703 million (2014: Rupees 1,457 million) are obtained from banking companies under mark-up agreements and carry mark up ranging from KIBOR plus 1.75 to 3.00 percent (2014: KIBOR plus 1.75 to 3.00 percent) per annum.
Export refinances have been obtained from banking companies under SBP’s refinance scheme on which service charges at the rate of 6.00 to 7.50 percent (2014: 9.20 to 9.40 percent) per annum are payable. These form part of aggregate borrowing limits of Rupees 1,966 million (2014: Rupees 1,656 million).
Short term foreign currency finances amounting to Rupees 2,776 million (2014: Rupees 3,113 million) are available at mark-up ranging from LIBOR plus 2.60 to 4.50 percent (2014: LIBOR plus 2.50 to 4.00 percent) per annum.
11.1
11.2
11.3
2 0 1 5A n n u a l R e p o r t
This includes amounts in aggregate of Rupees 4.846 million (2014: Rupees 10.323 million) due to related parties.
9.1
69

Notes to the Financial Statementsfor the Year Ended June 30, 2015
The aggregate short term finances from banking companies are secured by way of joint pari passu charge over fixed and current assets of the Company.
This represents loan obtained from Crescent Model Farm which is repayable on demand. It carries mark-up at the rate of one month KIBOR plus 1.50 percent per annum (2014: one month KIBOR plus 1.50 percent).
11.4
11.5
2015 2014(Rupees in thousand)
79,173 32,622
111,795
CURRENT PORTION OF NON-CURRENT LIABILITIES
Current portion of long term financing (Note 6)Current portion of liabilities against assets subject to finance lease (Note 7)
12.
130,35133,753
164,104
CONTINGENCIES AND COMMITMENTS13.
Contingencies
Commitments
Guarantees of Rupees 149.784 million (2014: Rupees 149.784 million) are given by the banks of the Company to Sui Northern Gas Pipelines Limited against gas connections and Faisalabad Electric Supply Company against electricity connections.
Post dated cheques of Rupees 75.729 million (2014: Rupees 69.020 million) are issued to custom authorities in respect of duties on imported materials availed on the basis of consumption and export plans. If documents of exports are not provided on due dates, cheques issued as security shall be encashable.
The Company is contingently liable to the extent of Rupees 179.463 million (2014: Rupees 179.463 million) as its share of contingent liabilities of its associate.
The Company has filed appeal with Appellate Tribunal Inland Revenue for the revision of assessment order issued under section 122(5A) of the Income Tax Ordinance, 2001 for the tax year 2008. In case of adverse decision, the Company may face tax liability of Rupees 40.691 million (2014: Rupees 40.691 million). The Company's management is confident that appeal is likely to succeed.
Commissioner Inland Revenue has filed appeals with Honourable Supreme Court of Pakistan for the recovery of sales tax liabilities on account of various provisions of Sales Tax Act, 1990. In case of adverse decision, the Company may face tax liability of Rupees 16.673 million (2014: Rupees 16.673 million). The Company's management is confident that appeals are likely to be dismissed.
Contracts for capital expenditure are of Rupees 104.951 million (2014: Rupees 47.040 million).
Letters of credit other than for capital expenditure are of Rupees 144.275 million (2014: Rupees 110.468 million).
a)
i)
ii)
iii)
iv)
v)
b)
i)
ii)
2 0 1 5A n n u a l R e p o r t70

Notes to the Financial Statementsfor the Year Ended June 30, 2015
Ijarah (operating lease) commitments - Company as lessee
The Company obtained vehicles under ijarah (operating lease) agreement. The lease terms are of three years. The Company has given undertaking to purchase the leased vehicles on agreed purchase price at maturity.
The future aggregate minimum lease payments under ijarah (operating lease) are as follows:
iii)
2015 2014(Rupees in thousand)
Not later than one yearLater than one year and not later than five years
871 562
1,433
1,733918
2,651
PROPERTY, PLANT AND EQUIPMENT
Operating fixed assets (Note 14.1) -Owned -LeasedCapital work-in-progress (Note 14.2)
14.
3,926,969 114,027
98,634 4,139,630
4,027,320 126,697
21,579 4,175,596
2 0 1 5A n n u a l R e p o r t 71

Operating fixed assets14.1
Notes to the Financial Statementsfor the Year Ended June 30, 2015
At June 30, 2013
Year ended June 30, 2014
At June 30, 2014
Year ended June 30, 2015
At June 30, 2015
Cost / revalued amountAccumulated depreciationNet book value
Opening net book value AdditionsDisposals: Cost / revalued amount Accumulated depreciation
Write offs: Cost / revalued amount Accumulated depreciation
Depreciation chargeClosing net book value
Cost / revalued amountAccumulated depreciationNet book value
Opening net book value AdditionsClassified as non-currentasset held for saleDisposals: Cost Accumulated depreciation
Depreciation chargeClosing net book value
Cost / revalued amountAccumulated depreciationNet book valueAnnual rate of depreciation (%)
2,302,170 -
2,302,170
2,302,170 -
- - -
- - - -
2,302,170
2,302,170 -
2,302,170
2,302,170 -
(84,318)
- - - -
2,217,852
2,217,852 -
2,217,852 -
7,133 (1,133)
6,000
6,000 -
- - -
- - -
(77) 5,923
7,133 (1,210)
5,923
5,923 -
-
- - -
(77) 5,846
7,133 (1,287)
5,846 1.01
339,793 (222,582)
117,211
117,211 -
(4,030) 3,289 (741)
- - -
(9,720) 106,750
335,763 (229,013)
106,750
106,750 12,637
-
- - -
(9,044) 110,343
348,400 (238,057)
110,343 5, 10
49,431 (36,950)
12,481
12,481 -
- - -
- - -
(1,220) 11,261
49,431 (38,170)
11,261
11,261 28,936
-
- - -
(2,064) 38,133
78,367 (40,234)
38,133 5, 10
4,486,303 (2,665,276)
1,821,027
1,821,027 52,939
(438,902) 288,082
(150,820)
(2,151) 1,709 (442)
(177,679) 1,545,025
4,098,189 (2,553,164)
1,545,025
1,545,025 104,763
-
(13,914) 11,089 (2,825)
(156,462) 1,490,501
4,189,038 (2,698,537)
1,490,501 10
20,571 (14,780)
5,791
5,791 -
- - -
- - -
(1,158) 4,633
20,571 (15,938)
4,633
4,633 500
-
- - -
(988) 4,145
21,071 (16,926)
4,145 20
64,440 (38,276)
26,164
26,164 507
- - -
(29) 27 (2)
(5,278) 21,391
64,918 (43,527)
21,391
21,391 5,777
-
- - -
(4,436) 22,732
70,695 (47,963)
22,732 20
6,182 (4,809)
1,373
1,373 -
- - -
(37) 35 (2)
(274) 1,097
6,145 (5,048)
1,097
1,097 -
-
- - -
(219) 878
6,145 (5,267)
878 20
25,464 (23,229)
2,235
2,235 1,483
- - -
- - -
(1,286) 2,432
26,947 (24,515)
2,432
2,432 2,675
-
(2,685) 2,683
(2) (1,732)
3,373
26,937 (23,564)
3,373 50
113,523 (101,282)
12,241
12,241 -
- - -
- - -
(1,224) 11,017
113,523 (102,506)
11,017
11,017 -
-
- - -
(1,102) 9,915
113,523 (103,608)
9,915 10
7,465,739 (3,138,608)
4,327,131
4,327,131 54,929
(446,414) 294,034
(152,380)
(2,217) 1,771 (446)
(201,914) 4,027,320
7,072,037 (3,044,717)
4,027,320
4,027,320 170,409
(84,318)
(28,784) 22,493 (6,291)
(180,151) 3,926,969
7,129,344 (3,202,375)
3,926,969
164,747 (23,973) 140,774
140,774 -
- - -
- - -
(14,077) 126,697
164,747 (38,050) 126,697
126,697 -
-
- - -
(12,670) 114,027
164,747 (50,720) 114,027
10
50,729 (30,291)
20,438
20,438 -
(3,482) 2,663 (819)
- - -
(3,998) 15,621
47,247 (31,626)
15,621
15,621 15,121
-
(12,185) 8,721
(3,464) (4,027) 23,251
50,183 (26,932)
23,251 20
Land-Freehold
Land-Leasehold
Buildings onfreehold land
Buildings onleasehold land
Plant andmachinery
Factory toolsand
equipment
Gas andelectric
InstallationsVehicles Stand-by
equipmentTotalOffice
equipment
Furnitureand
fixtures
Plant andmachinery
Leased AssetsOwned Assets
(Rupees in thousand)
2 0 1 5A n n u a l R e p o r t72

Notes to the Financial Statementsfor the Year Ended June 30, 2015
The land of the Company, except the land situated at Faisalabad, had been revalued as on June 30, 2013 using the present market value at Rupees 95.600 million. Whereas the land situated at Faisalabad granted to the Company by the Government of Punjab in 1958 under Land Acquisition Act, 1894 for the specific purpose of using it as an industrial undertaking had been revalued at Rupees 2,212.570 million taking into account conditions specified under various directives of the Government by an independent valuer, Messrs Hamid Mukhtar and Company (Private) Limited. The Company had revalued this land based on the advice from its legal counsel. Previously land of the Company, except the land situated at Faisalabad was revalued on June 30, 2007 at Rupees 62 million and the land situated at Faisalabad at Rupees 1,597 million by Messrs Hamid Mukhtar and Company (Private) Limited.
Fixed assets of the Company with carrying amount of Rupees 3,904 million (2014: Rupees 4,012 million) are subject to first pari passu charge to secured bank borrowings.
If the freehold land and leasehold land were measured using the cost model, the carrying amount would be as follows:
14.1.1
14.1.2
14.1.3
2015 2014Cost Net book
valueCost Accumulated
depreciationNet book
value
(Rupees in thousand)
13,403 3,644
17,047
5,771 3,596 9,367
- 1,075 1,075
- 1,1231,123
13,403 4,719
18,122
5,771 4,719
10,490
Land - FreeholdLand - Leasehold
Depreciation charge for the year has been allocated as follows:14.1.4
2015 2014(Rupees in thousand)
171,440 12,670
184,110 8,711
192,821
Cost of sales (Note 31) -Owned assets -Leased assets
Administrative expenses (Note 33)
193,267 14,077
207,344 8,647
215,991
Accumulateddepreciation
2 0 1 5A n n u a l R e p o r t 73

Detail of operating fixed assets, exceeding the book value of Rupees 50,000 disposed of during the year is as follows:14.1.5
Notes to the Financial Statementsfor the Year Ended June 30, 2015
(Rupees in thousand)
Accumulateddepreciation
Net bookvalue
SaleproceedsCostQtyDescription Mode of disposal Particulars of purchasers
Genkiner fabric beamliftersCombersGenkiner fabricbeam lifters
Suzuki Mehran
Suzuki Cultus
Suzuki Cultus
Suzuki BolanSuzuki BolanHonda Civic
Toyota CorollaHonda CivicHonda Civic
Honda Civic
Honda Civic
Aggregate of otheritems of property,plant and equipmentwith individual bookvalues not exceedingRupees 50,000
Plant and Machinery
Vehicles
24
1
1
1
1
111
111
1
1
1,693 4,467
380 6,540
504
878
91
367 437
1,722
1,205 1,245 1,807
1,947
1,982
12,185
10,059
28,784
943 3,644
215
4,802
335
514
2
311 338
1,322
941 1,150 1,303
1,255
1,250
8,721
8,970 22,493
750 823
165 1,738
169
364
89
56 99
400
264 95
504
692
732
3,464
1,089 6,291
1,000
860
250 2,110
322
528
560
365 475
1,150
885 780 960
994
994
8,013
2,037
12,160
NegotiationNegotiation
Negotiation
Company Policy
Company Policy
Company Policy
NegotiationNegotiationCompany Policy
NegotiationNegotiationCompany Policy
Company Policy
Company Policy
Rizwan Enterprises.Adnan Idrees
Maksons Textile (Pvt) Ltd
Mr. Anwar Naseem,Company EmployeeMr. Ilyas Tahir,Company EmployeeMr. Shuakat Nazar,Company EmployeeMr. Abdul RehmanMr. ZubairMr. Sohail Maqbool,Company EmployeeMr. Sheikh Muhammad MuslimMrs. Sumera ButtMr. Tahir Rasheed,Company EmployeeMr. Shuakat Nazar,Company EmployeeMr. Sadiq Saleem,Company Employee
2 0 1 5A n n u a l R e p o r t74

Notes to the Financial Statementsfor the Year Ended June 30, 2015
Capital work-in-progress
INVESTMENT IN ASSOCIATE
Crescent Bahuman Limited - unquoted
Associate's balance sheet:
Buildings on freehold landBuildings on leasehold landPlant and machineryGas and electric installationsAdvance against vehicle
26 926 433 (2014: 26 926 433) ordinary shares ofRupees 10 each (Note 15.1)Share of post acquisition reserve:As at 01 JulyShare of profit / (loss) after income taxAs at 30 June
Current assetsNon-current assetsCurrent liabilitiesNon-current liabilitiesNet assetsAssociate's revenue and profit / (loss):RevenueProfit / (loss) before taxation for the yearProfit / (loss) after taxation for the year
14.2
15.
10,069 10,815
- -
695 21,579
269,264
88,980 (47,521)
41,459 310,723
5,944,136 4,003,058
(6,983,468) (1,279,717)
1,684,009
7,808,389 (67,786)
(144,046)
2015 2014(Rupees in thousand)
Restated(Rupees in thousand) 20142015
The Company holds 32.99% (2014: 32.99%) interest in Crescent Bahuman Limited (CBL), an unquoted public limited company involved in manufacturing of textile products. The summarized financial information of CBL is as follows:
15.1
(Rupees in thousand) Audited2014
Un-Audited2015
55,190 1,461
20,286 21,697
- 98,634
269,264
41,459 27,070 68,529
337,793
6,351,822 3,861,693
(7,249,613) (1,197,838)
1,766,064
8,314,315 118,448
82,055
2 0 1 5A n n u a l R e p o r t 75
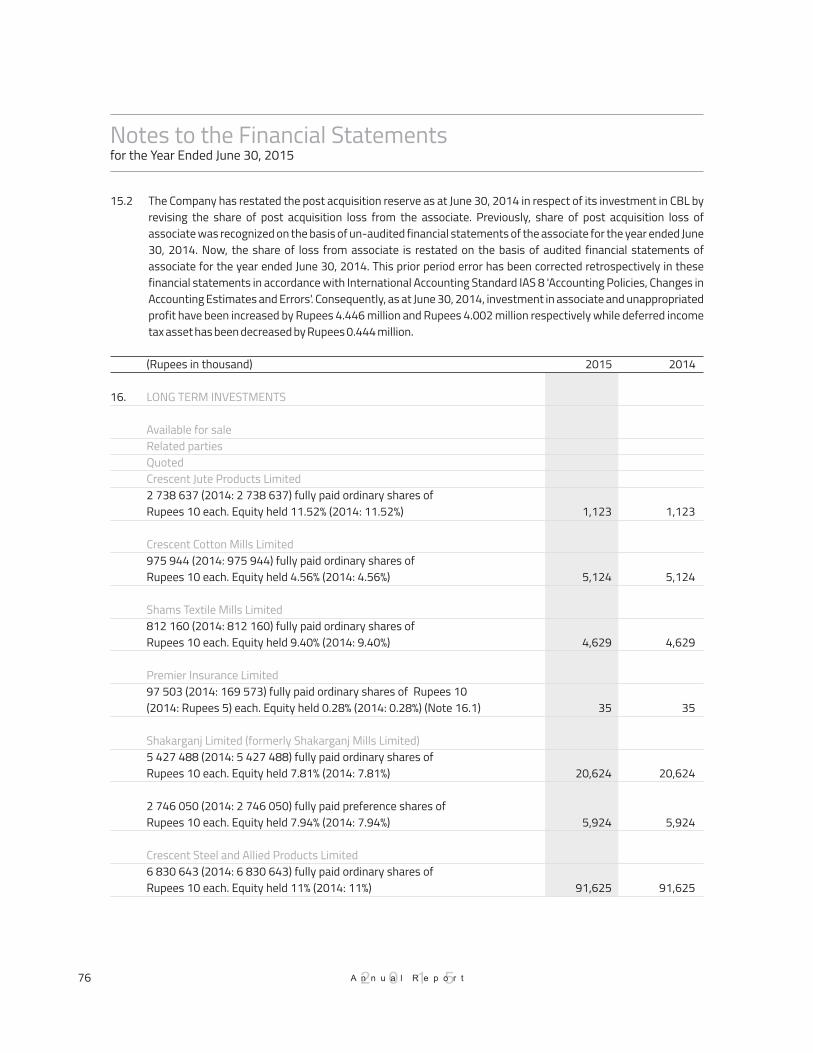
The Company has restated the post acquisition reserve as at June 30, 2014 in respect of its investment in CBL by revising the share of post acquisition loss from the associate. Previously, share of post acquisition loss of associate was recognized on the basis of un-audited financial statements of the associate for the year ended June 30, 2014. Now, the share of loss from associate is restated on the basis of audited financial statements of associate for the year ended June 30, 2014. This prior period error has been corrected retrospectively in these financial statements in accordance with International Accounting Standard IAS 8 'Accounting Policies, Changes in Accounting Estimates and Errors'. Consequently, as at June 30, 2014, investment in associate and unappropriated profit have been increased by Rupees 4.446 million and Rupees 4.002 million respectively while deferred income tax asset has been decreased by Rupees 0.444 million.
15.2
16.
1,123
5,124
4,629
35
20,624
5,924
91,625
2 738 637 (2014: 2 738 637) fully paid ordinary shares ofRupees 10 each. Equity held 11.52% (2014: 11.52%)
975 944 (2014: 975 944) fully paid ordinary shares of Rupees 10 each. Equity held 4.56% (2014: 4.56%)
812 160 (2014: 812 160) fully paid ordinary shares ofRupees 10 each. Equity held 9.40% (2014: 9.40%)
97 503 (2014: 169 573) fully paid ordinary shares of Rupees 10(2014: Rupees 5) each. Equity held 0.28% (2014: 0.28%) (Note 16.1)
5 427 488 (2014: 5 427 488) fully paid ordinary shares of Rupees 10 each. Equity held 7.81% (2014: 7.81%)
2 746 050 (2014: 2 746 050) fully paid preference shares of Rupees 10 each. Equity held 7.94% (2014: 7.94%)
6 830 643 (2014: 6 830 643) fully paid ordinary shares of Rupees 10 each. Equity held 11% (2014: 11%)
LONG TERM INVESTMENTS
Available for saleRelated partiesQuotedCrescent Jute Products Limited
Crescent Cotton Mills Limited
Shams Textile Mills Limited
Premier Insurance Limited
Shakarganj Limited (formerly Shakarganj Mills Limited)
Crescent Steel and Allied Products Limited
1,123
5,124
4,629
35
20,624
5,924
91,625
2015 2014(Rupees in thousand)
Notes to the Financial Statementsfor the Year Ended June 30, 2015
2 0 1 5A n n u a l R e p o r t76

Notes to the Financial Statementsfor the Year Ended June 30, 2015
2015 2014(Rupees in thousand)
1,976,000
500
213
2,162
41,9982,149,957
(41,998)433,422
2,541,381
UnquotedCrescent Bahuman Limited
Premier Financial Services (Private) Limited
OthersQuotedJubilee Spinning and Weaving Mills Limited
Crescent Fibres Limited
UnquotedCresox (Private) Limited
197 600 000 (2014: 197 600 000) fully paid preference shares of Rupees 10 each. Equity held 73.37% (2014: 73.37%) (Note 16.2)
500 (2014: 500) fully paid ordinary shares ofRupees 1,000 each. Equity held 2.22% (2014: 2.22%)
182 629 (2014: 182 629) fully paid ordinary shares of Rupees 10 each. Equity held 0.56% (2014: 0.56%)
351 657 (2014: 351 657) fully paid ordinary shares of Rupees 10 each. Equity held 2.83% (2014: 2.83%)
4 199 792 (2014: 4 199 792) fully paid ordinary shares of Rupees 10 each. Equity held 11.66% (2014: 11.66%)
Less: Impairment loss recognized on investment in Cresox (Private) Limited (Note 34)Add: Fair value adjustment
1,976,000
500
213
2,162
41,9982,149,957
-389,787
2,539,744
Premier Insurance Limited in its Annual General Meeting (AGM) held on April 29, 2014 approved the consolidation of its share capital by increasing its face value of shares from Rupees 5 per share to Rupees 10 per share. Therefore the number of shares held by the Company has been reduced.
This represents 5 % unlisted, non-voting, cumulative and participatory preference shares issued by Crescent Bahuman Limited. These preference shares are convertible into non-voting ordinary shares.
16.1
16.2
2 0 1 5A n n u a l R e p o r t 77

Notes to the Financial Statementsfor the Year Ended June 30, 2015
2015 2014(Rupees in thousand)
5,6151,9513,664
LONG TERM LOANS AND ADVANCES
Considered good - secured:EmployeesLess: Current portion shown under current assets (Note 23)
5,087 1,778 3,309
17.
5,466 -
5,466 -
5,466
----
--
LONG TERM DEPOSITS AND PREPAYMENTS
DEFERRED INCOME TAX ASSET
Taxable temporary differences
Deductible temporary differences
Security depositsPrepayments
Less: Current portion shown under current assets (Note 24)
Tax depreciation allowanceTax on investment in associateSurplus on revaluation of operating fixed assets
Unused tax losses
7,256 49
7,305 39
7,266
(124,126) (4,146)
(278) (128,550)
130,330 1,780
18.
19.
These represent Qarz-e-Hasna given to employees and are secured against balance to the credit of employees in the provident fund trust. These are recoverable in equal monthly installments.
The fair value adjustment in accordance with the requirements of IAS 39 'Financial Instruments: Recognition and Measurement' arising in respect of staff loans is not considered material and hence not recognized.
17.1
17.2
Restated(Rupees in thousand) 20142015
2 0 1 5A n n u a l R e p o r t78

STORES, SPARE PARTS AND LOOSE TOOLS
STOCK-IN-TRADE
TRADE DEBTS
Considered good:
Stores (Note 20.1)Spare partsLoose tools
These include stores in transit of Rupees 9.550 million (2014: Rupees 10.998 milliion).
Raw materials (Note 21.1)Work-in-processFinished goods (Note 21.2)Waste
Raw materials include stock in transit of Rupees 28.743 million (2014: Rupees 120.034 million).Finished goods include stock in transit of Rupees 94.204 million (2014: Rupees 103.843 million).Stock-in-trade of Rupees 8.267 million (2014: Rupees 335.063 million) is being carried at net realizable value.The aggregate amount of write-down of inventories to net realizable value recognized as an expenseduring the year was Rupees Nil (2014: Rupees 30.253 million).
Secured (against letters of credit)Unsecured (Note 22.2)
146,930 9,536
67 156,533
239,268122,937
1,120,2017,184
1,489,590
148,8882,099,3992,248,287
20.
20.1
21.
21.121.221.321.4
22.
Notes to the Financial Statementsfor the Year Ended June 30, 2015
2015 2014(Rupees in thousand)
Considered doubtful:
Others - unsecuredLess: Provision for doubtful debts As at July 01 Provision made during the year (Note 34) As at June 30
41,203
26,07815,12541,203
-
41,203
41,203 -
41,203 -
2 0 1 5A n n u a l R e p o r t 79
161,115 15,794
82 176,991
199,078 102,549
1,027,630 8,267
1,337,524
355,166 2,211,541 2,566,707

Notes to the Financial Statementsfor the Year Ended June 30, 2015
As at June 30, 2015, trade debts due from other than related parties of Rupees 631.242 million (2014: Rupees 472.612 million) were past due but not impaired. These relate to a number of independent customers from whom there is no recent history of default. The ageing analysis of these trade debts is as follows:
22.1
It includes amount receivable from a related party, Crescent Bahuman Limited, amounting to Rupees 639.797 million (2014: Rupees 443.071 million).
As at June 30, 2015, trade debts due from related party amounting to Rupees 539.632 million (2014: Rupees 438.080 million) were past due but not impaired. The Company is charging mark up on all overdue balances receivable from Crescent Bahuman Limited. The ageing analysis of these trade debts is as follows:
22.2
22.2.1
241,548 320,720
68,974 631,242
Upto 1 month1 to 6 monthsMore than 6 months
210,252 152,370 109,990 472,612
10,955 38,911
489,766 539,632
Upto 1 month1 to 6 monthsMore than 6 months
9,918 49,107
379,055 438,080
As at June 30, 2015, trade debts of Rupees 41.203 million (2014: Rupees 41.203 million) were impaired and provided for. The ageing of these trade debts was more than three years. These trade debts do not include amounts due from related parties.
22.3
99 1,951
31,932 974
383,331 418,287
LOANS AND ADVANCES
Considered good:Employees - interest freeCurrent portion of long term loans and advances (Note 17)Advances to suppliers Letters of creditIncome tax
84 1,778
12,156 262
350,025 364,305
23.
2015 2014(Rupees in thousand)
Considered doubtful:
Advances to suppliers Less: Provision for doubtful loans and advances As at July 01 Provision made during the year (Note 34) As at June 30
589
- 589 589
-
589
589 -
589 -
2 0 1 5A n n u a l R e p o r t80

Notes to the Financial Statementsfor the Year Ended June 30, 2015
2015 2014(Rupees in thousand)
SHORT TERM DEPOSITS AND PREPAYMENTS
Considered good:
OTHER RECEIVABLES
Considered good:
Considered doubtful:
This represents amounts due from following related parties:
Margin depositShort term prepaymentsCurrent portion of long term deposits and prepayments (Note 18)
Due from related parties (Note 26.1)Export rebate and claimsSales tax and special excise duty refundableDividend receivable from related partiesMiscellaneous
Export rebate, sales tax and special excise duty refundableLess: Provision for doubtful debts As at July 01 Add: Provision made during the year (Note 34) Less: Provision written off during the year As at June 30
Premier Insurance LimitedShams Textile Mills LimitedShakarganj Limited (formerly Shakarganj Mills Limited)Employees' Provident Fund Trust
19,129 1,289
39 20,457
33,123 38,947
126,295 370,500
1,965 570,830
46,539
20,018 26,521
- 46,539
-
33,086 32
5 -
33,123
24.
26.
26.1
21,029 1,772
- 22,801
1,123 61,226
211,557 469,300
775 743,981
41,744
46,539 -
4,795 41,744
-
- - -
1,123 1,123
ACCRUED INTEREST
This includes interest receivable from the associate, Crescent Bahuman Limited on overdue receivable balance.
25.
2 0 1 5A n n u a l R e p o r t 81

Notes to the Financial Statementsfor the Year Ended June 30, 2015
SHORT TERM INVESTMENTS
Available for saleOthers - quoted
CASH AND BANK BALANCES
With banks:
SALES
Local
Samba Bank Limited 12 346 238 (2014: 12 346 238) paid ordinary shares ofRupees 10 each. Equity held 1.22% (2014: 1.22%)Add: Fair value adjustment
On current accounts Including US$ 7,009 (2014: US$ 4,335)Cash in hand
Local (Note 30.1)Export (Note 30.2)Export rebateDuty drawback
SalesWasteProcessing incomeCold storage
Less: Sales tax
27.
28.
30.
30.1
37 ,444 44,782 82,226
37,444 28,608 66,052
2015 2014(Rupees in thousand)
5,915 1,020 6,935
5,728,761 6,624,095
41,978 16,663
12,411,497
5,558,959 206,253
70,527 13,118
5,848,857 120,096
5,728,761
4,594 601
5,195
4,635,365 7,107,705
49,834 41,871
11,834,775
4,562,204 156,072
3,562 15,566
4,737,404 102,039
4,635,365
Freehold land of the Company situated at Pindi Bhattian having measurement of approximately 107 acres has been classified as held for sale following the approval of the management of the Company and shareholders in the AGM of the Company held on October 30, 2014. The Company is in the process to undertake all necessary steps including negotiation and signing of documents required to complete this transaction and it is expected to be completed during the next financial year.
29.
2 0 1 5A n n u a l R e p o r t82
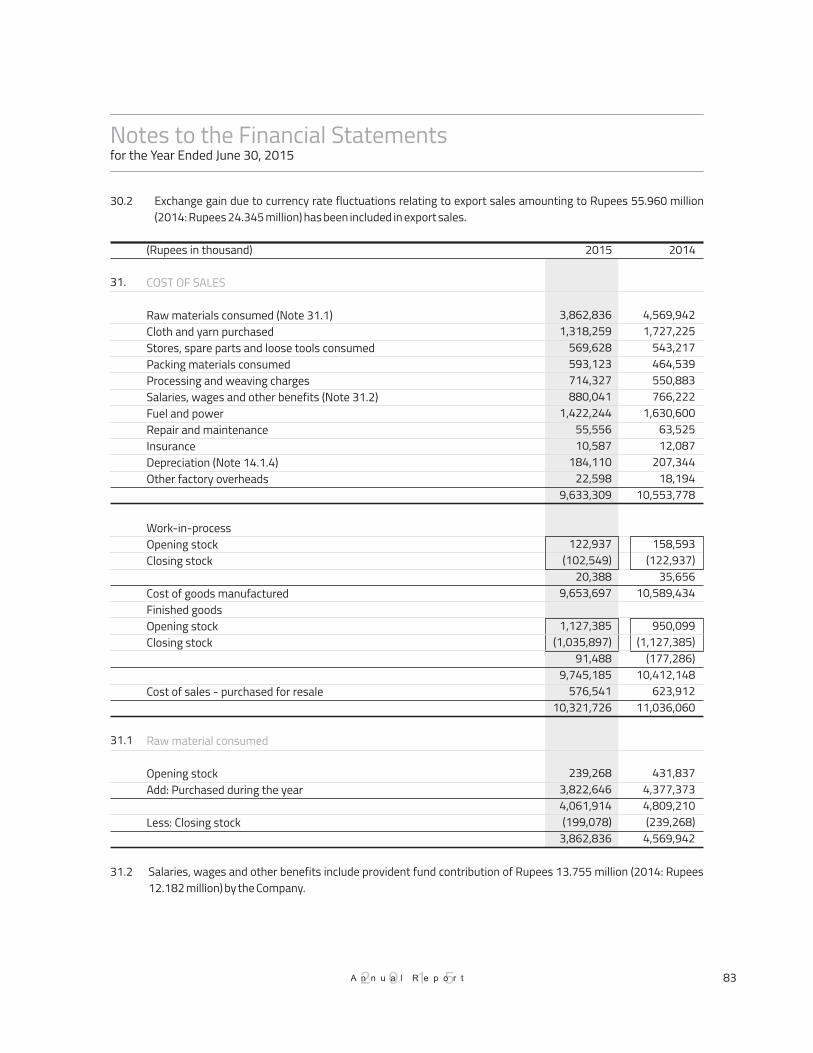
Notes to the Financial Statementsfor the Year Ended June 30, 2015
30.2 Exchange gain due to currency rate fluctuations relating to export sales amounting to Rupees 55.960 million (2014: Rupees 24.345 million) has been included in export sales.
2015 2014(Rupees in thousand)
COST OF SALES
Raw material consumed
Raw materials consumed (Note 31.1)Cloth and yarn purchasedStores, spare parts and loose tools consumedPacking materials consumedProcessing and weaving chargesSalaries, wages and other benefits (Note 31.2)Fuel and powerRepair and maintenanceInsuranceDepreciation (Note 14.1.4)Other factory overheads
Work-in-processOpening stockClosing stock
Cost of goods manufacturedFinished goodsOpening stockClosing stock
Cost of sales - purchased for resale
Opening stockAdd: Purchased during the year
Less: Closing stock
4,569,942 1,727,225
543,217 464,539 550,883 766,222
1,630,600 63,525 12,087
207,344 18,194
10,553,778
158,593 (122,937)
35,656 10,589,434
950,099 (1,127,385)
(177,286) 10,412,148
623,912 11,036,060
431,837 4,377,373 4,809,210 (239,268)
4,569,942
31.
31.1
3,862,836 1,318,259
569,628 593,123 714,327 880,041
1,422,244 55,556 10,587
184,110 22,598
9,633,309
122,937 (102,549)
20,388 9,653,697
1,127,385 (1,035,897)
91,488 9,745,185
576,541 10,321,726
239,268 3,822,646 4,061,914 (199,078)
3,862,836
Salaries, wages and other benefits include provident fund contribution of Rupees 13.755 million (2014: Rupees 12.182 million) by the Company.
31.2
2 0 1 5A n n u a l R e p o r t 83

Notes to the Financial Statementsfor the Year Ended June 30, 2015
32.1
2015 2014(Rupees in thousand)
DISTRIBUTION COST
ADMINISTRATIVE EXPENSES
Auditors' remuneration:
Salaries, wages and other benefits (Note 32.1)Freight and shipmentDuties and other chargesCommission to selling agentsAdvertisement
Salaries, wages and other benefits (Note 33.1)Meeting fee to non-executive directorsTraveling, conveyance and entertainmentRent, rates and taxes (Note 33.2)Repair and maintenanceInsurancePrinting and stationeryCommunicationSubscriptionLegal and professional Auditors' remuneration (Note 33.3)Software maintenance Amortization Depreciation (Note 14.1.4)Other charges
Audit feeHalf yearly reviewReimbursable expenses
25,296 154,185
91,981 338,840
458 610,760
112,123 770
15,213 6,169
17,273 1,736 1,967 2,989 7,056 6,092 1,330 1,587 1,900 8,647
10,701 195,553
1,100 200 30
1,330
32.
33.
33.3
33,759 179,335 106,288 327,604
1,398 648,384
155,922 660
14,205 4,503
19,558 1,207 2,191 2,881 6,183 6,306 1,330
804 -
8,711 9,325
233,786
1,100 200 30
1,330
Salaries, wages and other benefits include provident fund contribution of Rupees 1.157 million (2014: Rupees 0.931 million) by the Company.
33.1
33.2
Salaries, wages and other benefits include provident fund contribution of Rupees 4.764 million (2014: Rupees 3.699 million) by the Company.
This includes ijarah (operating lease) rentals amounting to Rupees 1.909 million (2014: Rupees 4.295 million) of vehicles.
2 0 1 5A n n u a l R e p o r t84

Notes to the Financial Statementsfor the Year Ended June 30, 2015
2015 2014(Rupees in thousand)
OTHER EXPENSES
OTHER INCOME
Income from financial assets
Income from non-financial assets
Dividend income
From related parties:
From others:
Donations (Note 34.1)Provision for doubtful debts (Note 22)Provision for doubtful loans and advances (Note 23)Provision for doubtful rebate, sales tax andspecial excise duty refundable (Note 26)Workers' profit participation fund (Note 9.2)Impairment loss on long term investment (Note 16)Property, plant and equipment written off
There is no interest of any director or his spouse in donees’ fund.
Dividend income (Note 35.1)Profit on sale of right offerMark-up on loans and advances (Note 35.2)
Sale of empties and scrapRental incomeGain on sale of property, plant and equipmentSundry receipts
Crescent Bahuman Limited-Preference dividend Premier Insurance Limited Crescent Steel and Allied Products Limited Shams Textile Mills Limited Crescent Cotton Mills Limited
Crescent Fibres Limited
12,375 15,125
589
26,521 11,531
- 446
66,587
118,078 1,010
48,502 167,590
19,265 796
173,066 10
193,137 360,727
98,800 170
16,145 2,436
- 117,551
527 118,078
34.
34.1
35.
35.1
9,794 - -
- 11,033 41,998
- 62,825
111,434 -
59,039 170,473
16,086 763
5,869 121
22,839 193,312
98,800 85
10,246 -
1,952 111,083
351 111,434
2 0 1 5A n n u a l R e p o r t 85

37.1
37.2
Provision for current taxation represents the tax deducted against export sales, minimum tax on local sales and tax on different heads of other income under the relevant provisions of the Income Tax Ordinance, 2001. Tax losses available as at June 30, 2015 are Rupees 350.604 million (2014: Rupees 394.939 million). Reconciliation of tax expenses and product of accounting profit multiplied by the applicable tax rate is not presented, being impracticable.
Under Section 5A of the Income Tax Ordinance, 2001, introduced through the Finance Act, 2015, the Company is required to pay tax at the rate of 10% of so much of its undistributed profits as exceed 100% of its paid up capital unless it distributes profits equal to 40% of its after tax profits or 50% of its paid up capital, whichever is less, by due date for filing of income tax return for the tax year 2015. The requisite cash dividend has been proposed by the Board of Directors of the Company in their meeting held on October 03, 2015 and will be distributed within the prescribed time limit. Therefore, the recognition of any income tax liability in this respect is not considered necessary.
Notes to the Financial Statementsfor the Year Ended June 30, 2015
FINANCE COST
Mark up on:
TAXATION
Long term financing Liabilities against assets subject to finance lease Short term borrowingsInterest on workers' profit participation fund (Note 9.2)Bank charges and commission
Charge for the year: Current (Note 37.1) Prior year adjustment
Deferred (Note 37.3)
27,665 11,659
423,154 755
9,086 472,319
122,353 (63,299)
59,054 45,351
104,405
36.
37.
21,247 7,725
391,065 792
7,685 428,514
104,294 (49)
104,245 33,983
138,228
36.1
36.2
Net gain on fair value of derivative financial instruments amounting to Rupees 23.435 million (2014: Rupees 21.494 million) is adjusted against finance cost.
Exchange loss on foreign currency loans of the Company amounting to Rupees 88.873 million (2014: Exchange gain of Rupees 44.603 million) is adjusted against finance cost.
2015 2014(Rupees in thousand)
35.2 This relates to markup charged on overdue receivables from Crescent Bahuman Limited (an associate).
2 0 1 5A n n u a l R e p o r t86
2015 2014Restated
(Rupees in thousand)

Notes to the Financial Statementsfor the Year Ended June 30, 2015
Restated(Rupees in thousand) 20142015
Deferred income tax effect due to:
Tax depreciation allowanceUnused tax lossesTax on investment in associateSurplus on revaluation of operating fixed assets
Opening balance as at July 01,Related to surplus on revaluation of operating fixed assets
124,126 (130,330)
4,146 278
(1,780) 47,185
(54) 45,351
37.3
137,279 (112,193)
6,853 302
32,241 1,780
(38) 33,983
EARNINGS PER SHARE - BASIC AND DILUTED
CASH GENERATED FROM OPERATIONS
Profit before taxation
Adjustments for non-cash charges and other items:
There is no dilutive effect on the basic earningsper share which is based on:Profit attributable to ordinary shareholders (Rupees in thousand)Weighted average number of ordinary shares (Numbers)Earnings per share (Rupees)
Depreciation AmortizationGain on sale of property, plant and equipmentDividend incomeImpairment loss on long term investmentProvision for doubtful debts Provision for doubtful loans and advancesProvision for doubtful rebate, sales tax andspecial excise duty refundableProvision for workers' profit participation fundShare of (profit) / loss from associateFinance costProperty, plant and equipment written offWorking capital changes (Note 39.1)
239,019 51 065 324
4.68
343,424
215,991 1,900
(173,066) (118,078)
- 15,125
589
26,521 11,531 47,521
472,319 446
286,902 1,131,125
38.
39.
2 0 1 5A n n u a l R e p o r t 87
221,694 55 787 977
3.97
359,922
192,821 -
(5,869) (111,434)
41,998 - -
- 11,033
(27,070) 428,514
- (123,908)
766,007
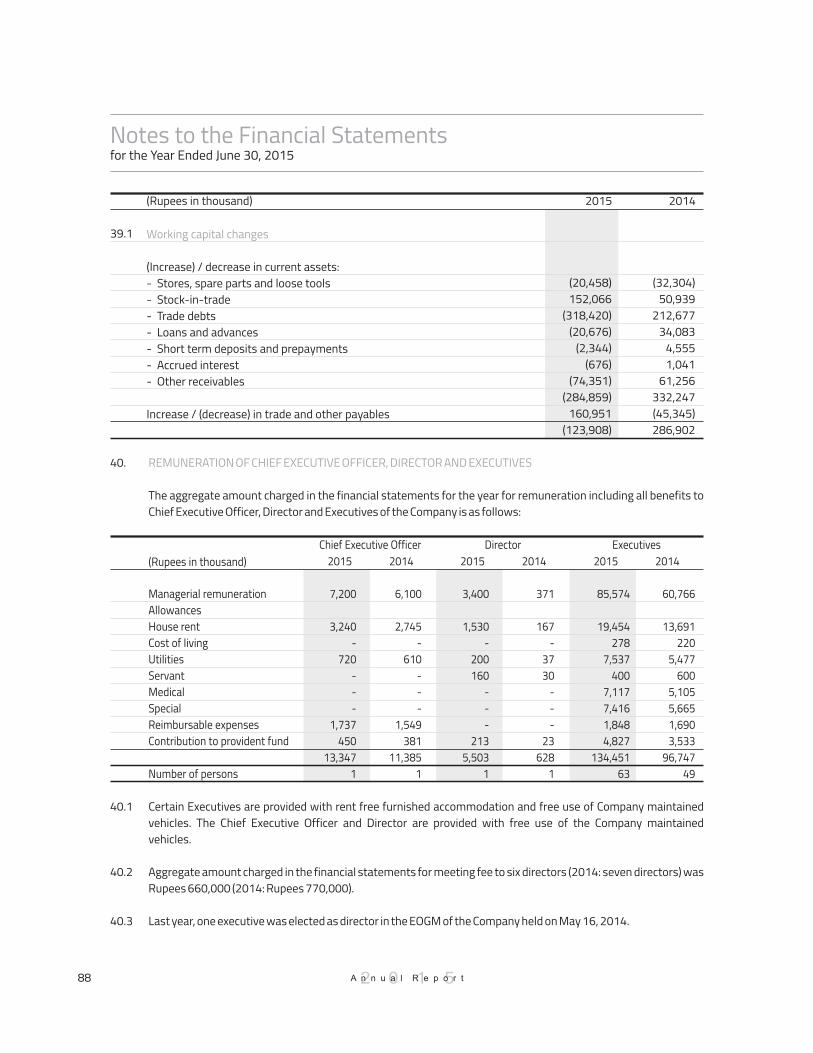
40.1
40.2
40.3
Certain Executives are provided with rent free furnished accommodation and free use of Company maintained vehicles. The Chief Executive Officer and Director are provided with free use of the Company maintained vehicles.
Aggregate amount charged in the financial statements for meeting fee to six directors (2014: seven directors) was Rupees 660,000 (2014: Rupees 770,000).
Last year, one executive was elected as director in the EOGM of the Company held on May 16, 2014.
Chief Executive Officer2015 2014
6,100
2,745 -
610 - - -
1,549 381
11,385 1
7,200
3,240 -
720 - - -
1,737 450
13,347 1
40. REMUNERATION OF CHIEF EXECUTIVE OFFICER, DIRECTOR AND EXECUTIVES
The aggregate amount charged in the financial statements for the year for remuneration including all benefits to Chief Executive Officer, Director and Executives of the Company is as follows:
Director2015 2014 2015 2014
Executives
85,574
19,454 278
7,537 400
7,117 7,416 1,848 4,827
134,451 63
60,766
13,691 220
5,477 600
5,105 5,665 1,690 3,533
96,747 49
371
167 -
37 30
- - -
23 628
1
3,400
1,530 -
200 160
- - -
213 5,503
1
Managerial remuneration AllowancesHouse rentCost of livingUtilitiesServantMedicalSpecialReimbursable expensesContribution to provident fund
Number of persons
(Rupees in thousand)
Notes to the Financial Statementsfor the Year Ended June 30, 2015
2015 2014(Rupees in thousand)
Working capital changes
(Increase) / decrease in current assets:- Stores, spare parts and loose tools- Stock-in-trade- Trade debts- Loans and advances- Short term deposits and prepayments- Accrued interest - Other receivables
Increase / (decrease) in trade and other payables
(32,304) 50,939
212,677 34,083
4,555 1,041
61,256 332,247 (45,345) 286,902
39.1
(20,458) 152,066
(318,420) (20,676)
(2,344) (676)
(74,351) (284,859)
160,951 (123,908)
2 0 1 5A n n u a l R e p o r t88

43.
5 9165 779
5 8475 929
NUMBER OF EMPLOYEES
Number of employees as on June 30Average number of employees during the year
2015 2014(Number of persons)
42. PROVIDENT FUND RELATED DISCLOSURE
Following information is based on un-audited financial statements of the provident fund for the year ended June 30, 2015 and audited financial statements of the provident fund for the year ended June 30, 2014:
Notes to the Financial Statementsfor the Year Ended June 30, 2015
40.4 No remuneration was paid to non-executive directors of the Company.
2015 2014(Rupees in thousand)
19,676 21,740 41,416
EMPLOYEES’ RETIREMENT BENEFITS
Contribution to Employees’ Provident Fund TrustContribution to Employees’ Old Age Benefit Institution
16,81221,53538,347
41.
Size of the fund - Total assetsCost of investmentsPercentage of investments madeFair value of investments
The break-up of cost of investments is as follows:
967,739 919,149
99.99 967,595
42.1
1,083,393 1,003,249
100.00 1,083,393
523,847 83,677 50,000
345,725 1,003,249
666,899 107,747
50,000 94,503
919,149
73%12%
5%10%
100%
52%8%5%
35%100%
Bank depositsAdvances to membersDefence saving certificatesListed securities
2015 2014(Percentage)
42.2 The above investments out of provident fund have been made in accordance with the provisions of Section 227 of the Companies Ordinance, 1984 and the rules formulated for this purpose with the exception of investment in listed securities which exceeds the prescribed limit.
2015 2014(Rupees in thousand)
2 0 1 5A n n u a l R e p o r t 89

44. TRANSACTIONS WITH RELATED PARTIES
The related parties comprise associated companies, staff retirement fund and key management personnel. The Company in the normal course of business carries out transactions with various related parties. Detail of transactions with related parties, other than those which have been specifically disclosed elsewhere in these financial statements are as follows:
Notes to the Financial Statementsfor the Year Ended June 30, 2015
2015 2014(Rupees in thousand)
57,677
228,258 111,083
4,253 18,037 40,832 59,039
11,508 19,676
154,214
63,207 117,551
- 16,867 19,729 48,502
- 16,812
Associated companies
Other related parties
Purchase of goods and servicesSale of goods and servicesDividend income Dividend paidInsurance premium paidInsurance claim receivedInterest income
Dividend paidContribution to Employees' Provident Fund Trust
2015 2014(Number of Shares)
835 968
12 717
2 704 657
-
620 967
-
Associated companies
Other related parties
Right shares issuedBonus shares received
Right shares issued
2 0 1 5A n n u a l R e p o r t90
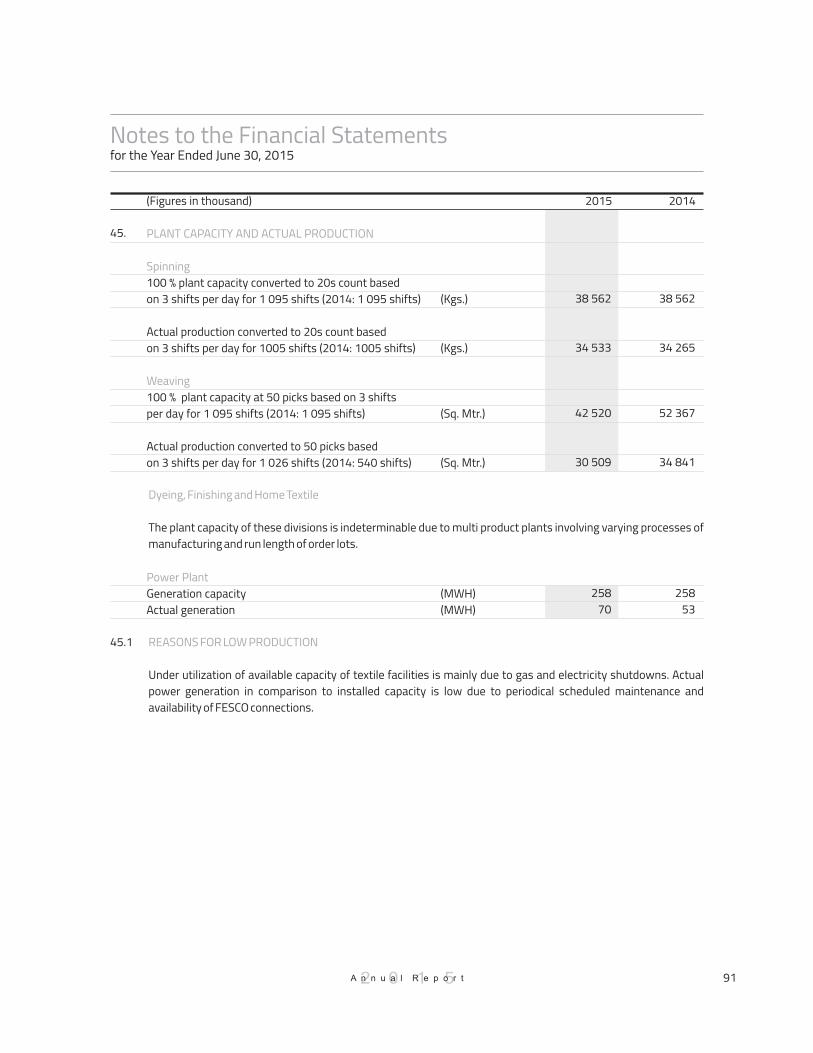
Notes to the Financial Statementsfor the Year Ended June 30, 2015
2015 2014(Figures in thousand)
45. PLANT CAPACITY AND ACTUAL PRODUCTION
Spinning
Weaving
Power Plant
100 % plant capacity converted to 20s count basedon 3 shifts per day for 1 095 shifts (2014: 1 095 shifts)
Actual production converted to 20s count basedon 3 shifts per day for 1005 shifts (2014: 1005 shifts)
100 % plant capacity at 50 picks based on 3 shiftsper day for 1 095 shifts (2014: 1 095 shifts)
Actual production converted to 50 picks basedon 3 shifts per day for 1 026 shifts (2014: 540 shifts)
Generation capacityActual generation
38 562
34 265
52 367
34 841
25853
38 562
34 533
42 520
30 509
25870
Dyeing, Finishing and Home Textile
The plant capacity of these divisions is indeterminable due to multi product plants involving varying processes of manufacturing and run length of order lots.
45.1 REASONS FOR LOW PRODUCTION
Under utilization of available capacity of textile facilities is mainly due to gas and electricity shutdowns. Actual power generation in comparison to installed capacity is low due to periodical scheduled maintenance and availability of FESCO connections.
(Kgs.)
(Kgs.)
(Sq. Mtr.)
(Sq. Mtr.)
(MWH)(MWH)
2 0 1 5A n n u a l R e p o r t 91
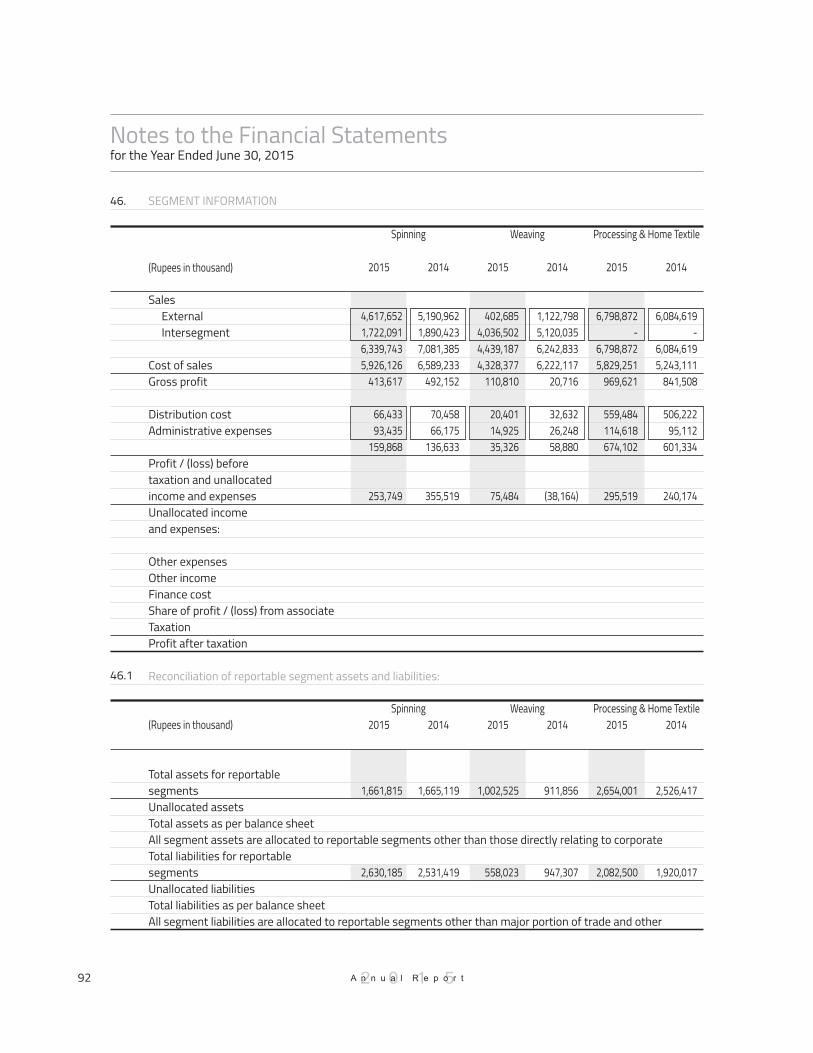
Notes to the Financial Statementsfor the Year Ended June 30, 2015
SEGMENT INFORMATION46.
2015 2014 2015 2014 2015 2014
Spinning Weaving Processing & Home Textile
(Rupees in thousand)
46.1
Sales External Intersegment
Cost of salesGross profit
Distribution costAdministrative expenses
Profit / (loss) beforetaxation and unallocatedincome and expensesUnallocated income and expenses:
Other expensesOther incomeFinance cost Share of profit / (loss) from associateTaxationProfit after taxation
Total assets for reportablesegmentsUnallocated assetsTotal assets as per balance sheetAll segment assets are allocated to reportable segments other than those directly relating to corporate Total liabilities for reportablesegmentsUnallocated liabilitiesTotal liabilities as per balance sheetAll segment liabilities are allocated to reportable segments other than major portion of trade and other
Reconciliation of reportable segment assets and liabilities:
4,617,652 1,722,091 6,339,743 5,926,126
413,617
66,433 93,435
159,868
253,749
1,661,815
2,630,185
1,122,798 5,120,035 6,242,833 6,222,117
20,716
32,63226,24858,880
(38,164)
911,856
947,307
6,798,872 -
6,798,872 5,829,251
969,621
559,484114,618674,102
295,519
2,654,001
2,082,500
6,084,619 -
6,084,619 5,243,111
841,508
506,222 95,112
601,334
240,174
2,526,417
1,920,017
402,685 4,036,502 4,439,187 4,328,377
110,810
20,401 14,92535,326
75,484
1,002,525
558,023
5,190,962 1,890,423 7,081,385 6,589,233
492,152
70,45866,175
136,633
355,519
1,665,119
2,531,419
Spinning Weaving Processing & Home Textile2015 2014 2015 2014 2015 2014(Rupees in thousand)
2 0 1 5A n n u a l R e p o r t92

Notes to the Financial Statementsfor the Year Ended June 30, 2015
Total - CompanyPower Generation Cold Storage Elimination of inter-segment transactions
2015 2014Restated
2015 2014 2015 2014 20142015
12,411,497 -
12,411,497 11,036,060 1,375,437
610,760195,553806,313
569,124
(66,587) 360,727
(472,319) (47,521)
(104,405) 239,019
11,834,775 -
11,834,775 10,321,726 1,513,049
648,384233,786882,170
630,879
(62,825) 193,312
(428,514) 27,070
(138,228) 221,694
- 1,207,636 1,207,636 1,192,875
14,761
2,06610,058 12,124
2,637
332,699
116,074
- 1,480,138 1,480,138 1,463,687
16,451
1,4487,3288,776
7,675
375,181
66,183
15,566 -
15,566 11,326 4,240
- 750750
3,490
20,238
1,998
13,118 -
13,118 8,508 4,610
- 690690
3,920
17,003
1,338
- (8,490,596) (8,490,596)
8,490,596 -
- - -
-
5,495,576 6,486,397
11,981,973
5,466,264 1,147,485 6,613,749
Power Generation Cold Storage Total - Company
- (6,966,229) (6,966,229)
6,966,229 -
- - -
-
5,671,278 6,783,580
12,454,858
5,388,780 1,325,712 6,714,492
2015 2014 2015 2014 2015 2014Restated
and tax assets.
payables, current and deferred tax liabilities.
2 0 1 5A n n u a l R e p o r t 93

Notes to the Financial Statementsfor the Year Ended June 30, 2015
All non-current assets of the Company as at reporting date are located and operating in Pakistan.
There was no major customer of the Company during the year (2014: no major customer of the Company).
Trading segment of the Company has been merged into Processing and Home Textile segment because the Trading segment was not meeting any of the requirements of the quantitative thresholds as mentioned in IFRS 8.
The Company's activities expose it to a variety of financial risks: market risk (including currency risk, other price risk and interest rate risk), credit risk and liquidity risk. The Company's overall risk management programme focuses on the unpredictability of financial markets and seeks to minimize potential adverse effects on the Company's financial performance. The Company uses derivative financial instruments to hedge certain risk exposures.
Risk management is carried out by the Company's finance department under policies approved by the Board of Directors. The Company's finance department evaluates and hedges financial risks. The Board provides principles for overall risk management, as well as policies covering specific areas such as currency risk, other price risk, interest rate risk, credit risk, liquidity risk, use of derivative financial instruments and non-derivative financial instruments and investment of excess liquidity.
Revenue from major customers
FINANCIAL RISK MANAGEMENT
Financial risk factors
46.3
46.4
46.5
47.
47.1
2015 2014(Rupees in thousand)
5,219,071 809,327
1,171,012 4,635,365
11,834,775
Geographical Information
The Company's revenue from external customers by geographical locations is detailed below:
EuropeAmerica Asia, Africa and AustraliaPakistan
46.2
3,697,254 1,283,022 1,702,460 5,728,761
12,411,497
Market riska)
Currency risk
Currency risk is the risk that the fair value or future cash flows of a financial instrument will fluctuate because of changes in foreign exchange rates. Currency risk arises mainly from future commercial transactions or receivables and payables that exist due to transactions in foreign currencies.
i)
2 0 1 5A n n u a l R e p o r t94

Notes to the Financial Statementsfor the Year Ended June 30, 2015
The Company is exposed to currency risk arising from various currency exposures, primarily with respect to the United States Dollar (USD) and Euro. Currently, the Company's foreign exchange risk exposure is restricted to bank balances and the amounts receivable / payable from / to the foreign entities. The Company uses forward exchange contracts to hedge its foreign currency risk, when considered appropriate. The Company's exposure to currency risk was as follows:
2015 2014(Rupees in thousand)
7,009 14,808,649
1,759,730 (480,752)
- (23,464,375)
(5,887,548) (15,017,017)
1,759,730
101.39101.50
121.43113.57
Cash at banks - USDTrade debts - USDTrade debts - EuroTrade and other payables - USDTrade and other payables - EuroShort term borrowings - USDDerivative financial instruments - USDNet exposure - USDNet exposure - Euro
Following significant exchange rates were applied during the year:
Average rate Reporting date rate
Average rate Reporting date rate
Rupees per US Dollar
Rupees per Euro
4,335 14,628,750
254,765 (487,053)
(13,479) (28,410,199)
(5,970,149) (20,234,316)
241,286
102.7998.55
139.45134.46
Sensitivity analysis
Currency risk management
If the functional currency, at reporting date, had weakened / strengthened by 5% against the USD and Euro with all other variables held constant, the impact on profit after taxation for the year would have been Rupees 72.401 million (2014: Rupees 94.719 million) lower / higher and Rupees 9.493 million (2014: Rupees 1.541 million) higher / lower respectively, mainly as a result of exchange gains / losses on translation of foreign exchange denominated financial instruments. Currency risk sensitivity to foreign exchange movements has been calculated on a symmetric basis. In management's opinion, the sensitivity analysis is unrepresentative of inherent currency risk as the year end exposure does not reflect the exposure during the year.
The Company manages its exposure to currency risk through continuous monitoring of expected / forecast committed and non-committed foreign currency payments and receipts. Reports on forecast foreign currency transactions, receipts and payments are prepared on monthly bases, exposure to currency risk is measured and appropriate steps are taken to ensure that such exposure is minimized while optimizing return. This includes matching of foreign currency liabilities / payments to assets / receipts, using source inputs in foreign currency and arranging cross currency swaps. The Company maintains foreign currency working capital lines in order to
2 0 1 5A n n u a l R e p o r t 95
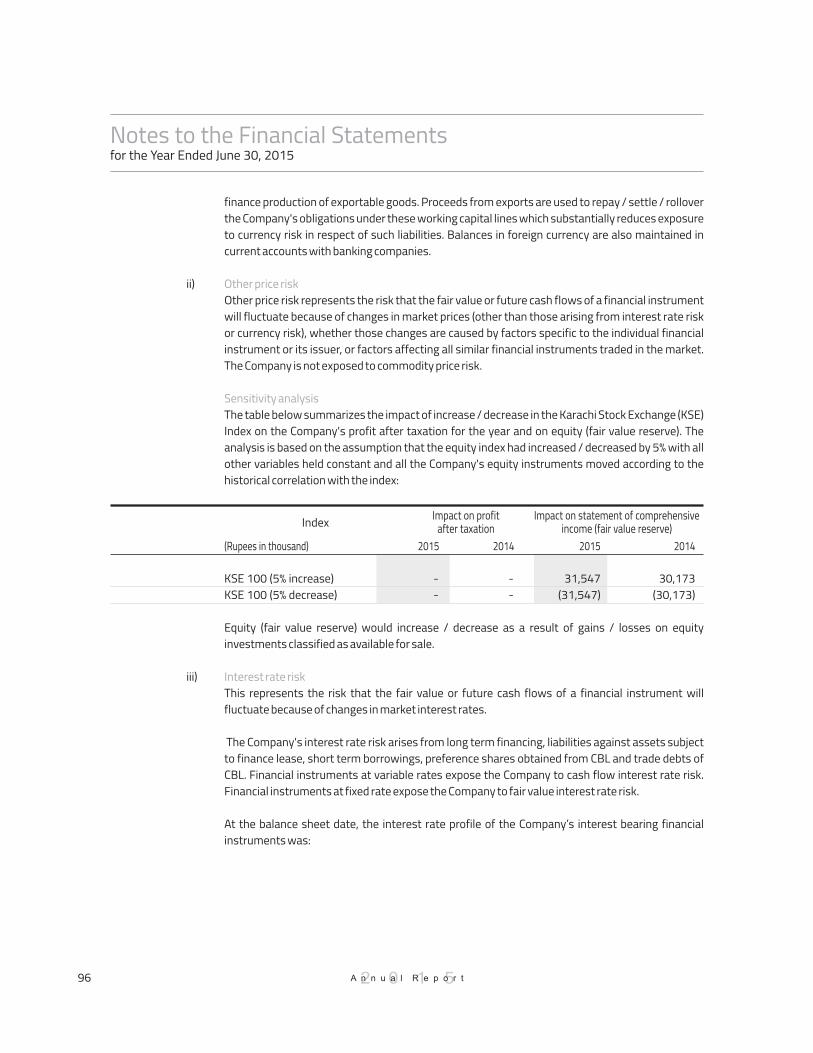
finance production of exportable goods. Proceeds from exports are used to repay / settle / rollover the Company's obligations under these working capital lines which substantially reduces exposure to currency risk in respect of such liabilities. Balances in foreign currency are also maintained in current accounts with banking companies.
Other price risk represents the risk that the fair value or future cash flows of a financial instrument will fluctuate because of changes in market prices (other than those arising from interest rate risk or currency risk), whether those changes are caused by factors specific to the individual financial instrument or its issuer, or factors affecting all similar financial instruments traded in the market. The Company is not exposed to commodity price risk.
The table below summarizes the impact of increase / decrease in the Karachi Stock Exchange (KSE) Index on the Company's profit after taxation for the year and on equity (fair value reserve). The analysis is based on the assumption that the equity index had increased / decreased by 5% with all other variables held constant and all the Company's equity instruments moved according to the historical correlation with the index:
Other price risk
Sensitivity analysis
ii)
2015 2014 2015 2014
Impact on statement of comprehensiveincome (fair value reserve)
Impact on profitafter taxation
31,547 (31,547)
KSE 100 (5% increase)KSE 100 (5% decrease)
30,173 (30,173)
Equity (fair value reserve) would increase / decrease as a result of gains / losses on equity investments classified as available for sale.
This represents the risk that the fair value or future cash flows of a financial instrument will fluctuate because of changes in market interest rates.
The Company's interest rate risk arises from long term financing, liabilities against assets subject to finance lease, short term borrowings, preference shares obtained from CBL and trade debts of CBL. Financial instruments at variable rates expose the Company to cash flow interest rate risk. Financial instruments at fixed rate expose the Company to fair value interest rate risk.
At the balance sheet date, the interest rate profile of the Company’s interest bearing financial instruments was:
Interest rate riskiii)
--
--
Index
(Rupees in thousand)
Notes to the Financial Statementsfor the Year Ended June 30, 2015
2 0 1 5A n n u a l R e p o r t96

Notes to the Financial Statementsfor the Year Ended June 30, 2015
Fair value sensitivity analysis for fixed rate instruments
Cash flow sensitivity analysis for variable rate instruments
Interest rate risk management
The Company does not account for any fixed rate financial assets and liabilities at fair value through profit or loss. Therefore, a change in interest rate at the balance sheet date would not affect profit or loss of the Company.
If interest rates at the year end date, fluctuates by 1% higher / lower with all other variables held constant, profit after taxation for the year would have been Rupees 25.411 million (2014: Rupees 30.276 million) lower / higher mainly as a result of higher / lower interest expense on floating rate financial instruments. This analysis is prepared assuming the amounts of financial instruments outstanding at balance sheet date were outstanding for the whole year.
The Company manages interest rate risk by analyzing its interest rate exposure on dynamic basis. Cash flow interest rate risk is managed by simulating various scenarios taking into consideration refinancing, renewal of existing positions and alternative financing. Based on these scenarios, the Company calculates impact on profit after taxation and equity of defined interest rate shift, mostly 100 basis points. Cross currency swaps are also arranged to transfer exposure to more stable markets.
2015 2014(Rupees in thousand)
1,976,000
21,3071,965,600
639,797
157,86043,681
3,113,080
Fixed rate instruments
Financial assets
Financial liabilities
Floating rate instruments
Financial assets
Financial liabilities
Preference shares-CBL
Long term financingShort term borrowings
Trade debts-CBL
Long term financingLiabilities against assets subject to finance leaseShort term borrowings
1,976,000
83,3081,655,600
443,071
126,20977,546
3,426,213
2 0 1 5A n n u a l R e p o r t 97

Notes to the Financial Statementsfor the Year Ended June 30, 2015
Credit risk
Credit risk represents the risk that one party to a financial instrument will cause a financial loss for the other party by failing to discharge an obligation. The carrying amount of financial assets represents the maximum credit exposure. The maximum exposure to credit risk at the reporting date was as follows:
b)
InvestmentsLoans and advances DepositsTrade debtsAccrued interestOther receivablesBank balances
National Bank of PakistanAllied Bank LimitedHabib Bank LimitedHabib Metropolitan Bank LimitedMCB Bank LimitedNIB Bank LimitedStandard Chartered Bank(Pakistan) LimitedUnited Bank LimitedAl-Baraka Bank (Pakistan) LimitedMeezan Bank LimitedThe Bank of PunjabBurj Bank Limited
Banks
The credit quality of financial assets that are neither past due nor impaired can be assessed by reference to external credit ratings (If available) or to historical information about counter party default rate:
269 1,945 1,068
51 354
1
61 121
1,716 37
292 -
5,915
179 1,222
5 1,497
228 1
570 195 581
12 100
4 4,594
JCR-VISPACRAJCR-VISPACRAPACRAPACRA
PACRAJCR-VISPACRAJCR-VISPACRAJCR-VIS
AAAAA+AAAAA+AAAAA -
AAAAA+
AAAAA-A-
A-1+A1+A-1+A1+A1+A1+
A1+A-1+
A1A-1+A1+A-2
Rating 20142015(Rupees in thousand)AgencyLong
TermShortTerm
2015 2014(Rupees in thousand)
2,607,433 5,714
26,495 2,566,707
5,068 471,198
4,594 5,687,209
2,621,970 5,171
26,385 2,248,287
4,392 405,588
5,915 5,317,708
The Company's exposure to credit risk and impairment losses related to trade debts is disclosed in Note 22.
2 0 1 5A n n u a l R e p o r t98

Notes to the Financial Statementsfor the Year Ended June 30, 2015
Credit risk management
Liquidity risk
The Company's financial assets do not carry significant credit risk, with the exception of trade debts, which are exposed to losses arising from any non-performance by counterparties. In respect of trade debts, the Company manages credit risk by limiting significant exposure to any single customer. Formal policies and procedures of credit management and administration of receivables are established and executed. In monitoring customer credit risk, the ageing profile of total receivables and individually significant balances, along with collection activities are reviewed on a regular basis. High risk customers are identified and restrictions are placed on future trading, including suspending future shipments and administering dispatches on a prepayment basis or confirmed letters of credit.
Due to the Company's long standing business relationships with these counterparties and after giving due consideration to their strong financial standing, the management does not expect non-performance by these counterparties on their obligations to the Company. Accordingly, the credit risk is minimal.
Liquidity risk is the risk that an entity will encounter difficulty in meeting obligations associated with financial liabilities.
The Company manages liquidity risk by maintaining sufficient cash and the availability of funding through an adequate amount of committed credit facilities. At June 30, 2015, the Company had Rupees 1,436 million (2014: Rupees 1,232 million) available borrowing limits from financial institutions and Rupees 5.195 million (2014: Rupees 6.935 million) cash and bank balances. The management believes the liquidity risk to be low.
Following are the contractual maturities of financial liabilities, including interest payments. The amounts disclosed in the table are undiscounted cash flows:
Contractual maturities of financial liabilities as at June 30, 2015:
c)
46,757
11,502 - - -
58,259
Non-derivative financial liabilities:
Long term financingLiabilities against assetssubject to finance leaseTrade and other payablesAccrued mark-upShort term borrowings
72,559
- - - -
72,559
39,659
16,772 - -
1,677,298 1,733,729
55,201
18,794 1,161,817
85,254 3,581,069 4,902,135
214,176
47,068 1,161,817
85,254 5,258,367 6,766,682
179,167
43,681 1,161,817
85,254 5,078,680 6,548,599
1-2 years More than2 years
6-12months
6 monthsor less
Contractualcash flows
Carryingamount
(Rupees in thousand)
2 0 1 5A n n u a l R e p o r t 99

Notes to the Financial Statementsfor the Year Ended June 30, 2015
1-2 years More than2 years
6-12months
6 monthsor less
Contractualcash flows
Carryingamount
(Rupees in thousand)
Contractual maturities of financial liabilities as at June 30, 2014:
Non-derivative financial liabilities:Long term financingLiabilities against assetssubject to finance leaseTrade and other payablesAccrued mark-upShort term borrowings
The contractual cash flows relating to the above financial liabilities have been determined on the basis of interest rates / mark-up rates effective as at June 30. The rates of interest / mark-up have been disclosed in Note 6, 7 and 11 to these financial statements.
The carrying values of all financial assets and liabilities reflected in financial statements approximate their fair values. Following table provides an analysis of financial instruments that are measured subsequent to initial recognition at fair value, grouped in to levels 1 to 3 based on the degree to which fair value is observable:
Fair values of financial assets and liabilities47.2
72,854
41,881 - - -
114,735
13,174
6,169 - - -
19,343
53,211
20,940 - -
1,583,552 1,657,703
94,871
20,941 969,320
97,001 3,686,373 4,868,506
234,110
89,931 969,320
97,001 5,269,925 6,660,287
209,517
77,546 969,320
97,001 5,081,813 6,435,197
(Rupees in thousand) Level 1 Level 2 Level 3 Total
-
-
588,935
603,472
-
-
588,935
603,472
As at June 30, 2015Assets
As at June 30, 2014Assets
Available for sale financial assets
Available for sale financial assets
The fair value of financial instruments traded in active markets is based on quoted market prices at the balance sheet date. The quoted market price used for financial instruments held by the Company is the current bid price. These financial instruments are classified under level 1 in above referred table.
The fair value of financial instruments that are not traded in an active market is determined by using valuation techniques. These valuation techniques maximize the use of observable market data where it is available and rely as little as possible on entity specific estimates. If all significant inputs required to fair value a financial instrument are observable, those financial instruments are classified under level 2 in above referred table. The Company has no such type of financial instruments as on June 30, 2015.
2 0 1 5A n n u a l R e p o r t100

Notes to the Financial Statementsfor the Year Ended June 30, 2015
Financial instruments by categories47.3
(Rupees in thousand) Loans andreceivables
Availablefor sale Total
If one or more of the significant inputs is not based on observable market data, the financial instrument is classified under level 3. The carrying amount less impairment provision of trade receivables and payables are assumed to approximate their fair values. The fair value of financial liabilities for disclosure purposes is estimated by discounting the future contractual cash flows at the current market interest rate that is available to the Company for similar financial instruments.
2,607,433 - - - - - -
2,607,433
2,607,433 5,714
26,495 2,566,707
5,068 471,198
5,195 5,687,810
- 5,714
26,495 2,566,707
5,068 471,198
5,195 3,080,377
As at June 30, 2015Assets as per balance sheetInvestmentsLoans and advances DepositsTrade debtsAccrued interestOther receivablesCash and bank balances
(Rupees in thousand) Financial liabilities atamortized cost
179,167 43,681 85,254
5,078,680 1,161,817 6,548,599
Liabilities as per balance sheetLong term financingLiabilities against assets subject to finance leaseAccrued mark-upShort term borrowingsTrade and other payables
2 0 1 5A n n u a l R e p o r t 101
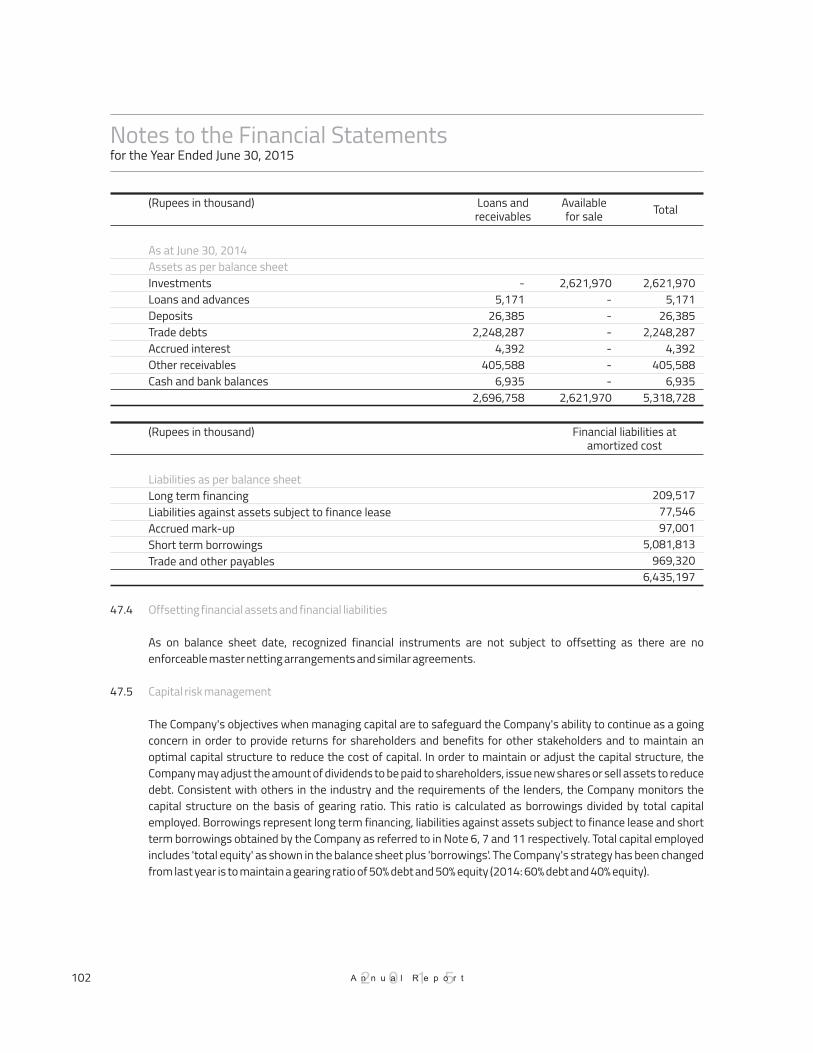
Notes to the Financial Statementsfor the Year Ended June 30, 2015
(Rupees in thousand) Loans andreceivables
Availablefor sale Total
(Rupees in thousand) Financial liabilities atamortized cost
209,517 77,546 97,001
5,081,813 969,320
6,435,197
Liabilities as per balance sheetLong term financingLiabilities against assets subject to finance leaseAccrued mark-upShort term borrowingsTrade and other payables
Offsetting financial assets and financial liabilities
Capital risk management
As on balance sheet date, recognized financial instruments are not subject to offsetting as there are no enforceable master netting arrangements and similar agreements.
The Company's objectives when managing capital are to safeguard the Company's ability to continue as a going concern in order to provide returns for shareholders and benefits for other stakeholders and to maintain an optimal capital structure to reduce the cost of capital. In order to maintain or adjust the capital structure, the Company may adjust the amount of dividends to be paid to shareholders, issue new shares or sell assets to reduce debt. Consistent with others in the industry and the requirements of the lenders, the Company monitors the capital structure on the basis of gearing ratio. This ratio is calculated as borrowings divided by total capital employed. Borrowings represent long term financing, liabilities against assets subject to finance lease and short term borrowings obtained by the Company as referred to in Note 6, 7 and 11 respectively. Total capital employed includes 'total equity' as shown in the balance sheet plus 'borrowings'. The Company's strategy has been changed from last year is to maintain a gearing ratio of 50% debt and 50% equity (2014: 60% debt and 40% equity).
47.4
47.5
2,621,970 - - - - - -
2,621,970
2,621,970 5,171
26,385 2,248,287
4,392 405,588
6,935 5,318,728
- 5,171
26,385 2,248,287
4,392 405,588
6,935 2,696,758
As at June 30, 2014Assets as per balance sheetInvestmentsLoans and advances DepositsTrade debtsAccrued interestOther receivablesCash and bank balances
2 0 1 5A n n u a l R e p o r t102

(Muhammad Anwar)Chief Executive Officer
2015 2014Restated
(Rupees in thousand)
5,301,528 3,449,662 8,751,190
60.58
5,368,876 3,077,457 8,446,333
63.56
BorrowingsTotal equityTotal capital employed
Gearing ratio (Percentage)
The decrease in the gearing ratio resulted primarily from issue of right shares by the Company.
The Board of Directors of the Company has proposed a cash dividend for the shareholders of the Company for the year ended June 30, 2015 amounting to Rupees 1.45 (2014: Rupees 1.25) per share at their meeting held on October 03, 2015. The Board of Directors also proposed to issue 30.0551 % right share (2014: 25%) of total issued subscribed and paid up capital. However, this event has been considered as non-adjusting event under IAS 10 'Events after the Reporting Period' and has not been recognized in these financial statements.
These financial statements were authorized for issue on October 03, 2015 by the Board of Directors of the Company.
Corresponding figures have been re-arranged, wherever necessary for the purpose of comparison. However, no significant re-arrangements have been made.
Figures have been rounded off to the nearest thousand of Rupees unless otherwise stated.
EVENTS AFTER THE REPORTING PERIOD
DATE OF AUTHORIZATION FOR ISSUE
CORRESPONDING FIGURES
GENERAL
48.
49.
50 .
51.
(Khalid Bashir)Director
Notes to the Financial Statementsfor the Year Ended June 30, 2015
2 0 1 5A n n u a l R e p o r t 103

Pattern of Shareholding - (Form “34”)as at June 30, 2015
520510248462149613426177
127
15526615315643532231213121111113
Shareholders Total
SharesForm to
1145322123211121111111211111111111221111111
2211
Shareholders Total
SharesForm to
1101501
1,0015,001
10,00115,00120,00125,00130,00135,00140,00145,00150,00155,00160,00165,00170,00175,00180,00185,00190,00195,001
105,001115,001120,001125,001130,001135,001140,001145,001150,001155,001160,001165,001175,001185,001190,001195,001200,001205,001210,001215,001
220,001235,001240,001245,001260,001270,001275,001285,001290,001295,001300,001305,001310,001340,001370,001390,001400,001410,001425,001435,001450,001485,001495,001500,001510,001540,001550,001575,001580,001585,001635,001690,001745,001
1,045,0011,285,0011,350,0011,445,0012,045,0012,495,0012,575,0013,350,0013,925,0014,250,001
100500
1,0005,000
10,00015,00020,00025,00030,00035,00040,00045,00050,00055,00060,00065,00070,00075,00080,00085,00090,00095,000
100,000110,000120,000125,000130,000135,000140,000145,000150,000155,000160,000165,000170,000180,000190,000195,000200,000205,000210,000215,000220,000
225,000240,000245,000250,000265,000275,000280,000290,000295,000300,000305,000310,000315,000345,000375,000395,000405,000415,000430,000440,000455,000490,000500,000505,000515,000545,000555,000580,000585,000590,000640,000695,000750,000
1,050,0001,290,0001,355,0001,450,0002,050,0002,500,0002,580,0003,355,0003,930,0004,255,000
17,235144,218201,250
1,218,9011,158,598
771,137603,336608,482475,656233,855463,661303,734739,522267,523114,500372,546403,280
74,915381,760250,741
88,624463,960593,910428,627352,701618,033384,622261,311277,505426,009148,999309,255156,445485,970166,500358,516188,340190,993197,556204,637206,018210,275652,678
221,981235,500973,097
1,235,679785,370548,137553,578288,750585,955899,003604,527305,638311,625340,500747,875394,778404,923413,750427,500439,697452,379488,951
1,000,000500,611511,588540,323553,000575,155581,250590,000637,886690,306750,000
1,049,7992,578,2142,704,6371,446,1292,047,3752,500,0002,575,0853,352,3433,927,4924,565,684
61,512,404
2 0 1 5A n n u a l R e p o r t104

Pattern of Shareholding - (Form “34”)as at June 30, 2015
Categories of Shareholders
IndividualJoint Stock CompaniesAssociated CompaniesExecutivesInsurance CompaniesMutual FundsFinancial InstitutationModaraba & Modaraba CosNon-ResidentsGrnd Ttl
Numbers
2,12857
6421625
2,211
Shares Held
36,884,78412,713,99210,092,380
1,489,634292,685
25,3837,576
8425,128
61,512,404
% age
60.020.716.4
2.40.50.00.00.00.0
100
2 0 1 5A n n u a l R e p o r t 105

Directors, Chief Executive Officer, Their Spouse and Minor Children
Chairman, CEO & Director
Directors
Directors' Spouse
Executives
Associated Companies, Undertaking & Related Parties
NIT & ICP
Chairman & CEOMuhammed RafiMuhammad Anwar
Ahmad ShafiMuhammad ArshadNasir ShafiKhalid BashirKhurram Mazhar KarimMuhammad Asif Nominee NIT
Tanveer Khalid BashirMussarat RafiShaheen NasirAbida Anwar
Crescent Cotton Mills LtdTrustee-The Crescent Textile Mills Ltd Empl. Provident FundCrescent FoundationCrescent Steel and Allied Products Ltd.Premier Insurance LimitedShakarganj Mills Limited
Cdc - Trustee National Investment (Unit) TrustNational Bank of PakistanTrustee National Bank of Pakistan Employees Pension FundInvestment Corporation of PakistanTrustee National Bank of Pakistan Emp Benevolent Fund TrustNational Bank of Pakistan Investar Accounts NdfcNational Bank of Pakistan.Idbl (Icp Unit)
(Number of shares held)Total
251,319637,886
1,655,734301,214299,341273,163127,415
123,47270,76310,196
6,4023,756,905
1,489,634
3,352,3434,565,6841,288,576
452,379427,500
5,89810,092,380
2,575,0851,049,799
188,3409,0006,6092,0541,156
3493,832,392
% age0.41.0
2.70.50.50.40.2
0.20.10.00.06.1
2.4
5.47.42.10.70.70.0
16.4
4.21.70.30.00.00.00.00.06.2
1
2
3
4
Pattern of Shareholding - (Form “34”)as at June 30, 2015
Categories of Shareholders
2 0 1 5A n n u a l R e p o r t106

Pattern of Shareholding - (Form “34”)as at June 30, 2015
Mutual Funds
Shareholders more than 5% shareholding
Tri. Star Mutual Fund Ltd.
Banks, NBFC's, DFI's, Takaful, Pension Funds
Modarabas
Insurance Companies
Non-Residents
Other companies, Corporate Bodies, Trust etc.
General PublicGrand Total
Trustee-The Crescent Textile Mills Ltd Empl. Provident FundCs Capital (Pvt) LtdCrescent Cotton Mills Ltd
25,38325,383
7,576
842
292,685
5,128
8,881,600
33,127,87961,512,404
4,565,6843,927,4923,352,343
0.00.0
0.0
0.0
0.5
0.0
14.4
53.9100
7.46.45.4
5
6
7
8
9
10
11
2 0 1 5A n n u a l R e p o r t 107

Notice is hereby given that the 66thAnnual General Meeting of the shareholders of The Crescent Textile Mills Limited (the "Company") will be held on Saturday, the October 31, 2015 at 9:00 a.m. at the registered office of the Company at 45-A, Off: Zafar Ali Road, Gulberg-V, Lahore to transact the following business:-
1
2
3.
4.
Ordinary Business:
Special Business:
To receive, consider and adopt the audited financial statements of the Company for the year ended June 30, 2015 together with the Directors' and Auditors' Reports thereon.
To approve, as recommended by the Board of Directors, payment of cash dividend @ 14.5% i.e. Rs. 1.45 per share for the year ended June 30, 2015.
To appoint Auditors of the Company and fix their remuneration.
To consider and if thought fit, to pass with or without modification, the following resolutions as special resolution:
"Resolved that the approval of the members of the Crescent Textile Mills Limited (the "Company") be and is hereby accorded in terms of Section 208 of the Companies Ordinance, 1984 for long term equity investment of Rs. 99,044,280 in Crescent Steel and Allied Products Limited, an associated company, for subscribing 1,707,660 ordinary right shares at Rs.58 per share including a premium of Rs 48 per share offered to the Company on its existing shareholding as per term and conditions disclosed to the members.
Resolved Further That Mr. Muhammad Anwar, Chief Executive Officer and Mr. Ahmad Shafi, Executive Director of the Company, be and are hereby singly authorized to do all acts, deeds and things, take any or all necessary actions to complete all legal formalities and file all necessary documents as may be necessary or incidental for the purpose of implementing the aforesaid resolutions."
Notice of Annual General Meeting
Registered Office:45-A, Off: Zafar Ali Road, Gulberg-V, Lahore:T: +92-042-111-245-245F: +92-042-111-222-245Dated: October 03, 2015
By Order of the Board(Naseer Ahmad Chaudhary)
Corporate Secretary
2 0 1 5A n n u a l R e p o r t108

For attending the meeting:
For Appointing Proxies
i).
ii).
i).
ii).
iii).
iv).
v).
a.
b.
In case of individuals, the account holder or sub-account holder and/or the person whose securities are in group account and their registration details are uploaded as per the Regulations, shall authenticate his/her identity by showing his original Computerized National Identity Card (CNIC) or original passport at the time of attending the meeting.
In case of corporate entity, the Board of Directors' resolution/power of attorney with specimen signatures of the nominee shall be produced (unless it has been provided earlier) at the time of the Meeting.
In case of individuals, the account holder or sub-account holder and/or the person whose securities are in group account and their registration details are uploaded as per the Regulations, shall submit the proxy form as per the above requirement.
The proxy form shall be witnessed by two persons whose names, addresses and CNIC numbers shall be mentioned on the form.
Attested copies of CNIC or the passport of the beneficial owners and the proxy shall be furnished with the proxy form.
The proxy shall produce his original CNIC or original passport at the time of the Meeting.
In case of corporate entity, the Board of Directors' resolution/power of attorney with specimen signatures shall be submitted (unless it has been provided earlier) along with proxy form to the company.
1.
2.
3.
4.
Notice of Annual General Meeting
Notes:
Right Shares and Book Closure:The Board of Directors of the Company has declared 30.0551% right shares (30.0551 right shares for every 100 shares held) at a premium of Rs. 7.5 per share (total Rs. 17.5 per share). The right shares will be offered to all the members whose names will appear on the Members' Register of the Company at the close of business on November 14, 2015. The Members' Register will remain closed from November 15, 2015 to November 22, 2015 (both days inclusive) for right share entitlement. Physical / CDC transfers received in order at the Share Registrar's Office of the Company by the close of business on October 22, 2015 will be treated in time for the entitlement of cash dividend to the transferee and to attend the meeting. The Members' Register will remain closed from October 23, 2015 to October 31, 2015 (both days inclusive).
A member eligible to attend and vote in this meeting may appoint another member as proxy to attend and vote in the meeting. Proxies in order to be effective must be received by the company at the Registered Office not later than 48 hours before the time for holding the meeting.
Shareholders are requested to immediately notify the change in address, if any.
CDC account holders will further have to follow the guidelines as laid down in circular No.1 dated January 26, 2000 issued by the Securities and Exchange Commission of Pakistan:
2 0 1 5A n n u a l R e p o r t 109

Notice of Annual General Meeting
5.
6.
7.
8.
Computerized National Identity Card (CNIC) / National Tax Number (NTN)
Dividend Mandate Option
Availability of Audited Financial Statements on Company's Website
Deduction of Income Tax from Dividend @ Revised Rates
CNIC or NTN of the shareholders is mandatory in terms of the directive of the Securities and Exchange Commission of Pakistan contained in S.R.O. 831(I)/2012 dated July 05, 2012 for the issuance of future dividend warrants etc., and in the absence of such information, payment of dividend may be withheld in term of SECP's above mentioned directive. Therefore, the shareholders who have not yet provided their CNICs or NTN are once again advised to provide the attested copies of their CNICs or NTN (if not already provided) directly to our Independent Share Registrar without any further delay.
In order to make process of payment of cash dividend more efficient, e-dividend mechanism has been envisaged where shareholders can get amount of dividend credited into their respective bank accounts electronically without any delay. In this way, dividends may be instantly credited to respective bank accounts and there are no chances of dividend warrants getting lost in the post, undelivered or delivered to the wrong address, etc. The Securities and Exchange Commission of Pakistan (SECP) through Notice No. 8(4) SM/CDC 2008 dated April 05, 2013 advised all Listed Companies to adopt e-dividend mechanism due to the benefits it entails for shareholders. In view of the above, you are hereby encouraged to provide a dividend mandate in favour of e-dividend by providing dividend mandate form duly filled in and signed.
The Company has placed the Audited Annual Financial Statements for the year ended June 30, 2015 along with Auditors and Directors Reports thereon on its website: www.ctm.com.pk
Pursuant to the amendment in section 150 of the Income Tax Ordinance, 2001 through Finance Act 2015, the revised Income Tax Rates on Dividend Income are as follows:
Income Tax Return Filer 12.5%Income Tax Return Non Filer 17.5%
Income Tax will be deducted on the basis of Active Tax Payers List posted on the Federal Board of Revenue website. Members seeking exemption from deduction of income tax or are eligible for deduction at reduce tax are requested to provide us valid tax certificate or documentary evidence as the case may be. Members desiring non deduction of Zakat are also requested to submit a valid declaration for non-deduction of Zakat, if not provided earlier.
The FBR has clarified that shareholders accounts jointly held by filers and Non-filers shall be dealt with separately and in such particular situation, each account holder is to be treated individually as either a filer or a non-filer and tax will be deducted according to his shareholding. If the share is not ascertainable then each account holder will be assumed to hold equal proportion of shares and the deduction will be made accordingly. Therefore, in order to
2 0 1 5A n n u a l R e p o r t110

2 0 1 5A n n u a l R e p o r t 111
Notice of Annual General Meeting
9.
Crescent Steel and Allied Products Limited ("CSAP") is an associated company of the Crescent Textile Mills Limited (the "Company") by virtue of common directorship with an existing investment of 6,830,643 Ordinary Shares representing 11% of the total paid-up capital of CSAP. Mr. Nasir Shafi and Mr. Khurram Mazhar Karim are common directors in both companies.
CSAP has issued 25% right shares and the Company has been offered 1,707,660 right shares on its above mentioned shareholding at a price of Rs. 58 per share including Rs. 48 as premium per share. Accordingly, the Board of Directors of the Company has approved subscription of right shares amounting to Rs. 99,044,280/- and has recommended the same for approval of shareholders pursuant to the requirement of Section 208 of the Companies Ordinance, 1984.
The Directors, sponsors and majority shareholders of the Company and their relatives have no interest, directly or indirectly, in CSAP and the proposed investment except to the extent of their/spouse's shareholdings that is as under:
The Directors submit that they have carried out necessary due diligence for the proposed investment in CSAP and duly signed recommendation of the due diligence report shall be available for inspection of members in the general meeting along with audited accounts of the associated company.
CSAP and its sponsors/directors have no interest in the Company except for their respective shareholdings in the Company, that is as under:
STATEMENT OF MATERIAL FACTS UNDER SECTION 160(1)(b) OF THE COMPANIES ORDINANCE, 1984 RELATING TO THE SPECIAL BUSINESS TO BE TRANSACTED AT THE ANNUAL GENERAL MEETING TO BE HELD ON OCTOBER 31, 2015
Transmission of Financial Statements to the Members through e-mail
In pursuance of SECP notification S.R.O 787 (I)/2014 dated September 08, 2014, the companies have been allowed to circulate their Annual Balance Sheet and Profit and Loss Account, Auditor's Report and Director's Report (Annual Financial Statements) along with Notice of Annual General Meeting (Notice) through e-mail to the members of the Company. Members desiring to avail this facility may provide the requisite information to the Company for which form may be downloaded from the Company's website: www.ctm.com.pk
Folio/CDCAccount No.
Name ofshareholder
CNIC Shareholding Totalshares
Principal/joint shareholder
NameMr. Muhammad RafiMr. Muhammad AnwarMr. Ahmad ShafiMr. Khalid BashirMr. Khurram Mazhar KarimMr. Muhammad ArshadMr. Nasir Shafi
% of Shareholding0.230.030.540.180.010.40 0.06
avoid deduction of tax at a higher rate, the joint account holders are requested to provide the below details of their shareholding to the Share Registrar of the Company latest by the close of business on October 22, 2015.

Crescent Steel and Allied ProductsLimited (CSAP)
Common directorship
To keep intact strategic interest in CSAP.
To earn return on equity of CSAP through dividendincome and capital appreciation
Strategic investment - Long term
Rs 99,044,280
Rs 58 per share
1,707,660 ordinary shares
No of shares: 6,830,643 Shareholding Percentage: 11%
No of shares: 8,538,303Shareholding Percentage: 11%
Rs 91.95 per share (Jul 15 - Sep 15)
Not applicable as CSAP is listed security.
Name of the associated company
Criteria of associated relationship
Purpose
Benefits
Period of investment
Maximum amount of investment
Maximum price at which securities will be acquired
Maximum number of securities to be acquired
Shareholding before investment
Shareholding after investment
Average of the preceding twelve weekly averageprice of the security intended to be acquired
In case of investment in unlisted securities, fairmarket value of such securities determined in termsof regulation 6(1) of the Companies (investment inAssociated Companies or Associated Undertakings)Regulations, 2012
i.
ii.
iii.
iv.
v.
vi.
vii.
viii.
Notice of Annual General Meeting
2 0 1 5A n n u a l R e p o r t
NameMr. Ahsan M. SaleemMr. Khurram Mazhar KarimMr. Nasir ShafiMr. Zahid Bashir
% of Shareholding1.020.210.510.16
Latest annual/reviewed audited accounts of CSAP shall be made available for inspection of members in the annual general meeting.
Information required under Clause (a) of sub regulation 1 of regulation 3 of Companies (Investment in Associated Companies or Associated Undertakings) Regulations, 2012
112

Notice of Annual General Meeting
2 0 1 5A n n u a l R e p o r t
Earnings per share for the last three years
Source of funds from which shares will beacquired.
Requirement if shares are intended to beacquired using borrowed fund
Salient features of the agreement(s), if any, enteredinto with its associated company or associatedundertaking with regards to the proposed investment
Direct or indirect interest of directors, sponsors,majority shareholders and their relatives in theassociated company or transaction underconsideration.
Any other important details necessary for themembers to understand the transaction; and
In case of investment in securities of a project ofan associated company or associated undertaking that has not commenced operations, in addition tothe information referred to above, the followingfurther information, is required namely.
Description of the project and its history since conceptualization;
Starting and expected date of completion of work;
Time by which such project shall become commercially operational; and
Expected time by which the project shall start paying return on investment
2015 Rs 1.71 per share2014 Rs 5.80 per share2013 Rs 13.14 per share
Investment will be made from thecompany's funds.
Not applicable.
The Company will be subscribing to rightshares, hence no agreement is required.
Directors are interested in investee company tothe extent of their shareholding.
None
Not applicable
x.
xi.
xii.
xiii.
xiv.
xv.
xvi.
(I)
(II)
(III)
(IV)
Rs 65.2 per share as at June 30, 2015as per audited accounts.
Break-up value of securities intended to be acquiredon the basis of the latest audited financial statements
ix.
113

2 0 1 5A n n u a l R e p o r t114
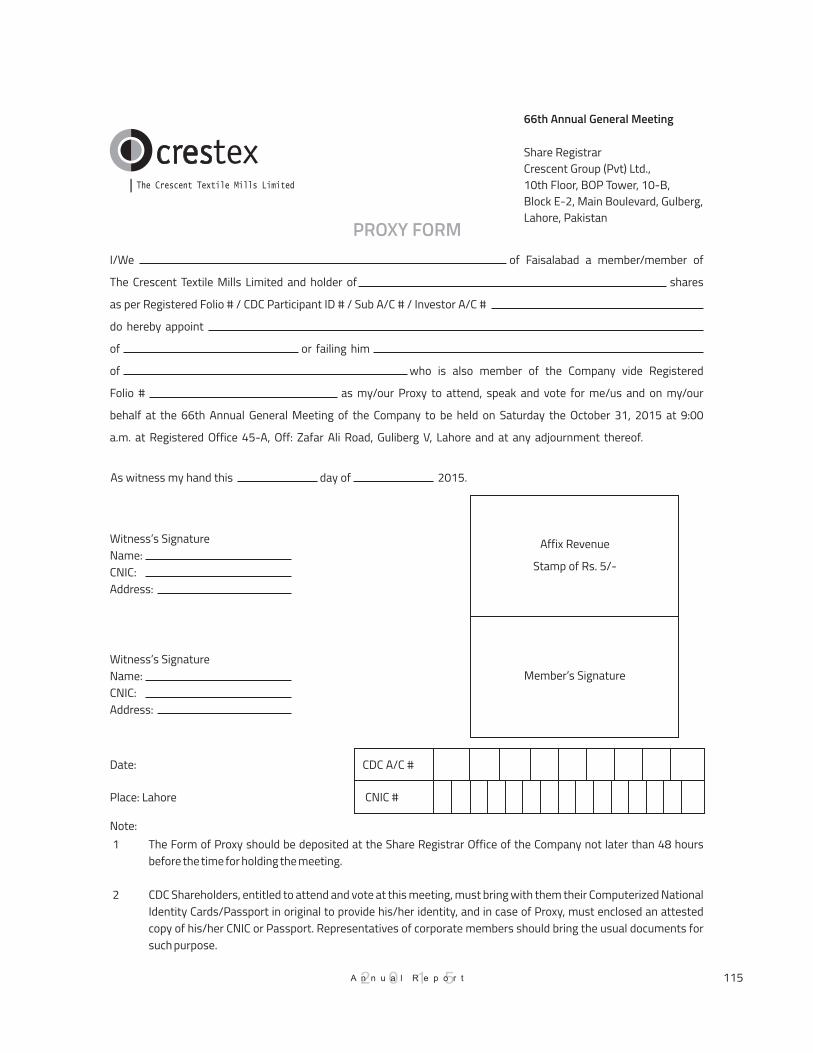
66th Annual General Meeting
Share RegistrarCrescent Group (Pvt) Ltd.,10th Floor, BOP Tower, 10-B,Block E-2, Main Boulevard, Gulberg,Lahore, Pakistan
PROXY FORM
Affix Revenue
Stamp of Rs. 5/-
Member’s Signature
CNIC #
CDC A/C #
The Form of Proxy should be deposited at the Share Registrar Office of the Company not later than 48 hours before the time for holding the meeting.
CDC Shareholders, entitled to attend and vote at this meeting, must bring with them their Computerized National Identity Cards/Passport in original to provide his/her identity, and in case of Proxy, must enclosed an attested copy of his/her CNIC or Passport. Representatives of corporate members should bring the usual documents for such purpose.
As witness my hand this day of 2015.
Witness’s SignatureName:CNIC:Address:
Witness’s SignatureName:CNIC:Address:
Date:
Place: Lahore
Note:1
2
I/We of Faisalabad a member/member of
The Crescent Textile Mills Limited and holder of shares
as per Registered Folio # / CDC Participant ID # / Sub A/C # / Investor A/C #
do hereby appoint
of or failing him
of who is also member of the Company vide Registered
Folio # as my/our Proxy to attend, speak and vote for me/us and on my/our
behalf at the 66th Annual General Meeting of the Company to be held on Saturday the October 31, 2015 at 9:00
a.m. at Registered Office 45-A, Off: Zafar Ali Road, Guliberg V, Lahore and at any adjournment thereof.
2 0 1 5A n n u a l R e p o r t 115

2 0 1 5A n n u a l R e p o r t116

B o o k P o s t
Mills & Head OfficeSargodha Road,
Faisalabad, PakistanT: +92-41-111-105-105F: +92-41-111-103-104
Registered Office45-A, Off: Zafar Ali Road, Gulberg-V,
Lahore, PakistanT: +92-42-111-245-245F: +92-42-111-222-245
Share RegistrarCrescent Group (Pvt) Ltd
10th Floor BOP Tower, 10-B, Block E - 2, Main Boulevard, Gulberg,
Lahore, PakistanT: +92-42-35783801-2
F: +92-42-35783811E: [email protected]
w w w . c t m . c o m . p k
If undelivered, please return to:


![The Pakistan Credit Rating Agency Limited · Cotton Mill in Faisalabad [formerly Lyallpur]3. ... Karachi, Kohinoor at Rawalpindi, Nishat, Crescent Textile in Faisalabad and Colony](https://img.dokumen.tips/doc/110x75/5ec112568147643b1241b7bd/the-pakistan-credit-rating-agency-cotton-mill-in-faisalabad-formerly-lyallpur3.jpg)