Embed Size (px)
Citation preview
05-FEB-15Profile_transitional_ctrs_2015_01.pdf
Inmate Statistical Profile
Active Inmates In Transition Centers
Produced for
General Distribution
Georgia Department of Corrections
Operations, Planning, and Training DivisionPlanning and Analysis Section
Information within contains data on all offenders with Scribe Status of INMATE, includingthose Out To Court, Reprieves, Conditional Transfers, Escapes, etc
Georgia Dept of Corrections 05-FEB-15Inmate Statistical ProfileActive Inmates In Transition Centers
Table of Contents Demographic information
Correctional information
Educational, psychological and physical information
Current age, broken out in ten year age groups
Race group
Marital status, self-reported at entry to prison
Number of children, self-reported at entry to prison
Religious affiliation, self-reported at entry to prison
Home county - self-reported at entry to prison
Employment status before prison, self-reported at entry to prison
Age at admission
Height, measured at entry to prison
Weight, measured at entry to prison
Military service
Type of admission to prison
Current / last institution type
Institution type - transitional centers
Institution type - county prisons
Institution type - state prisons
Institution type - private prisons
Institution type - inmate boot camp
Number of disciplinary reports
Number of transfers
Number of escapes
Split sentence - Probation to follow
Probable future release type of still active inmates
Time served in current (or last) institution
Highest grade level attained
Culture fair IQ scores
Wide Range Achievement Test (WRAT) reading score
Wide Range Achievement Test (WRAT) math score
36
5
6
7
8
9
14
15
17
18
19
20
21
22
23
24
25
26
27
28
29
30
31
32
33
34
35
36
Produced for General Distribution
Contents
Georgia Dept of Corrections 05-FEB-15Inmate Statistical ProfileActive Inmates In Transition Centers
Table of Contents Educational, psychological and physical information
Crimes and criminal history information
Medical information
Wide Range Achievement Test (WRAT) spelling score
Current / last mental health treatment level
PULHESDWIT medical scale - 'P' overall condition ('P'hysical)
PULHESDWIT medical scale - 'U' upper body
PULHESDWIT medical scale - 'L' lower body
PULHESDWIT medical scale - 'H' hearing
PULHESDWIT medical scale - 'E' vision
PULHESDWIT medical scale -'S' psychiatric
PULHESDWIT medical scale - 'D' dental
PULHESDWIT medical scale - 'W' work ability
PULHESDWIT medical scale - 'I' impairment
PULHESDWIT medical scale - 'T' transportability
Number of prior Georgia incarcerations
Prison sentence in years
Primary offense, broken out into felonies vs misdemeanors
Primary offense, broken out into six broad crime categories
Primary offense, detailed offense code
County of conviction of primary offense
Circuit of conviction of primary offense
Years served (jail + prison) in this incarceration
Results of most recent HIV test
Results of most recent tuberculosis test
Results of most recent syphilis test
Results of most recent Hepatitis-C test
37
38
39
40
41
42
43
44
45
46
47
48
49
50
51
52
53
57
62
64
65
66
67
68
Produced for General Distribution
Contents

Current age group Page 4Inmate Statistical Profile
Georgia Dept of Corrections Inmate Statistical ProfileActive Inmates In Transition Centers
Current age, broken out in ten-year age groups
COL % - percent each COUNT is of its particular column ROW % - percent each COUNT is of its particular row
Male
Teens (1-19) Twenties (20-29) Thirties (30-39) Forties (40-49) Fifties (50-59) Sixties (60-69) Seventy + (70 and above)
10 577 694 452 289
61 5
0.48% 27.63% 33.24% 21.65% 13.84%
2.92% 0.24%
90.91% 87.56% 86.53% 84.33% 90.88% 96.83%
100.00%
1 82
108 84 29 2
0.33% 26.80% 35.29% 27.45%
9.48% 0.65%
9.09% 12.44% 13.47% 15.67%
9.12% 3.17%
11 659 802 536 318
63 5
0.46% 27.53% 33.50% 22.39% 13.28%
2.63% 0.21%
87.22% 12.78% 2,088 100% 306 100% 2,394 100% Total Reported
Current Age Count Col % Row % Count Col % Row % Total Col %
Not Reported Grand Total
0 2,088
0 306
0 2,394
Mean (average) 37.3736 Median (middle)
Mode (most frequent) 303632
3630
36.69 37.28
Female Total
Produced for General Distribution
Page05-FEB-15 4
Race group Page 37Inmate Statistical Profile
Georgia Dept of Corrections Inmate Statistical ProfileActive Inmates In Transition Centers
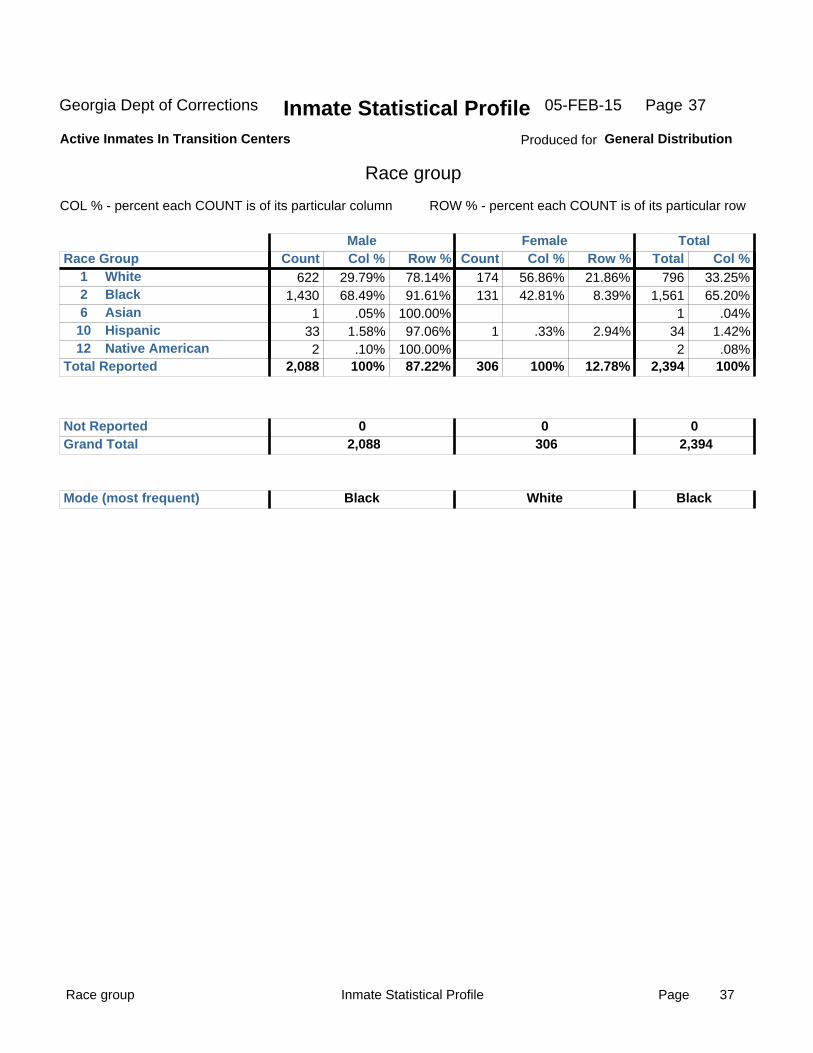
Race group
COL % - percent each COUNT is of its particular column ROW % - percent each COUNT is of its particular row
Male
126
1012
WhiteBlackAsianHispanicNative American
622 1,430
1 33 2
29.79% 68.49%
.05% 1.58% .10%
78.14% 91.61%
100.00% 97.06%
100.00%
174 131
1
56.86% 42.81%
.33%
21.86% 8.39%
2.94%
796 1,561
1 34 2
33.25% 65.20%
.04% 1.42% .08%
87.22% 12.78% 2,088 100% 306 100% 2,394 100% Total Reported
Race Group Count Col % Row % Count Col % Row % Total Col %
Not Reported Grand Total
0 2,088
0 306
0 2,394
Mode (most frequent) Black White Black
Female Total
Produced for General Distribution
Page05-FEB-15 37

Marital status Page 6Inmate Statistical Profile
Georgia Dept of Corrections Inmate Statistical ProfileActive Inmates In Transition Centers
Marital status, self-reported at entry to prison
COL % - percent each COUNT is of its particular column ROW % - percent each COUNT is of its particular row
Male
0DMSUW
UnknownDivorcedMarriedSeparatedUnmarriedWidow
2 178 271
77 1,549
11
.10% 8.52%
12.98% 3.69%
74.19% .53%
100.00% 77.06% 85.49% 73.33% 90.22% 50.00%
53 46 28
168 11
17.32% 15.03%
9.15% 54.90%
3.59%
22.94% 14.51% 26.67%
9.78% 50.00%
2 231 317 105
1,717 22
.08% 9.65%
13.24% 4.39%
71.72% .92%
87.22% 12.78% 2,088 100% 306 100% 2,394 100% Total Reported
Marital Status Count Col % Row % Count Col % Row % Total Col %
Not Reported Grand Total
0 2,088
0 306
0 2,394
Mode (most frequent) Unmarried Unmarried Unmarried
Female Total
Produced for General Distribution
Page05-FEB-15 6
Number of children Page 7Inmate Statistical Profile
Georgia Dept of Corrections Inmate Statistical ProfileActive Inmates In Transition Centers
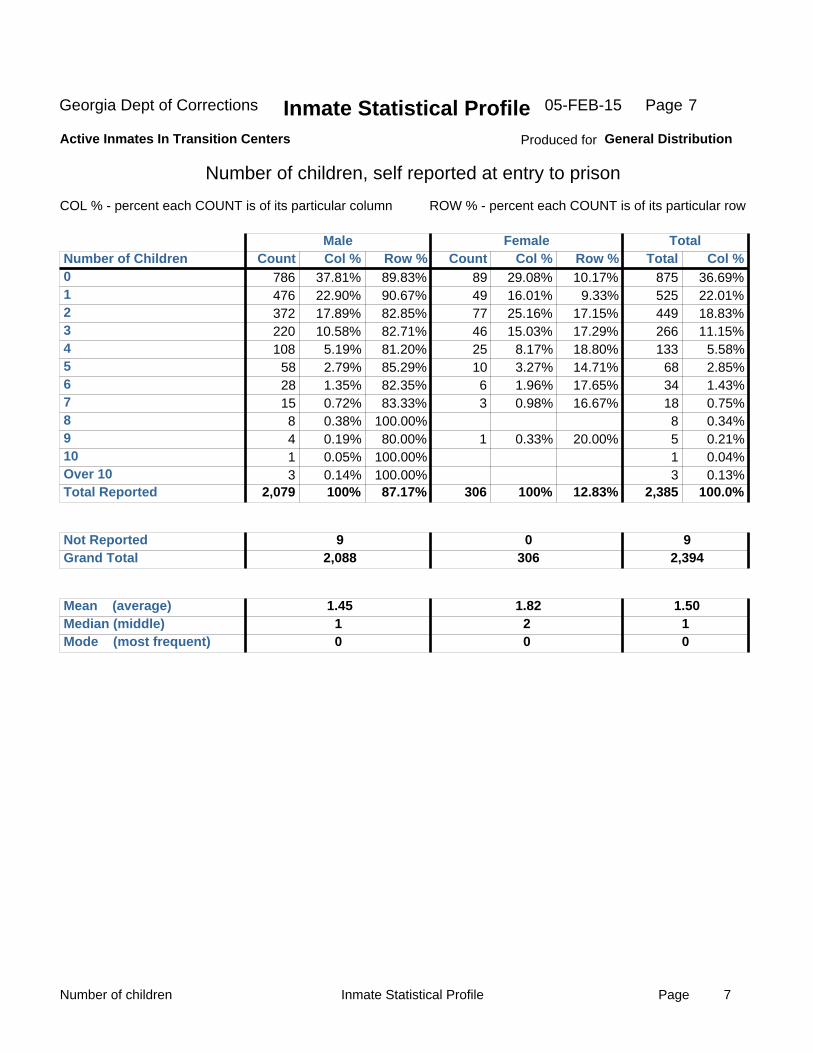
Number of children, self reported at entry to prison
COL % - percent each COUNT is of its particular column ROW % - percent each COUNT is of its particular row
Male
0 1 2 3 4 5 6 7 8 9 10 Over 10
786 476 372 220 108
58 28 15 8 4 1 3
37.81% 22.90% 17.89% 10.58%
5.19% 2.79% 1.35% 0.72% 0.38% 0.19% 0.05% 0.14%
89.83% 90.67% 82.85% 82.71% 81.20% 85.29% 82.35% 83.33%
100.00% 80.00%
100.00% 100.00%
89 49 77 46 25 10 6 3
1
29.08% 16.01% 25.16% 15.03%
8.17% 3.27% 1.96% 0.98%
0.33%
10.17% 9.33%
17.15% 17.29% 18.80% 14.71% 17.65% 16.67%
20.00%
875 525 449 266 133
68 34 18 8 5 1 3
36.69% 22.01% 18.83% 11.15%
5.58% 2.85% 1.43% 0.75% 0.34% 0.21% 0.04% 0.13%
87.17% 12.83% 2,079 100% 306 100% 2,385 100.0% Total Reported
Number of Children Count Row % Col % Count Col % Row % Total Col %
Not Reported Grand Total
9 2,088
0 306
9 2,394
Mean (average) 1.451 Median (middle)
Mode (most frequent) 020
10
1.82 1.50
Female Total
Produced for General Distribution
Page05-FEB-15 7
Religious affiliation Page 8Inmate Statistical Profile
Georgia Dept of Corrections Inmate Statistical ProfileActive Inmates In Transition Centers
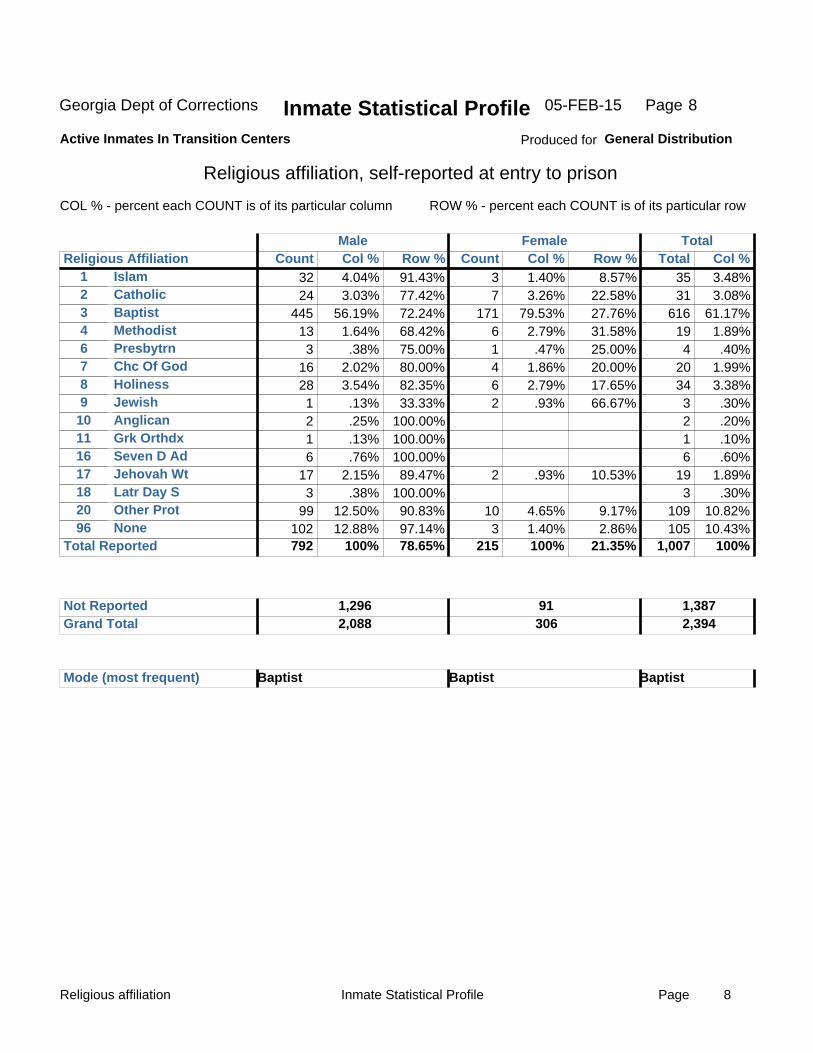
Religious affiliation, self-reported at entry to prison
COL % - percent each COUNT is of its particular column ROW % - percent each COUNT is of its particular row
Male
12346789
10111617182096
IslamCatholicBaptistMethodistPresbytrnChc Of GodHolinessJewishAnglicanGrk OrthdxSeven D AdJehovah WtLatr Day SOther ProtNone
32 24
445 13 3
16 28 1 2 1 6
17 3
99 102
4.04% 3.03%
56.19% 1.64% .38%
2.02% 3.54% .13% .25% .13% .76%
2.15% .38%
12.50% 12.88%
91.43% 77.42% 72.24% 68.42% 75.00% 80.00% 82.35% 33.33%
100.00% 100.00% 100.00% 89.47%
100.00% 90.83% 97.14%
3 7
171 6 1 4 6 2
2
10 3
1.40% 3.26%
79.53% 2.79% .47%
1.86% 2.79% .93%
.93%
4.65% 1.40%
8.57% 22.58% 27.76% 31.58% 25.00% 20.00% 17.65% 66.67%
10.53%
9.17% 2.86%
35 31
616 19 4
20 34 3 2 1 6
19 3
109 105
3.48% 3.08%
61.17% 1.89% .40%
1.99% 3.38% .30% .20% .10% .60%
1.89% .30%
10.82% 10.43%
78.65% 21.35% 792 100% 215 100% 1,007 100% Total Reported
Religious Affiliation Count Col % Row % Count Col % Row % Total Col %
Not Reported Grand Total
1,296 2,088
91 306
1,387 2,394
Baptist Mode (most frequent) Baptist Baptist
Female Total
Produced for General Distribution
Page05-FEB-15 8
Home county Inmate Statistical Profile 9Page
Georgia Dept of Corrections Inmate Statistical ProfileActive Inmates In Transition Centers
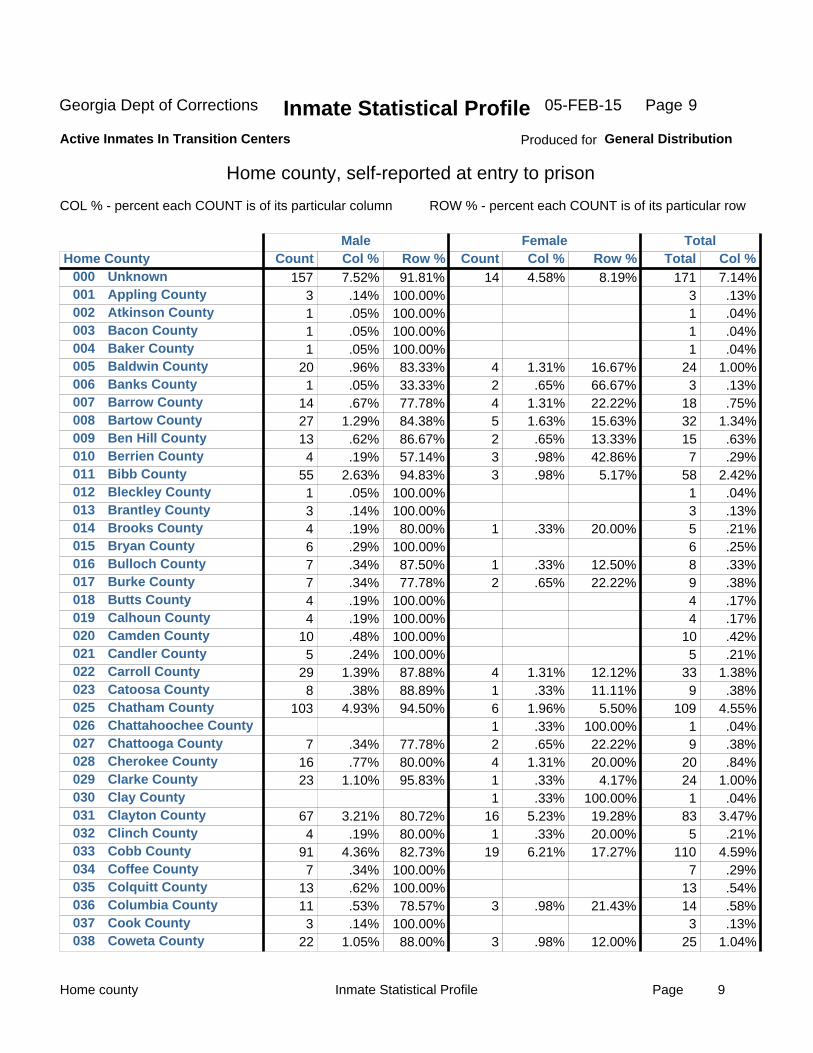
Home county, self-reported at entry to prison
COL % - percent each COUNT is of its particular column ROW % - percent each COUNT is of its particular row
Male
000001002003004005006007008009010011012013014015016017018019020021022023025026027028029030031032033034035036037038
UnknownAppling CountyAtkinson CountyBacon CountyBaker CountyBaldwin CountyBanks CountyBarrow CountyBartow CountyBen Hill CountyBerrien CountyBibb CountyBleckley CountyBrantley CountyBrooks CountyBryan CountyBulloch CountyBurke CountyButts CountyCalhoun CountyCamden CountyCandler CountyCarroll CountyCatoosa CountyChatham CountyChattahoochee CountyChattooga CountyCherokee CountyClarke CountyClay CountyClayton CountyClinch CountyCobb CountyCoffee CountyColquitt CountyColumbia CountyCook CountyCoweta County
157 3 1 1 1
20 1
14 27 13 4
55 1 3 4 6 7 7 4 4
10 5
29 8
103
7 16 23
67 4
91 7
13 11 3
22
7.52% .14% .05% .05% .05% .96% .05% .67%
1.29% .62% .19%
2.63% .05% .14% .19% .29% .34% .34% .19% .19% .48% .24%
1.39% .38%
4.93%
.34% .77%
1.10%
3.21% .19%
4.36% .34% .62% .53% .14%
1.05%
91.81% 100.00% 100.00% 100.00% 100.00% 83.33% 33.33% 77.78% 84.38% 86.67% 57.14% 94.83%
100.00% 100.00% 80.00%
100.00% 87.50% 77.78%
100.00% 100.00% 100.00% 100.00% 87.88% 88.89% 94.50%
77.78% 80.00% 95.83%
80.72% 80.00% 82.73%
100.00% 100.00% 78.57%
100.00% 88.00%
14
4 2 4 5 2 3 3
1
1 2
4 1 6 1 2 4 1 1
16 1
19
3
3
4.58%
1.31% .65%
1.31% 1.63% .65% .98% .98%
.33%
.33% .65%
1.31% .33%
1.96% .33% .65%
1.31% .33% .33%
5.23% .33%
6.21%
.98%
.98%
8.19%
16.67% 66.67% 22.22% 15.63% 13.33% 42.86%
5.17%
20.00%
12.50% 22.22%
12.12% 11.11%
5.50% 100.00% 22.22% 20.00%
4.17% 100.00% 19.28% 20.00% 17.27%
21.43%
12.00%
171 3 1 1 1
24 3
18 32 15 7
58 1 3 5 6 8 9 4 4
10 5
33 9
109 1 9
20 24 1
83 5
110 7
13 14 3
25
7.14% .13% .04% .04% .04%
1.00% .13% .75%
1.34% .63% .29%
2.42% .04% .13% .21% .25% .33% .38% .17% .17% .42% .21%
1.38% .38%
4.55% .04% .38% .84%
1.00% .04%
3.47% .21%
4.59% .29% .54% .58% .13%
1.04%
Home County Count Col % Row % Count Col % Row % Total Col % Female Total
Produced for General Distribution
Page05-FEB-15 9
Home county Inmate Statistical Profile 10Page
Georgia Dept of Corrections Inmate Statistical ProfileActive Inmates In Transition Centers
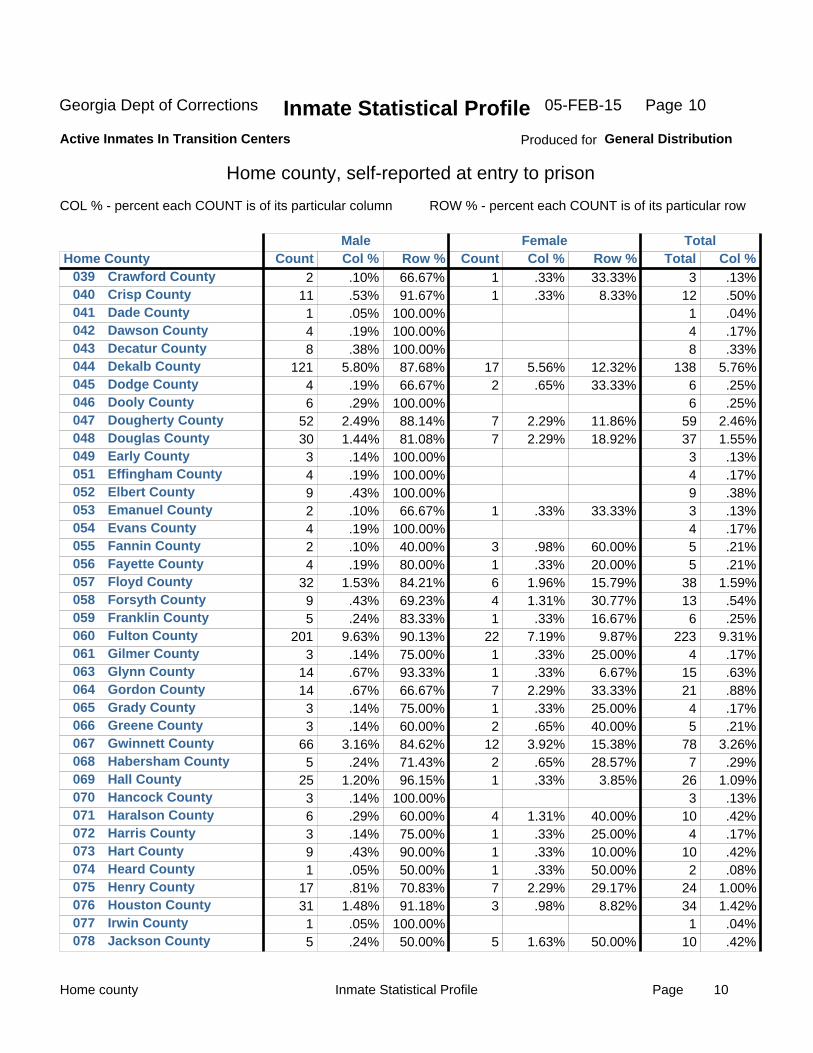
Home county, self-reported at entry to prison
COL % - percent each COUNT is of its particular column ROW % - percent each COUNT is of its particular row
Male
039040041042043044045046047048049051052053054055056057058059060061063064065066067068069070071072073074075076077078
Crawford CountyCrisp CountyDade CountyDawson CountyDecatur CountyDekalb CountyDodge CountyDooly CountyDougherty CountyDouglas CountyEarly CountyEffingham CountyElbert CountyEmanuel CountyEvans CountyFannin CountyFayette CountyFloyd CountyForsyth CountyFranklin CountyFulton CountyGilmer CountyGlynn CountyGordon CountyGrady CountyGreene CountyGwinnett CountyHabersham CountyHall CountyHancock CountyHaralson CountyHarris CountyHart CountyHeard CountyHenry CountyHouston CountyIrwin CountyJackson County
2 11 1 4 8
121 4 6
52 30 3 4 9 2 4 2 4
32 9 5
201 3
14 14 3 3
66 5
25 3 6 3 9 1
17 31 1 5
.10% .53% .05% .19% .38%
5.80% .19% .29%
2.49% 1.44% .14% .19% .43% .10% .19% .10% .19%
1.53% .43% .24%
9.63% .14% .67% .67% .14% .14%
3.16% .24%
1.20% .14% .29% .14% .43% .05% .81%
1.48% .05% .24%
66.67% 91.67%
100.00% 100.00% 100.00% 87.68% 66.67%
100.00% 88.14% 81.08%
100.00% 100.00% 100.00% 66.67%
100.00% 40.00% 80.00% 84.21% 69.23% 83.33% 90.13% 75.00% 93.33% 66.67% 75.00% 60.00% 84.62% 71.43% 96.15%
100.00% 60.00% 75.00% 90.00% 50.00% 70.83% 91.18%
100.00% 50.00%
1 1
17 2
7 7
1
3 1 6 4 1
22 1 1 7 1 2
12 2 1
4 1 1 1 7 3
5
.33% .33%
5.56% .65%
2.29% 2.29%
.33%
.98% .33%
1.96% 1.31% .33%
7.19% .33% .33%
2.29% .33% .65%
3.92% .65% .33%
1.31% .33% .33% .33%
2.29% .98%
1.63%
33.33% 8.33%
12.32% 33.33%
11.86% 18.92%
33.33%
60.00% 20.00% 15.79% 30.77% 16.67%
9.87% 25.00%
6.67% 33.33% 25.00% 40.00% 15.38% 28.57%
3.85%
40.00% 25.00% 10.00% 50.00% 29.17%
8.82%
50.00%
3 12 1 4 8
138 6 6
59 37 3 4 9 3 4 5 5
38 13 6
223 4
15 21 4 5
78 7
26 3
10 4
10 2
24 34 1
10
.13% .50% .04% .17% .33%
5.76% .25% .25%
2.46% 1.55% .13% .17% .38% .13% .17% .21% .21%
1.59% .54% .25%
9.31% .17% .63% .88% .17% .21%
3.26% .29%
1.09% .13% .42% .17% .42% .08%
1.00% 1.42% .04% .42%
Home County Count Col % Row % Count Col % Row % Total Col % Female Total
Produced for General Distribution
Page05-FEB-15 10

Home county Inmate Statistical Profile 11Page
Georgia Dept of Corrections Inmate Statistical ProfileActive Inmates In Transition Centers
Home county, self-reported at entry to prison
COL % - percent each COUNT is of its particular column ROW % - percent each COUNT is of its particular row
Male
079080081082084085086087088089091092093094095097098099100101102103104105106107108109110111112113114115116117118119
Jasper CountyJeff Davis CountyJefferson CountyJenkins CountyJones CountyLamar CountyLanier CountyLaurens CountyLee CountyLiberty CountyLong CountyLowndes CountyLumpkin CountyMacon CountyMadison CountyMcduffie CountyMcintosh CountyMeriwether CountyMiller CountyMitchell CountyMonroe CountyMontgomery CountyMorgan CountyMurray CountyMuscogee CountyNewton CountyOconee CountyOglethorpe CountyPaulding CountyPeach CountyPickens CountyPierce CountyPike CountyPolk CountyPulaski CountyPutnam CountyQuitman CountyRabun County
6 2 7 5 5 2 1 9 6 8 1
29 5 4 7 5 4
10 1 7 7 2 2 7
57 20 2 2
15 5 5 7 1
11 5 8 1 1
.29% .10% .34% .24% .24% .10% .05% .43% .29% .38% .05%
1.39% .24% .19% .34% .24% .19% .48% .05% .34% .34% .10% .10% .34%
2.73% .96% .10% .10% .72% .24% .24% .34% .05% .53% .24% .38% .05% .05%
85.71% 100.00% 87.50%
100.00% 83.33%
100.00% 100.00% 75.00%
100.00% 88.89%
100.00% 85.29% 83.33%
100.00% 87.50% 83.33%
100.00% 76.92%
100.00% 77.78% 87.50%
100.00% 100.00% 77.78% 93.44% 86.96%
100.00% 66.67% 93.75% 83.33% 71.43%
100.00% 100.00% 100.00% 100.00% 88.89% 50.00%
100.00%
1
1
1
3
1
5 1
1 1
3
2 1
2 4 3
1 1 1 2
1 1
.33%
.33%
.33%
.98%
.33%
1.63% .33%
.33% .33%
.98%
.65% .33%
.65% 1.31% .98%
.33% .33% .33% .65%
.33% .33%
14.29%
12.50%
16.67%
25.00%
11.11%
14.71% 16.67%
12.50% 16.67%
23.08%
22.22% 12.50%
22.22% 6.56%
13.04%
33.33% 6.25%
16.67% 28.57%
11.11% 50.00%
7 2 8 5 6 2 1
12 6 9 1
34 6 4 8 6 4
13 1 9 8 2 2 9
61 23 2 3
16 6 7 7 1
11 5 9 2 1
.29% .08% .33% .21% .25% .08% .04% .50% .25% .38% .04%
1.42% .25% .17% .33% .25% .17% .54% .04% .38% .33% .08% .08% .38%
2.55% .96% .08% .13% .67% .25% .29% .29% .04% .46% .21% .38% .08% .04%
Home County Count Col % Row % Count Col % Row % Total Col % Female Total
Produced for General Distribution
Page05-FEB-15 11
Home county Inmate Statistical Profile 12Page
Georgia Dept of Corrections Inmate Statistical ProfileActive Inmates In Transition Centers
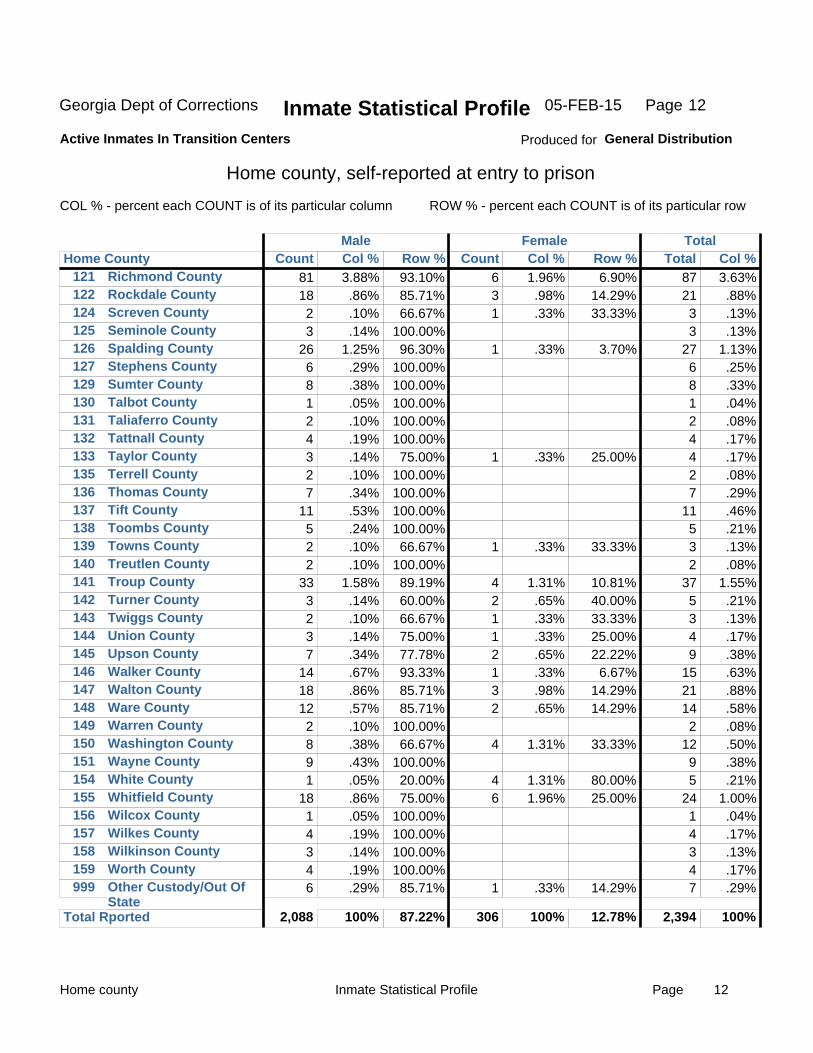
Home county, self-reported at entry to prison
COL % - percent each COUNT is of its particular column ROW % - percent each COUNT is of its particular row
Male
121122124125126127129130131132133135136137138139140141142143144145146147148149150151154155156157158159999
Richmond CountyRockdale CountyScreven CountySeminole CountySpalding CountyStephens CountySumter CountyTalbot CountyTaliaferro CountyTattnall CountyTaylor CountyTerrell CountyThomas CountyTift CountyToombs CountyTowns CountyTreutlen CountyTroup CountyTurner CountyTwiggs CountyUnion CountyUpson CountyWalker CountyWalton CountyWare CountyWarren CountyWashington CountyWayne CountyWhite CountyWhitfield CountyWilcox CountyWilkes CountyWilkinson CountyWorth CountyOther Custody/Out OfState
81 18 2 3
26 6 8 1 2 4 3 2 7
11 5 2 2
33 3 2 3 7
14 18 12 2 8 9 1
18 1 4 3 4 6
3.88% .86% .10% .14%
1.25% .29% .38% .05% .10% .19% .14% .10% .34% .53% .24% .10% .10%
1.58% .14% .10% .14% .34% .67% .86% .57% .10% .38% .43% .05% .86% .05% .19% .14% .19% .29%
93.10% 85.71% 66.67%
100.00% 96.30%
100.00% 100.00% 100.00% 100.00% 100.00% 75.00%
100.00% 100.00% 100.00% 100.00% 66.67%
100.00% 89.19% 60.00% 66.67% 75.00% 77.78% 93.33% 85.71% 85.71%
100.00% 66.67%
100.00% 20.00% 75.00%
100.00% 100.00% 100.00% 100.00% 85.71%
6 3 1
1
1
1
4 2 1 1 2 1 3 2
4
4 6
1
1.96% .98% .33%
.33%
.33%
.33%
1.31% .65% .33% .33% .65% .33% .98% .65%
1.31%
1.31% 1.96%
.33%
6.90% 14.29% 33.33%
3.70%
25.00%
33.33%
10.81% 40.00% 33.33% 25.00% 22.22%
6.67% 14.29% 14.29%
33.33%
80.00% 25.00%
14.29%
87 21 3 3
27 6 8 1 2 4 4 2 7
11 5 3 2
37 5 3 4 9
15 21 14 2
12 9 5
24 1 4 3 4 7
3.63% .88% .13% .13%
1.13% .25% .33% .04% .08% .17% .17% .08% .29% .46% .21% .13% .08%
1.55% .21% .13% .17% .38% .63% .88% .58% .08% .50% .38% .21%
1.00% .04% .17% .13% .17% .29%
87.22% 12.78% 2,088 100% 306 100% 2,394 100% Total Rported
Home County Count Col % Row % Count Col % Row % Total Col % Female Total
Produced for General Distribution
Page05-FEB-15 12
Home county Inmate Statistical Profile 13Page
Georgia Dept of Corrections Inmate Statistical ProfileActive Inmates In Transition Centers
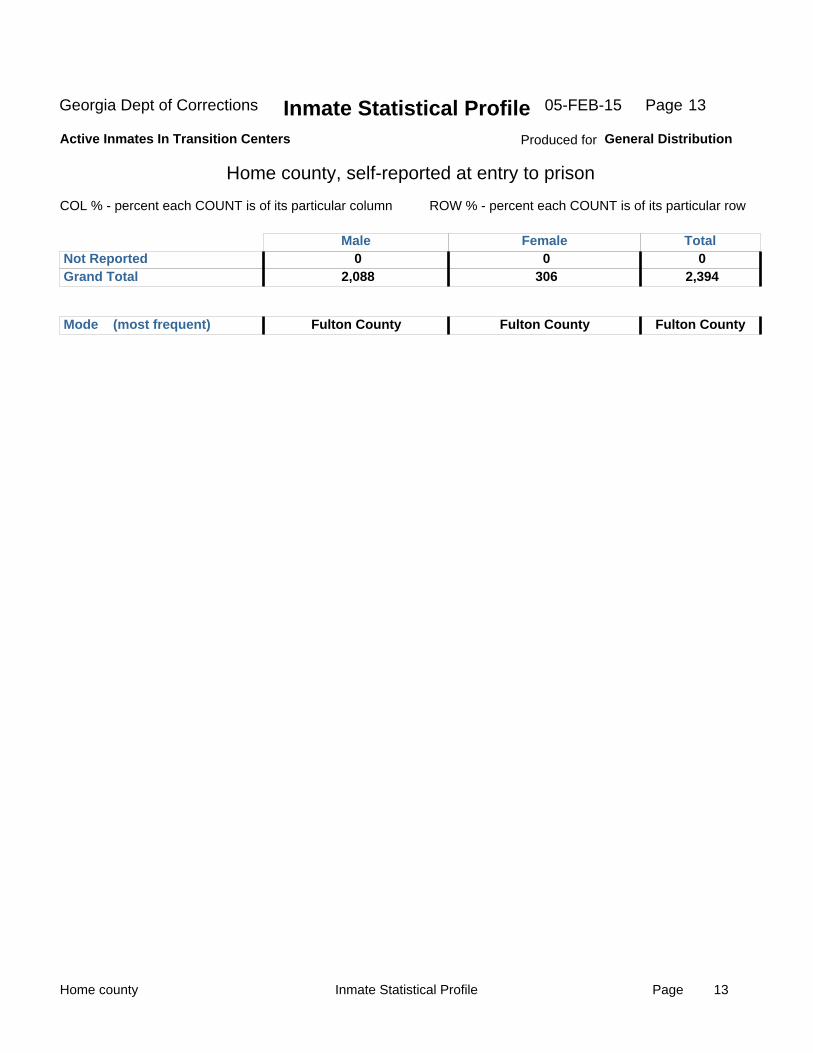
Home county, self-reported at entry to prison
COL % - percent each COUNT is of its particular column ROW % - percent each COUNT is of its particular row
Male Not Reported Grand Total
0 2,088
0 306
0 2,394
Mode (most frequent) Fulton County Fulton County Fulton County
Female Total
Produced for General Distribution
Page05-FEB-15 13
Employment status before prison Page 14Inmate Statistical Profile
Georgia Dept of Corrections Inmate Statistical ProfileActive Inmates In Transition Centers
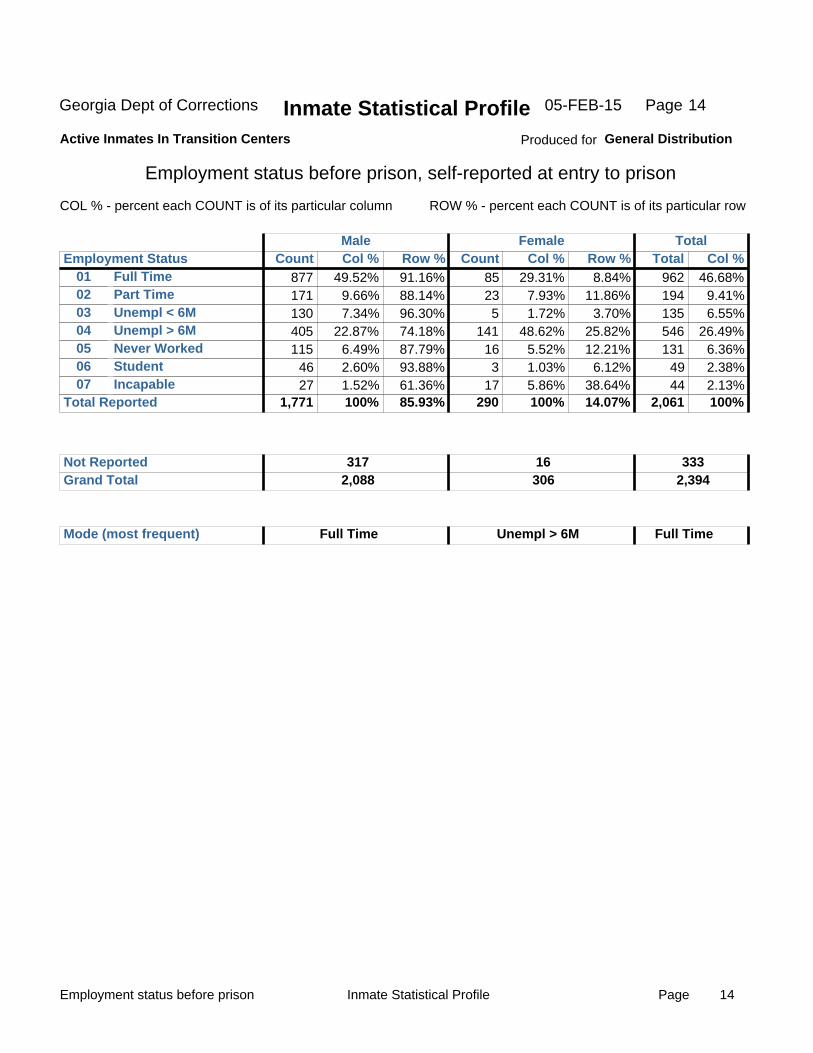
Employment status before prison, self-reported at entry to prison
COL % - percent each COUNT is of its particular column ROW % - percent each COUNT is of its particular row
Male
01020304050607
Full TimePart TimeUnempl < 6MUnempl > 6MNever WorkedStudentIncapable
877 171 130 405 115
46 27
49.52% 9.66% 7.34%
22.87% 6.49% 2.60% 1.52%
91.16% 88.14% 96.30% 74.18% 87.79% 93.88% 61.36%
85 23 5
141 16 3
17
29.31% 7.93% 1.72%
48.62% 5.52% 1.03% 5.86%
8.84% 11.86%
3.70% 25.82% 12.21%
6.12% 38.64%
962 194 135 546 131
49 44
46.68% 9.41% 6.55%
26.49% 6.36% 2.38% 2.13%
85.93% 14.07% 1,771 100% 290 100% 2,061 100% Total Reported
Employment Status Count Col % Row % Count Col % Row % Total Col %
Not Reported Grand Total
317 2,088
16 306
333 2,394
Mode (most frequent) Full Time Unempl > 6M Full Time
Female Total
Produced for General Distribution
Page05-FEB-15 14
Age at admission Page 15Inmate Statistical Profile
Georgia Dept of Corrections Inmate Statistical ProfileActive Inmates In Transition Centers
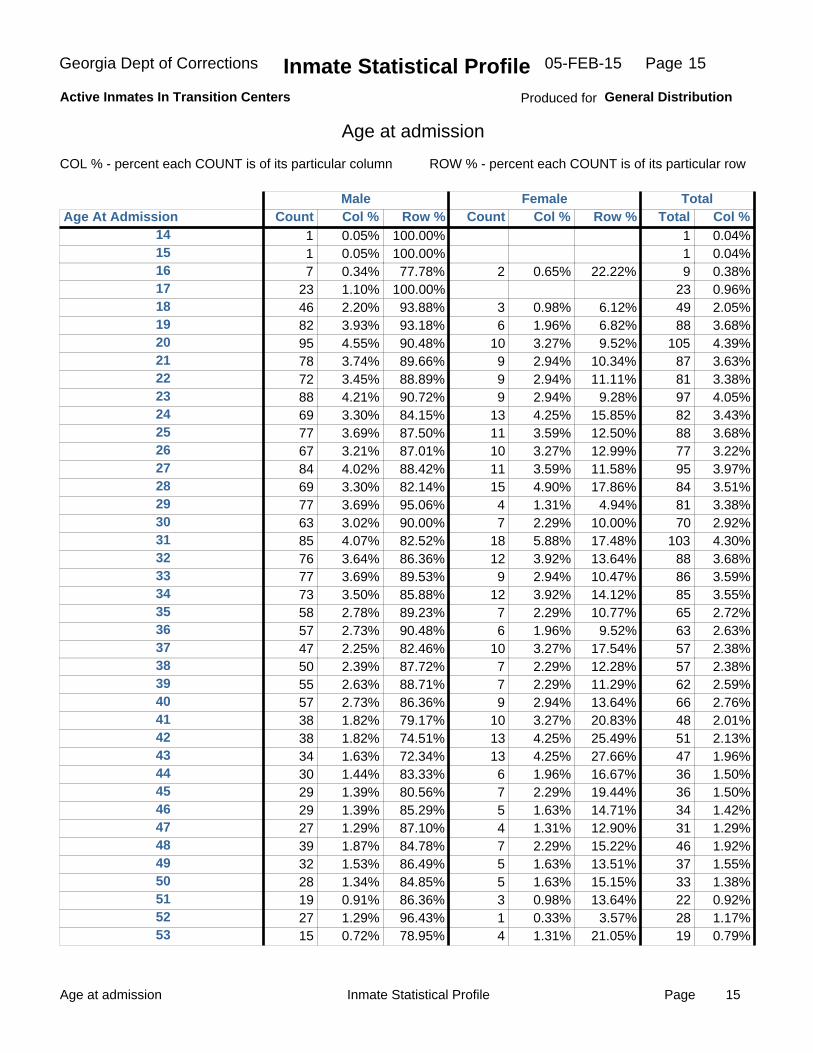
Age at admission
COL % - percent each COUNT is of its particular column ROW % - percent each COUNT is of its particular row
Male
14 15 16 17 18 19 20 21 22 23 24 25 26 27 28 29 30 31 32 33 34 35 36 37 38 39 40 41 42 43 44 45 46 47 48 49 50 51 52 53
1 1 7
23 46 82 95 78 72 88 69 77 67 84 69 77 63 85 76 77 73 58 57 47 50 55 57 38 38 34 30 29 29 27 39 32 28 19 27 15
0.05% 0.05% 0.34% 1.10% 2.20% 3.93% 4.55% 3.74% 3.45% 4.21% 3.30% 3.69% 3.21% 4.02% 3.30% 3.69% 3.02% 4.07% 3.64% 3.69% 3.50% 2.78% 2.73% 2.25% 2.39% 2.63% 2.73% 1.82% 1.82% 1.63% 1.44% 1.39% 1.39% 1.29% 1.87% 1.53% 1.34% 0.91% 1.29% 0.72%
100.00% 100.00% 77.78%
100.00% 93.88% 93.18% 90.48% 89.66% 88.89% 90.72% 84.15% 87.50% 87.01% 88.42% 82.14% 95.06% 90.00% 82.52% 86.36% 89.53% 85.88% 89.23% 90.48% 82.46% 87.72% 88.71% 86.36% 79.17% 74.51% 72.34% 83.33% 80.56% 85.29% 87.10% 84.78% 86.49% 84.85% 86.36% 96.43% 78.95%
2
3 6
10 9 9 9
13 11 10 11 15 4 7
18 12 9
12 7 6
10 7 7 9
10 13 13 6 7 5 4 7 5 5 3 1 4
0.65%
0.98% 1.96% 3.27% 2.94% 2.94% 2.94% 4.25% 3.59% 3.27% 3.59% 4.90% 1.31% 2.29% 5.88% 3.92% 2.94% 3.92% 2.29% 1.96% 3.27% 2.29% 2.29% 2.94% 3.27% 4.25% 4.25% 1.96% 2.29% 1.63% 1.31% 2.29% 1.63% 1.63% 0.98% 0.33% 1.31%
22.22%
6.12% 6.82% 9.52%
10.34% 11.11%
9.28% 15.85% 12.50% 12.99% 11.58% 17.86%
4.94% 10.00% 17.48% 13.64% 10.47% 14.12% 10.77%
9.52% 17.54% 12.28% 11.29% 13.64% 20.83% 25.49% 27.66% 16.67% 19.44% 14.71% 12.90% 15.22% 13.51% 15.15% 13.64%
3.57% 21.05%
1 1 9
23 49 88
105 87 81 97 82 88 77 95 84 81 70
103 88 86 85 65 63 57 57 62 66 48 51 47 36 36 34 31 46 37 33 22 28 19
0.04% 0.04% 0.38% 0.96% 2.05% 3.68% 4.39% 3.63% 3.38% 4.05% 3.43% 3.68% 3.22% 3.97% 3.51% 3.38% 2.92% 4.30% 3.68% 3.59% 3.55% 2.72% 2.63% 2.38% 2.38% 2.59% 2.76% 2.01% 2.13% 1.96% 1.50% 1.50% 1.42% 1.29% 1.92% 1.55% 1.38% 0.92% 1.17% 0.79%
Age At Admission Count Col % Row % Count Col % Row % Total Col % Female Total
Produced for General Distribution
Page05-FEB-15 15
Age at admission Page 16Inmate Statistical Profile
Georgia Dept of Corrections Inmate Statistical ProfileActive Inmates In Transition Centers
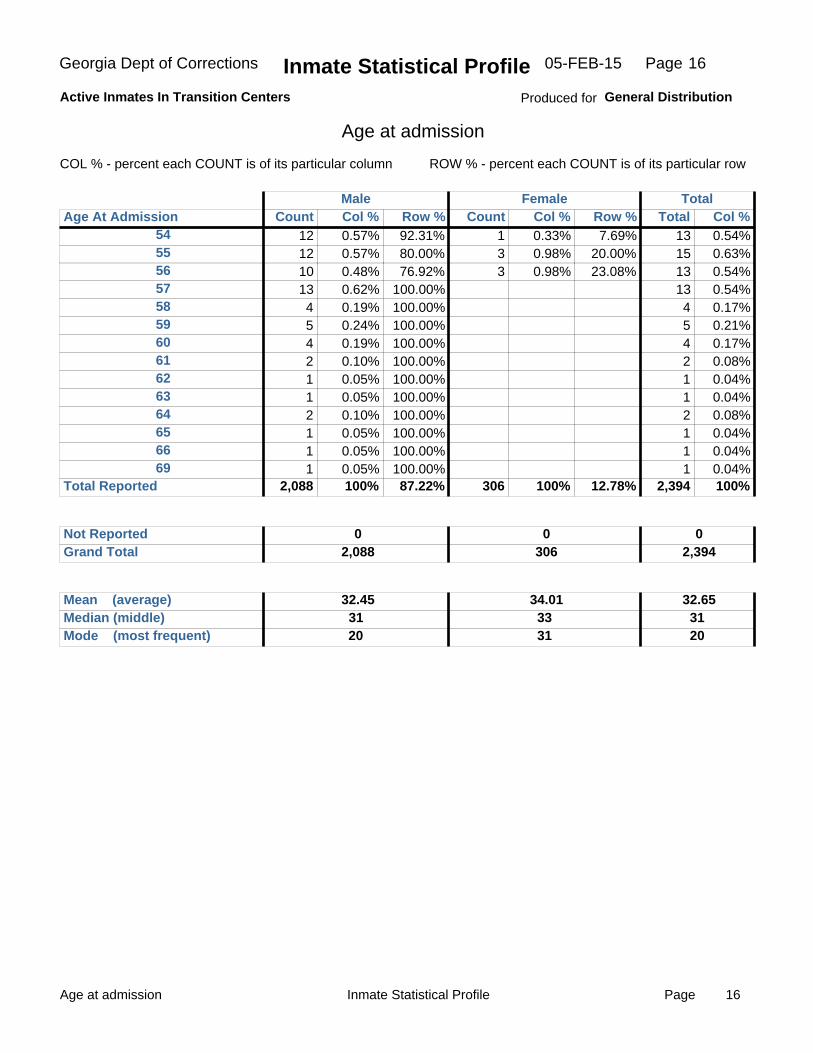
Age at admission
COL % - percent each COUNT is of its particular column ROW % - percent each COUNT is of its particular row
Male
54 55 56 57 58 59 60 61 62 63 64 65 66 69
12 12 10 13 4 5 4 2 1 1 2 1 1 1
0.57% 0.57% 0.48% 0.62% 0.19% 0.24% 0.19% 0.10% 0.05% 0.05% 0.10% 0.05% 0.05% 0.05%
92.31% 80.00% 76.92%
100.00% 100.00% 100.00% 100.00% 100.00% 100.00% 100.00% 100.00% 100.00% 100.00% 100.00%
1 3 3
0.33% 0.98% 0.98%
7.69% 20.00% 23.08%
13 15 13 13 4 5 4 2 1 1 2 1 1 1
0.54% 0.63% 0.54% 0.54% 0.17% 0.21% 0.17% 0.08% 0.04% 0.04% 0.08% 0.04% 0.04% 0.04%
87.22% 12.78% 2,088 100% 306 100% 2,394 100% Total Reported
Age At Admission Count Col % Row % Count Col % Row % Total Col %
Not Reported Grand Total
0 2,088
0 306
0 2,394
Mean (average) 32.4531 Median (middle)
Mode (most frequent) 203331
3120
34.01 32.65
Female Total
Produced for General Distribution
Page05-FEB-15 16

Height Page 17Inmate Statistical Profile
Georgia Dept of Corrections Inmate Statistical ProfileActive Inmates In Transition Centers
Height, measured at entry to prison
COL % - percent each COUNT is of its particular column ROW % - percent each COUNT is of its particular row
Male
4'10'' 4'11'' 5'10'' 5'11'' 6'00'' 6'01''
240 269
2 1
46.88% 52.54%
0.39% 0.20%
96.77% 99.26%
100.00% 100.00%
3 6 8 2
15.79% 31.58% 42.11% 10.53%
100.00% 100.00%
3.23% 0.74%
3 6
248 271
2 1
0.56% 1.13%
46.70% 51.04%
0.38% 0.19%
96.42% 3.58% 512 100% 19 100% 531 100% Total Reported
Height Count Col % Row % Count Col % Row % Total Col %
Not Reported Grand Total
1,576 2,088
287 306
1,863 2,394
Mean (average) 5'11'' 5'11'' Median (middle)
Mode (most frequent) 5'11'' 5'10''
5'10'' 5'11''
5'11''
5'05'' 5'10''
Female Total
Produced for General Distribution
Page05-FEB-15 17
Weight Page 18Inmate Statistical Profile
Georgia Dept of Corrections Inmate Statistical ProfileActive Inmates In Transition Centers
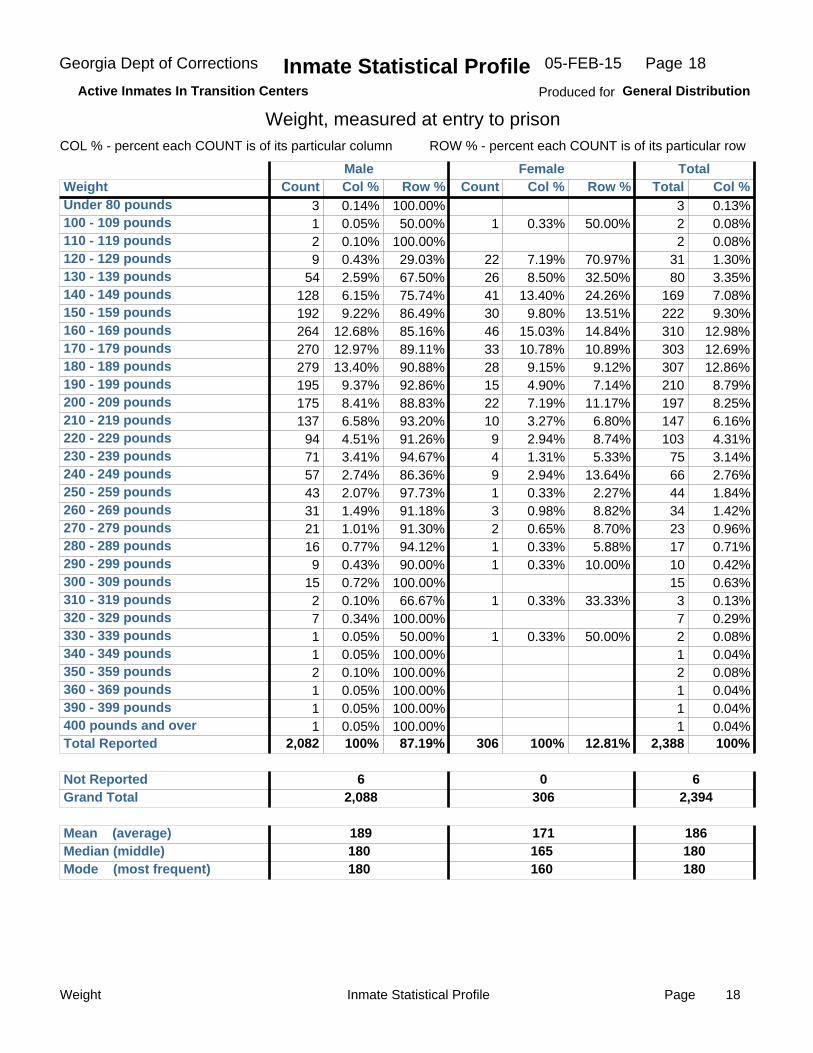
Weight, measured at entry to prisonCOL % - percent each COUNT is of its particular column ROW % - percent each COUNT is of its particular row
Male
Under 80 pounds 100 - 109 pounds 110 - 119 pounds 120 - 129 pounds 130 - 139 pounds 140 - 149 pounds 150 - 159 pounds 160 - 169 pounds 170 - 179 pounds 180 - 189 pounds 190 - 199 pounds 200 - 209 pounds 210 - 219 pounds 220 - 229 pounds 230 - 239 pounds 240 - 249 pounds 250 - 259 pounds 260 - 269 pounds 270 - 279 pounds 280 - 289 pounds 290 - 299 pounds 300 - 309 pounds 310 - 319 pounds 320 - 329 pounds 330 - 339 pounds 340 - 349 pounds 350 - 359 pounds 360 - 369 pounds 390 - 399 pounds 400 pounds and over
3 1 2 9
54 128 192 264 270 279 195 175 137
94 71 57 43 31 21 16 9
15 2 7 1 1 2 1 1 1
0.14% 0.05% 0.10% 0.43% 2.59% 6.15% 9.22%
12.68% 12.97% 13.40%
9.37% 8.41% 6.58% 4.51% 3.41% 2.74% 2.07% 1.49% 1.01% 0.77% 0.43% 0.72% 0.10% 0.34% 0.05% 0.05% 0.10% 0.05% 0.05% 0.05%
100.00% 50.00%
100.00% 29.03% 67.50% 75.74% 86.49% 85.16% 89.11% 90.88% 92.86% 88.83% 93.20% 91.26% 94.67% 86.36% 97.73% 91.18% 91.30% 94.12% 90.00%
100.00% 66.67%
100.00% 50.00%
100.00% 100.00% 100.00% 100.00% 100.00%
1
22 26 41 30 46 33 28 15 22 10 9 4 9 1 3 2 1 1
1
1
0.33%
7.19% 8.50%
13.40% 9.80%
15.03% 10.78%
9.15% 4.90% 7.19% 3.27% 2.94% 1.31% 2.94% 0.33% 0.98% 0.65% 0.33% 0.33%
0.33%
0.33%
50.00%
70.97% 32.50% 24.26% 13.51% 14.84% 10.89%
9.12% 7.14%
11.17% 6.80% 8.74% 5.33%
13.64% 2.27% 8.82% 8.70% 5.88%
10.00%
33.33%
50.00%
3 2 2
31 80
169 222 310 303 307 210 197 147 103
75 66 44 34 23 17 10 15 3 7 2 1 2 1 1 1
0.13% 0.08% 0.08% 1.30% 3.35% 7.08% 9.30%
12.98% 12.69% 12.86%
8.79% 8.25% 6.16% 4.31% 3.14% 2.76% 1.84% 1.42% 0.96% 0.71% 0.42% 0.63% 0.13% 0.29% 0.08% 0.04% 0.08% 0.04% 0.04% 0.04%
87.19% 12.81% 2,082 100% 306 100% 2,388 100% Total Reported
Weight Count Col % Row % Count Col % Row % Total Col %
Not Reported Grand Total
6 2,088
0 306
6 2,394
Mean (average) 189180 Median (middle)
Mode (most frequent) 180165160
180180
171 186
Female Total
Produced for General Distribution
Page05-FEB-15 18
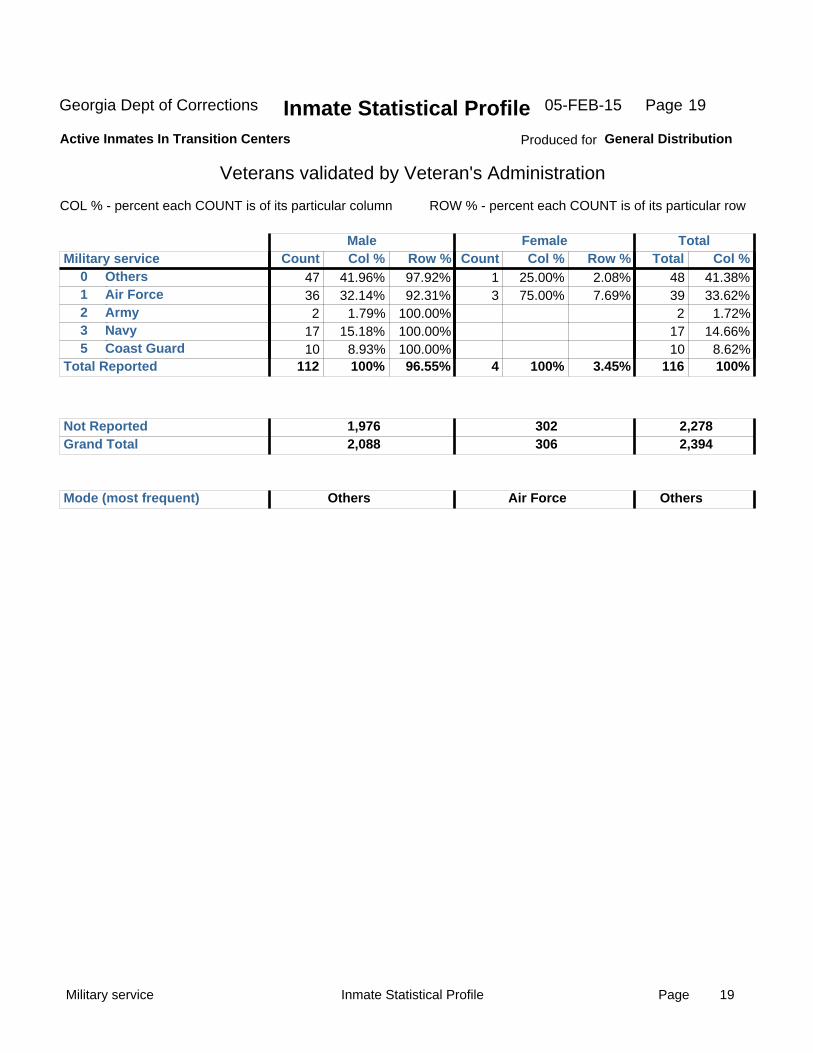
Military service Page 19Inmate Statistical Profile
Georgia Dept of Corrections Inmate Statistical ProfileActive Inmates In Transition Centers
Veterans validated by Veteran's Administration
COL % - percent each COUNT is of its particular column ROW % - percent each COUNT is of its particular row
Male
01235
OthersAir ForceArmyNavyCoast Guard
47 36 2
17 10
41.96% 32.14%
1.79% 15.18%
8.93%
97.92% 92.31%
100.00% 100.00% 100.00%
1 3
25.00% 75.00%
2.08% 7.69%
48 39 2
17 10
41.38% 33.62%
1.72% 14.66%
8.62% 96.55% 3.45% 112 100% 4 100% 116 100% Total Reported
Military service Count Col % Row % Count Col % Row % Total Col %
Not Reported Grand Total
1,976 2,088
302 306
2,278 2,394
Mode (most frequent) Others Air Force Others
Female Total
Produced for General Distribution
Page05-FEB-15 19
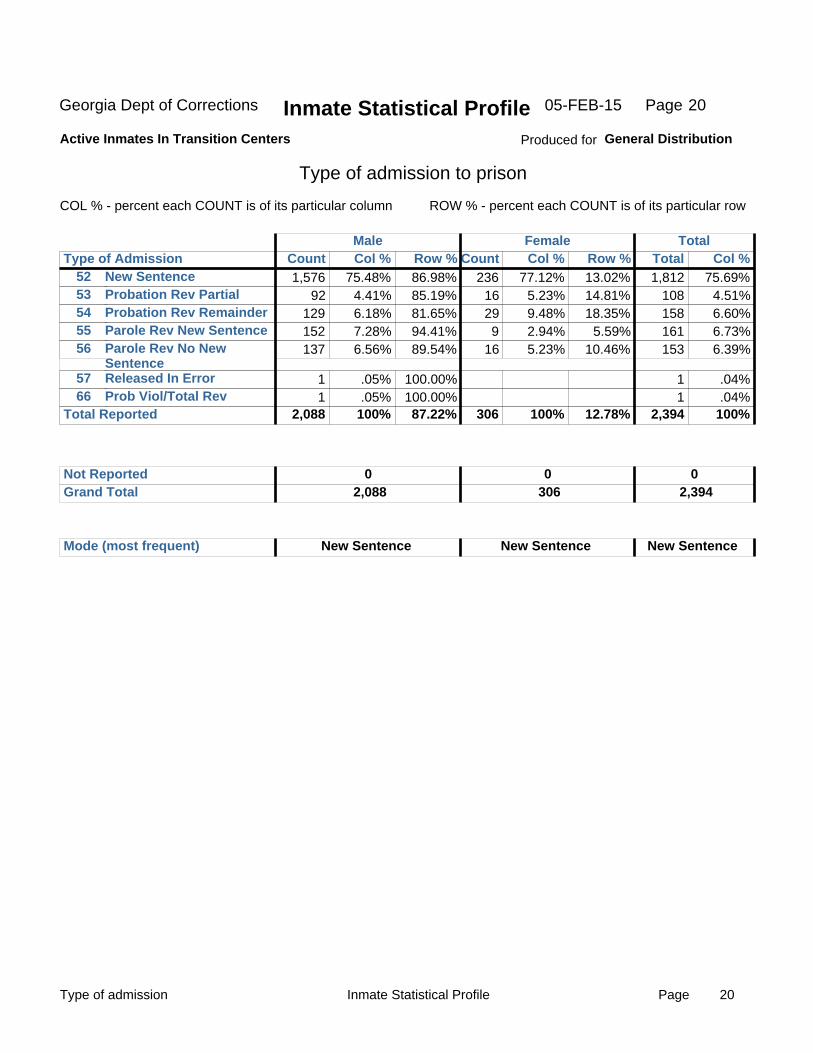
Type of admission Page 20Inmate Statistical Profile
Georgia Dept of Corrections Inmate Statistical ProfileActive Inmates In Transition Centers
Type of admission to prison
COL % - percent each COUNT is of its particular column ROW % - percent each COUNT is of its particular row
Male
5253545556
5766
New SentenceProbation Rev PartialProbation Rev RemainderParole Rev New SentenceParole Rev No NewSentenceReleased In ErrorProb Viol/Total Rev
1,576 92
129 152 137
1 1
75.48% 4.41% 6.18% 7.28% 6.56%
.05% .05%
86.98% 85.19% 81.65% 94.41% 89.54%
100.00% 100.00%
236 16 29 9
16
77.12% 5.23% 9.48% 2.94% 5.23%
13.02% 14.81% 18.35%
5.59% 10.46%
1,812 108 158 161 153
1 1
75.69% 4.51% 6.60% 6.73% 6.39%
.04% .04%
87.22% 12.78% 2,088 100% 306 100% 2,394 100% Total Reported
Type of Admission Count Col % Row % Count Col % Row % Total Col %
Not Reported Grand Total
0 2,088
0 306
0 2,394
New Sentence Mode (most frequent) New Sentence New Sentence
Female Total
Produced for General Distribution
Page05-FEB-15 20
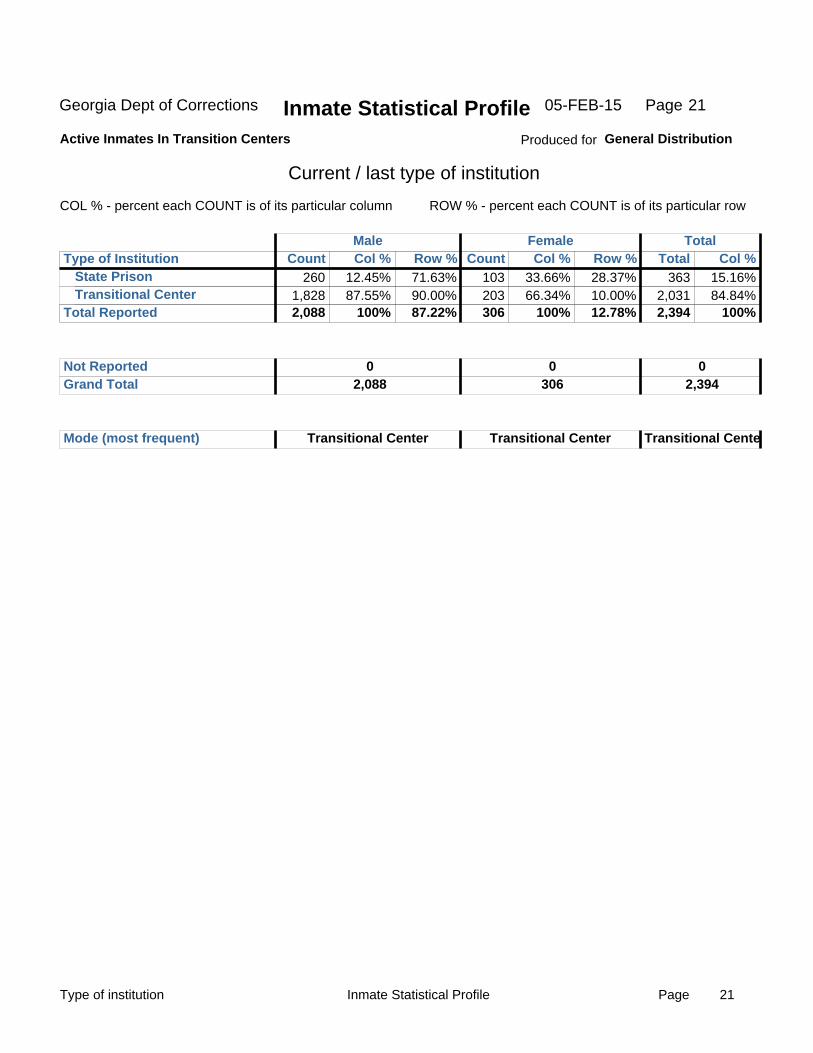
Type of institution Page 21Inmate Statistical Profile
Georgia Dept of Corrections Inmate Statistical ProfileActive Inmates In Transition Centers
Current / last type of institution
COL % - percent each COUNT is of its particular column ROW % - percent each COUNT is of its particular row
Male
State PrisonTransitional Center
260 1,828
12.45% 87.55%
71.63% 90.00%
103 203
33.66% 66.34%
28.37% 10.00%
363 2,031
15.16% 84.84%
87.22% 12.78% 2,088 100% 306 100% 2,394 100% Total Reported
Type of Institution Count Col % Row % Count Col % Row % Total Col %
Not Reported Grand Total
0 2,088
0 306
0 2,394
Transitional Center Mode (most frequent) Transitional Center Transitional Cente
Female Total
Produced for General Distribution
Page05-FEB-15 21
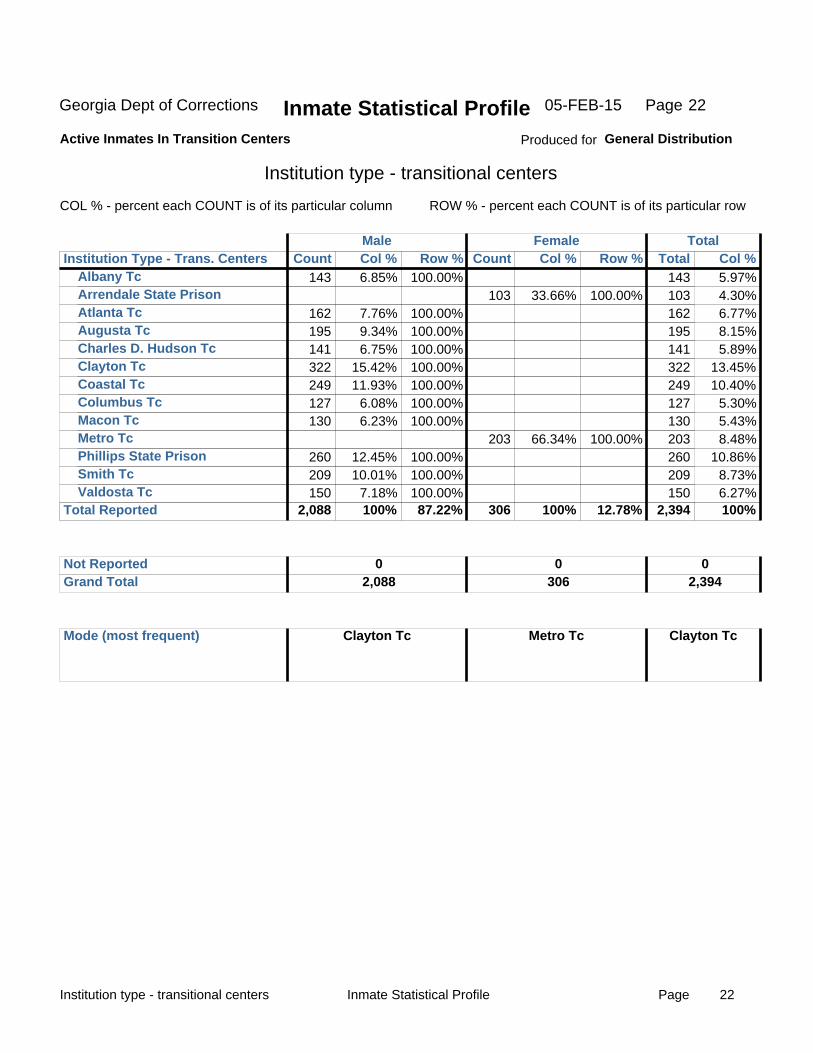
Institution type - transitional centers Page 22Inmate Statistical Profile
Georgia Dept of Corrections Inmate Statistical ProfileActive Inmates In Transition Centers
Institution type - transitional centers
COL % - percent each COUNT is of its particular column ROW % - percent each COUNT is of its particular row
Male
Albany TcArrendale State PrisonAtlanta TcAugusta TcCharles D. Hudson TcClayton TcCoastal TcColumbus TcMacon TcMetro TcPhillips State PrisonSmith TcValdosta Tc
143
162 195 141 322 249 127 130
260 209 150
6.85%
7.76% 9.34% 6.75%
15.42% 11.93%
6.08% 6.23%
12.45% 10.01%
7.18%
100.00%
100.00% 100.00% 100.00% 100.00% 100.00% 100.00% 100.00%
100.00% 100.00% 100.00%
103
203
33.66%
66.34%
100.00%
100.00%
143 103 162 195 141 322 249 127 130 203 260 209 150
5.97% 4.30% 6.77% 8.15% 5.89%
13.45% 10.40%
5.30% 5.43% 8.48%
10.86% 8.73% 6.27%
87.22% 12.78% 2,088 100% 306 100% 2,394 100% Total Reported
Institution Type - Trans. Centers Count Col % Row % Count Col % Row % Total Col %
Not Reported Grand Total
0 2,088
0 306
0 2,394
Mode (most frequent) Clayton Tc Metro Tc Clayton Tc
Female Total
Produced for General Distribution
Page05-FEB-15 22
Intitution type - county prisons Page 23Inmate Statistical Profile
Georgia Dept of Corrections Inmate Statistical ProfileActive Inmates In Transition Centers
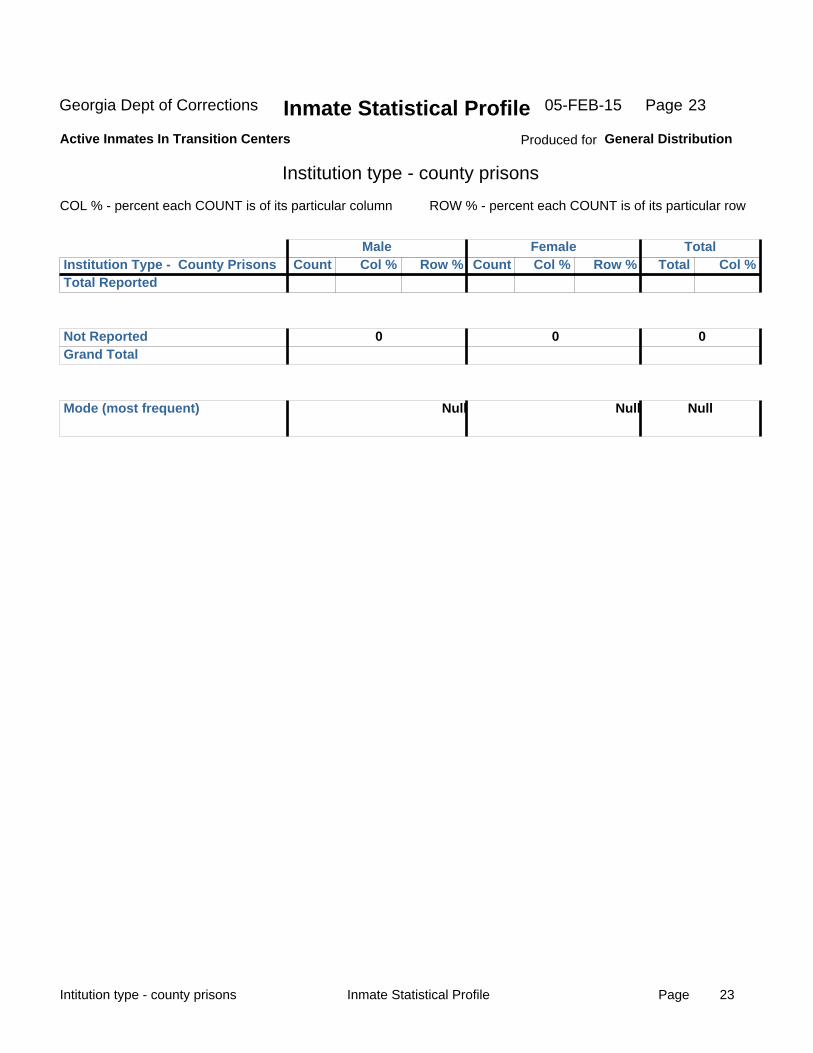
Institution type - county prisons
COL % - percent each COUNT is of its particular column ROW % - percent each COUNT is of its particular row
Male
Total Reported Institution Type - County Prisons Count Col % Row % Count Col % Row % Total Col %
Not Reported Grand Total
0 0 0
Mode (most frequent) Null Null Null
Female Total
Produced for General Distribution
Page05-FEB-15 23
Institution type - state prisons Page 24Inmate Statistical Profile
Georgia Dept of Corrections Inmate Statistical ProfileActive Inmates In Transition Centers
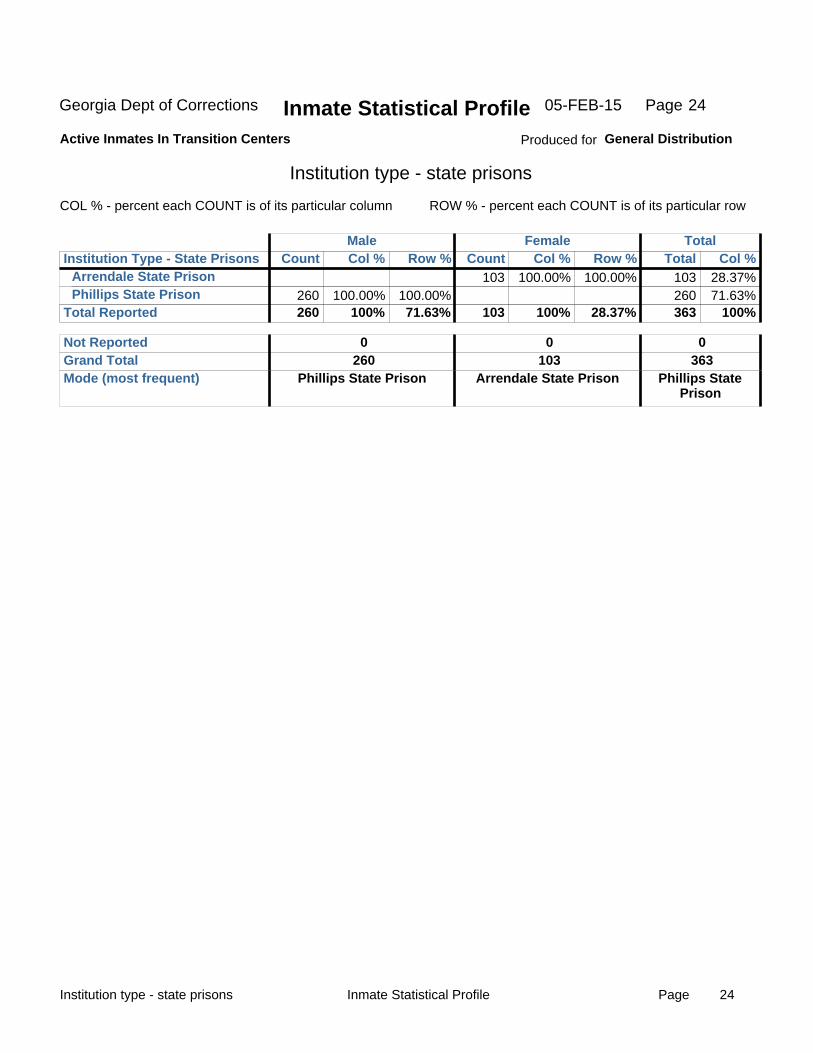
Institution type - state prisons
COL % - percent each COUNT is of its particular column ROW % - percent each COUNT is of its particular row
Male
Arrendale State PrisonPhillips State Prison
260 100.00% 100.00%
103
100.00% 100.00% 103 260
28.37% 71.63%
71.63% 28.37% 260 100% 103 100% 363 100% Total Reported
Institution Type - State Prisons Count Col % Row % Count Col % Row % Total Col %
Not Reported Grand Total Mode (most frequent)
0 260
Phillips State Prison
0 103
Arrendale State Prison
0 363
Phillips StatePrison
Female Total
Produced for General Distribution
Page05-FEB-15 24
Intitution type - private prisons Page 25Inmate Statistical Profile
Georgia Dept of Corrections Inmate Statistical ProfileActive Inmates In Transition Centers
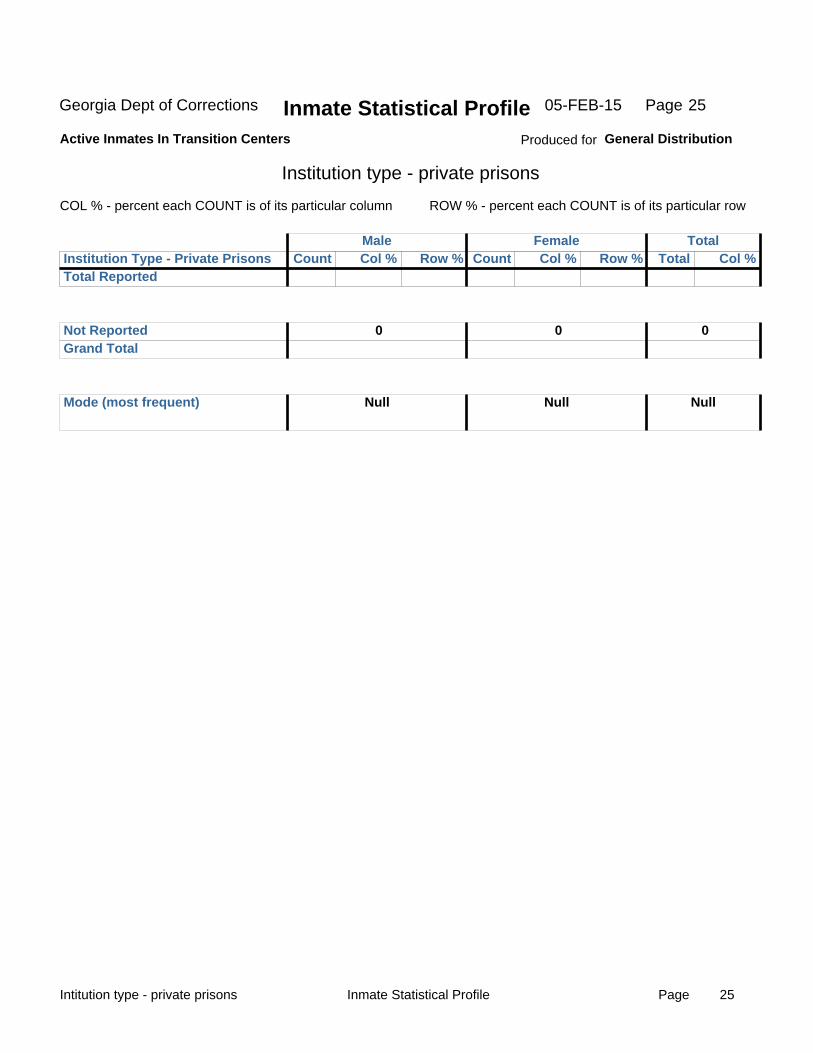
Institution type - private prisons
COL % - percent each COUNT is of its particular column ROW % - percent each COUNT is of its particular row
Male
Total Reported Institution Type - Private Prisons Count Col % Row % Count Col % Row % Total Col %
Not Reported Grand Total
0 0 0
Mode (most frequent) Null Null Null
Female Total
Produced for General Distribution
Page05-FEB-15 25
Institution type - inmate boot camp Page 26Inmate Statistical Profile
Georgia Dept of Corrections Inmate Statistical ProfileActive Inmates In Transition Centers
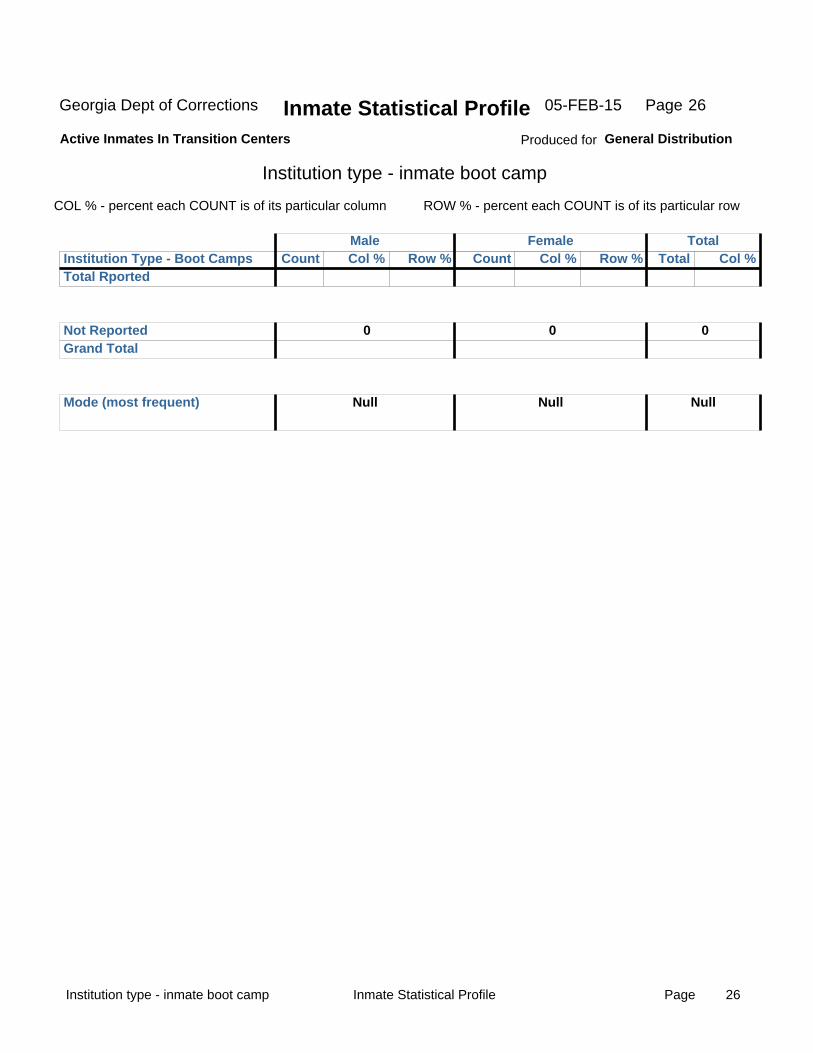
Institution type - inmate boot camp
COL % - percent each COUNT is of its particular column ROW % - percent each COUNT is of its particular row
Male
Total Rported Institution Type - Boot Camps Count Col % Row % Count Col % Row % Total Col %
Not Reported Grand Total
0 0 0
Mode (most frequent) Null Null Null
Female Total
Produced for General Distribution
Page05-FEB-15 26
Number of disciplinary reports Page 27Inmate Statistical Profile
Georgia Dept of Corrections Inmate Statistical ProfileActive Inmates In Transition Centers
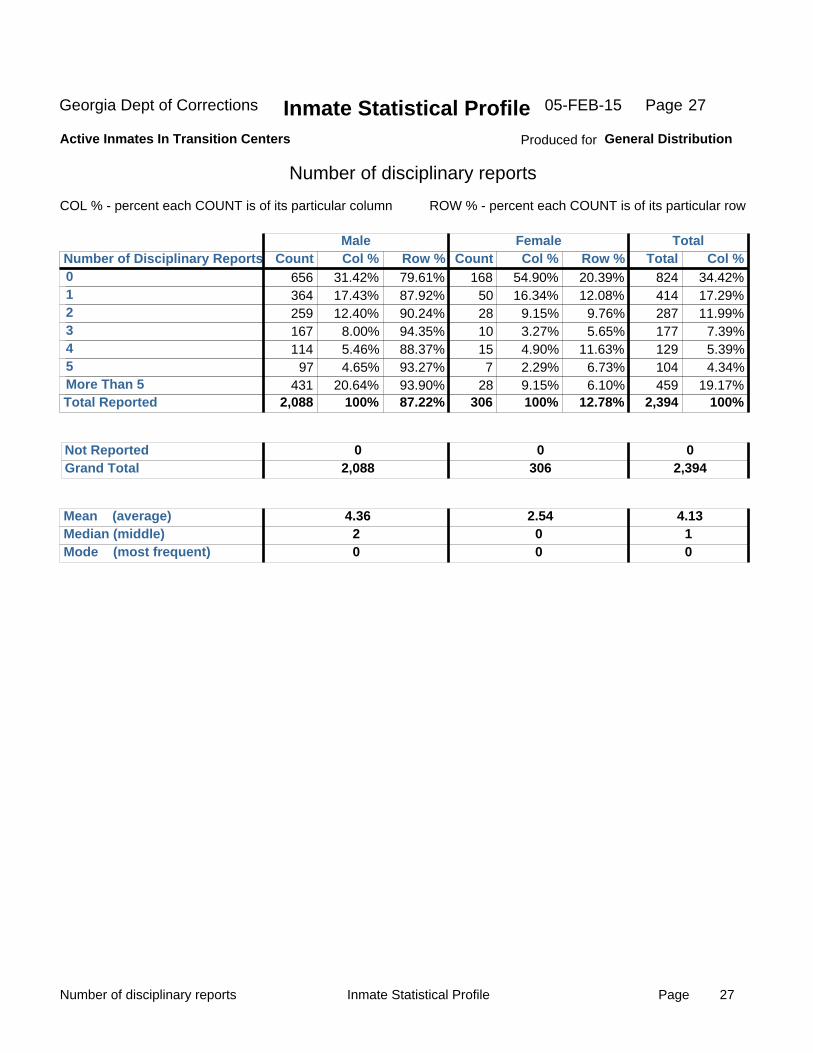
Number of disciplinary reports
COL % - percent each COUNT is of its particular column ROW % - percent each COUNT is of its particular row
Male
012345More Than 5
656 364 259 167 114
97 431
31.42% 17.43% 12.40%
8.00% 5.46% 4.65%
20.64%
79.61% 87.92% 90.24% 94.35% 88.37% 93.27% 93.90%
168 50 28 10 15 7
28
54.90% 16.34%
9.15% 3.27% 4.90% 2.29% 9.15%
20.39% 12.08%
9.76% 5.65%
11.63% 6.73% 6.10%
824 414 287 177 129 104 459
34.42% 17.29% 11.99%
7.39% 5.39% 4.34%
19.17% 87.22% 12.78% 2,088 100% 306 100% 2,394 100% Total Reported
Number of Disciplinary Reports Count Col % Row % Count Col % Row % Total Col %
Not Reported Grand Total
0 2,088
0 306
0 2,394
Mean (average) 4.362 Median (middle)
Mode (most frequent) 000
10
2.54 4.13
Female Total
Produced for General Distribution
Page05-FEB-15 27

Number of transfers Page 28Inmate Statistical Profile
Georgia Dept of Corrections Inmate Statistical ProfileActive Inmates In Transition Centers
Number of transfers
COL % - percent each COUNT is of its particular column ROW % - percent each COUNT is of its particular row
Male
12345More Than 5
39 7
782 84
1,176
1.87% 0.34%
37.45% 4.02%
56.32%
76.47% 46.67% 82.32% 82.35% 94.69%
34 12 8
168 18 66
11.11% 3.92% 2.61%
54.90% 5.88%
21.57%
100.00% 23.53% 53.33% 17.68% 17.65%
5.31%
34 51 15
950 102
1,242
1.42% 2.13% 0.63%
39.68% 4.26%
51.88% 87.22% 12.78% 2,088 100% 306 100% 2,394 100% Total Reported
Number of Transfers Count Col % Row % Count Col % Row % Total Col %
Not Reported Grand Total
0 2,088
0 306
0 2,394
Mean (average) 7.896 Median (middle)
Mode (most frequent) 444
64
4.58 7.46
Female Total
Produced for General Distribution
Page05-FEB-15 28
Number of escapes Page 29Inmate Statistical Profile
Georgia Dept of Corrections Inmate Statistical ProfileActive Inmates In Transition Centers
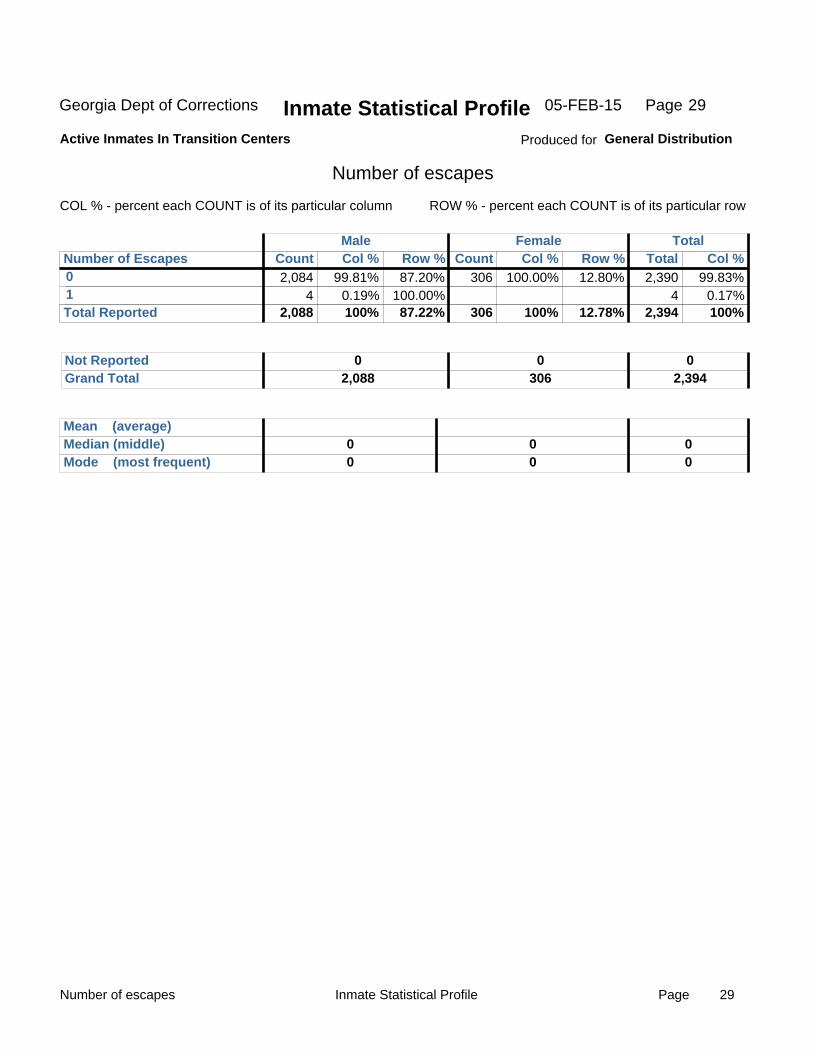
Number of escapes
COL % - percent each COUNT is of its particular column ROW % - percent each COUNT is of its particular row
Male
01
2,084 4
99.81% 0.19%
87.20% 100.00%
306
100.00% 12.80% 2,390 4
99.83% 0.17%
87.22% 12.78% 2,088 100% 306 100% 2,394 100% Total Reported
Number of Escapes Count Col % Row % Count Col % Row % Total Col %
Not Reported Grand Total
0 2,088
0 306
0 2,394
Mean (average) 0 Median (middle)
Mode (most frequent) 000
00
Female Total
Produced for General Distribution
Page05-FEB-15 29
Culture fair IQ scores Page 30Inmate Statistical Profile
Georgia Dept of Corrections Inmate Statistical ProfileActive Inmates In Transition Centers
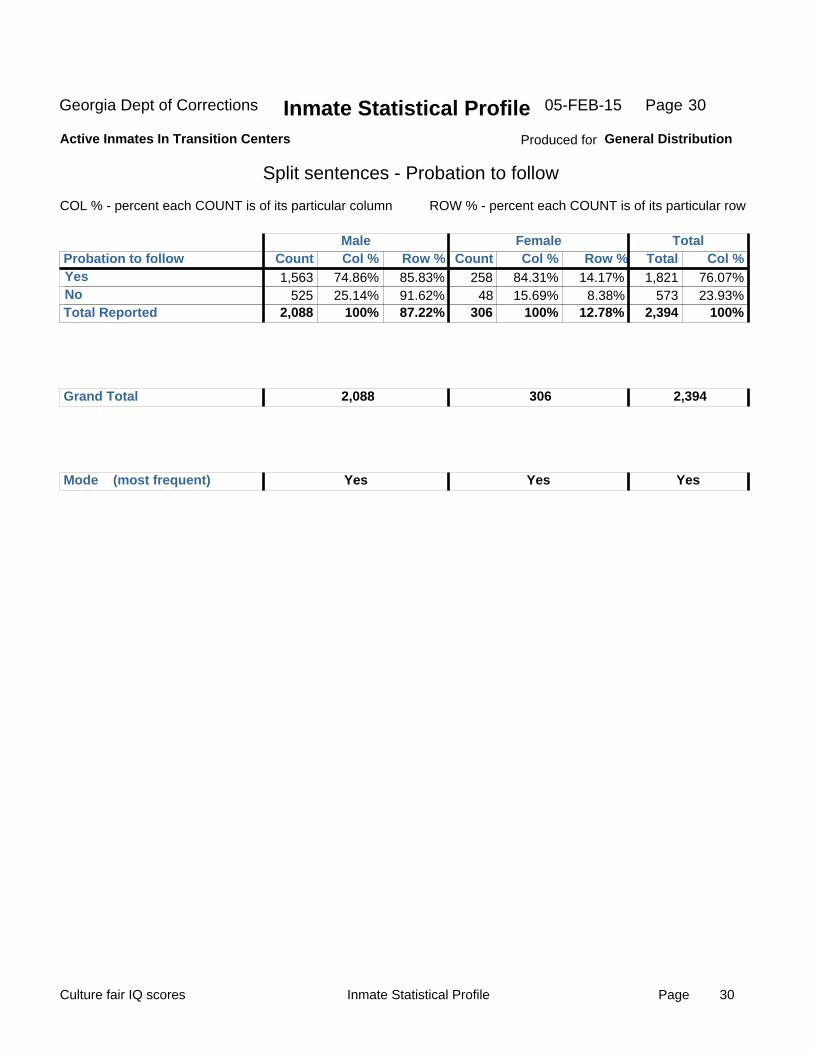
Split sentences - Probation to follow
COL % - percent each COUNT is of its particular column ROW % - percent each COUNT is of its particular row
Male
YesNo
1,563 525
74.86% 25.14%
85.83% 91.62%
258 48
84.31% 15.69%
14.17% 8.38%
1,821 573
76.07% 23.93%
87.22% 12.78% 2,088 100% 306 100% 2,394 100% Total Reported
Probation to follow Count Col % Row % Count Col % Row % Total Col %
Grand Total 2,088 306 2,394
Mode (most frequent) Yes Yes Yes
Female Total
Produced for General Distribution
Page05-FEB-15 30
Probable future release type Page 31Inmate Statistical Profile
Georgia Dept of Corrections Inmate Statistical ProfileActive Inmates In Transition Centers
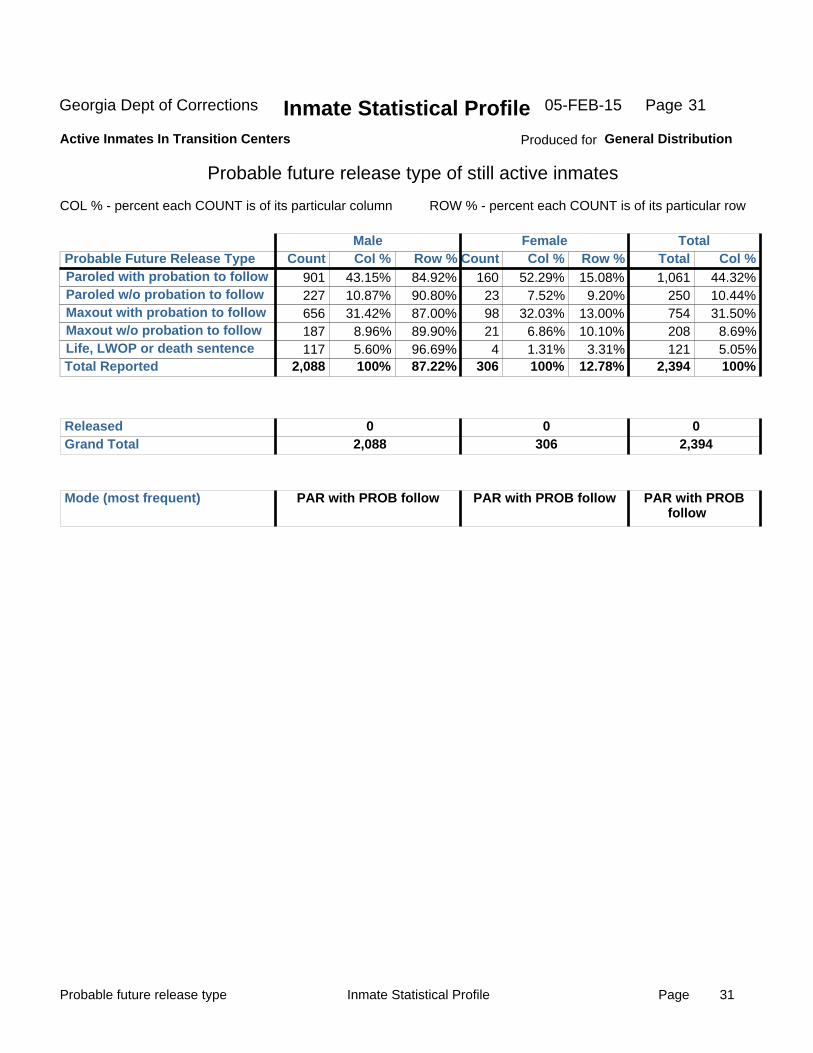
Probable future release type of still active inmates
COL % - percent each COUNT is of its particular column ROW % - percent each COUNT is of its particular row
Male
Paroled with probation to followParoled w/o probation to followMaxout with probation to followMaxout w/o probation to followLife, LWOP or death sentence
901 227 656 187 117
43.15% 10.87% 31.42%
8.96% 5.60%
84.92% 90.80% 87.00% 89.90% 96.69%
160 23 98 21 4
52.29% 7.52%
32.03% 6.86% 1.31%
15.08% 9.20%
13.00% 10.10%
3.31%
1,061 250 754 208 121
44.32% 10.44% 31.50%
8.69% 5.05%
87.22% 12.78% 2,088 100% 306 100% 2,394 100% Total Reported
Probable Future Release Type Count Col % Row % Count Col % Row % Total Col %
Released Grand Total
0 2,088
0 306
0 2,394
Mode (most frequent) PAR with PROB follow
PAR with PROB follow
PAR with PROBfollow
Female Total
Produced for General Distribution
Page05-FEB-15 31

Time in institution Page 32Inmate Statistical Profile
Georgia Dept of Corrections Inmate Statistical ProfileActive Inmates In Transition Centers
Time served in current (or last) institution
COL % - percent each COUNT is of its particular column ROW % - percent each COUNT is of its particular row
Male
0 to 3 months 3.01 to 6 months 6.01 to 9 months 9.01 to 12 months 12.01 to 18 months 18.01 to 24 months 2.01 to 3 years 3.01 to 4 years
783 547 396 186 124
32 16 4
37.50% 26.20% 18.97%
8.91% 5.94% 1.53% 0.77% 0.19%
88.18% 83.26% 92.96% 86.11% 85.52% 76.19%
100.00% 100.00%
105 110
30 30 21 10
34.31% 35.95%
9.80% 9.80% 6.86% 3.27%
11.82% 16.74%
7.04% 13.89% 14.48% 23.81%
888 657 426 216 145
42 16 4
37.09% 27.44% 17.79%
9.02% 6.06% 1.75% 0.67% 0.17%
87.22% 12.78% 2,088 100% 306 100% 2,394 100% Total Reported
Time In Institution Count Col % Row % Count Col % Row % Total Col %
Not Reported Grand Total
0 2,088
0 306
0 2,394
Mean (average) 5 months 4 months Median (middle)
Mode (most frequent) 2 months 4 months
1 months 4 months
1 months
5 months 5 months
Female Total
Produced for General Distribution
Page05-FEB-15 32
Higest grade level attained Page 33Inmate Statistical Profile
Georgia Dept of Corrections Inmate Statistical ProfileActive Inmates In Transition Centers
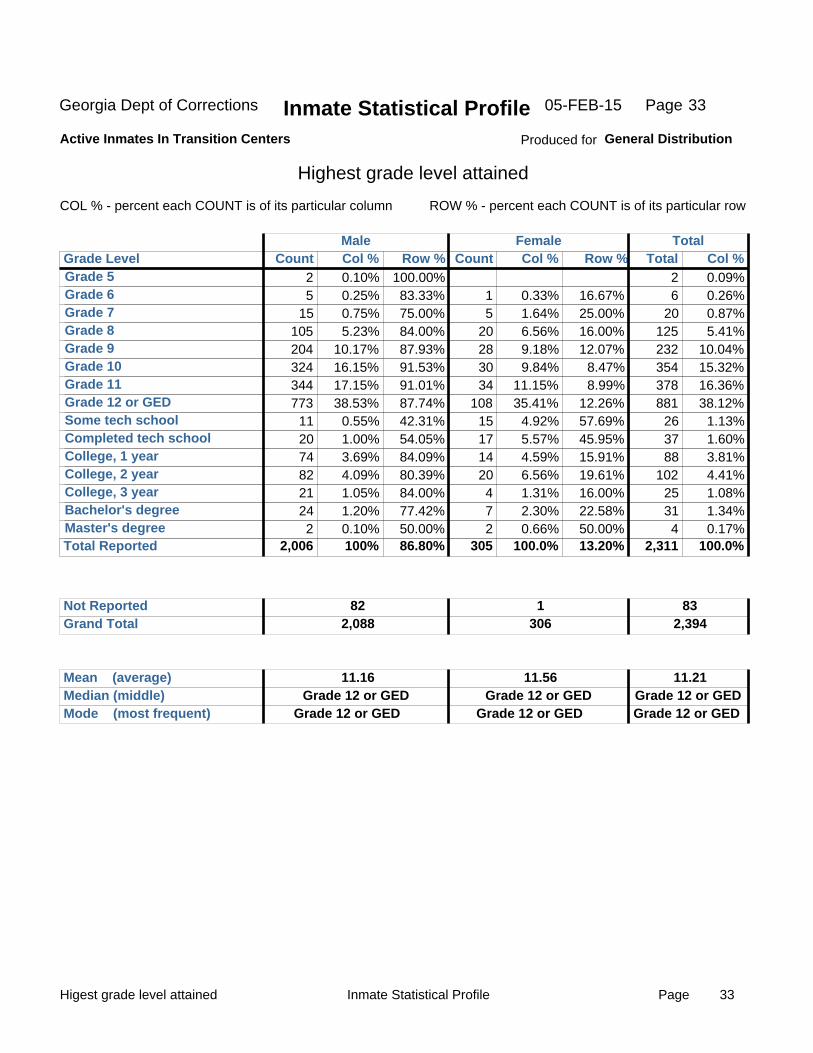
Highest grade level attained
COL % - percent each COUNT is of its particular column ROW % - percent each COUNT is of its particular row
Male
Grade 5Grade 6Grade 7Grade 8Grade 9Grade 10Grade 11Grade 12 or GEDSome tech schoolCompleted tech schoolCollege, 1 yearCollege, 2 yearCollege, 3 yearBachelor's degreeMaster's degree
2 5
15 105 204 324 344 773
11 20 74 82 21 24 2
0.10% 0.25% 0.75% 5.23%
10.17% 16.15% 17.15% 38.53%
0.55% 1.00% 3.69% 4.09% 1.05% 1.20% 0.10%
100.00% 83.33% 75.00% 84.00% 87.93% 91.53% 91.01% 87.74% 42.31% 54.05% 84.09% 80.39% 84.00% 77.42% 50.00%
1 5
20 28 30 34
108 15 17 14 20 4 7 2
0.33% 1.64% 6.56% 9.18% 9.84%
11.15% 35.41%
4.92% 5.57% 4.59% 6.56% 1.31% 2.30% 0.66%
16.67% 25.00% 16.00% 12.07%
8.47% 8.99%
12.26% 57.69% 45.95% 15.91% 19.61% 16.00% 22.58% 50.00%
2 6
20 125 232 354 378 881
26 37 88
102 25 31 4
0.09% 0.26% 0.87% 5.41%
10.04% 15.32% 16.36% 38.12%
1.13% 1.60% 3.81% 4.41% 1.08% 1.34% 0.17%
86.80% 13.20% 2,006 100% 305 100.0% 2,311 100.0% Total Reported
Grade Level Count Col % Row % Count Col % Row % Total Col %
Not Reported Grand Total
82 2,088
1 306
83 2,394
Mean (average) 11.16Grade 12 or GED Median (middle)
Mode (most frequent) Grade 12 or GED Grade 12 or GED
Grade 12 or GED Grade 12 or GEDGrade 12 or GED
11.56 11.21
Female Total
Produced for General Distribution
Page05-FEB-15 33

Culture fair IQ scores Page 34Inmate Statistical Profile
Georgia Dept of Corrections Inmate Statistical ProfileActive Inmates In Transition Centers
Culture fair IQ scores
COL % - percent each COUNT is of its particular column ROW % - percent each COUNT is of its particular row
Male
60 - 6970 - 7980 - 8990 - 99100 - 109110 - 119120 - 129130 - 139140 & Up
26 92
234 460 472 232
46 1
1.66% 5.89%
14.97% 29.43% 30.20% 14.84%
2.94% 0.06%
86.67% 80.70% 78.52% 82.44% 91.65% 90.63% 85.19% 50.00%
4 22 64 98 43 24 8 1 1 1
1.50% 8.27%
24.06% 36.84% 16.17%
9.02% 3.01% 0.38% 0.38% 0.38%
13.33% 19.30% 21.48% 17.56%
8.35% 9.38%
14.81% 50.00%
100.00% 100.00%
30 114 298 558 515 256
54 2 1 1
1.64% 6.23%
16.29% 30.51% 28.16% 14.00%
2.95% 0.11% 0.05% 0.05%
85.46% 14.54% 1,563 100% 266 100.0% 1,829 100% Total Reported
IQ Scores Count Col % Row % Count Col % Row % Total Col %
Not Reported Not Valid (under 60) Grand Total
507 18
2,088
35 5
306
542 23
2,394
Mean (average) 9899 Median (middle)
Mode (most frequent) 9994102
9999
95 98
Female Total
Produced for General Distribution
Page05-FEB-15 34

WRAT reading score Page 35Inmate Statistical Profile
Georgia Dept of Corrections Inmate Statistical ProfileActive Inmates In Transition Centers
Wide Range Achievement Test (WRAT) reading score
COL % - percent each COUNT is of its particular column ROW % - percent each COUNT is of its particular row
Male
0.1 to 0.91.0 to 1.92.0 to 2.93.0 to 3.94.0 to 4.95.0 to 5.96.0 to 6.97.0 to 7.98.0 to 8.99.0 to 9.910.0 to 10.911.0 to 11.912.0 to 12.913
10 32 70
124 161 120 153
47 110
54 110 143 447
1
0.63% 2.02% 4.42% 7.84%
10.18% 7.59% 9.67% 2.97% 6.95% 3.41% 6.95% 9.04%
28.26% 0.06%
90.91% 94.12% 90.91% 92.54% 87.98% 86.33% 85.96% 87.04% 88.00% 81.82% 78.57% 76.47% 84.98% 50.00%
1 2 7
10 22 19 25 7
15 12 30 44 79 1
0.36% 0.73% 2.55% 3.65% 8.03% 6.93% 9.12% 2.55% 5.47% 4.38%
10.95% 16.06% 28.83%
0.36%
9.09% 5.88% 9.09% 7.46%
12.02% 13.67% 14.04% 12.96% 12.00% 18.18% 21.43% 23.53% 15.02% 50.00%
11 34 77
134 183 139 178
54 125
66 140 187 526
2
0.59% 1.83% 4.15% 7.22% 9.86% 7.49% 9.59% 2.91% 6.73% 3.56% 7.54%
10.08% 28.34%
0.11% 85.24% 14.76% 1,582 100% 274 100% 1,856 100% Total Reported
WRAT Reading Score Count Col % Row % Count Col % Row % Total Col %
Not Reported Grand Total
506 2,088
32 306
538 2,394
Mean (average) 8.428.9 Median (middle)
Mode (most frequent) 12.910.812.9
8.912.9
9.33 8.55
Female Total
Produced for General Distribution
Page05-FEB-15 35
WRAT mathematic score Page 36Inmate Statistical Profile
Georgia Dept of Corrections Page05-FEB-15Inmate Statistical ProfileActive Inmates In Transition Centers
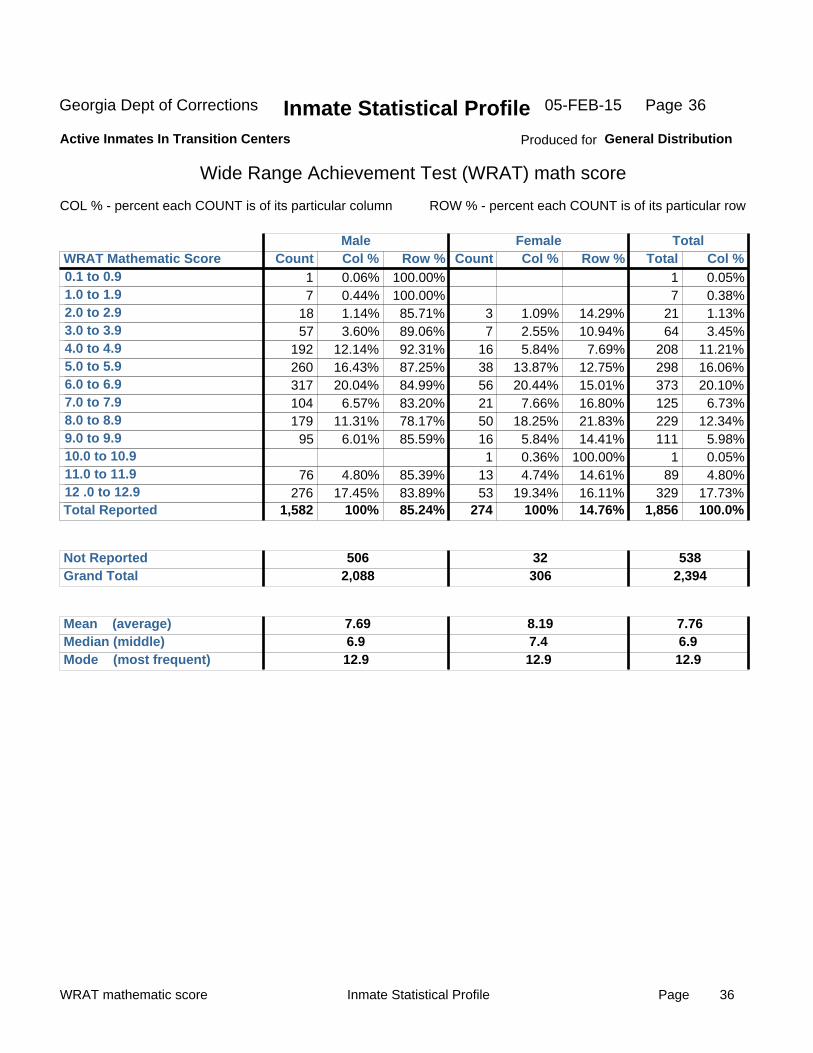
Wide Range Achievement Test (WRAT) math score
COL % - percent each COUNT is of its particular column ROW % - percent each COUNT is of its particular row
Male
0.1 to 0.91.0 to 1.92.0 to 2.93.0 to 3.94.0 to 4.95.0 to 5.96.0 to 6.97.0 to 7.98.0 to 8.99.0 to 9.910.0 to 10.911.0 to 11.912 .0 to 12.9
1 7
18 57
192 260 317 104 179
95
76 276
0.06% 0.44% 1.14% 3.60%
12.14% 16.43% 20.04%
6.57% 11.31%
6.01%
4.80% 17.45%
100.00% 100.00% 85.71% 89.06% 92.31% 87.25% 84.99% 83.20% 78.17% 85.59%
85.39% 83.89%
3 7
16 38 56 21 50 16 1
13 53
1.09% 2.55% 5.84%
13.87% 20.44%
7.66% 18.25%
5.84% 0.36% 4.74%
19.34%
14.29% 10.94%
7.69% 12.75% 15.01% 16.80% 21.83% 14.41%
100.00% 14.61% 16.11%
1 7
21 64
208 298 373 125 229 111
1 89
329
0.05% 0.38% 1.13% 3.45%
11.21% 16.06% 20.10%
6.73% 12.34%
5.98% 0.05% 4.80%
17.73% 85.24% 14.76% 1,582 100% 274 100% 1,856 100.0% Total Reported
WRAT Mathematic Score Count Col % Row % Count Col % Row % Total Col %
Not Reported Grand Total
506 2,088
32 306
538 2,394
Mean (average) 7.696.9 Median (middle)
Mode (most frequent) 12.97.412.9
6.912.9
8.19 7.76
Female Total
Produced for General Distribution
36
WRAT spelling score Page 37Inmate Statistical Profile
Georgia Dept of Corrections Page05-FEB-15Inmate Statistical ProfileActive Inmates In Transition Centers
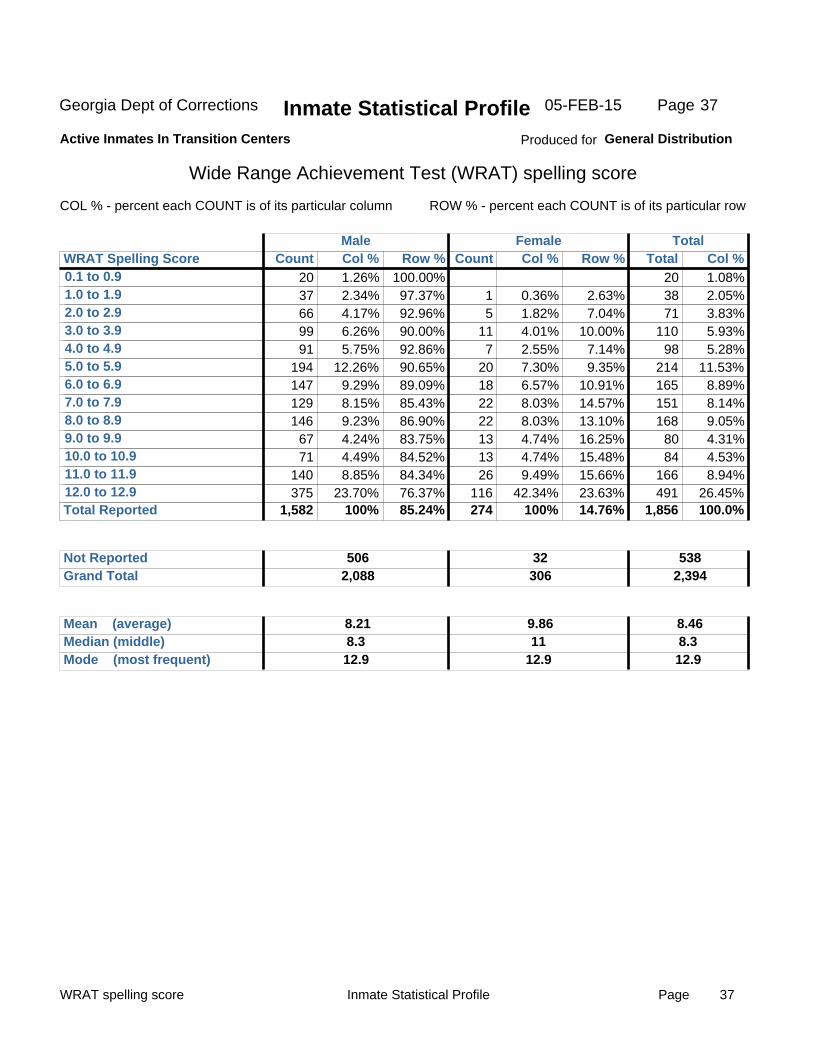
Wide Range Achievement Test (WRAT) spelling score
COL % - percent each COUNT is of its particular column ROW % - percent each COUNT is of its particular row
Male
0.1 to 0.91.0 to 1.92.0 to 2.93.0 to 3.94.0 to 4.95.0 to 5.96.0 to 6.97.0 to 7.98.0 to 8.99.0 to 9.910.0 to 10.911.0 to 11.912.0 to 12.9
20 37 66 99 91
194 147 129 146
67 71
140 375
1.26% 2.34% 4.17% 6.26% 5.75%
12.26% 9.29% 8.15% 9.23% 4.24% 4.49% 8.85%
23.70%
100.00% 97.37% 92.96% 90.00% 92.86% 90.65% 89.09% 85.43% 86.90% 83.75% 84.52% 84.34% 76.37%
1 5
11 7
20 18 22 22 13 13 26
116
0.36% 1.82% 4.01% 2.55% 7.30% 6.57% 8.03% 8.03% 4.74% 4.74% 9.49%
42.34%
2.63% 7.04%
10.00% 7.14% 9.35%
10.91% 14.57% 13.10% 16.25% 15.48% 15.66% 23.63%
20 38 71
110 98
214 165 151 168
80 84
166 491
1.08% 2.05% 3.83% 5.93% 5.28%
11.53% 8.89% 8.14% 9.05% 4.31% 4.53% 8.94%
26.45% 85.24% 14.76% 1,582 100% 274 100% 1,856 100.0% Total Reported
WRAT Spelling Score Count Col % Row % Count Col % Row % Total Col %
Not Reported Grand Total
506 2,088
32 306
538 2,394
Mean (average) 8.218.3 Median (middle)
Mode (most frequent) 12.911
12.98.312.9
9.86 8.46
Female Total
Produced for General Distribution
37
Mental health treatment level Page 38Inmate Statistical Profile
Georgia Dept of Corrections Inmate Statistical ProfileActive Inmates In Transition Centers
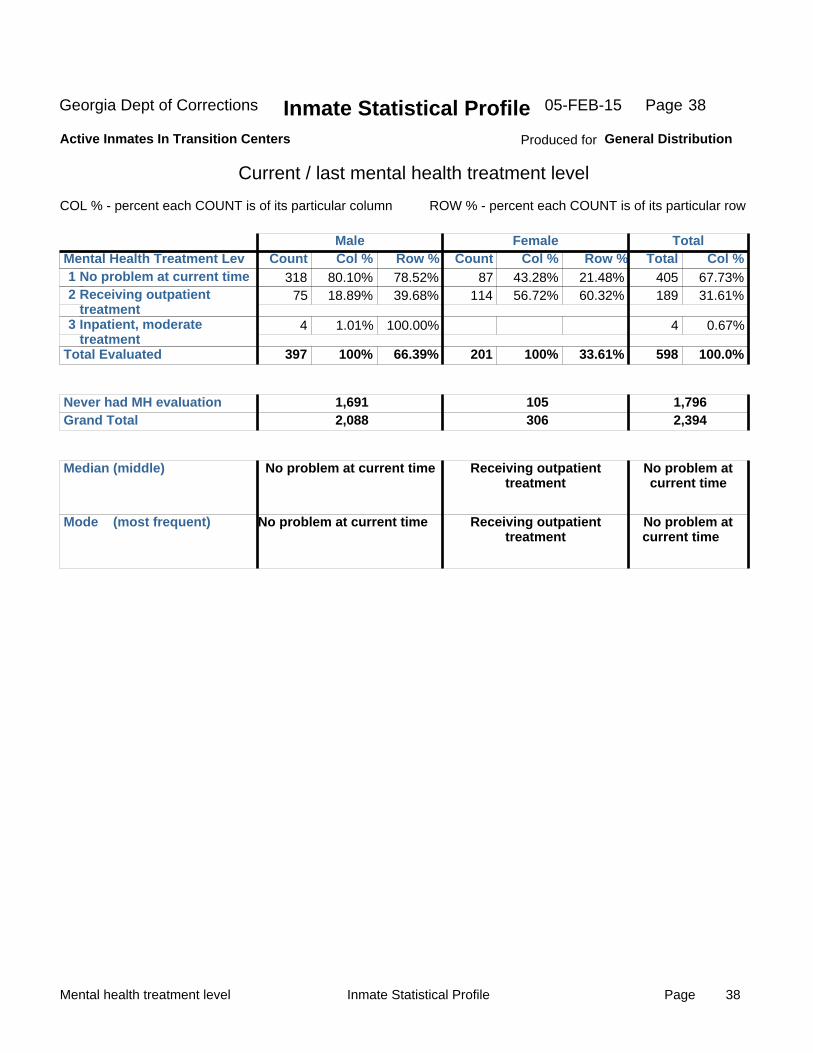
Current / last mental health treatment level
COL % - percent each COUNT is of its particular column ROW % - percent each COUNT is of its particular row
Male
No problem at current timeReceiving outpatienttreatmentInpatient, moderatetreatment
318 75
4
80.10% 18.89%
1.01%
78.52% 39.68%
100.00%
87 114
43.28% 56.72%
21.48% 60.32%
405 189
4
67.73% 31.61%
0.67%
12
3
66.39% 33.61% 397 100% 201 100% 598 100.0% Total Evaluated
Mental Health Treatment Lev Count Col % Row % Count Col % Row % Total Col %
Never had MH evaluation Grand Total
1,691 2,088
105 306
1,796 2,394
No problem at current time Median (middle)
Mode (most frequent) No problem at current time
Receiving outpatienttreatment
Receiving outpatienttreatment
No problem atcurrent time
No problem atcurrent time
Female Total
Produced for General Distribution
Page05-FEB-15 38
PULHESDWIT 'P' overall condition ('P'hysical) Page 39Inmate Statistical Profile
Georgia Dept of Corrections Page05-FEB-15Inmate Statistical ProfileActive Inmates In Transition Centers
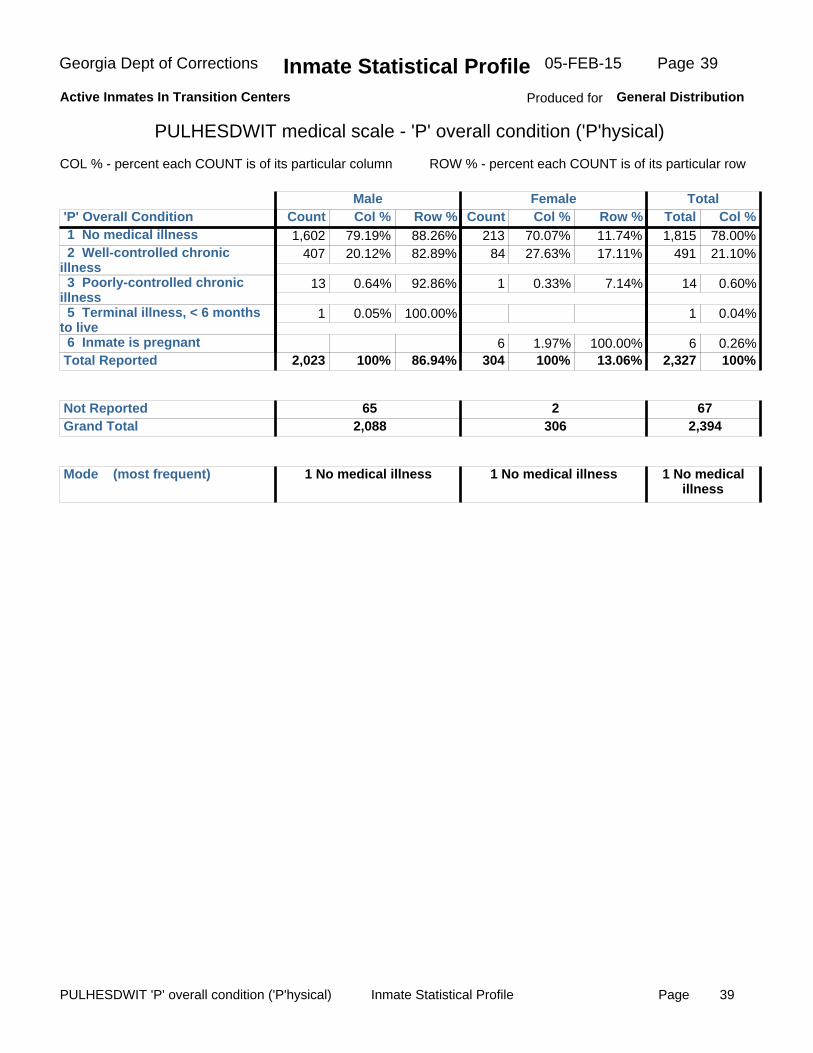
PULHESDWIT medical scale - 'P' overall condition ('P'hysical)
COL % - percent each COUNT is of its particular column ROW % - percent each COUNT is of its particular row
Male
1 No medical illness 2 Well-controlled chronicillness 3 Poorly-controlled chronicillness 5 Terminal illness, < 6 monthsto live 6 Inmate is pregnant
1,602 407
13
1
79.19% 20.12%
0.64%
0.05%
88.26% 82.89%
92.86%
100.00%
213 84
1
6
70.07% 27.63%
0.33%
1.97%
11.74% 17.11%
7.14%
100.00%
1,815 491
14
1
6
78.00% 21.10%
0.60%
0.04%
0.26% 86.94% 13.06% 2,023 100% 304 100% 2,327 100% Total Reported
'P' Overall Condition Count Col % Row % Count Col % Row % Total Col %
Not Reported Grand Total
65 2,088
2 306
67 2,394
Mode (most frequent) 1 No medical illness 1 No medical illness 1 No medicalillness
Female Total
Produced for General Distribution
39
PULHESDWIT 'U' upper body Page 40Inmate Statistical Profile
Georgia Dept of Corrections Page05-FEB-15Inmate Statistical ProfileActive Inmates In Transition Centers
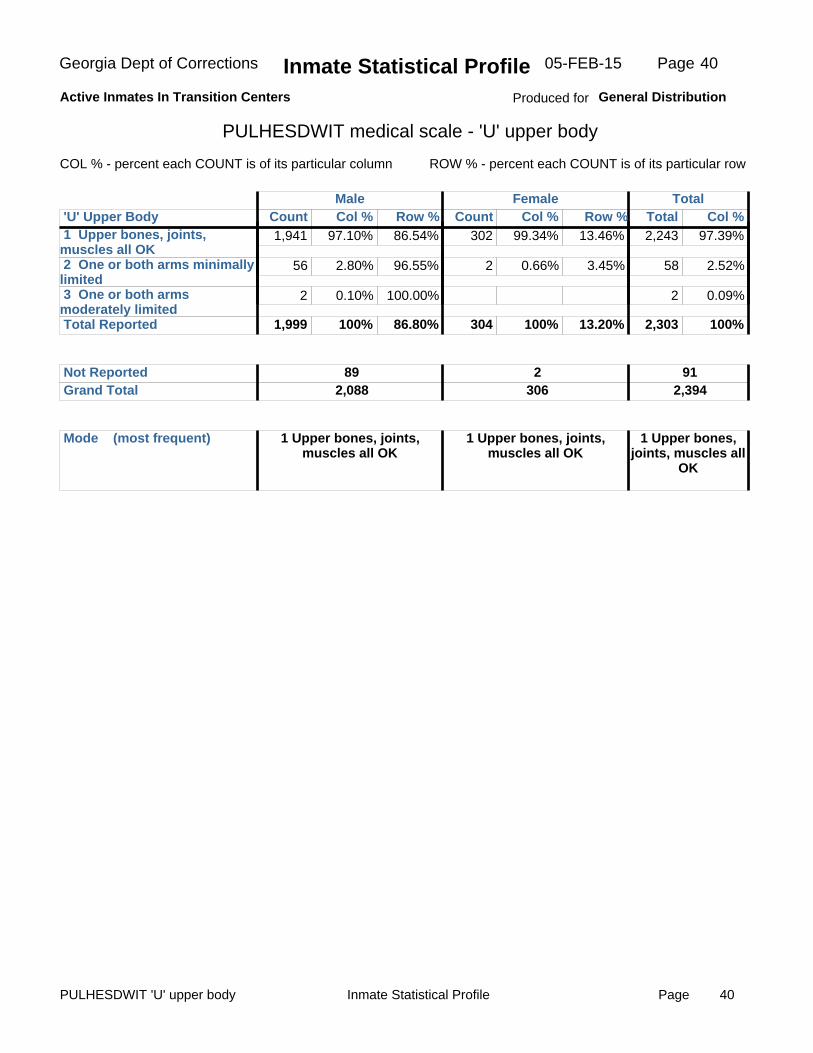
PULHESDWIT medical scale - 'U' upper body
COL % - percent each COUNT is of its particular column ROW % - percent each COUNT is of its particular row
Male
1 Upper bones, joints,muscles all OK 2 One or both arms minimallylimited 3 One or both armsmoderately limited
1,941
56
2
97.10%
2.80%
0.10%
86.54%
96.55%
100.00%
302
2
99.34%
0.66%
13.46%
3.45%
2,243
58
2
97.39%
2.52%
0.09%
86.80% 13.20% 1,999 100% 304 100% 2,303 100% Total Reported
'U' Upper Body Count Col % Row % Count Col % Row % Total Col %
Not Reported Grand Total
89 2,088
2 306
91 2,394
Mode (most frequent) 1 Upper bones, joints,muscles all OK
1 Upper bones, joints,muscles all OK
1 Upper bones,joints, muscles all
OK
Female Total
Produced for General Distribution
40
PULHESDWIT 'L' lower body Page 41Inmate Statistical Profile
Georgia Dept of Corrections Page05-FEB-15Inmate Statistical ProfileActive Inmates In Transition Centers
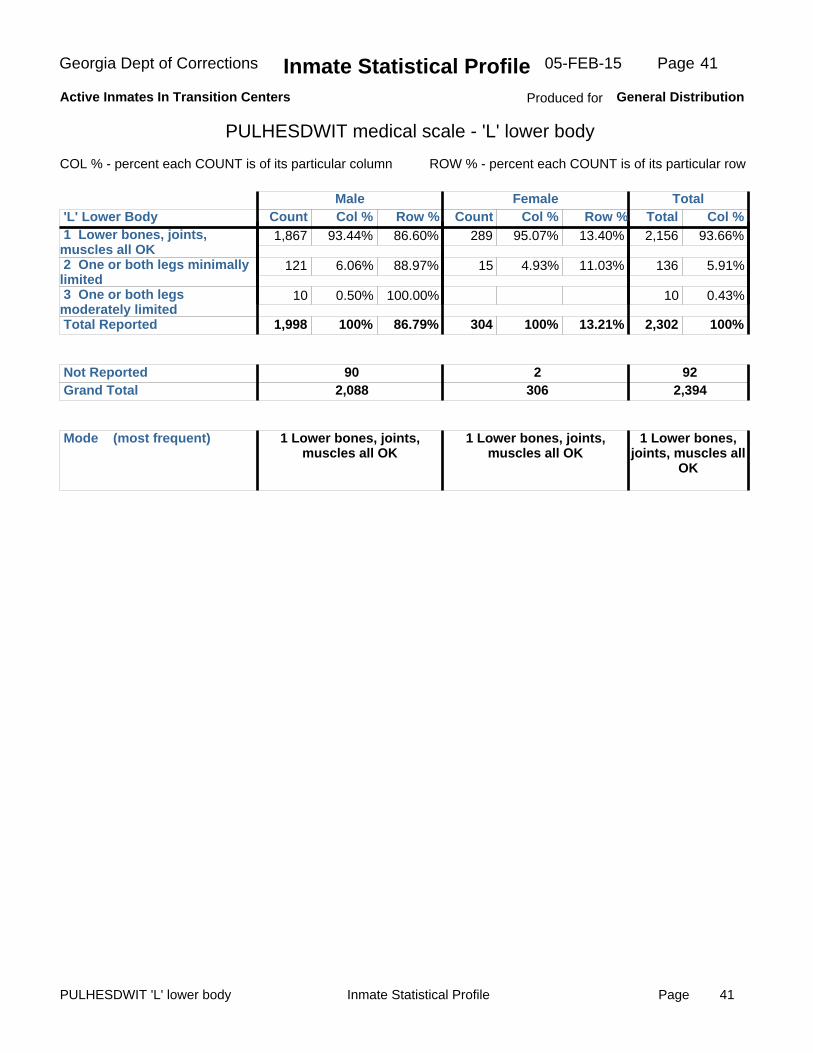
PULHESDWIT medical scale - 'L' lower body
COL % - percent each COUNT is of its particular column ROW % - percent each COUNT is of its particular row
Male
1 Lower bones, joints,muscles all OK 2 One or both legs minimallylimited 3 One or both legsmoderately limited
1,867
121
10
93.44%
6.06%
0.50%
86.60%
88.97%
100.00%
289
15
95.07%
4.93%
13.40%
11.03%
2,156
136
10
93.66%
5.91%
0.43%
86.79% 13.21% 1,998 100% 304 100% 2,302 100% Total Reported
'L' Lower Body Count Col % Row % Count Col % Row % Total Col %
Not Reported Grand Total
90 2,088
2 306
92 2,394
Mode (most frequent) 1 Lower bones, joints,muscles all OK
1 Lower bones, joints,muscles all OK
1 Lower bones,joints, muscles all
OK
Female Total
Produced for General Distribution
41

PULHESDWIT 'H' hearing Page 42Inmate Statistical Profile
Georgia Dept of Corrections Page05-FEB-15Inmate Statistical ProfileActive Inmates In Transition Centers
PULHESDWIT medical scale - 'H' hearing
COL % - percent each COUNT is of its particular column ROW % - percent each COUNT is of its particular row
Male
1 Normal hearing both ears 2 Some loss in one ear withother OK, or mild loss in both 3 Total loss in one ear withmild loss in other 4 Severe loss in both ears
1,985 9
1
2
99.40% 0.45%
0.05%
0.10%
86.79% 81.82%
100.00%
100.00%
302 2
99.34% 0.66%
13.21% 18.18%
2,287 11
1
2
99.39% 0.48%
0.04%
0.09% 86.79% 13.21% 1,997 100% 304 100% 2,301 100% Total Reported
'H' Hearing Count Col % Row % Count Col % Row % Total Col %
Not Reported Grand Total
91 2,088
2 306
93 2,394
Mode (most frequent) 1 Normal hearing both ears 1 Normal hearing both ears 1 Normal hearingboth ears
Female Total
Produced for General Distribution
42
PULHESDWIT 'E' vision Page 43Inmate Statistical Profile
Georgia Dept of Corrections Page05-FEB-15Inmate Statistical ProfileActive Inmates In Transition Centers
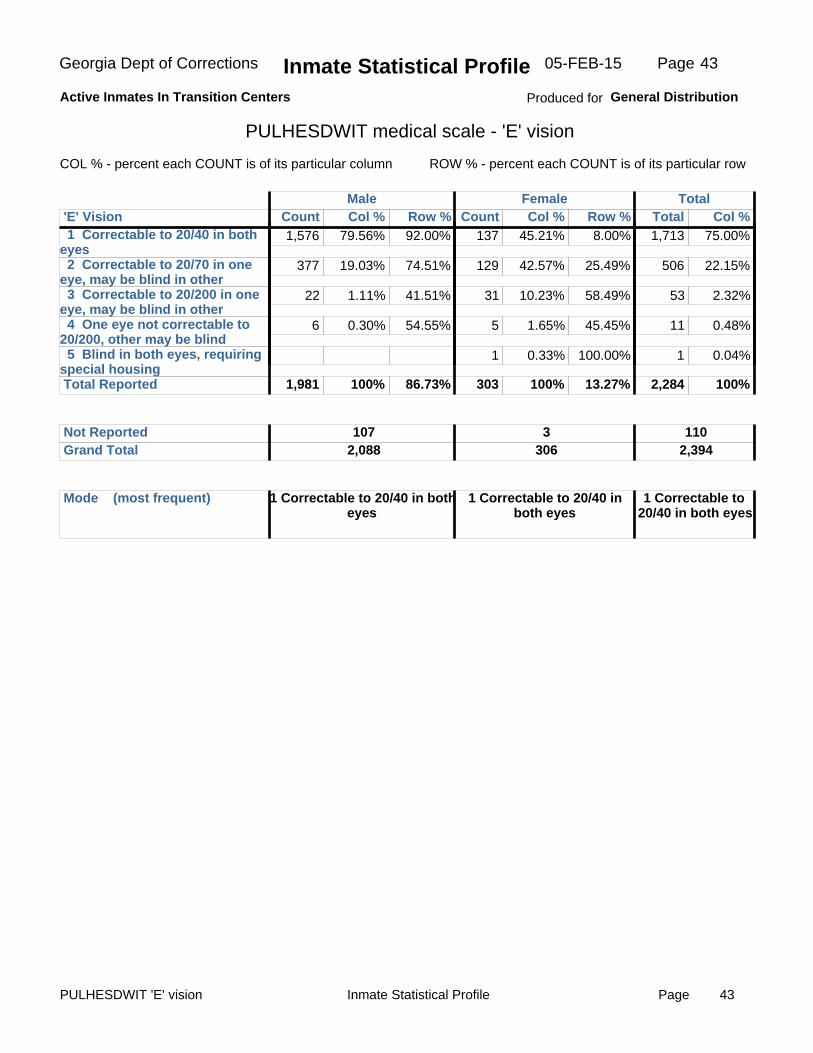
PULHESDWIT medical scale - 'E' vision
COL % - percent each COUNT is of its particular column ROW % - percent each COUNT is of its particular row
Male
1 Correctable to 20/40 in botheyes 2 Correctable to 20/70 in oneeye, may be blind in other 3 Correctable to 20/200 in oneeye, may be blind in other 4 One eye not correctable to20/200, other may be blind 5 Blind in both eyes, requiringspecial housing
1,576
377
22
6
79.56%
19.03%
1.11%
0.30%
92.00%
74.51%
41.51%
54.55%
137
129
31
5
1
45.21%
42.57%
10.23%
1.65%
0.33%
8.00%
25.49%
58.49%
45.45%
100.00%
1,713
506
53
11
1
75.00%
22.15%
2.32%
0.48%
0.04%
86.73% 13.27% 1,981 100% 303 100% 2,284 100% Total Reported
'E' Vision Count Col % Row % Count Col % Row % Total Col %
Not Reported Grand Total
107 2,088
3 306
110 2,394
Mode (most frequent) 1 Correctable to 20/40 in botheyes
1 Correctable to 20/40 inboth eyes
1 Correctable to20/40 in both eyes
Female Total
Produced for General Distribution
43
PULHESDWIT 'S' pSychiatric Page 44Inmate Statistical Profile
Georgia Dept of Corrections Page05-FEB-15Inmate Statistical ProfileActive Inmates In Transition Centers
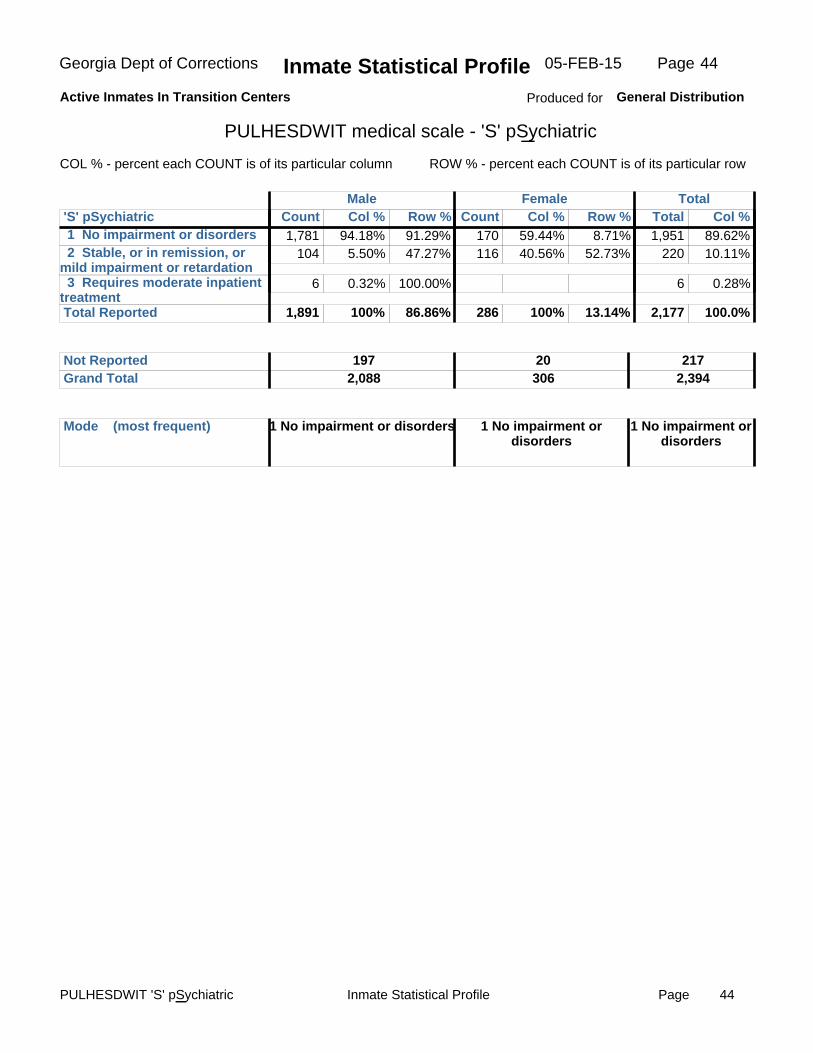
PULHESDWIT medical scale - 'S' pSychiatric
COL % - percent each COUNT is of its particular column ROW % - percent each COUNT is of its particular row
Male
1 No impairment or disorders 2 Stable, or in remission, ormild impairment or retardation 3 Requires moderate inpatienttreatment
1,781 104
6
94.18% 5.50%
0.32%
91.29% 47.27%
100.00%
170 116
59.44% 40.56%
8.71% 52.73%
1,951 220
6
89.62% 10.11%
0.28%
86.86% 13.14% 1,891 100% 286 100% 2,177 100.0% Total Reported
'S' pSychiatric Count Col % Row % Count Col % Row % Total Col %
Not Reported Grand Total
197 2,088
20 306
217 2,394
Mode (most frequent) 1 No impairment or disorders 1 No impairment ordisorders
1 No impairment ordisorders
Female Total
Produced for General Distribution
44
PULHESDWIT 'D' dental Page 45Inmate Statistical Profile
Georgia Dept of Corrections Page05-FEB-15Inmate Statistical ProfileActive Inmates In Transition Centers
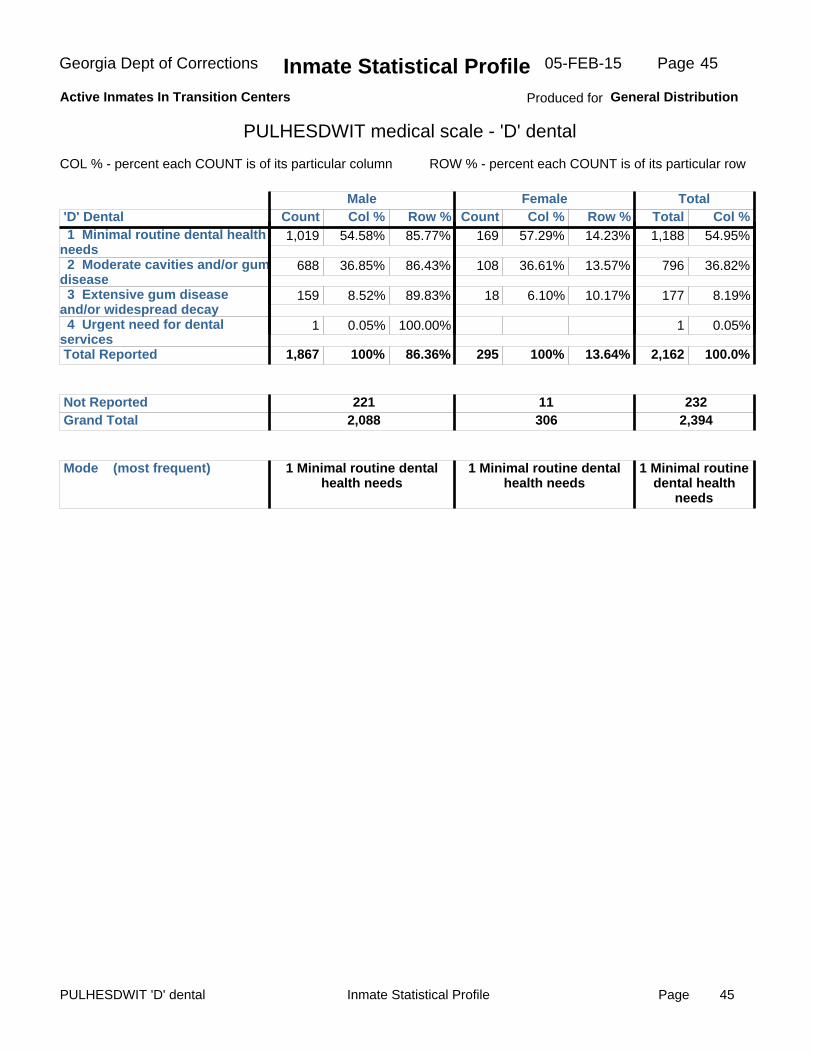
PULHESDWIT medical scale - 'D' dental
COL % - percent each COUNT is of its particular column ROW % - percent each COUNT is of its particular row
Male
1 Minimal routine dental healthneeds 2 Moderate cavities and/or gumdisease 3 Extensive gum diseaseand/or widespread decay 4 Urgent need for dentalservices
1,019
688
159
1
54.58%
36.85%
8.52%
0.05%
85.77%
86.43%
89.83%
100.00%
169
108
18
57.29%
36.61%
6.10%
14.23%
13.57%
10.17%
1,188
796
177
1
54.95%
36.82%
8.19%
0.05%
86.36% 13.64% 1,867 100% 295 100% 2,162 100.0% Total Reported
'D' Dental Count Col % Row % Count Col % Row % Total Col %
Not Reported Grand Total
221 2,088
11 306
232 2,394
Mode (most frequent) 1 Minimal routine dentalhealth needs
1 Minimal routine dentalhealth needs
1 Minimal routinedental health
needs
Female Total
Produced for General Distribution
45
PULHESDWIT 'W' work ability Page 46Inmate Statistical Profile
Georgia Dept of Corrections Page05-FEB-15Inmate Statistical ProfileActive Inmates In Transition Centers
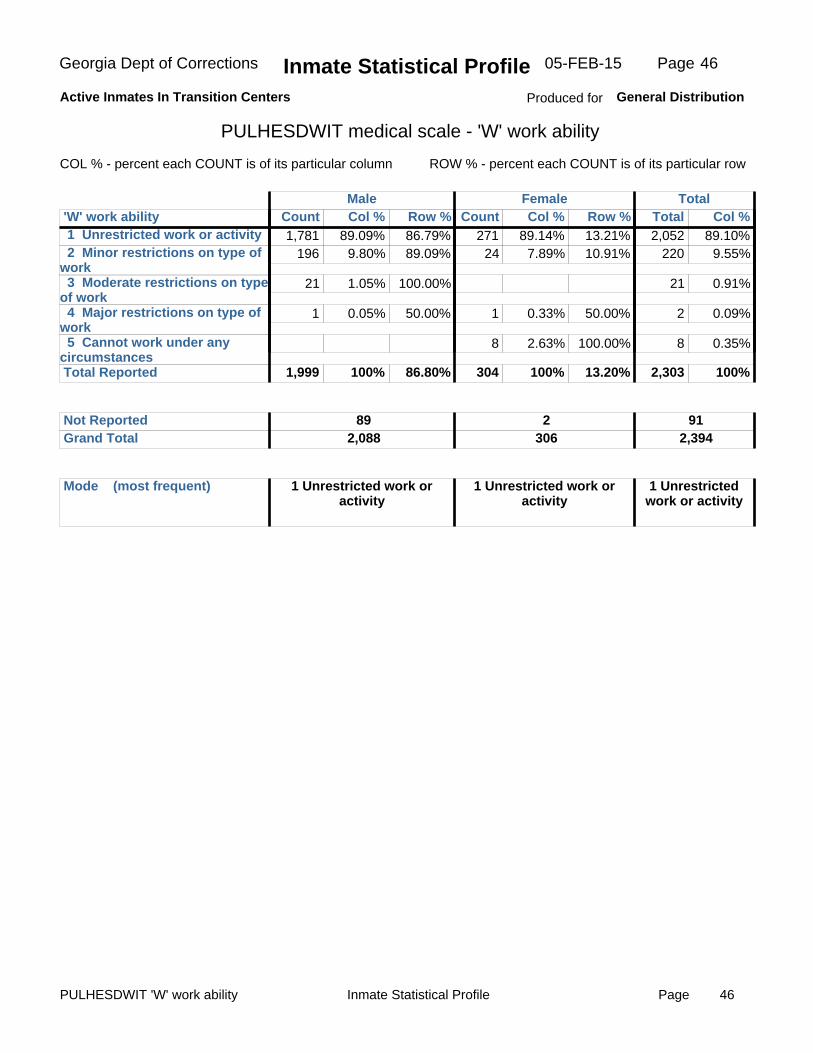
PULHESDWIT medical scale - 'W' work ability
COL % - percent each COUNT is of its particular column ROW % - percent each COUNT is of its particular row
Male
1 Unrestricted work or activity 2 Minor restrictions on type ofwork 3 Moderate restrictions on typeof work 4 Major restrictions on type ofwork 5 Cannot work under anycircumstances
1,781 196
21
1
89.09% 9.80%
1.05%
0.05%
86.79% 89.09%
100.00%
50.00%
271 24
1
8
89.14% 7.89%
0.33%
2.63%
13.21% 10.91%
50.00%
100.00%
2,052 220
21
2
8
89.10% 9.55%
0.91%
0.09%
0.35%
86.80% 13.20% 1,999 100% 304 100% 2,303 100% Total Reported
'W' work ability Count Col % Row % Count Col % Row % Total Col %
Not Reported Grand Total
89 2,088
2 306
91 2,394
Mode (most frequent) 1 Unrestricted work oractivity
1 Unrestricted work oractivity
1 Unrestrictedwork or activity
Female Total
Produced for General Distribution
46
PULHESDWIT 'I' impairment Page 47Inmate Statistical Profile
Georgia Dept of Corrections Page05-FEB-15Inmate Statistical ProfileActive Inmates In Transition Centers
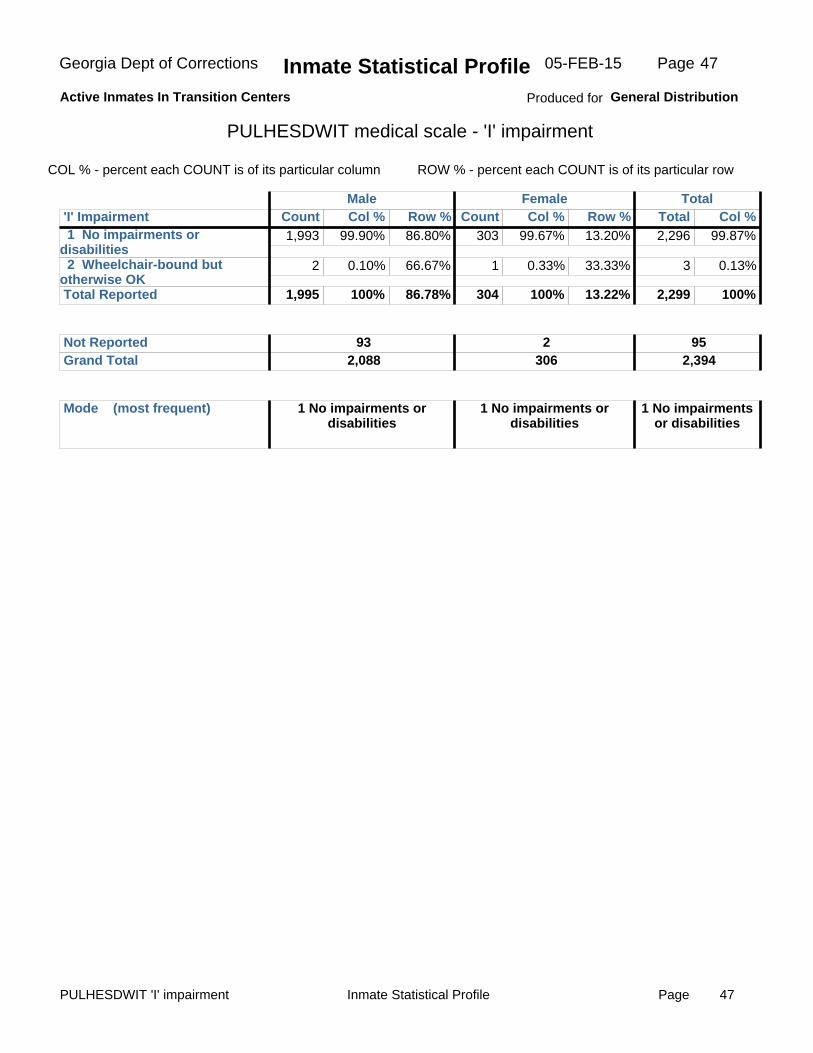
PULHESDWIT medical scale - 'I' impairment
COL % - percent each COUNT is of its particular column ROW % - percent each COUNT is of its particular row
Male
1 No impairments ordisabilities 2 Wheelchair-bound butotherwise OK
1,993
2
99.90%
0.10%
86.80%
66.67%
303
1
99.67%
0.33%
13.20%
33.33%
2,296
3
99.87%
0.13%
86.78% 13.22% 1,995 100% 304 100% 2,299 100% Total Reported
'I' Impairment Count Col % Row % Count Col % Row % Total Col %
Not Reported Grand Total
93 2,088
2 306
95 2,394
Mode (most frequent) 1 No impairments ordisabilities
1 No impairments ordisabilities
1 No impairmentsor disabilities
Female Total
Produced for General Distribution
47
PULHESDWIT 'T' transportability Page 48Inmate Statistical Profile
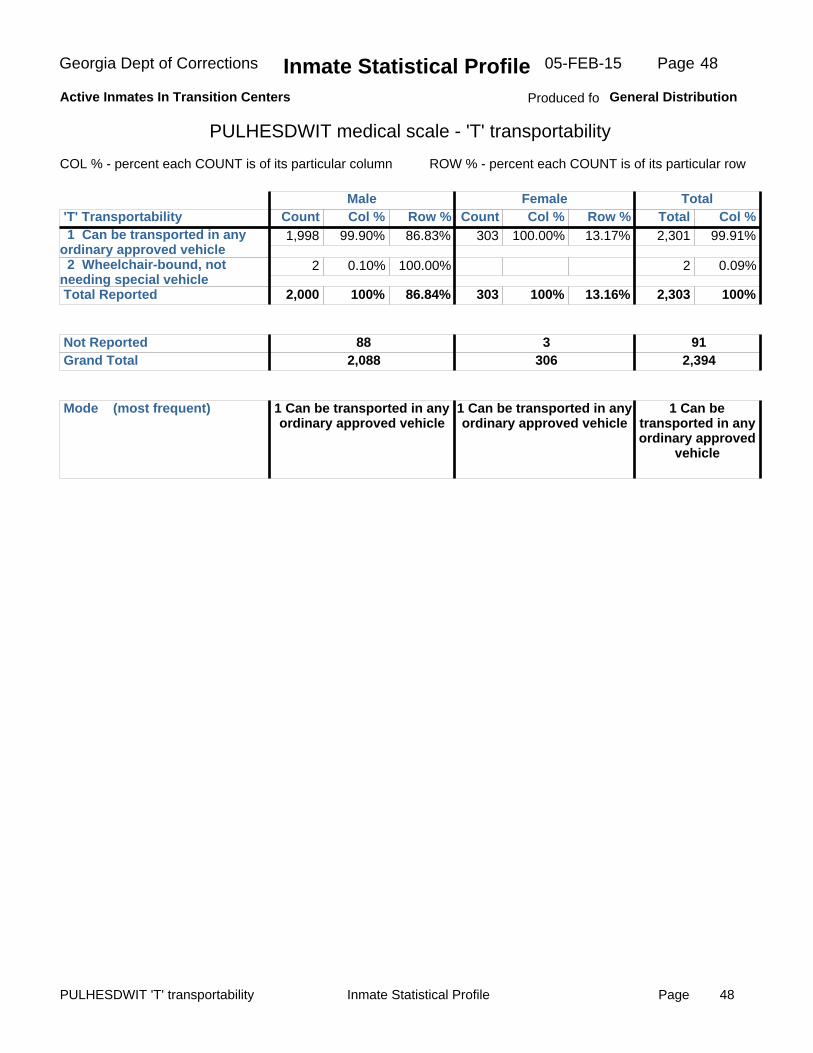
1 Can be transported in anyordinary approved vehicle 2 Wheelchair-bound, notneeding special vehicle
1,998
2
99.90%
0.10%
86.83%
100.00%
303
100.00% 13.17% 2,301
2
99.91%
0.09%
86.84% 13.16% 2,000 100% 303 100% 2,303 100% Total Reported
'T' Transportability Count Col % Row % Count Col % Row % Total Col %
Not Reported Grand Total
88 2,088
3 306
91 2,394
Mode (most frequent) 1 Can be transported in anyordinary approved vehicle
1 Can be transported in anyordinary approved vehicle
1 Can betransported in anyordinary approved
vehicle
Georgia Dept of Corrections
PULHESDWIT medical scale - 'T' transportability
COL % - percent each COUNT is of its particular column ROW % - percent each COUNT is of its particular row
Page05-FEB-15
Male Female Total
Inmate Statistical ProfileActive Inmates In Transition Centers Produced fo General Distribution
48
Number of prior GA incarcerations Inmate statistical profile Page 49
Georgia Dept of Corrections Inmate Statistical ProfileActive Inmates In Transition Centers
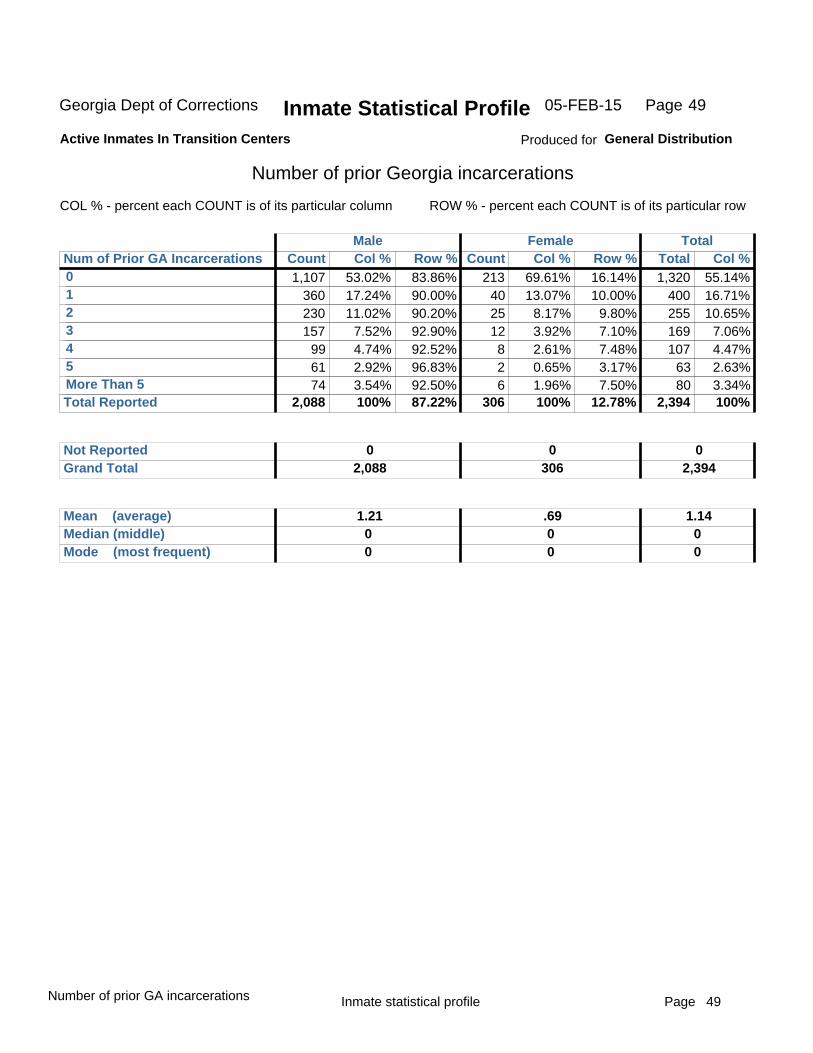
Number of prior Georgia incarcerations
COL % - percent each COUNT is of its particular column ROW % - percent each COUNT is of its particular row
Male
012345More Than 5
1,107 360 230 157
99 61 74
53.02% 17.24% 11.02%
7.52% 4.74% 2.92% 3.54%
83.86% 90.00% 90.20% 92.90% 92.52% 96.83% 92.50%
213 40 25 12 8 2 6
69.61% 13.07%
8.17% 3.92% 2.61% 0.65% 1.96%
16.14% 10.00%
9.80% 7.10% 7.48% 3.17% 7.50%
1,320 400 255 169 107
63 80
55.14% 16.71% 10.65%
7.06% 4.47% 2.63% 3.34%
87.22% 12.78% 2,088 100% 306 100% 2,394 100% Total Reported
Num of Prior GA Incarcerations Count Col % Row % Count Col % Row % Total Col %
Not Reported Grand Total
0 2,088
0 306
0 2,394
Mean (average) 1.210 Median (middle)
Mode (most frequent) 000
00
.69 1.14
Female Total
Produced for General Distribution
Page05-FEB-15 49
Prison sentence in years Page 50Inmate Statistical Profile
Georgia Dept of Corrections Inmate Statistical ProfileActive Inmates In Transition Centers
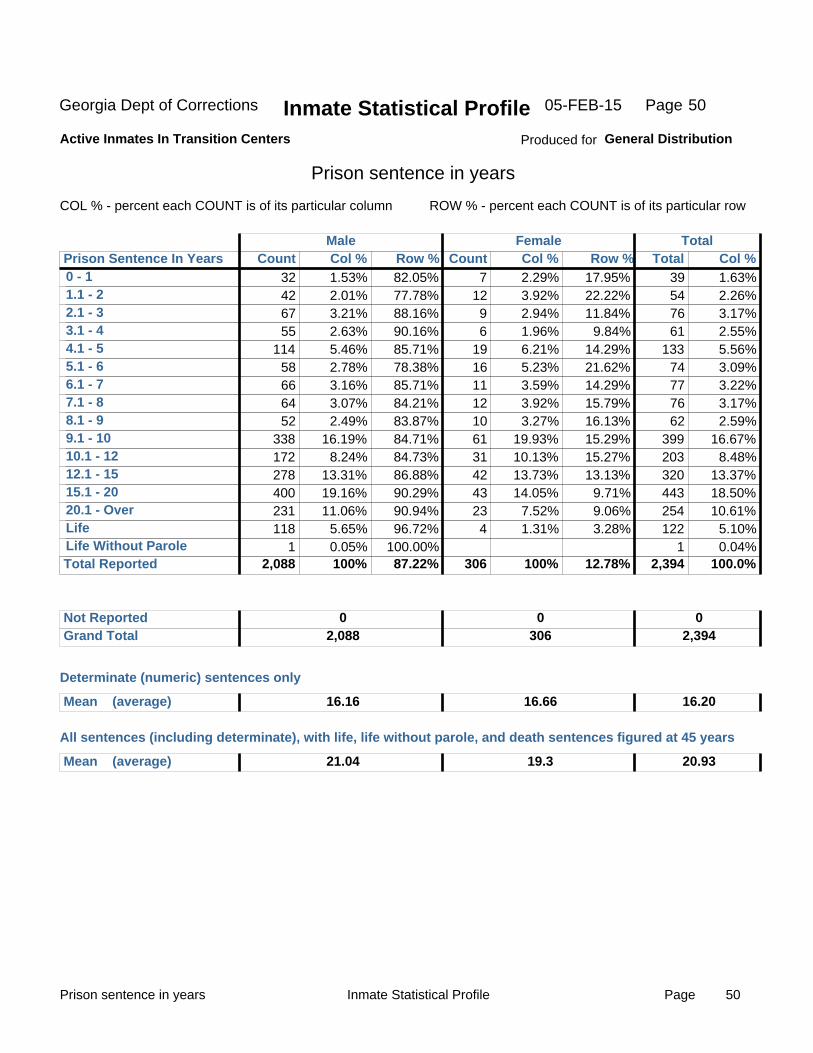
Prison sentence in years
COL % - percent each COUNT is of its particular column ROW % - percent each COUNT is of its particular row
Male
32 42 67 55
114 58 66 64 52
338 172 278 400 231 118
1
1.53% 2.01% 3.21% 2.63% 5.46% 2.78% 3.16% 3.07% 2.49%
16.19% 8.24%
13.31% 19.16% 11.06%
5.65% 0.05%
82.05% 77.78% 88.16% 90.16% 85.71% 78.38% 85.71% 84.21% 83.87% 84.71% 84.73% 86.88% 90.29% 90.94% 96.72%
100.00%
7 12 9 6
19 16 11 12 10 61 31 42 43 23 4
2.29% 3.92% 2.94% 1.96% 6.21% 5.23% 3.59% 3.92% 3.27%
19.93% 10.13% 13.73% 14.05%
7.52% 1.31%
17.95% 22.22% 11.84%
9.84% 14.29% 21.62% 14.29% 15.79% 16.13% 15.29% 15.27% 13.13%
9.71% 9.06% 3.28%
39 54 76 61
133 74 77 76 62
399 203 320 443 254 122
1
1.63% 2.26% 3.17% 2.55% 5.56% 3.09% 3.22% 3.17% 2.59%
16.67% 8.48%
13.37% 18.50% 10.61%
5.10% 0.04%
0 - 11.1 - 22.1 - 33.1 - 44.1 - 55.1 - 66.1 - 77.1 - 88.1 - 99.1 - 1010.1 - 1212.1 - 1515.1 - 2020.1 - OverLifeLife Without Parole
87.22% 12.78% 2,088 100% 306 100% 2,394 100.0% Total Reported
Prison Sentence In Years Count Col % Row % Count Col % Row % Total Col %
Not Reported Grand Total
0 2,088
0 306
0 2,394
Determinate (numeric) sentences only
Mean (average) 16.16
All sentences (including determinate), with life, life without parole, and death sentences figured at 45 years
Mean (average) 21.04 19.3 20.93
16.66 16.20
Female Total
Produced for General Distribution
Page05-FEB-15 50
Felonies vs misdemeanors Page 51Inmate Statistical Profile
Georgia Dept of Corrections Inmate Statistical ProfileActive Inmates In Transition Centers
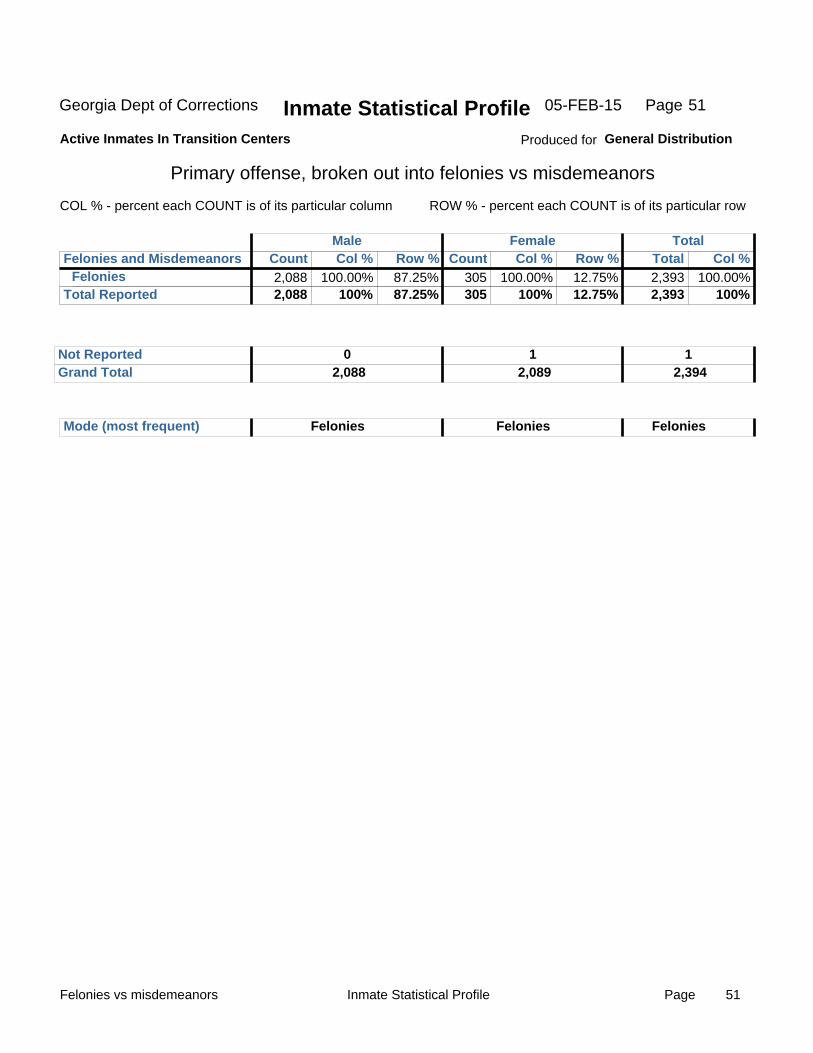
Primary offense, broken out into felonies vs misdemeanors
COL % - percent each COUNT is of its particular column ROW % - percent each COUNT is of its particular row
Male
Felonies 2,088 100.00% 87.25% 305 100.00% 12.75% 2,393 100.00% 87.25% 12.75% 2,088 100% 305 100% 2,393 100% Total Reported
Felonies and Misdemeanors Count Col % Row % Count Col % Row % Total Col %
Not Reported Grand Total
0 2,088
1 2,089
1 2,394
Mode (most frequent) Felonies Felonies Felonies
Female Total
Produced for General Distribution
Page05-FEB-15 51
Crime categories Page 52Inmate Statistical Profile
Georgia Dept of Corrections Inmate Statistical ProfileActive Inmates In Transition Centers
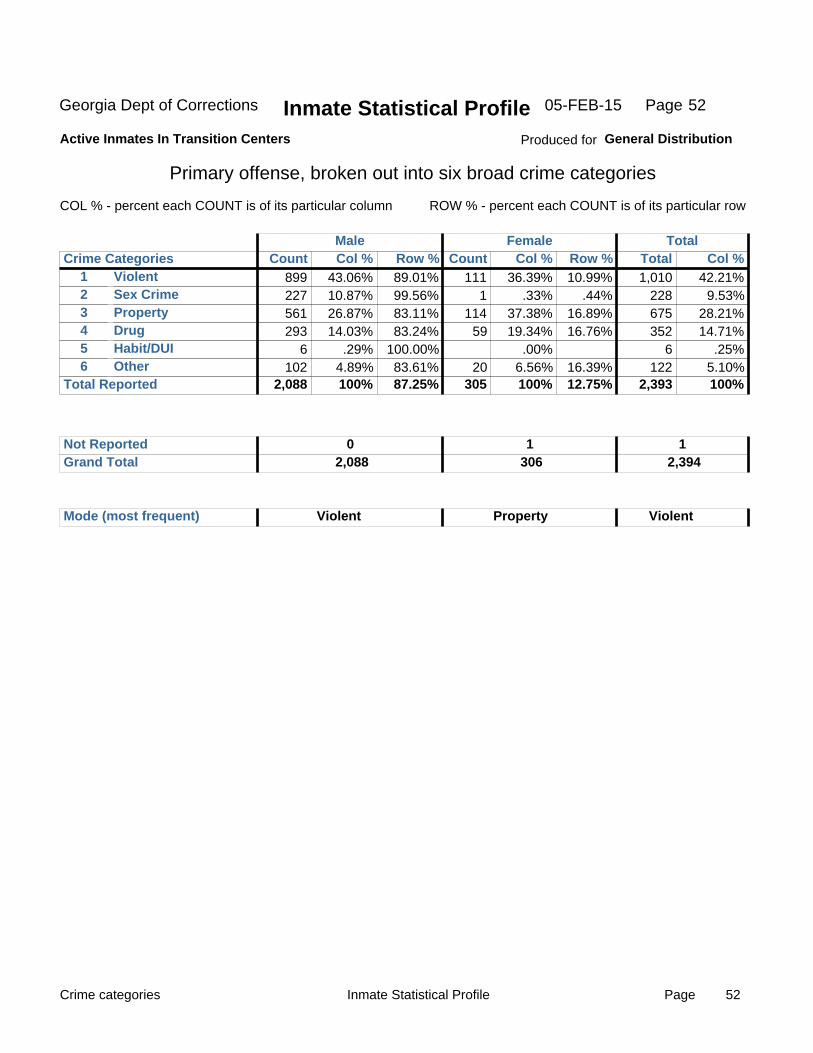
Primary offense, broken out into six broad crime categories
COL % - percent each COUNT is of its particular column ROW % - percent each COUNT is of its particular row
Male
123456
ViolentSex CrimePropertyDrugHabit/DUIOther
899 227 561 293
6 102
43.06% 10.87% 26.87% 14.03%
.29% 4.89%
89.01% 99.56% 83.11% 83.24%
100.00% 83.61%
111 1
114 59
20
36.39% .33%
37.38% 19.34%
.00% 6.56%
10.99% .44%
16.89% 16.76%
16.39%
1,010 228 675 352
6 122
42.21% 9.53%
28.21% 14.71%
.25% 5.10%
87.25% 12.75% 2,088 100% 305 100% 2,393 100% Total Reported
Crime Categories Count Col % Row % Count Col % Row % Total Col %
Not Reported Grand Total
0 2,088
1 306
1 2,394
Mode (most frequent) Violent Property Violent
Female Total
Produced for General Distribution
Page05-FEB-15 52

Primary offense Inmate Statistical Profile 53Page
Georgia Dept of Corrections Inmate Statistical ProfileActive Inmates In Transition Centers
Primary offense, detailed offense code
COL % - percent each COUNT is of its particular column ROW % - percent each COUNT is of its particular row
Male
Abuse,Neglect Elder/Disab (2812)Agg Aslt W Intnt To Rape (2095)Aggrav Assault (1302)Aggrav Assault Peace Ofcr(1314)Aggrav Battery (1305)Aggrav Child Molestation (2021)Aggrav Cruelty To Animals(2972)Aggrav Sexual Battery (2009)Aggrav Sodomy (2003)Aggrav Stalking (1321)Armed Robbery (1902)Arson 1st Degree (1401)Atmpt Aggrav Assault (1303)Atmpt Armed Robbery (1992)Atmpt Burglary (1690)Atmpt Rape (2091)Atmpt Robbery (1991)Att/Consprcy Commt C/S/Of(4134)Bail Jumping (2511)Burg 1st Aft 6/30/12 (1611)Burg 2nd Aft 6/30/12 (1612)Burg Bef 7/1/12 (1601)Child Molestation (2019)Computer Pornography (1760)Conceal Death Of Another (1125)Conspiracy (9901)Crmnl Damage 1st Degree (1501)Crmnl Damage 2nd Degree(1502)Crmnl Interfere Govt Prop (2613)Cruelty To Animals (2971)Cruelty To Children (2801)Cruelty To Elder Person (2811)Damage,Destroy Secr Prop(1504)Entering Vehicle (1880)Escape (2501)
3 1
239 11
54 9 2
2 2
23 144
6 2 6 3 4 5 2
1 53 10
328 91 4 1
1 3
1
16 2 1
5
.14% .05%
11.45% .53%
2.59% .43% .10%
.10% .10%
1.10% 6.90% .29% .10% .29% .14% .19% .24% .10%
.05% 2.54% .48%
15.71% 4.36% .19% .05%
.05% .14%
.05%
.77% .10% .05%
.24%
50.00% 100.00% 89.51%
100.00%
80.60% 100.00% 100.00%
100.00% 100.00% 95.83% 92.31% 85.71%
100.00% 100.00% 100.00% 100.00% 100.00% 66.67%
50.00% 80.30%
100.00% 92.92% 98.91%
100.00% 100.00%
100.00% 75.00%
100.00%
66.67% 50.00%
100.00%
83.33%
3
28
13
1 12 1
1
1 13
25 1
1
1
1 8 2
1 1
.98%
9.18%
4.26%
.33% 3.93% .33%
.33%
.33% 4.26%
8.20% .33%
.33%
.33%
.33% 2.62% .66%
.33% .33%
50.00%
10.49%
19.40%
4.17% 7.69%
14.29%
33.33%
50.00% 19.70%
7.08% 1.09%
100.00%
25.00%
100.00% 33.33% 50.00%
16.67% 100.00%
6 1
267 11
67 9 2
2 2
24 156
7 2 6 3 4 5 3
2 66 10
353 92 4 1 1 1 4
1 1
24 4 1
6 1
.25% .04%
11.16% .46%
2.80% .38% .08%
.08% .08%
1.00% 6.52% .29% .08% .25% .13% .17% .21% .13%
.08% 2.76% .42%
14.75% 3.84% .17% .04% .04% .04% .17%
.04% .04%
1.00% .17% .04%
.25% .04%
Primary Offense Count Col % Row % Count Col % Row % Total Col % Female Total
Produced for General Distribution
Page05-FEB-15 53
Primary offense Inmate Statistical Profile 54Page
Georgia Dept of Corrections Inmate Statistical ProfileActive Inmates In Transition Centers
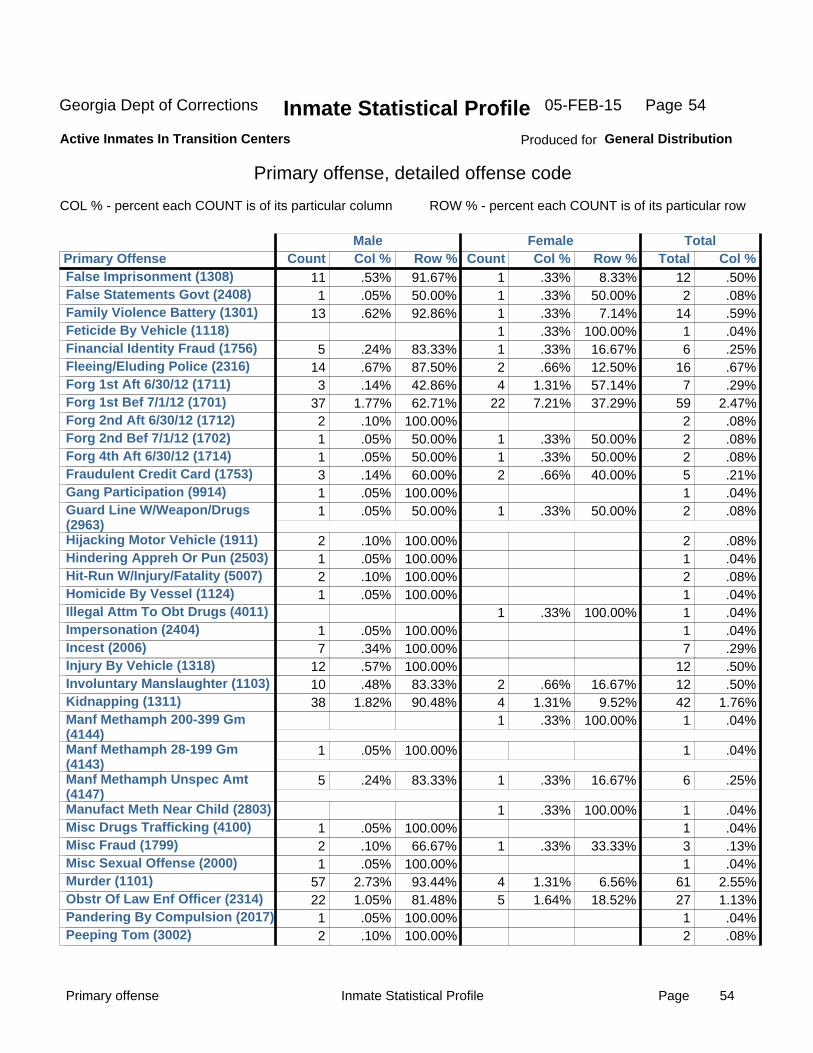
Primary offense, detailed offense code
COL % - percent each COUNT is of its particular column ROW % - percent each COUNT is of its particular row
Male
False Imprisonment (1308)False Statements Govt (2408)Family Violence Battery (1301)Feticide By Vehicle (1118)Financial Identity Fraud (1756)Fleeing/Eluding Police (2316)Forg 1st Aft 6/30/12 (1711)Forg 1st Bef 7/1/12 (1701)Forg 2nd Aft 6/30/12 (1712)Forg 2nd Bef 7/1/12 (1702)Forg 4th Aft 6/30/12 (1714)Fraudulent Credit Card (1753)Gang Participation (9914)Guard Line W/Weapon/Drugs(2963)Hijacking Motor Vehicle (1911)Hindering Appreh Or Pun (2503)Hit-Run W/Injury/Fatality (5007)Homicide By Vessel (1124)Illegal Attm To Obt Drugs (4011)Impersonation (2404)Incest (2006)Injury By Vehicle (1318)Involuntary Manslaughter (1103)Kidnapping (1311)Manf Methamph 200-399 Gm(4144)Manf Methamph 28-199 Gm(4143)Manf Methamph Unspec Amt(4147)Manufact Meth Near Child (2803)Misc Drugs Trafficking (4100)Misc Fraud (1799)Misc Sexual Offense (2000)Murder (1101)Obstr Of Law Enf Officer (2314)Pandering By Compulsion (2017)Peeping Tom (3002)
11 1
13
5 14 3
37 2 1 1 3 1 1
2 1 2 1
1 7
12 10 38
1
5
1 2 1
57 22 1 2
.53% .05% .62%
.24% .67% .14%
1.77% .10% .05% .05% .14% .05% .05%
.10% .05% .10% .05%
.05% .34% .57% .48%
1.82%
.05%
.24%
.05% .10% .05%
2.73% 1.05% .05% .10%
91.67% 50.00% 92.86%
83.33% 87.50% 42.86% 62.71%
100.00% 50.00% 50.00% 60.00%
100.00% 50.00%
100.00% 100.00% 100.00% 100.00%
100.00% 100.00% 100.00% 83.33% 90.48%
100.00%
83.33%
100.00% 66.67%
100.00% 93.44% 81.48%
100.00% 100.00%
1 1 1 1 1 2 4
22
1 1 2
1
1
2 4 1
1
1
1
4 5
.33% .33% .33% .33% .33% .66%
1.31% 7.21%
.33% .33% .66%
.33%
.33%
.66% 1.31% .33%
.33%
.33%
.33%
1.31% 1.64%
8.33% 50.00%
7.14% 100.00% 16.67% 12.50% 57.14% 37.29%
50.00% 50.00% 40.00%
50.00%
100.00%
16.67% 9.52%
100.00%
16.67%
100.00%
33.33%
6.56% 18.52%
12 2
14 1 6
16 7
59 2 2 2 5 1 2
2 1 2 1 1 1 7
12 12 42 1
1
6
1 1 3 1
61 27 1 2
.50% .08% .59% .04% .25% .67% .29%
2.47% .08% .08% .08% .21% .04% .08%
.08% .04% .08% .04% .04% .04% .29% .50% .50%
1.76% .04%
.04%
.25%
.04% .04% .13% .04%
2.55% 1.13% .04% .08%
Primary Offense Count Col % Row % Count Col % Row % Total Col % Female Total
Produced for General Distribution
Page05-FEB-15 54
Primary offense Inmate Statistical Profile 55Page
Georgia Dept of Corrections Inmate Statistical ProfileActive Inmates In Transition Centers
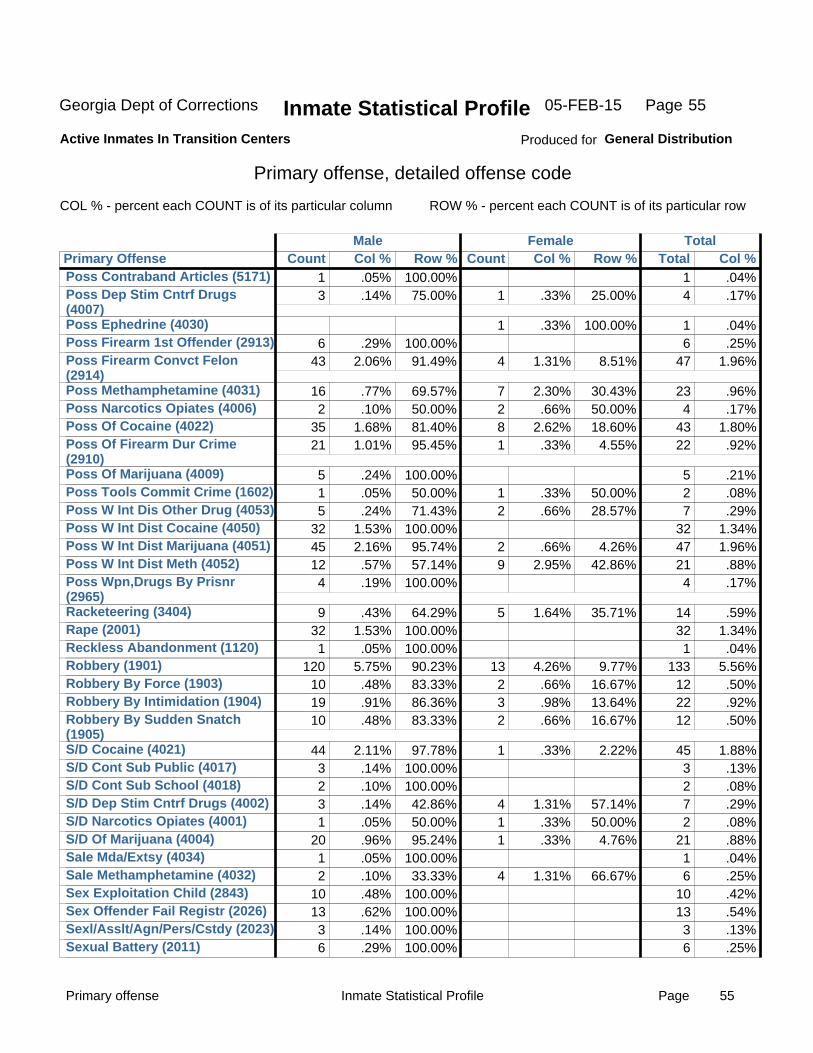
Primary offense, detailed offense code
COL % - percent each COUNT is of its particular column ROW % - percent each COUNT is of its particular row
Male
Poss Contraband Articles (5171)Poss Dep Stim Cntrf Drugs(4007)Poss Ephedrine (4030)Poss Firearm 1st Offender (2913)Poss Firearm Convct Felon(2914)Poss Methamphetamine (4031)Poss Narcotics Opiates (4006)Poss Of Cocaine (4022)Poss Of Firearm Dur Crime(2910)Poss Of Marijuana (4009)Poss Tools Commit Crime (1602)Poss W Int Dis Other Drug (4053)Poss W Int Dist Cocaine (4050)Poss W Int Dist Marijuana (4051)Poss W Int Dist Meth (4052)Poss Wpn,Drugs By Prisnr(2965)Racketeering (3404)Rape (2001)Reckless Abandonment (1120)Robbery (1901)Robbery By Force (1903)Robbery By Intimidation (1904)Robbery By Sudden Snatch(1905)S/D Cocaine (4021)S/D Cont Sub Public (4017)S/D Cont Sub School (4018)S/D Dep Stim Cntrf Drugs (4002)S/D Narcotics Opiates (4001)S/D Of Marijuana (4004)Sale Mda/Extsy (4034)Sale Methamphetamine (4032)Sex Exploitation Child (2843)Sex Offender Fail Registr (2026)Sexl/Asslt/Agn/Pers/Cstdy (2023)Sexual Battery (2011)
1 3
6
43
16 2
35 21
5 1 5
32 45 12 4
9 32 1
120 10 19 10
44 3 2 3 1
20 1 2
10 13 3 6
.05% .14%
.29% 2.06%
.77% .10%
1.68% 1.01%
.24% .05% .24%
1.53% 2.16% .57% .19%
.43% 1.53% .05%
5.75% .48% .91% .48%
2.11% .14% .10% .14% .05% .96% .05% .10% .48% .62% .14% .29%
100.00% 75.00%
100.00% 91.49%
69.57% 50.00% 81.40% 95.45%
100.00% 50.00% 71.43%
100.00% 95.74% 57.14%
100.00%
64.29% 100.00% 100.00% 90.23% 83.33% 86.36% 83.33%
97.78% 100.00% 100.00% 42.86% 50.00% 95.24%
100.00% 33.33%
100.00% 100.00% 100.00% 100.00%
1
1
4
7 2 8 1
1 2
2 9
5
13 2 3 2
1
4 1 1
4
.33%
.33%
1.31%
2.30% .66%
2.62% .33%
.33% .66%
.66% 2.95%
1.64%
4.26% .66% .98% .66%
.33%
1.31% .33% .33%
1.31%
25.00%
100.00%
8.51%
30.43% 50.00% 18.60%
4.55%
50.00% 28.57%
4.26% 42.86%
35.71%
9.77% 16.67% 13.64% 16.67%
2.22%
57.14% 50.00%
4.76%
66.67%
1 4
1 6
47
23 4
43 22
5 2 7
32 47 21 4
14 32 1
133 12 22 12
45 3 2 7 2
21 1 6
10 13 3 6
.04% .17%
.04% .25%
1.96%
.96% .17%
1.80% .92%
.21% .08% .29%
1.34% 1.96% .88% .17%
.59% 1.34% .04%
5.56% .50% .92% .50%
1.88% .13% .08% .29% .08% .88% .04% .25% .42% .54% .13% .25%
Primary Offense Count Col % Row % Count Col % Row % Total Col % Female Total
Produced for General Distribution
Page05-FEB-15 55

Primary offense Inmate Statistical Profile 56Page
Georgia Dept of Corrections Inmate Statistical ProfileActive Inmates In Transition Centers
Primary offense, detailed offense code
COL % - percent each COUNT is of its particular column ROW % - percent each COUNT is of its particular row
Male
Simple Battery (1316)Sodomy (2002)Solicit Sodomy From Minor(2025)Statutory Rape (2018)Terrorist Threats & Acts (1307)Theft By Conversion (1808)Theft By Deception (1803)Theft By Extortion (1804)Theft By Rec Stolen Prop (1806)Theft By Shoplifting (1821)Theft By Taking (1802)Theft Motorveh Or Part (1813)Traf Cocaine 201-400 Gm (4102)Traf Cocaine 401+ Gm (4103)Traf Cocaine Less 200 Gm (4101)Traf Marijna 10-2000 Lb (4121)Traf Mda/Extsy 200-399gm(4151)Traf Mda/Extsy 28-199gm (4150)Traf Methamph 28-199 Gm(4140)Traf Methamph 400+ Gm (4142)Traf Methamph Unspec Amt(4146)Traf Narcotic 15-28 Gm (4112)Unknown Offense (9999)Unlwfl Mfg/Del/Dist N-C S (4014)Vehicular Homicide (1123)Viol Dngrous Drgs Act (4013)Viol Ga Cntrl Sbst Act (4012)Viol Motor Vehicle Laws (5001)Violatn Othr States Law (8001)Voluntary Manslaughter (1102)
1 1 1
37 14 1 3 1
27 18 34 2 2 3
10 7 1
3 4
2 2
1 1 1
16 14 3 4 2
38
.05% .05% .05%
1.77% .67% .05% .14% .05%
1.29% .86%
1.63% .10% .10% .14% .48% .34% .05%
.14% .19%
.10% .10%
.05% .05% .05% .77% .67% .14% .19% .10%
1.82%
100.00% 100.00% 100.00%
100.00% 87.50% 50.00% 50.00%
100.00% 81.82% 58.06% 73.91%
100.00% 100.00% 100.00% 100.00% 87.50%
100.00%
75.00% 57.14%
100.00% 66.67%
100.00% 50.00%
100.00% 80.00% 82.35% 60.00%
100.00% 100.00% 86.36%
2 1 3
6
13 12
1
1 3
1
1
4 3 2
6
.66% .33% .98%
1.97% 4.26% 3.93%
.33%
.33% .98%
.33%
.33%
1.31% .98% .66%
1.97%
12.50% 50.00% 50.00%
18.18% 41.94% 26.09%
12.50%
25.00% 42.86%
33.33%
50.00%
20.00% 17.65% 40.00%
13.64%
1 1 1
37 16 2 6 1
33 31 46 2 2 3
10 8 1
4 7
2 3
1 2 1
20 17 5 4 2
44
.04% .04% .04%
1.55% .67% .08% .25% .04%
1.38% 1.30% 1.92% .08% .08% .13% .42% .33% .04%
.17% .29%
.08% .13%
.04% .08% .04% .84% .71% .21% .17% .08%
1.84% 87.25% 12.75% 2,088 100% 305 100% 2,393 100% Total Rported
Primary Offense Count Col % Row % Count Col % Row % Total Col %
Not Reported Grand Total
0 2,088
1 306
1 2,394
Female Total
Produced for General Distribution
Page05-FEB-15 56
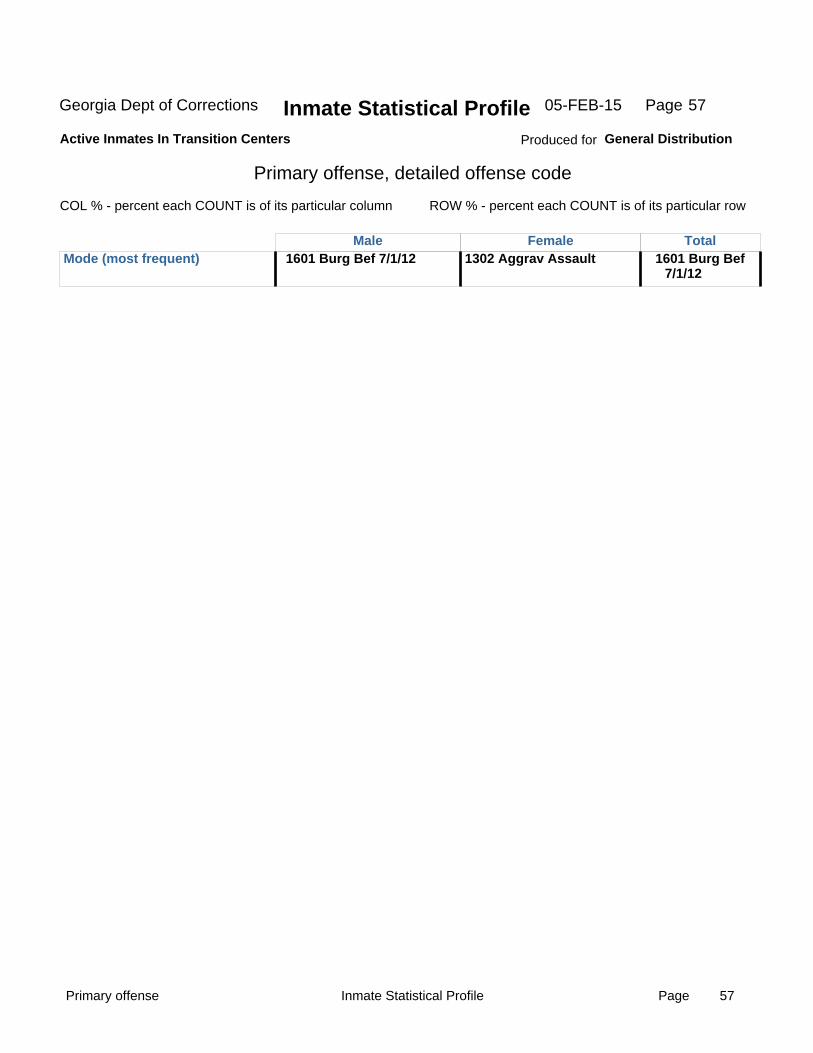
Primary offense Inmate Statistical Profile 57Page
Georgia Dept of Corrections Inmate Statistical ProfileActive Inmates In Transition Centers
Primary offense, detailed offense code
COL % - percent each COUNT is of its particular column ROW % - percent each COUNT is of its particular row
Male Mode (most frequent) 1601 Burg Bef 7/1/12 1302 Aggrav Assault 1601 Burg Bef
7/1/12
Female Total
Produced for General Distribution
Page05-FEB-15 57
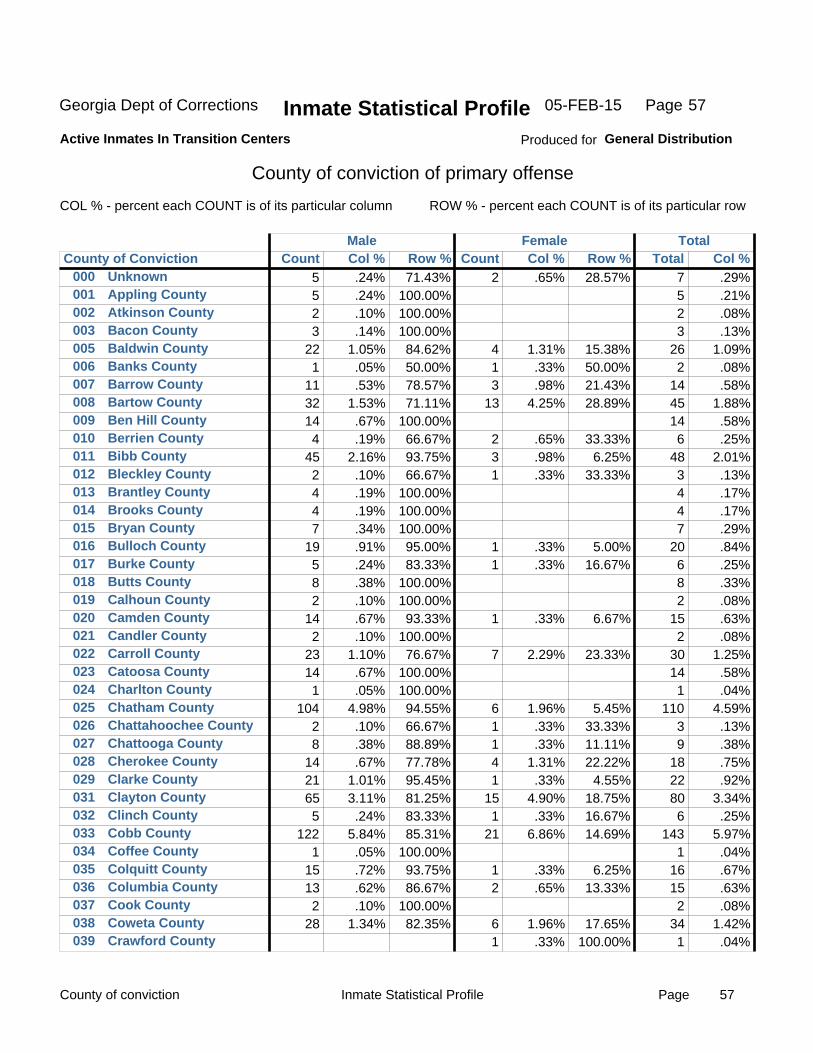
County of conviction Page 57Inmate Statistical Profile
Georgia Dept of Corrections Inmate Statistical ProfileActive Inmates In Transition Centers
County of conviction of primary offense
COL % - percent each COUNT is of its particular column ROW % - percent each COUNT is of its particular row
Male
000001002003005006007008009010011012013014015016017018019020021022023024025026027028029031032033034035036037038039
UnknownAppling CountyAtkinson CountyBacon CountyBaldwin CountyBanks CountyBarrow CountyBartow CountyBen Hill CountyBerrien CountyBibb CountyBleckley CountyBrantley CountyBrooks CountyBryan CountyBulloch CountyBurke CountyButts CountyCalhoun CountyCamden CountyCandler CountyCarroll CountyCatoosa CountyCharlton CountyChatham CountyChattahoochee CountyChattooga CountyCherokee CountyClarke CountyClayton CountyClinch CountyCobb CountyCoffee CountyColquitt CountyColumbia CountyCook CountyCoweta CountyCrawford County
5 5 2 3
22 1
11 32 14 4
45 2 4 4 7
19 5 8 2
14 2
23 14 1
104 2 8
14 21 65 5
122 1
15 13 2
28
.24% .24% .10% .14%
1.05% .05% .53%
1.53% .67% .19%
2.16% .10% .19% .19% .34% .91% .24% .38% .10% .67% .10%
1.10% .67% .05%
4.98% .10% .38% .67%
1.01% 3.11% .24%
5.84% .05% .72% .62% .10%
1.34%
71.43% 100.00% 100.00% 100.00% 84.62% 50.00% 78.57% 71.11%
100.00% 66.67% 93.75% 66.67%
100.00% 100.00% 100.00% 95.00% 83.33%
100.00% 100.00% 93.33%
100.00% 76.67%
100.00% 100.00% 94.55% 66.67% 88.89% 77.78% 95.45% 81.25% 83.33% 85.31%
100.00% 93.75% 86.67%
100.00% 82.35%
2
4 1 3
13
2 3 1
1 1
1
7
6 1 1 4 1
15 1
21
1 2
6 1
.65%
1.31% .33% .98%
4.25%
.65% .98% .33%
.33% .33%
.33%
2.29%
1.96% .33% .33%
1.31% .33%
4.90% .33%
6.86%
.33% .65%
1.96% .33%
28.57%
15.38% 50.00% 21.43% 28.89%
33.33% 6.25%
33.33%
5.00% 16.67%
6.67%
23.33%
5.45% 33.33% 11.11% 22.22%
4.55% 18.75% 16.67% 14.69%
6.25% 13.33%
17.65% 100.00%
7 5 2 3
26 2
14 45 14 6
48 3 4 4 7
20 6 8 2
15 2
30 14 1
110 3 9
18 22 80 6
143 1
16 15 2
34 1
.29% .21% .08% .13%
1.09% .08% .58%
1.88% .58% .25%
2.01% .13% .17% .17% .29% .84% .25% .33% .08% .63% .08%
1.25% .58% .04%
4.59% .13% .38% .75% .92%
3.34% .25%
5.97% .04% .67% .63% .08%
1.42% .04%
County of Conviction Count Col % Row % Count Col % Row % Total Col % Female Total
Produced for General Distribution
Page05-FEB-15 57
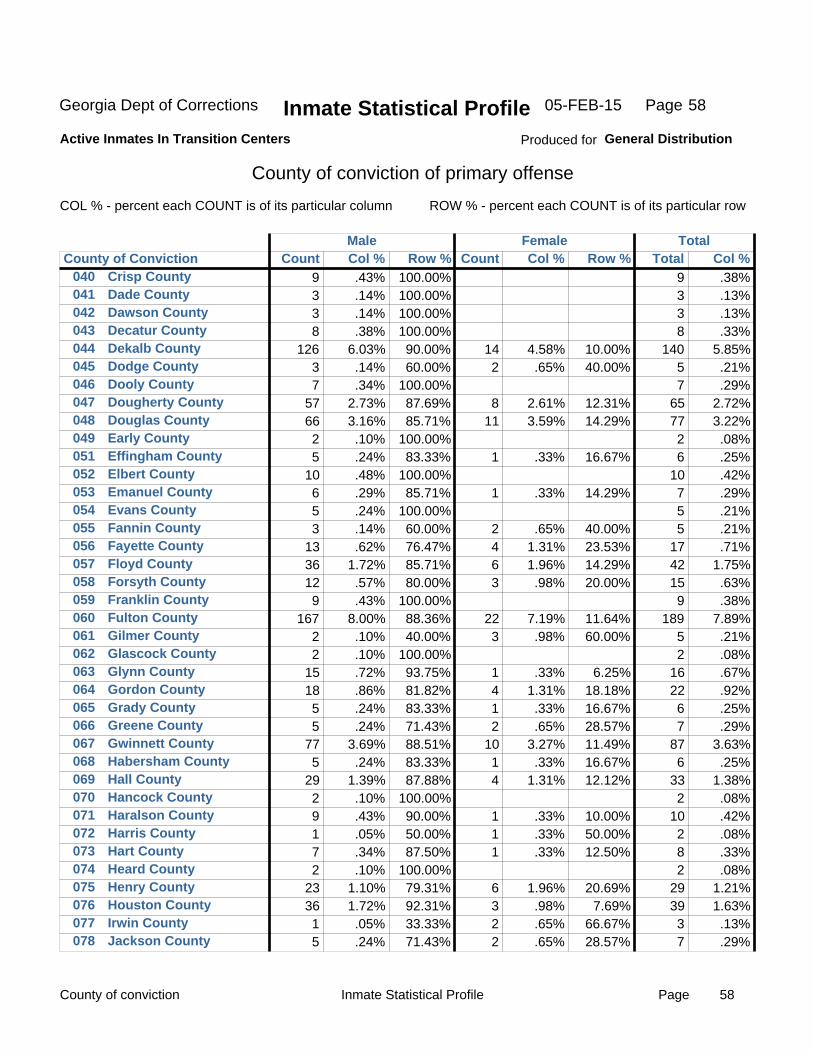
County of conviction Page 58Inmate Statistical Profile
Georgia Dept of Corrections Inmate Statistical ProfileActive Inmates In Transition Centers
County of conviction of primary offense
COL % - percent each COUNT is of its particular column ROW % - percent each COUNT is of its particular row
Male
040041042043044045046047048049051052053054055056057058059060061062063064065066067068069070071072073074075076077078
Crisp CountyDade CountyDawson CountyDecatur CountyDekalb CountyDodge CountyDooly CountyDougherty CountyDouglas CountyEarly CountyEffingham CountyElbert CountyEmanuel CountyEvans CountyFannin CountyFayette CountyFloyd CountyForsyth CountyFranklin CountyFulton CountyGilmer CountyGlascock CountyGlynn CountyGordon CountyGrady CountyGreene CountyGwinnett CountyHabersham CountyHall CountyHancock CountyHaralson CountyHarris CountyHart CountyHeard CountyHenry CountyHouston CountyIrwin CountyJackson County
9 3 3 8
126 3 7
57 66 2 5
10 6 5 3
13 36 12 9
167 2 2
15 18 5 5
77 5
29 2 9 1 7 2
23 36 1 5
.43% .14% .14% .38%
6.03% .14% .34%
2.73% 3.16% .10% .24% .48% .29% .24% .14% .62%
1.72% .57% .43%
8.00% .10% .10% .72% .86% .24% .24%
3.69% .24%
1.39% .10% .43% .05% .34% .10%
1.10% 1.72% .05% .24%
100.00% 100.00% 100.00% 100.00% 90.00% 60.00%
100.00% 87.69% 85.71%
100.00% 83.33%
100.00% 85.71%
100.00% 60.00% 76.47% 85.71% 80.00%
100.00% 88.36% 40.00%
100.00% 93.75% 81.82% 83.33% 71.43% 88.51% 83.33% 87.88%
100.00% 90.00% 50.00% 87.50%
100.00% 79.31% 92.31% 33.33% 71.43%
14 2
8
11
1
1
2 4 6 3
22 3
1 4 1 2
10 1 4
1 1 1
6 3 2 2
4.58% .65%
2.61% 3.59%
.33%
.33%
.65% 1.31% 1.96% .98%
7.19% .98%
.33% 1.31% .33% .65%
3.27% .33%
1.31%
.33% .33% .33%
1.96% .98% .65% .65%
10.00% 40.00%
12.31% 14.29%
16.67%
14.29%
40.00% 23.53% 14.29% 20.00%
11.64% 60.00%
6.25% 18.18% 16.67% 28.57% 11.49% 16.67% 12.12%
10.00% 50.00% 12.50%
20.69% 7.69%
66.67% 28.57%
9 3 3 8
140 5 7
65 77 2 6
10 7 5 5
17 42 15 9
189 5 2
16 22 6 7
87 6
33 2
10 2 8 2
29 39 3 7
.38% .13% .13% .33%
5.85% .21% .29%
2.72% 3.22% .08% .25% .42% .29% .21% .21% .71%
1.75% .63% .38%
7.89% .21% .08% .67% .92% .25% .29%
3.63% .25%
1.38% .08% .42% .08% .33% .08%
1.21% 1.63% .13% .29%
County of Conviction Count Col % Row % Count Col % Row % Total Col % Female Total
Produced for General Distribution
Page05-FEB-15 58
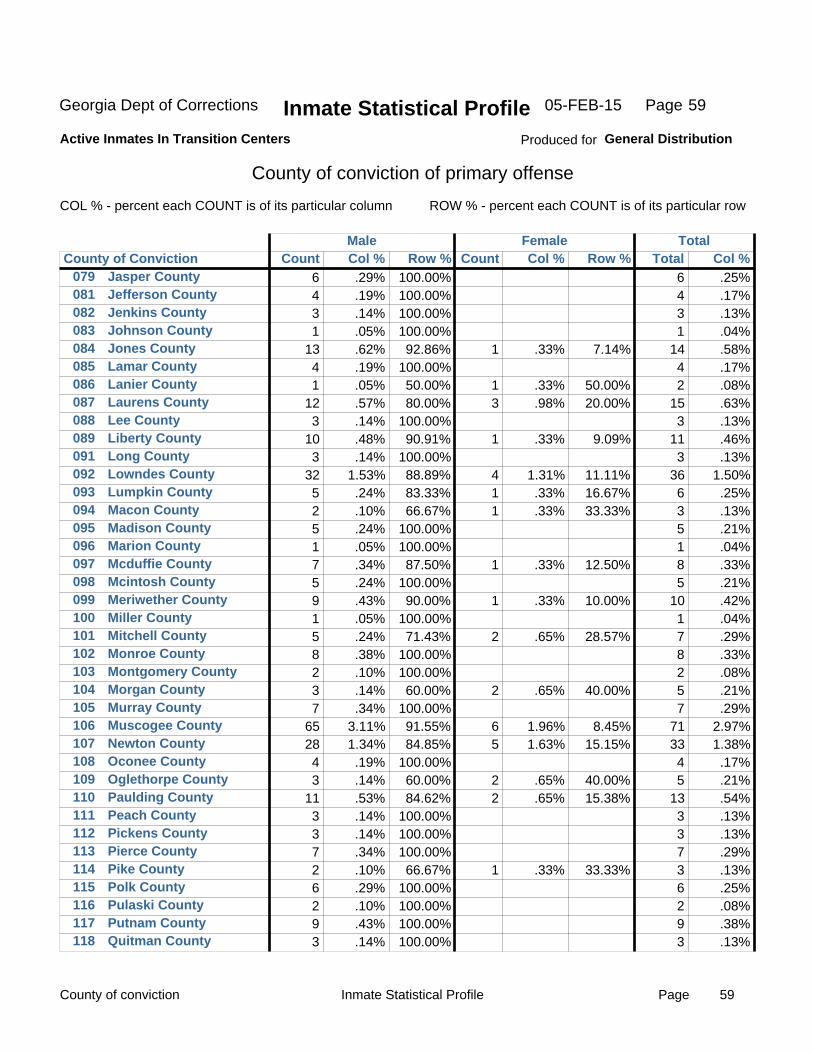
County of conviction Page 59Inmate Statistical Profile
Georgia Dept of Corrections Inmate Statistical ProfileActive Inmates In Transition Centers
County of conviction of primary offense
COL % - percent each COUNT is of its particular column ROW % - percent each COUNT is of its particular row
Male
079081082083084085086087088089091092093094095096097098099100101102103104105106107108109110111112113114115116117118
Jasper CountyJefferson CountyJenkins CountyJohnson CountyJones CountyLamar CountyLanier CountyLaurens CountyLee CountyLiberty CountyLong CountyLowndes CountyLumpkin CountyMacon CountyMadison CountyMarion CountyMcduffie CountyMcintosh CountyMeriwether CountyMiller CountyMitchell CountyMonroe CountyMontgomery CountyMorgan CountyMurray CountyMuscogee CountyNewton CountyOconee CountyOglethorpe CountyPaulding CountyPeach CountyPickens CountyPierce CountyPike CountyPolk CountyPulaski CountyPutnam CountyQuitman County
6 4 3 1
13 4 1
12 3
10 3
32 5 2 5 1 7 5 9 1 5 8 2 3 7
65 28 4 3
11 3 3 7 2 6 2 9 3
.29% .19% .14% .05% .62% .19% .05% .57% .14% .48% .14%
1.53% .24% .10% .24% .05% .34% .24% .43% .05% .24% .38% .10% .14% .34%
3.11% 1.34% .19% .14% .53% .14% .14% .34% .10% .29% .10% .43% .14%
100.00% 100.00% 100.00% 100.00% 92.86%
100.00% 50.00% 80.00%
100.00% 90.91%
100.00% 88.89% 83.33% 66.67%
100.00% 100.00% 87.50%
100.00% 90.00%
100.00% 71.43%
100.00% 100.00% 60.00%
100.00% 91.55% 84.85%
100.00% 60.00% 84.62%
100.00% 100.00% 100.00% 66.67%
100.00% 100.00% 100.00% 100.00%
1
1 3
1
4 1 1
1
1
2
2
6 5
2 2
1
.33%
.33% .98%
.33%
1.31% .33% .33%
.33%
.33%
.65%
.65%
1.96% 1.63%
.65% .65%
.33%
7.14%
50.00% 20.00%
9.09%
11.11% 16.67% 33.33%
12.50%
10.00%
28.57%
40.00%
8.45% 15.15%
40.00% 15.38%
33.33%
6 4 3 1
14 4 2
15 3
11 3
36 6 3 5 1 8 5
10 1 7 8 2 5 7
71 33 4 5
13 3 3 7 3 6 2 9 3
.25% .17% .13% .04% .58% .17% .08% .63% .13% .46% .13%
1.50% .25% .13% .21% .04% .33% .21% .42% .04% .29% .33% .08% .21% .29%
2.97% 1.38% .17% .21% .54% .13% .13% .29% .13% .25% .08% .38% .13%
County of Conviction Count Col % Row % Count Col % Row % Total Col % Female Total
Produced for General Distribution
Page05-FEB-15 59
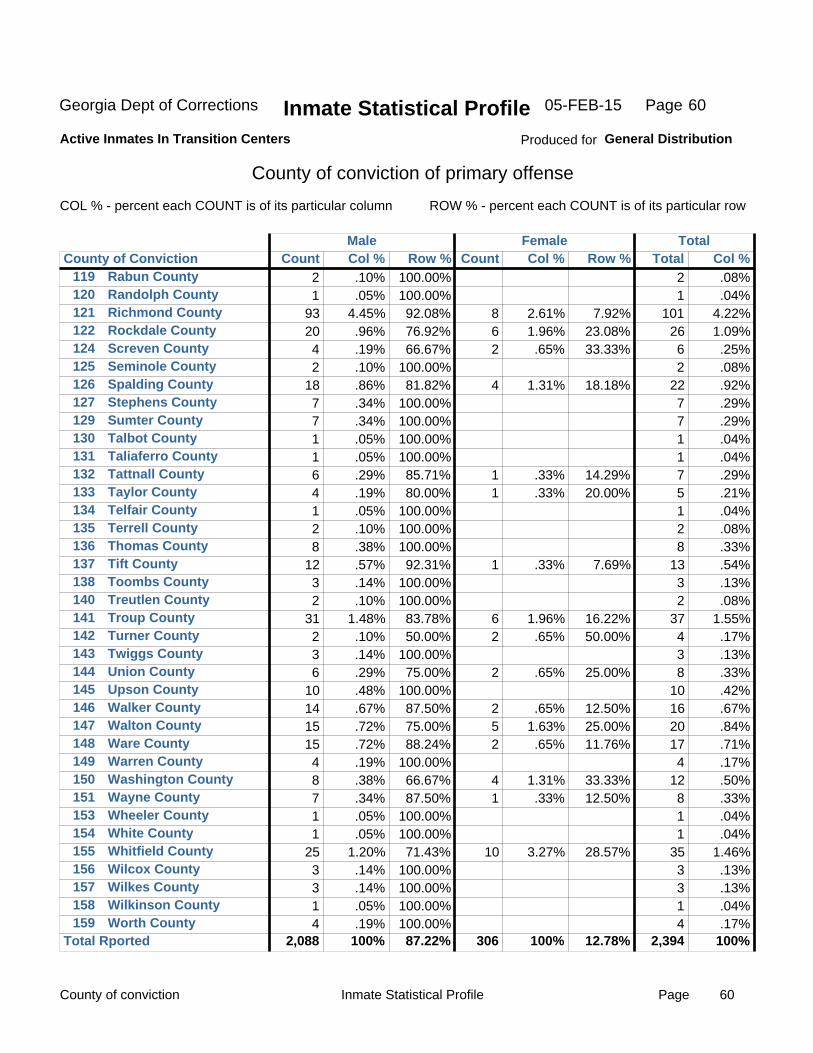
County of conviction Page 60Inmate Statistical Profile
Georgia Dept of Corrections Inmate Statistical ProfileActive Inmates In Transition Centers
County of conviction of primary offense
COL % - percent each COUNT is of its particular column ROW % - percent each COUNT is of its particular row
Male
119120121122124125126127129130131132133134135136137138140141142143144145146147148149150151153154155156157158159
Rabun CountyRandolph CountyRichmond CountyRockdale CountyScreven CountySeminole CountySpalding CountyStephens CountySumter CountyTalbot CountyTaliaferro CountyTattnall CountyTaylor CountyTelfair CountyTerrell CountyThomas CountyTift CountyToombs CountyTreutlen CountyTroup CountyTurner CountyTwiggs CountyUnion CountyUpson CountyWalker CountyWalton CountyWare CountyWarren CountyWashington CountyWayne CountyWheeler CountyWhite CountyWhitfield CountyWilcox CountyWilkes CountyWilkinson CountyWorth County
2 1
93 20 4 2
18 7 7 1 1 6 4 1 2 8
12 3 2
31 2 3 6
10 14 15 15 4 8 7 1 1
25 3 3 1 4
.10% .05%
4.45% .96% .19% .10% .86% .34% .34% .05% .05% .29% .19% .05% .10% .38% .57% .14% .10%
1.48% .10% .14% .29% .48% .67% .72% .72% .19% .38% .34% .05% .05%
1.20% .14% .14% .05% .19%
100.00% 100.00% 92.08% 76.92% 66.67%
100.00% 81.82%
100.00% 100.00% 100.00% 100.00% 85.71% 80.00%
100.00% 100.00% 100.00% 92.31%
100.00% 100.00% 83.78% 50.00%
100.00% 75.00%
100.00% 87.50% 75.00% 88.24%
100.00% 66.67% 87.50%
100.00% 100.00% 71.43%
100.00% 100.00% 100.00% 100.00%
8 6 2
4
1 1
1
6 2
2
2 5 2
4 1
10
2.61% 1.96% .65%
1.31%
.33% .33%
.33%
1.96% .65%
.65%
.65% 1.63% .65%
1.31% .33%
3.27%
7.92% 23.08% 33.33%
18.18%
14.29% 20.00%
7.69%
16.22% 50.00%
25.00%
12.50% 25.00% 11.76%
33.33% 12.50%
28.57%
2 1
101 26 6 2
22 7 7 1 1 7 5 1 2 8
13 3 2
37 4 3 8
10 16 20 17 4
12 8 1 1
35 3 3 1 4
.08% .04%
4.22% 1.09% .25% .08% .92% .29% .29% .04% .04% .29% .21% .04% .08% .33% .54% .13% .08%
1.55% .17% .13% .33% .42% .67% .84% .71% .17% .50% .33% .04% .04%
1.46% .13% .13% .04% .17%
87.22% 12.78% 2,088 100% 306 100% 2,394 100% Total Rported
County of Conviction Count Col % Row % Count Col % Row % Total Col % Female Total
Produced for General Distribution
Page05-FEB-15 60
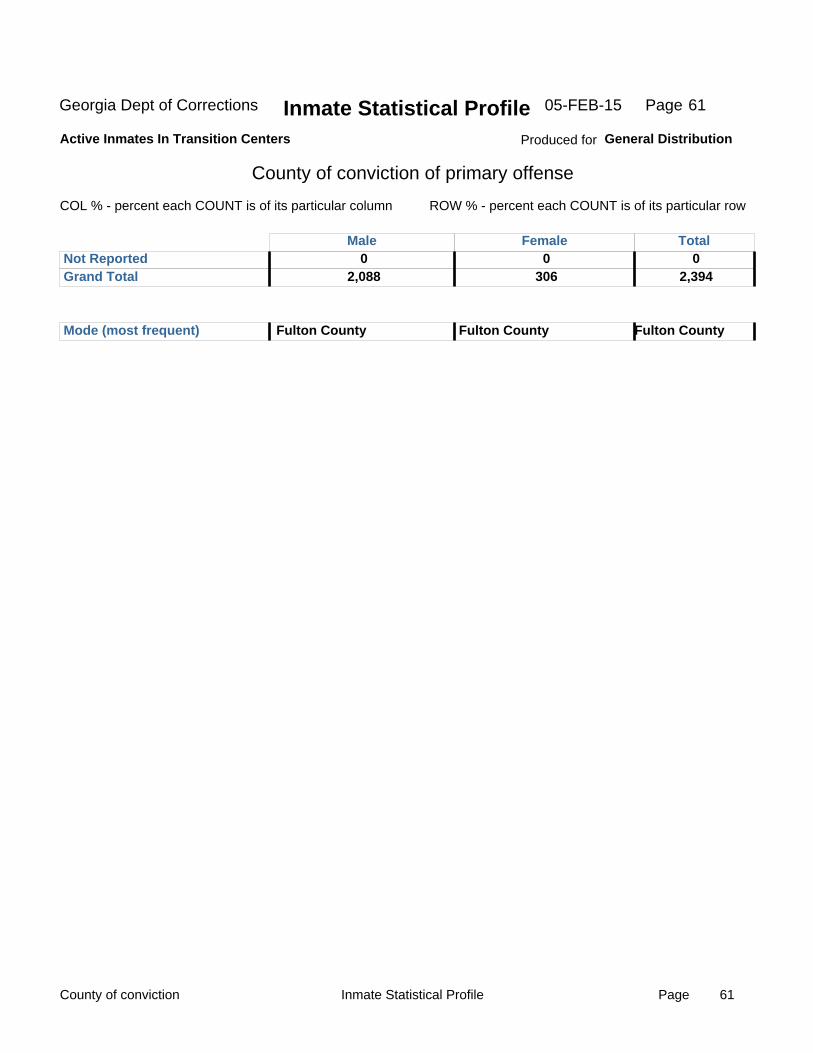
County of conviction Page 61Inmate Statistical Profile
Georgia Dept of Corrections Inmate Statistical ProfileActive Inmates In Transition Centers
County of conviction of primary offense
COL % - percent each COUNT is of its particular column ROW % - percent each COUNT is of its particular row
Male Not Reported Grand Total
0 2,088
0 306
0 2,394
Mode (most frequent) Fulton County Fulton County Fulton County
Female Total
Produced for General Distribution
Page05-FEB-15 61
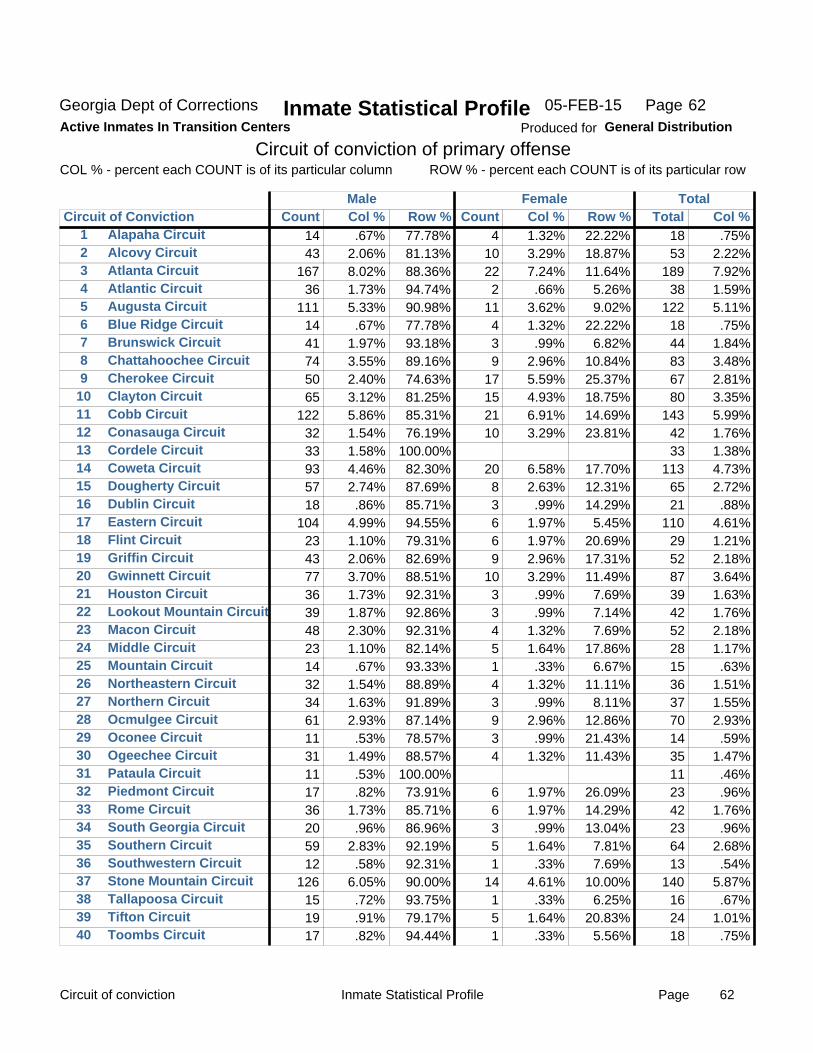
Circuit of conviction Page 62Inmate Statistical Profile
Georgia Dept of Corrections Inmate Statistical ProfileActive Inmates In Transition Centers
Circuit of conviction of primary offenseCOL % - percent each COUNT is of its particular column ROW % - percent each COUNT is of its particular row
Male
123456789
10111213141516171819202122232425262728293031323334353637383940
Alapaha CircuitAlcovy CircuitAtlanta CircuitAtlantic CircuitAugusta CircuitBlue Ridge CircuitBrunswick CircuitChattahoochee CircuitCherokee CircuitClayton CircuitCobb CircuitConasauga CircuitCordele CircuitCoweta CircuitDougherty CircuitDublin CircuitEastern CircuitFlint CircuitGriffin CircuitGwinnett CircuitHouston CircuitLookout Mountain CircuitMacon CircuitMiddle CircuitMountain CircuitNortheastern CircuitNorthern CircuitOcmulgee CircuitOconee CircuitOgeechee CircuitPataula CircuitPiedmont CircuitRome CircuitSouth Georgia CircuitSouthern CircuitSouthwestern CircuitStone Mountain CircuitTallapoosa CircuitTifton CircuitToombs Circuit
14 43
167 36
111 14 41 74 50 65
122 32 33 93 57 18
104 23 43 77 36 39 48 23 14 32 34 61 11 31 11 17 36 20 59 12
126 15 19 17
.67% 2.06% 8.02% 1.73% 5.33% .67%
1.97% 3.55% 2.40% 3.12% 5.86% 1.54% 1.58% 4.46% 2.74% .86%
4.99% 1.10% 2.06% 3.70% 1.73% 1.87% 2.30% 1.10% .67%
1.54% 1.63% 2.93% .53%
1.49% .53% .82%
1.73% .96%
2.83% .58%
6.05% .72% .91% .82%
77.78% 81.13% 88.36% 94.74% 90.98% 77.78% 93.18% 89.16% 74.63% 81.25% 85.31% 76.19%
100.00% 82.30% 87.69% 85.71% 94.55% 79.31% 82.69% 88.51% 92.31% 92.86% 92.31% 82.14% 93.33% 88.89% 91.89% 87.14% 78.57% 88.57%
100.00% 73.91% 85.71% 86.96% 92.19% 92.31% 90.00% 93.75% 79.17% 94.44%
4 10 22 2
11 4 3 9
17 15 21 10
20 8 3 6 6 9
10 3 3 4 5 1 4 3 9 3 4
6 6 3 5 1
14 1 5 1
1.32% 3.29% 7.24% .66%
3.62% 1.32% .99%
2.96% 5.59% 4.93% 6.91% 3.29%
6.58% 2.63% .99%
1.97% 1.97% 2.96% 3.29% .99% .99%
1.32% 1.64% .33%
1.32% .99%
2.96% .99%
1.32%
1.97% 1.97% .99%
1.64% .33%
4.61% .33%
1.64% .33%
22.22% 18.87% 11.64%
5.26% 9.02%
22.22% 6.82%
10.84% 25.37% 18.75% 14.69% 23.81%
17.70% 12.31% 14.29%
5.45% 20.69% 17.31% 11.49%
7.69% 7.14% 7.69%
17.86% 6.67%
11.11% 8.11%
12.86% 21.43% 11.43%
26.09% 14.29% 13.04%
7.81% 7.69%
10.00% 6.25%
20.83% 5.56%
18 53
189 38
122 18 44 83 67 80
143 42 33
113 65 21
110 29 52 87 39 42 52 28 15 36 37 70 14 35 11 23 42 23 64 13
140 16 24 18
.75% 2.22% 7.92% 1.59% 5.11% .75%
1.84% 3.48% 2.81% 3.35% 5.99% 1.76% 1.38% 4.73% 2.72% .88%
4.61% 1.21% 2.18% 3.64% 1.63% 1.76% 2.18% 1.17% .63%
1.51% 1.55% 2.93% .59%
1.47% .46% .96%
1.76% .96%
2.68% .54%
5.87% .67%
1.01% .75%
Circuit of Conviction Count Col % Row % Count Col % Row % Total Col % Female Total
Produced for General Distribution
Page05-FEB-15 62
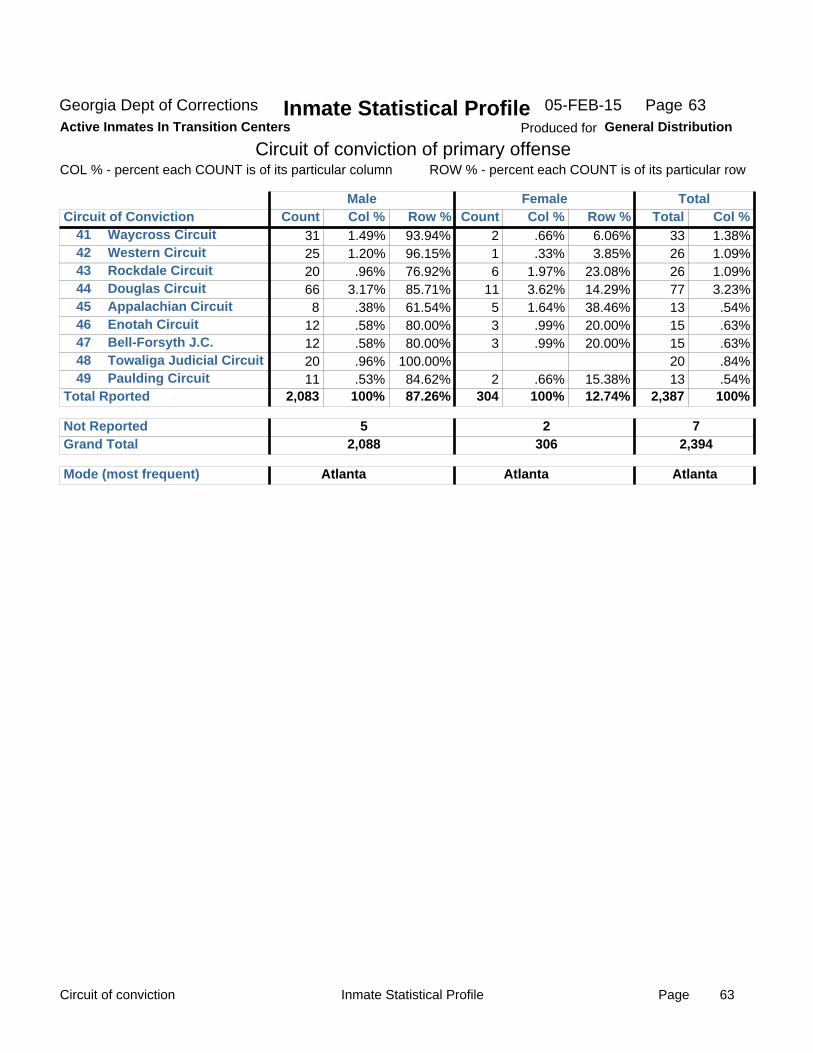
Circuit of conviction Page 63Inmate Statistical Profile
Georgia Dept of Corrections Inmate Statistical ProfileActive Inmates In Transition Centers
Circuit of conviction of primary offenseCOL % - percent each COUNT is of its particular column ROW % - percent each COUNT is of its particular row
Male
414243444546474849
Waycross CircuitWestern CircuitRockdale CircuitDouglas CircuitAppalachian CircuitEnotah CircuitBell-Forsyth J.C.Towaliga Judicial CircuitPaulding Circuit
31 25 20 66 8
12 12 20 11
1.49% 1.20% .96%
3.17% .38% .58% .58% .96% .53%
93.94% 96.15% 76.92% 85.71% 61.54% 80.00% 80.00%
100.00% 84.62%
2 1 6
11 5 3 3
2
.66% .33%
1.97% 3.62% 1.64% .99% .99%
.66%
6.06% 3.85%
23.08% 14.29% 38.46% 20.00% 20.00%
15.38%
33 26 26 77 13 15 15 20 13
1.38% 1.09% 1.09% 3.23% .54% .63% .63% .84% .54%
87.26% 12.74% 2,083 100% 304 100% 2,387 100% Total Rported
Circuit of Conviction Count Col % Row % Count Col % Row % Total Col %
Not Reported Grand Total
5 2,088
2 306
7 2,394
Atlanta Mode (most frequent) Atlanta Atlanta
Female Total
Produced for General Distribution
Page05-FEB-15 63
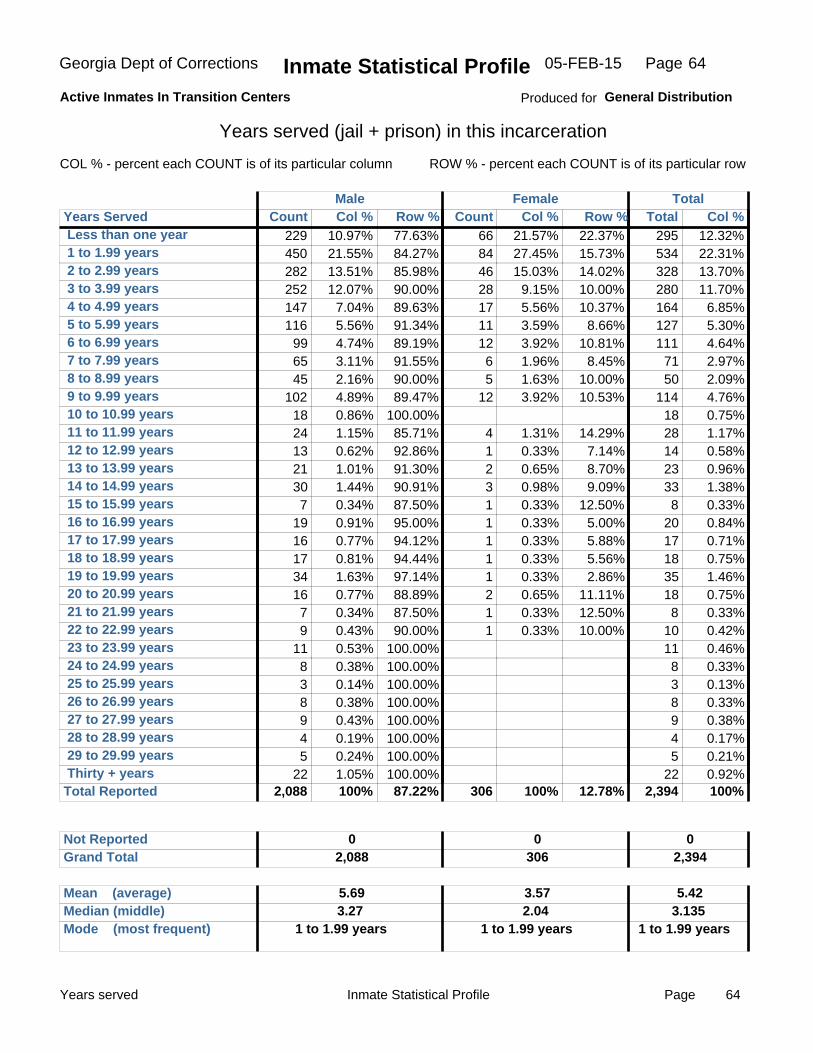
Years served Page 64Inmate Statistical Profile
Georgia Dept of Corrections Inmate Statistical ProfileActive Inmates In Transition Centers
Years served (jail + prison) in this incarceration
COL % - percent each COUNT is of its particular column ROW % - percent each COUNT is of its particular row
Male
Less than one year 1 to 1.99 years 2 to 2.99 years 3 to 3.99 years 4 to 4.99 years 5 to 5.99 years 6 to 6.99 years 7 to 7.99 years 8 to 8.99 years 9 to 9.99 years 10 to 10.99 years 11 to 11.99 years 12 to 12.99 years 13 to 13.99 years 14 to 14.99 years 15 to 15.99 years 16 to 16.99 years 17 to 17.99 years 18 to 18.99 years 19 to 19.99 years 20 to 20.99 years 21 to 21.99 years 22 to 22.99 years 23 to 23.99 years 24 to 24.99 years 25 to 25.99 years 26 to 26.99 years 27 to 27.99 years 28 to 28.99 years 29 to 29.99 years Thirty + years
229 450 282 252 147 116
99 65 45
102 18 24 13 21 30 7
19 16 17 34 16 7 9
11 8 3 8 9 4 5
22
10.97% 21.55% 13.51% 12.07%
7.04% 5.56% 4.74% 3.11% 2.16% 4.89% 0.86% 1.15% 0.62% 1.01% 1.44% 0.34% 0.91% 0.77% 0.81% 1.63% 0.77% 0.34% 0.43% 0.53% 0.38% 0.14% 0.38% 0.43% 0.19% 0.24% 1.05%
77.63% 84.27% 85.98% 90.00% 89.63% 91.34% 89.19% 91.55% 90.00% 89.47%
100.00% 85.71% 92.86% 91.30% 90.91% 87.50% 95.00% 94.12% 94.44% 97.14% 88.89% 87.50% 90.00%
100.00% 100.00% 100.00% 100.00% 100.00% 100.00% 100.00% 100.00%
66 84 46 28 17 11 12 6 5
12
4 1 2 3 1 1 1 1 1 2 1 1
21.57% 27.45% 15.03%
9.15% 5.56% 3.59% 3.92% 1.96% 1.63% 3.92%
1.31% 0.33% 0.65% 0.98% 0.33% 0.33% 0.33% 0.33% 0.33% 0.65% 0.33% 0.33%
22.37% 15.73% 14.02% 10.00% 10.37%
8.66% 10.81%
8.45% 10.00% 10.53%
14.29% 7.14% 8.70% 9.09%
12.50% 5.00% 5.88% 5.56% 2.86%
11.11% 12.50% 10.00%
295 534 328 280 164 127 111
71 50
114 18 28 14 23 33 8
20 17 18 35 18 8
10 11 8 3 8 9 4 5
22
12.32% 22.31% 13.70% 11.70%
6.85% 5.30% 4.64% 2.97% 2.09% 4.76% 0.75% 1.17% 0.58% 0.96% 1.38% 0.33% 0.84% 0.71% 0.75% 1.46% 0.75% 0.33% 0.42% 0.46% 0.33% 0.13% 0.33% 0.38% 0.17% 0.21% 0.92%
87.22% 12.78% 2,088 100% 306 100% 2,394 100% Total Reported
Years Served Count Col % Row % Count Col % Row % Total Col %
Not Reported Grand Total
0 2,088
0 306
0 2,394
Mean (average) 5.693.27 Median (middle)
Mode (most frequent) 1 to 1.99 years 2.04
1 to 1.99 years 3.135
1 to 1.99 years
3.57 5.42
Female Total
Produced for General Distribution
Page05-FEB-15 64

HIV test results Page 65Inmate Statistical Profile
Georgia Dept of Corrections Inmate Statistical ProfileActive Inmates In Transition Centers
Results of most recent HIV tests
COL % - percent each COUNT is of its particular column ROW % - percent each COUNT is of its particular row
Male
Positive Negative
17 1,993
0.85% 99.15%
94.44% 87.11%
1 295
0.34% 99.66%
5.56% 12.89%
18 2,288
0.78% 99.22%
87.16% 12.84% 2,010 100% 296 100% 2,306 100% Total Reported
HIV Test Results Count Col % Row % Count Col % Row % Total Col %
Not Reported Grand Total
78 2,088
10 306
88 2,394
Female Total
Produced for General Distribution
Page05-FEB-15 65

Tuberculosis test results Page 66Inmate Statistical Profile
Georgia Dept of Corrections Inmate Statistical ProfileActive Inmates In Transition Centers
Results of most recent tuberculosis test
COL % - percent each COUNT is of its particular column ROW % - percent each COUNT is of its particular row
Male
Positive on current test Positive on previous test Negative
321 1
1,713
15.77% 0.05%
84.18%
94.97% 100.00% 85.78%
17
284
5.65%
94.35%
5.03%
14.22%
338 1
1,997
14.47% 0.04%
85.49% 87.11% 12.89% 2,035 100% 301 100% 2,336 100% Total Reported
Tuberculosis Test Results Count Col % Row % Count Col % Row % Total Col %
Not Reported Grand Total
53 2,088
5 306
58 2,394
Female Total
Produced for General Distribution
Page05-FEB-15 66
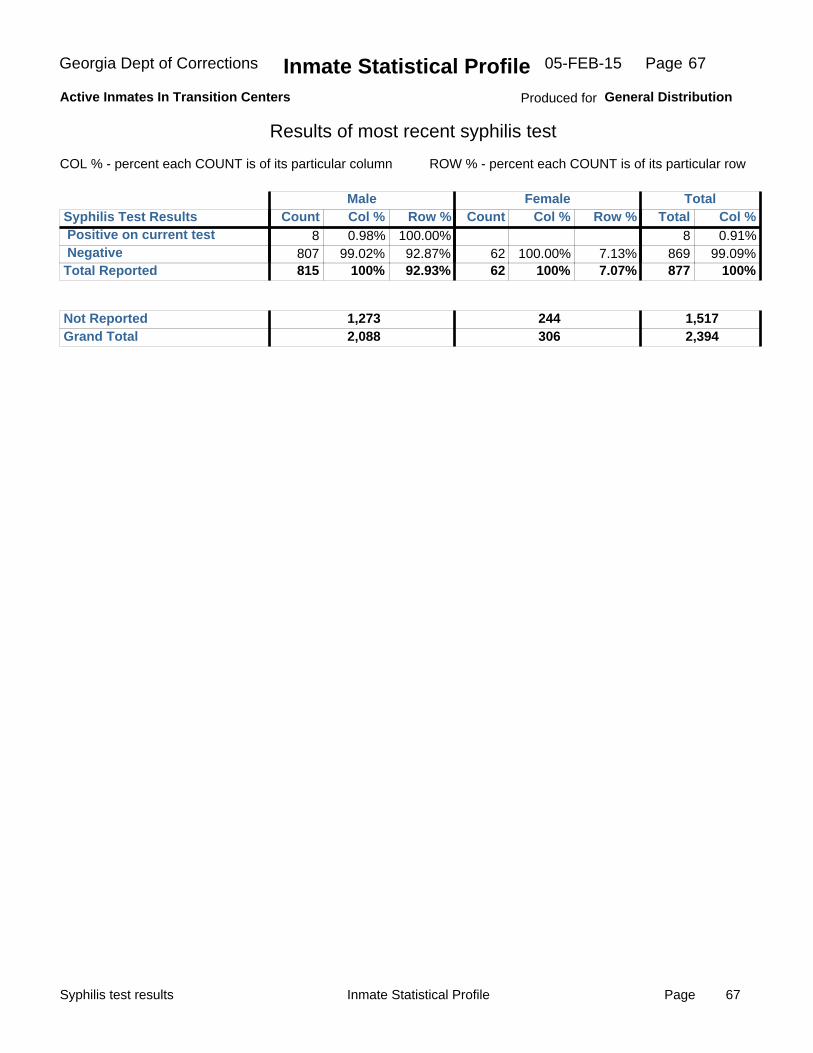
Syphilis test results Page 67Inmate Statistical Profile
Georgia Dept of Corrections Inmate Statistical ProfileActive Inmates In Transition Centers
Results of most recent syphilis test
COL % - percent each COUNT is of its particular column ROW % - percent each COUNT is of its particular row
Male
Positive on current test Negative
8 807
0.98% 99.02%
100.00% 92.87%
62 100.00% 7.13%
8 869
0.91% 99.09%
92.93% 7.07% 815 100% 62 100% 877 100% Total Reported
Syphilis Test Results Count Col % Row % Count Col % Row % Total Col %
Not Reported Grand Total
1,273 2,088
244 306
1,517 2,394
Female Total
Produced for General Distribution
Page05-FEB-15 67

Hepatitis-C test results Page 68Inmate Statistical Profile
Georgia Dept of Corrections Inmate Statistical ProfileActive Inmates In Transition Centers
Results of most recent Hepatitis-C test
COL % - percent each COUNT is of its particular column ROW % - percent each COUNT is of its particular row
Male
Positive on current test Negative
19 28
40.43% 59.57%
82.61% 93.33%
4 2
66.67% 33.33%
17.39% 6.67%
23 30
43.40% 56.60%
88.68% 11.32% 47 100% 6 100% 53 100% Total Reported
Hepatitis-C Test Results Count Col % Row % Count Col % Row % Total Col %
Not Reported Grand Total
2,041 2,088
300 306
2,341 2,394
Female Total
Produced for General Distribution
Page05-FEB-15 68